capita - treasury's microsimulation model of personal ... · web viewthe policy calculator...
TRANSCRIPT
CAPITA - TREASURY’S MICROSIMULATION MODEL OF PERSONAL INCOME TAX AND
TRANSFERS
Martin Stevenson, Daniel Ledda, Virginia Pineda, Matthew Smith
and Susie Kluth1
Treasury Working Paper2,3
2017-05
Date created: September 2017
Date modified: September 2017
1 Tax Analysis Division, Revenue Group, The Treasury, Langton Crescent, Parkes ACT 2600, Australia. Correspondence: [email protected].
2 The views expressed in this paper are those of the authors and do not necessarily reflect those of The Australian Treasury or the Australian Government. We thank Matthew Brine, Gillian Beer, Kirsten Embery, Nick Loan, Keldon Pattugalan, Amanda Hosking and Richard Maher for their feedback on a draft of this paper. We also thank all those involved in the development of the CAPITA model including our funding partners the Department of Social Services and the Department of Employment. We are also grateful to the Australian Bureau of Statistics and the Parliamentary Budget Office for their contributions through the CAPITA Technical Advisory Group.
3 While the Australian Treasury is releasing the CAPITA model, it does not take responsibility for any results generated by users of the model.
© Commonwealth of Australia 2017
ISBN 978-1-925504-66-8
This publication is available for your use under a Creative Commons BY Attribution 3.0 Australia licence, with the exception of the Commonwealth Coat of Arms, the Treasury logo, photographs, images, signatures and where otherwise stated. The full licence terms are available from http://creativecommons.org/licenses/by/3.0/au/legalcode.
Use of Treasury material under a Creative Commons BY Attribution 3.0 Australia licence requires you to attribute the work (but not in any way that suggests that the Treasury endorses you or your use of the work).
Treasury material used 'as supplied'
Provided you have not modified or transformed Treasury material in any way including, for example, by changing the Treasury text; calculating percentage changes; graphing or charting data; or deriving new statistics from published Treasury statistics — then Treasury prefers the following attribution:
Source: The Australian Government the Treasury
Derivative material
If you have modified or transformed Treasury material, or derived new material from those of the Treasury in any way, then Treasury prefers the following attribution:
Based on The Australian Government the Treasury data
Use of the Coat of Arms
The terms under which the Coat of Arms can be used are set out on the It’s an Honour website (see www.itsanhonour.gov.au).
Other uses
Enquiries regarding this licence and any other use of this document are welcome at:
ManagerMedia UnitThe TreasuryLangton CrescentParkes ACT 2600Email: [email protected]

CAPITA - Treasury’s microsimulation model of Personal Income Tax and TransfersMartin Stevenson, Daniel Ledda, Virginia Pineda, Matthew Smith and Susie Kluth2017-0515 September 2017
ABSTRACTDistributional analysis captures the wide range of policy outcomes and the diverse effects of policy changes across the population. Static microsimulation models are a commonly used tool for producing distributional analysis. Treasury has developed the CAPITA (Comparative Analysis of Personal Income Tax and Transfers in Australia) model, a general-purpose, static microsimulation model, which is used to analyse the combined effect of changes to personal income tax and transfer policy on families with different income levels, family structures and living arrangements. Treasury is releasing this model to the public to encourage rigorous, evidence-based contributions to public policy analysis in Australia. Treasury encourages users of the model to contribute and share their improvements to continue to develop and improve the model into the future.
Keywords: CAPITA, static microsimulation, tax-transfer, distributional analysis
1.INTRODUCTIONMicrosimulation models are a key tool used by government to analyse the effect of major policy reforms on households. They carry out calculations on a collection of individual records and can aggregate the outcomes at the individual level to shed light on policy impacts for particular groups, or the whole population. They are especially useful for analysing the effects of policy where policies interact with each other and a diverse range of outcomes are experienced by individuals in differing circumstances.
As part of its suite of models, Treasury has used static microsimulation models for over 20 years to analyse the immediate distributional effects of changes to tax and transfer4 policy. Previously, Treasury used STINMOD (Static Incomes Model) (NATSEM, 2017), a tax-transfer microsimulation model developed by the National Centre for Social and Economic Modelling. In 2012, as part of a review of the Commonwealth’s arrangements for tax-transfer microsimulation modelling, a decision was taken to replace the capability of STINMOD with a new model, CAPITA (Comparative Analysis of Personal Income Tax and Transfers in Australia). The first stage of CAPITA’s development was completed in early 2015 and the model is now available to Treasury and a number of partner agencies to inform policy development and evaluation.
CAPITA is a general-purpose static microsimulation model of Australia’s personal income tax and transfer system designed to analyse the distributional impacts of policy across the Australian population and highlight interactions between the tax and transfer systems. It consists of a representative sample of the population and a set of rules for calculating the taxes and transfers applicable to each individual. These rules can be varied to examine the effects of changes to personal income tax and transfer policies on individuals, families and groups within the population.
Treasury is making CAPITA available to the public for general use to encourage an evidence-based approach to public policy development in Australia. Model users are invited and encouraged to share any improvements or suggestions to continue to improve and develop CAPITA into the future. Further detail on the CAPITA model can be found in the documentation released alongside the source code. Importantly, users should note the Australian Treasury does not take responsibility for any results generated by the model.
4 Throughout this paper, ‘transfer payments’ refers to social welfare payments. These include income support and family payments described in further detail later.
1

CAPITA - Treasury's microsimulation model of Personal Income Tax and Transfers
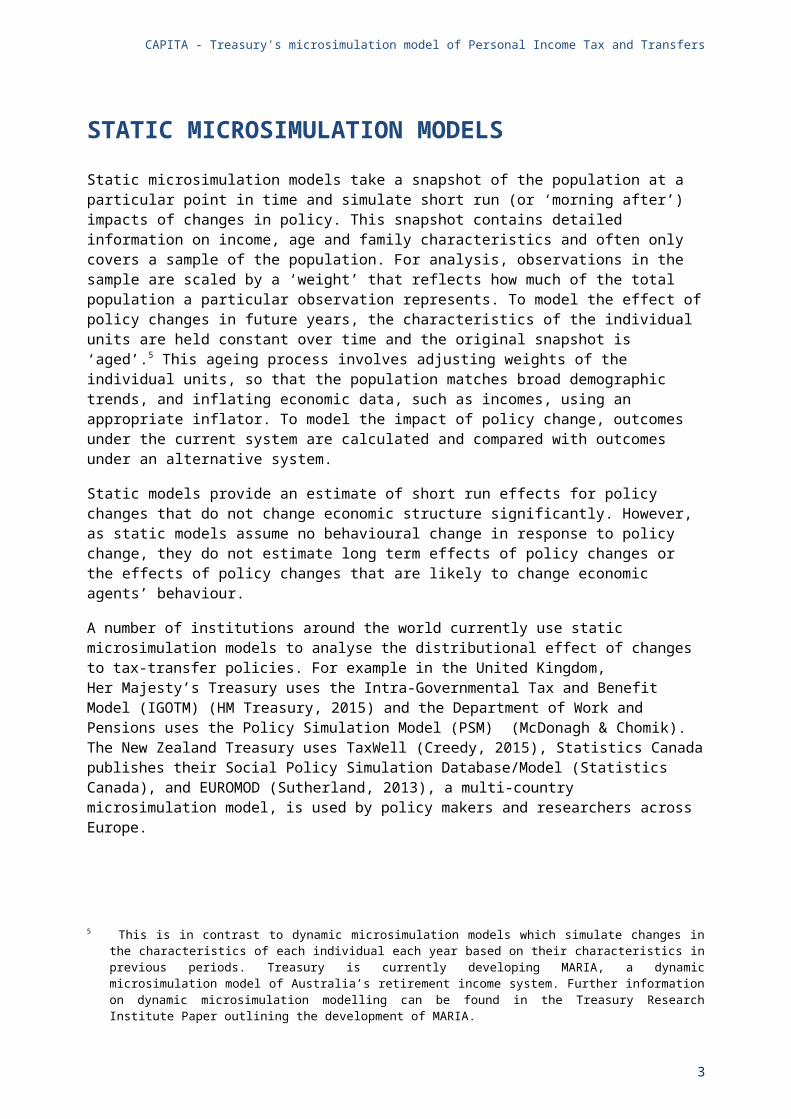
2.STATIC MICROSIMULATION MODELSStatic microsimulation models take a snapshot of the population at a particular point in time and simulate short run (or ‘morning after’) impacts of changes in policy. This snapshot contains detailed information on income, age and family characteristics and often only covers a sample of the population. For analysis, observations in the sample are scaled by a ‘weight’ that reflects how much of the total population a particular observation represents. To model the effect of policy changes in future years, the characteristics of the individual units are held constant over time and the original snapshot is ‘aged’.5 This ageing process involves adjusting weights of the individual units, so that the population matches broad demographic trends, and inflating economic data, such as incomes, using an appropriate inflator. To model the impact of policy change, outcomes under the current system are calculated and compared with outcomes under an alternative system.
Static models provide an estimate of short run effects for policy changes that do not change economic structure significantly. However, as static models assume no behavioural change in response to policy change, they do not estimate long term effects of policy changes or the effects of policy changes that are likely to change economic agents’ behaviour.
A number of institutions around the world currently use static microsimulation models to analyse the distributional effect of changes to tax-transfer policies. For example in the United Kingdom, Her Majesty’s Treasury uses the Intra-Governmental Tax and Benefit Model (IGOTM) (HM Treasury, 2015) and the Department of Work and Pensions uses the Policy Simulation Model (PSM) (McDonagh & Chomik). The New Zealand Treasury uses TaxWell (Creedy, 2015), Statistics Canada publishes their Social Policy Simulation Database/Model (Statistics Canada), and EUROMOD (Sutherland, 2013), a multi-country microsimulation model, is used by policy makers and researchers across Europe.
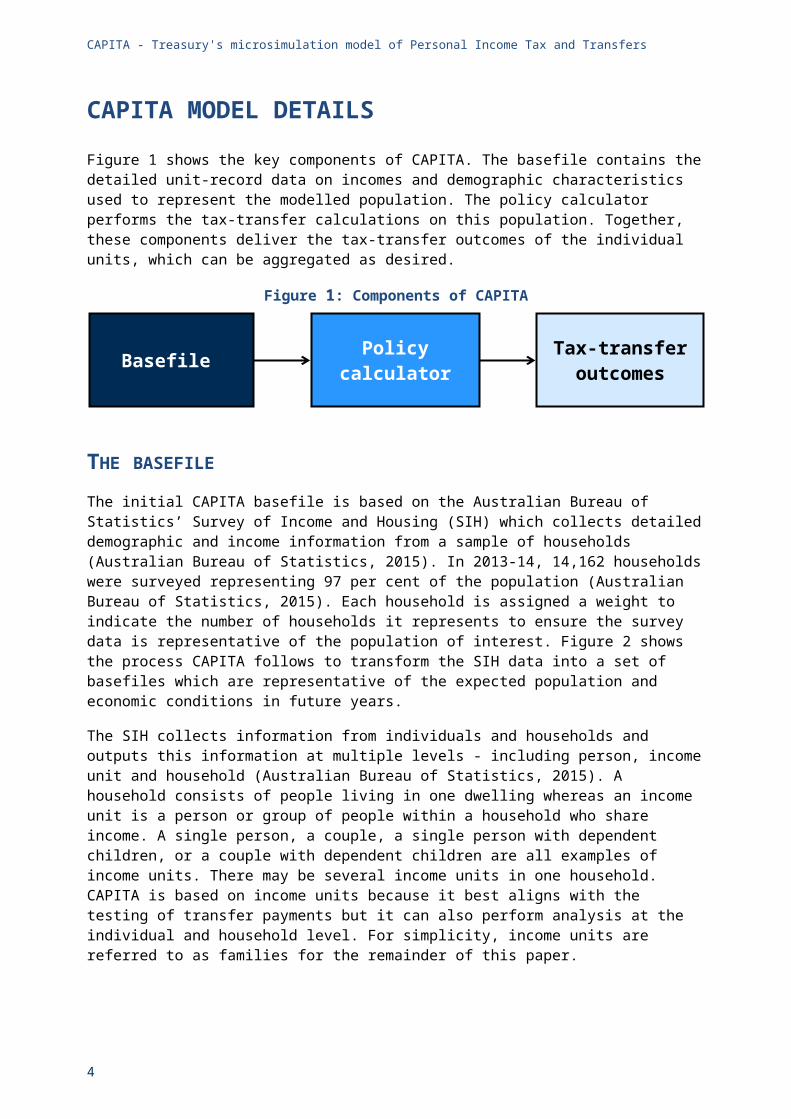
3.CAPITA MODEL DETAILSFigure 1 shows the key components of CAPITA. The basefile contains the detailed unit-record data on incomes and demographic characteristics used to represent the modelled population. The policy calculator performs the tax-transfer calculations on this population. Together, these components deliver the tax-transfer outcomes of the individual units, which can be aggregated as desired.
Figure 1: Components of CAPITA
5 This is in contrast to dynamic microsimulation models which simulate changes in the characteristics of each individual each year based on their characteristics in previous periods. Treasury is currently developing MARIA, a dynamic microsimulation model of Australia’s retirement income system. Further information on dynamic microsimulation modelling can be found in the Treasury Research Institute Paper outlining the development of MARIA.
2
Basefile Policy calculator Tax-transfer outcomes

CAPITA - Treasury's microsimulation model of Personal Income Tax and Transfers
THE BASEFILE
The initial CAPITA basefile is based on the Australian Bureau of Statistics’ Survey of Income and Housing (SIH) which collects detailed demographic and income information from a sample of households (Australian Bureau of Statistics, 2015). In 2013-14, 14,162 households were surveyed representing 97 per cent of the population (Australian Bureau of Statistics, 2015). Each household is assigned a weight to indicate the number of households it represents to ensure the survey data is representative of the population of interest. Figure 2 shows the process CAPITA follows to transform the SIH data into a set of basefiles which are representative of the expected population and economic conditions in future years.
The SIH collects information from individuals and households and outputs this information at multiple levels - including person, income unit and household (Australian Bureau of Statistics, 2015). A household consists of people living in one dwelling whereas an income unit is a person or group of people within a household who share income. A single person, a couple, a single person with dependent children, or a couple with dependent children are all examples of income units. There may be several income units in one household. CAPITA is based on income units because it best aligns with the testing of transfer payments but it can also perform analysis at the individual and household level. For simplicity, income units are referred to as families for the remainder of this paper.
Figure 2: CAPITA basefiles – from the SIH to the basefiles
3
Reweight
CAPITA basefiles(2013-14 to 2020-21)
ABS Survey of Income and Housing 2013-14
Uprate
Impute
Benchmark each year to population projections and transfer payment customer numbers
Apply macroeconomic parameters (CPI, wages) to uprate and create dataset for each year out to the end of the forward estimates
Fill in gaps in the SIH. Estimate additional information required to calculate tax and transfer outcomes
CAPITA - Treasury's microsimulation model of Personal Income Tax and Transfers
Not all the information required for calculating tax-transfer outcomes is captured by the SIH and some groups are not covered by the survey, so a combination of other data sources and statistical techniques is used to supplement the survey data. For instance, the SIH does not collect information on residents of non-private dwellings, which includes those living in nursing homes. This population is important for properly assessing the receipt of the aged pension so additional records from the 2011 Census are used to supplement the CAPITA base data. In addition, tax deductions are not reported on the SIH so these are estimated for the individuals in CAPITA from tax data.
PROJECTING THE SURVEY DATA
There is a lag between the collection of the survey data and its availability for use in CAPITA. Also modelling in future years is often required so the data is adjusted to capture demographic and economic trends.
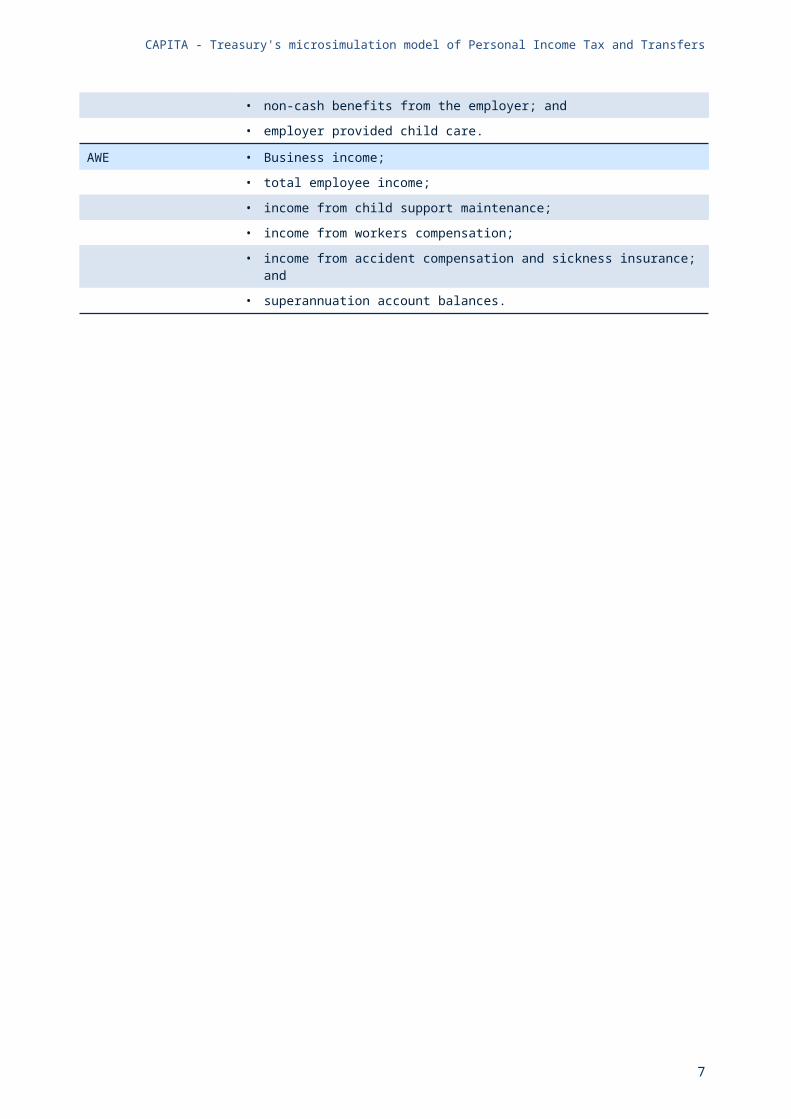
Changes in economic conditions are accounted for by inflating (or uprating) the income and expenditure data on the initial basefile using either the Consumer Price Index (CPI) or Average Weekly Earnings (AWE). The indexation factors (see Table 1) were selected based on the nature of the data item, observed historical growth and discussions with the Australian Bureau of Statistics.
Table 1: Indexation of data in CAPITAINDEXATION FACTOR DATA
CPI Income from:
• dividends and employer provided shares;
• superannuation;
• trusts;
• interest from a financial institution;
• family members not living in the household;
• public unit trusts;
• residential and non-residential property;
• overseas pensions;
• other financial investments;
• bond investments;
• royalties;
• other regular sources;
• interest on loans;
• non-cash benefits from the employer; and
• employer provided child care.
AWE • Business income;
• total employee income;
• income from child support maintenance;
• income from workers compensation;
• income from accident compensation and sickness insurance; and
• superannuation account balances.
4
CAPITA - Treasury's microsimulation model of Personal Income Tax and Transfers
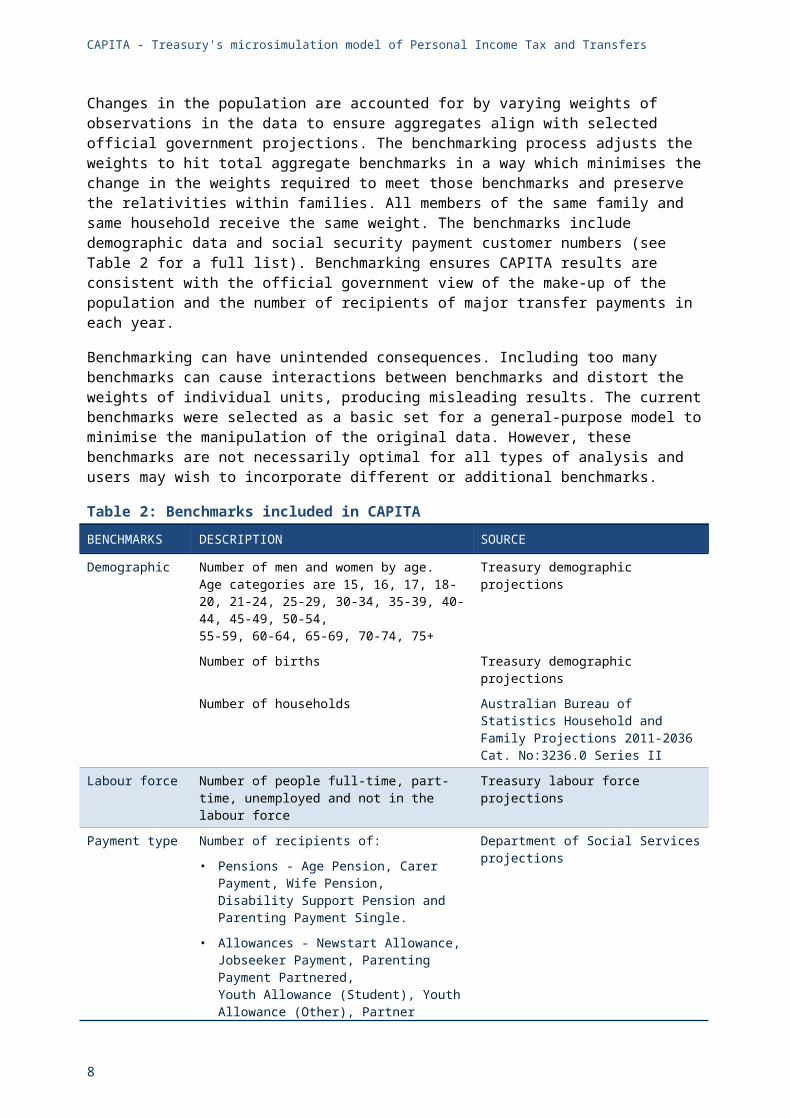
Changes in the population are accounted for by varying weights of observations in the data to ensure aggregates align with selected official government projections. The benchmarking process adjusts the weights to hit total aggregate benchmarks in a way which minimises the change in the weights required to meet those benchmarks and preserve the relativities within families. All members of the same family and same household receive the same weight. The benchmarks include demographic data and social security payment customer numbers (see Table 2 for a full list). Benchmarking ensures CAPITA results are consistent with the official government view of the make-up of the population and the number of recipients of major transfer payments in each year.
Benchmarking can have unintended consequences. Including too many benchmarks can cause interactions between benchmarks and distort the weights of individual units, producing misleading results. The current benchmarks were selected as a basic set for a general-purpose model to minimise the manipulation of the original data. However, these benchmarks are not necessarily optimal for all types of analysis and users may wish to incorporate different or additional benchmarks.
Table 2: Benchmarks included in CAPITABENCHMARKS DESCRIPTION SOURCE
Demographic Number of men and women by age.Age categories are 15, 16, 17, 18-20, 21-24, 25-29, 30-34, 35-39, 40-44, 45-49, 50-54,55-59, 60-64, 65-69, 70-74, 75+
Treasury demographic projections
Number of births Treasury demographic projections
Number of households Australian Bureau of Statistics Household and Family Projections 2011-2036 Cat. No:3236.0 Series II
Labour force Number of people full-time, part-time, unemployed and not in the labour force
Treasury labour force projections
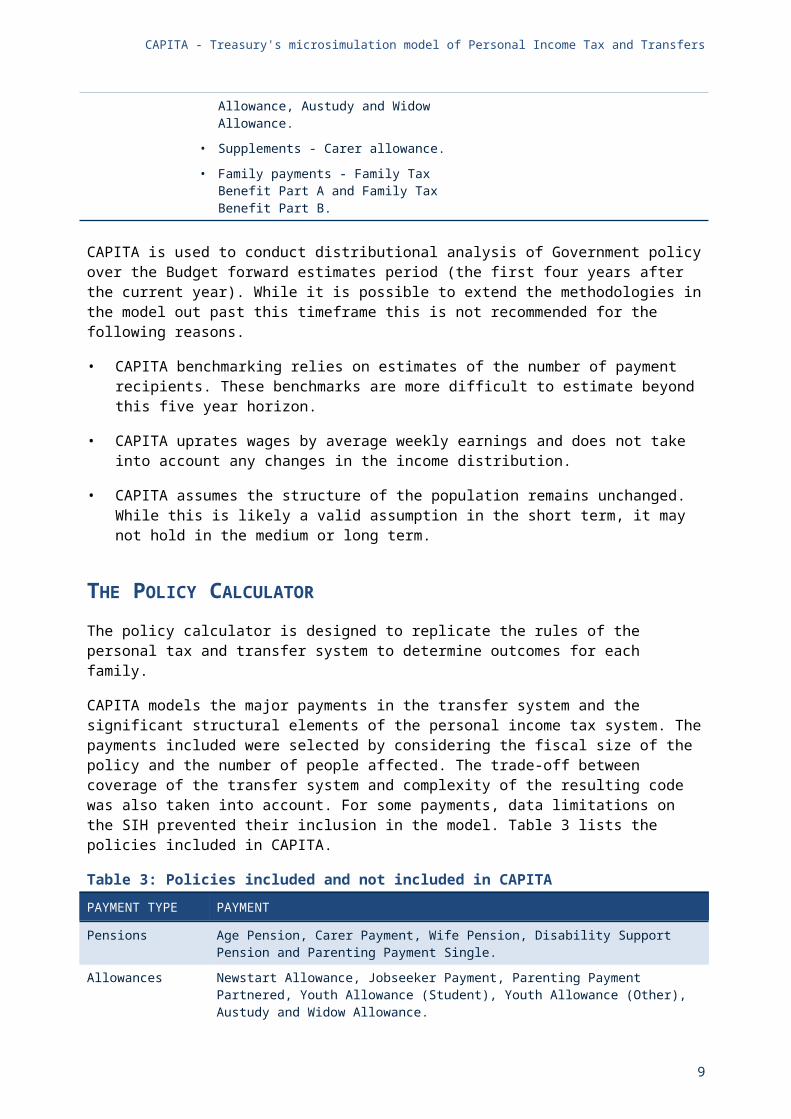
Payment type Number of recipients of:
• Pensions - Age Pension, Carer Payment, Wife Pension, Disability Support Pension and Parenting Payment Single.
• Allowances - Newstart Allowance, Jobseeker Payment, Parenting Payment Partnered, Youth Allowance (Student), Youth Allowance (Other), Partner Allowance, Austudy and Widow Allowance.
• Supplements - Carer allowance.
• Family payments - Family Tax Benefit Part A and Family Tax Benefit Part B.
Department of Social Services projections
CAPITA is used to conduct distributional analysis of Government policy over the Budget forward estimates period (the first four years after the current year). While it is possible to extend the methodologies in the model out past this timeframe this is not recommended for the following reasons.
• CAPITA benchmarking relies on estimates of the number of payment recipients. These benchmarks are more difficult to estimate beyond this five year horizon.
• CAPITA uprates wages by average weekly earnings and does not take into account any changes in the income distribution.
• CAPITA assumes the structure of the population remains unchanged. While this is likely a valid assumption in the short term, it may not hold in the medium or long term.
5

CAPITA - Treasury's microsimulation model of Personal Income Tax and Transfers
THE POLICY CALCULATOR
The policy calculator is designed to replicate the rules of the personal tax and transfer system to determine outcomes for each family.
CAPITA models the major payments in the transfer system and the significant structural elements of the personal income tax system. The payments included were selected by considering the fiscal size of the policy and the number of people affected. The trade-off between coverage of the transfer system and complexity of the resulting code was also taken into account. For some payments, data limitations on the SIH prevented their inclusion in the model. Table 3 lists the policies included in CAPITA.
Table 3: Policies included and not included in CAPITAPAYMENT TYPE PAYMENT
Pensions Age Pension, Carer Payment, Wife Pension, Disability Support Pension and Parenting Payment Single.
Allowances Newstart Allowance, Jobseeker Payment, Parenting Payment Partnered, Youth Allowance (Student), Youth Allowance (Other), Austudy and Widow Allowance.
Supplements Carer Allowance, Carer Supplement, Single Income Family Supplement(before 1 July 2017), Commonwealth Seniors Health Card, Seniors Supplement (before 30 June 2015), Pensioner Education Supplement, Telephone Allowance and Utilities Allowance.
Family Payments Family Tax Benefit Part A, Family Tax Benefit Part B and Newborn Supplement.
Veteran’s Payments Service Pension.
Other Payments Pharmaceutical Allowance, Rent Assistance and Energy Supplement. These payments form part of pensions, allowances or family payments.
Personal Tax System
Gross tax rates and thresholds, Medicare Levy and Medicare Levy Surcharge, Beneficiary Tax Offset, Low Income Tax Offset, Senior and Pensioners Tax Offset, Dependent (Invalid and Carer) Tax Offset and other levies as applicable including the Temporary Budget Repair Levy.
Minor payments indexed by economic parameters*
Special Benefit, Sickness Allowance, Partner Allowance, Abstudy, Department of Veterans Affairs (DVA) Disability Pension, DVA War Widow Pension, Parental Leave Pay and Dad and Partner Pay.
Policies not modelled in CAPITA
A number of policies including:
• Child Care Subsidy (included in the cameo model only), Child Disability Assistance Payment, concession cards (excluding the Commonwealth Seniors Health Card), Crisis Payment, the Double Orphan Pension, the Essential Medical Equipment Payment, Mobility Allowance, Defence Force Income Supplement Allowance, the Zone Tax Offset and the Higher Education Loan Program.
* These payments are not explicitly modelled in CAPITA but are included in the model by simply uprating the payment value in future years to ensure the amount is still representative. Because these payments are not explicitly modelled, CAPITA is not able to produce detailed analysis of changes which would result from altering these payments.
The child care system is modelled in the cameo version of CAPITA, but not in the distributional model due to data limitations. CAPITA does not currently model Higher Education Loan Program (HECS-HELP) repayments as there is insufficient information on the SIH.
6

CAPITA - Treasury's microsimulation model of Personal Income Tax and Transfers
CAMEO ANALYSIS
To complement the distributional analysis, CAPITA can also conduct ‘cameo’ analysis by calculating the tax-transfer outcomes for a hypothetical family as a function of their income. This is used to provide examples of the impact of policy and policy changes. The basefile for cameos is a synthetic dataset of user-specified family attributes and income levels. The tax-transfer calculator generates the outcomes for each hypothetical family.
CAPITA can also calculate Effective Marginal Tax Rates (EMTRs) for hypothetical individuals and families. EMTRs refer to the proportion of each additional dollar earned that is removed due to either personal income tax paid or the withdrawal of transfer payments. EMTRs are useful from a policy perspective in terms of assessing potential financial incentives arising from the design and structure of the tax and transfer system, which (among other things) can be a factor that people consider when deciding when and how much they wish to work. A number of examples of cameo analysis are included later in this paper to highlight the range of complex interactions different family structures have with the tax-transfer system.
4.ASSUMPTIONS AND LIMITATIONSCAPITA is part of a suite of models that Treasury uses for analysing the impacts of policy changes. All models are based on simplifying assumptions to allow model tractability and therefore have a number of limitations. It is important to be aware of the assumptions and recognise the limitations of any model and take them into account when interpreting results.
CAPITA is a partial equilibrium model that does not include any behavioural response to policy change. CAPITA therefore models the legal incidence of the tax-transfer system (and not the economic incidence) and cannot analyse the long-run, lifetime effects of changes to tax-transfer policy. The model results are most useful for considering the immediate ‘morning after’ impacts of a policy; when the behavioural responses to policy change are expected to be small, or as a starting point for applying behavioural assumptions.
CAPITA assumes the (modified) SIH is an accurate representation of the Australian population. Care needs to be taken when considering groups inadequately covered in the survey such as those living in remote locations or very high income earners. The SIH also provides limited information on certain aspects of the tax and transfer system, such as tax deductions. Information on tax deductions is imputed in CAPITA to give reasonable values for a typical individual, but in practice some individuals will have very large deductions and these types of arrangements are not captured in the model.
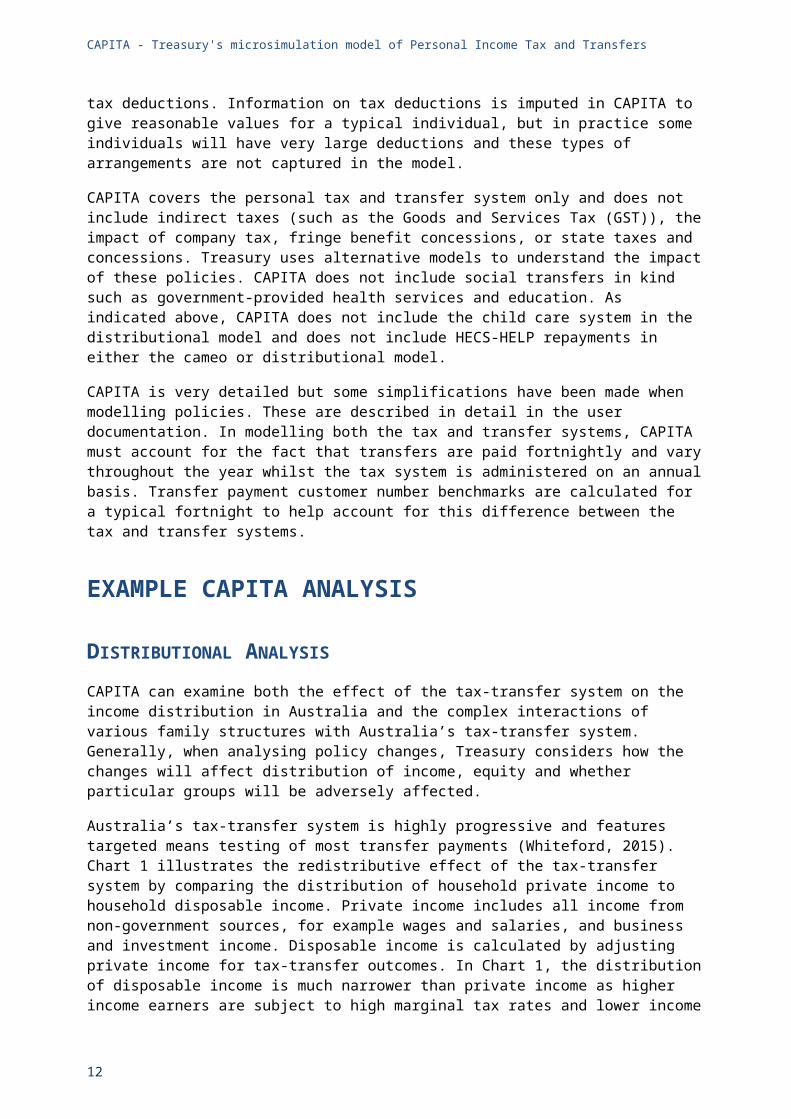
CAPITA covers the personal tax and transfer system only and does not include indirect taxes (such as the Goods and Services Tax (GST)), the impact of company tax, fringe benefit concessions, or state taxes and concessions. Treasury uses alternative models to understand the impact of these policies. CAPITA does not include social transfers in kind such as government-provided health services and education. As indicated above, CAPITA does not include the child care system in the distributional model and does not include HECS-HELP repayments in either the cameo or distributional model.
CAPITA is very detailed but some simplifications have been made when modelling policies. These are described in detail in the user documentation. In modelling both the tax and transfer systems, CAPITA must account for the fact that transfers are paid fortnightly and vary throughout the year whilst the tax system is administered on an annual basis. Transfer payment customer number benchmarks are
7
CAPITA - Treasury's microsimulation model of Personal Income Tax and Transfers
calculated for a typical fortnight to help account for this difference between the tax and transfer systems.
5.EXAMPLE CAPITA ANALYSIS
DISTRIBUTIONAL ANALYSIS
CAPITA can examine both the effect of the tax-transfer system on the income distribution in Australia and the complex interactions of various family structures with Australia’s tax-transfer system. Generally, when analysing policy changes, Treasury considers how the changes will affect distribution of income, equity and whether particular groups will be adversely affected.
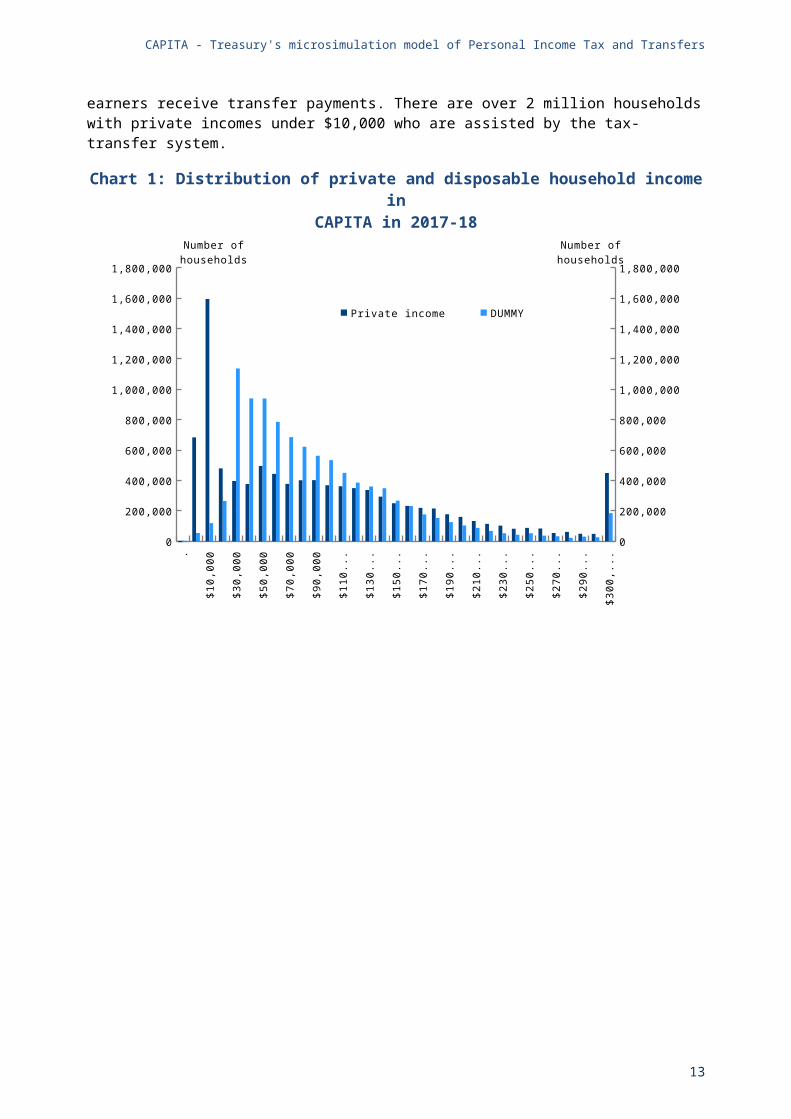
Australia’s tax-transfer system is highly progressive and features targeted means testing of most transfer payments (Whiteford, 2015). Chart 1 illustrates the redistributive effect of the tax-transfer system by comparing the distribution of household private income to household disposable income. Private income includes all income from non-government sources, for example wages and salaries, and business and investment income. Disposable income is calculated by adjusting private income for tax-transfer outcomes. In Chart 1, the distribution of disposable income is much narrower than private income as higher income earners are subject to high marginal tax rates and lower income earners receive transfer payments. There are over 2 million households with private incomes under $10,000 who are assisted by the tax-transfer system.
Chart 1: Distribution of private and disposable household income inCAPITA in 2017-18
. 0$1
0,00
0$2
0,00
0$3
0,00
0$4
0,00
0$5
0,00
0$6
0,00
0$7
0,00
0$8
0,00
0$9
0,00
0$1
00,0
00$1
10,0
00$1
20,0
00$1
30,0
00$1
40,0
00$1
50,0
00$1
60,0
00$1
70,0
00$1
80,0
00$1
90,0
00$2
00,0
00$2
10,0
00$2
20,0
00$2
30,0
00$2
40,0
00$2
50,0
00$2
60,0
00$2
70,0
00$2
80,0
00$2
90,0
00$3
00,0
00$3
00,0
00+
0
200,000
400,000
600,000
800,000
1,000,000
1,200,000
1,400,000
1,600,000
1,800,000
0
200,000
400,000
600,000
800,000
1,000,000
1,200,000
1,400,000
1,600,000
1,800,000
Private income Disposable Income
Number of households Number of households
8
CAPITA - Treasury's microsimulation model of Personal Income Tax and Transfers
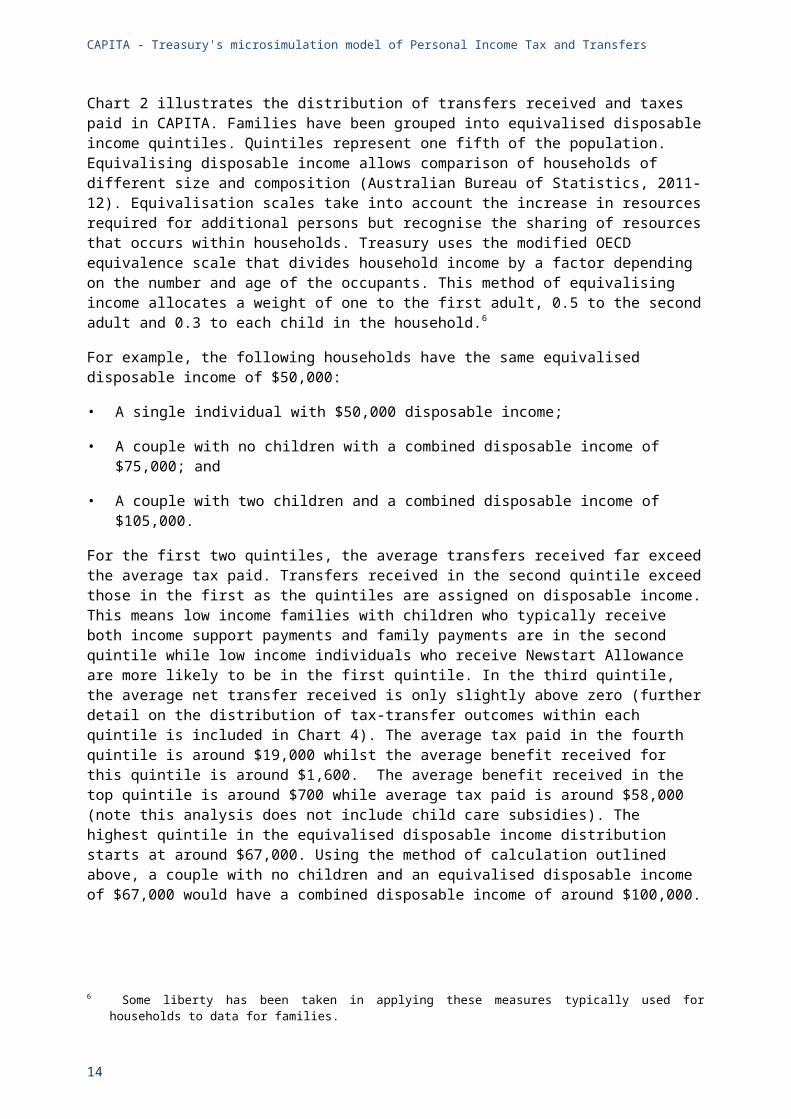
Chart 2 illustrates the distribution of transfers received and taxes paid in CAPITA. Families have been grouped into equivalised disposable income quintiles. Quintiles represent one fifth of the population. Equivalising disposable income allows comparison of households of different size and composition (Australian Bureau of Statistics, 2011-12). Equivalisation scales take into account the increase in resources required for additional persons but recognise the sharing of resources that occurs within households. Treasury uses the modified OECD equivalence scale that divides household income by a factor depending on the number and age of the occupants. This method of equivalising income allocates a weight of one to the first adult, 0.5 to the second adult and 0.3 to each child in the household.6
For example, the following households have the same equivalised disposable income of $50,000:
• A single individual with $50,000 disposable income;
• A couple with no children with a combined disposable income of $75,000; and
• A couple with two children and a combined disposable income of $105,000.
For the first two quintiles, the average transfers received far exceed the average tax paid. Transfers received in the second quintile exceed those in the first as the quintiles are assigned on disposable income. This means low income families with children who typically receive both income support payments and family payments are in the second quintile while low income individuals who receive Newstart Allowance are more likely to be in the first quintile. In the third quintile, the average net transfer received is only slightly above zero (further detail on the distribution of tax-transfer outcomes within each quintile is included in Chart 4). The average tax paid in the fourth quintile is around $19,000 whilst the average benefit received for this quintile is around $1,600. The average benefit received in the top quintile is around $700 while average tax paid is around $58,000 (note this analysis does not include child care subsidies). The highest quintile in the equivalised disposable income distribution starts at around $67,000. Using the method of calculation outlined above, a couple with no children and an equivalised disposable income of $67,000 would have a combined disposable income of around $100,000.
Chart 2: Average transfers received and tax paid by family equivalised disposable income quintile in 2017-18
Lowest Second Third Fourth Highest-70,000
-60,000
-50,000
-40,000
-30,000
-20,000
-10,000
0
10,000
20,000
30,000
-70,000
-60,000
-50,000
-40,000
-30,000
-20,000
-10,000
0
10,000
20,000
30,000
Average Cash Transfers Average Tax Paid
Transfer ($) Transfer ($)
6 Some liberty has been taken in applying these measures typically used for households to data for families.
9
CAPITA - Treasury's microsimulation model of Personal Income Tax and Transfers
Note: This analysis does not include childcare payments, transfers in kind or indirect taxes. The ABS publication Government Benefits, Taxes and Household income 2009-10 (ABS Cat 6537.0) includes these elements.
While the quintile averages in Chart 2 are interesting, CAPITA can also be used to understand the diversity contained within the averages. Focusing on working age families at a high level, in 2017-18, 16 per cent of working age families receive transfer payments but pay no income tax, 8 per cent of working age families are net benefit recipients (they pay tax but receive more in transfer payments), 8 per cent of working age families are net tax payers (they receive benefits but pay more in tax) and 68 per cent of working age families pay tax and receive no transfers. Families that receive no transfers and pay no income tax (or receive no transfers and have negative income tax) are excluded from these results. They account for about 9 per cent of all families.
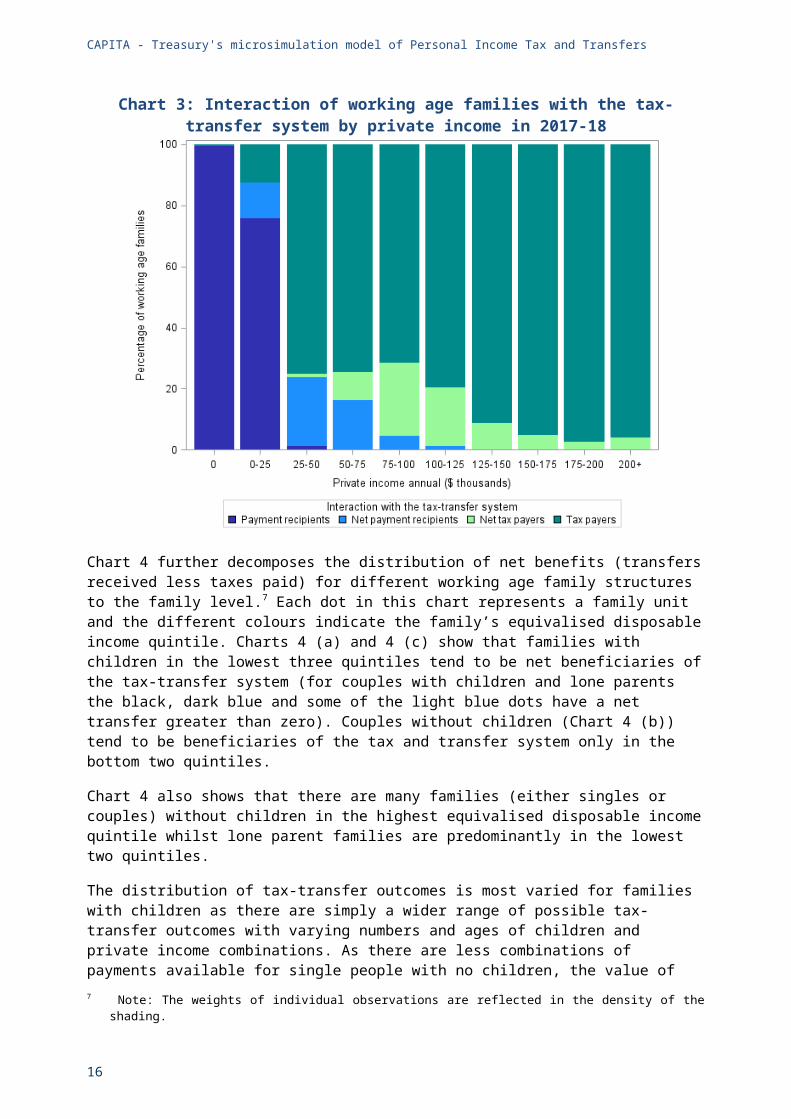
Chart 3 shows the interaction with the tax-transfer system for working age families in different private income bands. The chart shows that 100 per cent of families with no private income are payment recipients that pay no tax. Understandably, as private income increases, the percentage of families who are net beneficiaries decreases and the percentage of families who are net contributors increases. At the top end of the private income distribution almost 100 per cent of families pay tax and do not receive transfer payments.
Chart 3: Interaction of working age families with the tax-transfer system by private income in 2017-18
Chart 4 further decomposes the distribution of net benefits (transfers received less taxes paid) for different working age family structures to the family level.7 Each dot in this chart represents a family unit and the different colours indicate the family’s equivalised disposable income quintile. Charts 4 (a) and 4 (c) show that families with children in the lowest three quintiles tend to be net beneficiaries of the tax-transfer system (for couples with children and lone parents the black, dark blue and some of the light blue dots have a net transfer greater than zero). Couples without children (Chart 4 (b)) tend to be beneficiaries of the tax and transfer system only in the bottom two quintiles.
7 Note: The weights of individual observations are reflected in the density of the shading.
10

CAPITA - Treasury's microsimulation model of Personal Income Tax and Transfers
Chart 4 also shows that there are many families (either singles or couples) without children in the highest equivalised disposable income quintile whilst lone parent families are predominantly in the lowest two quintiles.
The distribution of tax-transfer outcomes is most varied for families with children as there are simply a wider range of possible tax-transfer outcomes with varying numbers and ages of children and private income combinations. As there are less combinations of payments available for single people with no children, the value of net benefit received for these people is generally much lower and concentrated around the means testing rates (on the payments side) and centred on the marginal tax rates at higher private income levels. For example, the Disability Support Pension is paid at a higher rate than the Newstart Allowance. As the payment outcomes are less varied for lone people (in chart 4 (d)) recipients of the Disability Support Pension are generally in the third equivalised disposable income quintile (the light blue dots) whilst recipients of Newstart Allowance are generally in the bottom two equivalised disposable income quintiles (the black and dark blue dots).
Chart 4: Distribution of taxes paid and benefits received by income and family type for working age families in 2017-18
CAMEO ANALYSIS
CAPITA has been used to produce cameo analysis illustrating the tax-transfer outcomes for different family structures at different levels of income. The charts below contain detailed breakdowns of the
11

CAPITA - Treasury's microsimulation model of Personal Income Tax and Transfers
transfer payments receivable, tax payable and overall outcomes as the family private income increases from $0 to $200,000. The outcomes are specific to the modelled family type and may differ considerably depending on ages and number of children and ratios of income within couples.
The first cameo is a relatively simple example as the individual has no partner or dependants. Subsequent cameo examples present more complex interactions with the tax-transfer system.
12
CAPITA - Treasury's microsimulation model of Personal Income Tax and Transfers
A single individual with no children
Chart 5 shows the breakdown of benefits received and tax paid in 2017-18 for a single individual with no children. Assuming this individual meets necessary activity test requirements, they will receive Newstart Allowance8 until their annual private income reaches around $27,000 per annum (the bright green area). This individual will nominally begin to pay income tax once their private income exceeds around $6,000 as the combination of their private income plus their Newstart Allowance ($13,000, which is taxable) exceeds the $18,200 tax-free threshold. However, as they are eligible for both the Beneficiary Tax Offset (BENTO) and the Low Income Tax Offset (LITO) they will be a net beneficiary of the tax-transfer system until their private income reaches $25,000.
Chart 5: Breakdown of benefits received and tax paid –single individual, no children in 2017-18
4500-70,000
-60,000
-50,000
-40,000
-30,000
-20,000
-10,000
0
10,000
20,000
30,000
40,000
50,000
-70,000
-60,000
-50,000
-40,000
-30,000
-20,000
-10,000
0
10,000
20,000
30,000
40,000
50,000Benefit ($) Benefit ($)
Newstart Allowance
Income tax
Medicare levy
Low income tax offset
Net Benefit
Beneficiary Tax Off-set
The line in Chart 5 indicates the net benefit (transfers received less taxes paid). The slope of this line indicates the additional benefit forgone (or tax paid) for each additional dollar of private income earned, which is the EMTR faced by this cameo example at every private income level. The steeper the line, the higher the net benefit forgone for an additional dollar of private income earned. In the example above, the slope of the blue line is steepest around $25,000.
It can be useful to examine EMTRs to provide an indication of the influence of the tax-transfer system on incentives to work. The CAPITA cameo output can be used to further investigate the details of EMTRs and to highlight how the various elements of the tax-transfer system interact, or to assess the combined effect of a package of policy proposals. An unavoidable feature of the progressivity of Australia’s tax and transfer system is the creation of high EMTRs – the proportion of any increase in income that is ‘lost’ – that reduce the immediate financial rewards for work.9 However, the extent to which someone’s workforce participation is influenced by EMTRs also depends on the particular circumstances of the individual and their household.
For example, Chart 6 shows the EMTRs faced by the single individual above for private incomes from $0 to $200,000 for a marginal increase in private income of $500 (or around $10 per week). Two spikes
8 Note: income support payments such as Newstart Allowance are assessed and paid fortnightly and many recipients only receive payments for part of the year.
9 While EMTRs can be lowered by reducing the rate at which payments are withdrawn, this leads to increases in EMTRs further up the income distribution, which comes at a fiscal cost and makes the system less redistributive overall.
13
CAPITA - Treasury's microsimulation model of Personal Income Tax and Transfers
in the EMTR can be seen, one around $15,000 where they begin to pay the Medicare Levy (and Newstart Allowance and BENTO gradually reduce) and one when the Energy Supplement associated with Newstart Allowance is fully withdrawn at around $27,000. These spikes only affect a narrow range of incomes and thus, are unlikely to have adverse effects on workforce participation.10 More important is the sustained high EMTR of 70 per cent observed between $17,000 and $27,000 due to the gradual withdrawal of Newstart Allowance, and the introduction of personal income tax and the Medicare Levy which ‘shades’ in at 10 per cent of income.
Chart 6: Breakdown of EMTR – single individual, no children in 2017-18
055
0011
000
1650
022
000
2750
033
000
3850
044
000
4950
055
000
6050
066
000
7150
077
000
8250
088
000
9350
099
000
1045
0011
0000
1155
0012
1000
1265
0013
2000
1375
0014
3000
1485
0015
4000
1595
0016
5000
1705
0017
6000
1815
0018
7000
1925
0019
8000
0%
10%
20%
30%
40%
50%
60%
70%
80%
90%
100%
0%
10%
20%
30%
40%
50%
60%
70%
80%
90%
100%EMTR Gross income tax
EMTR Newstart Allowance
EMTR Medicare levy
EMTR Used BENTO
EMTR Used LITO
EMTR Effective tax
A sole parent with two children, aged 6 and 2
Chart 7 below shows the breakdown of benefits received and tax paid for a sole parent with two children aged 6 and 2 years old. This family receives a combination of Parenting Payment (Single), Family Tax Benefit Part A (FTB-A) and Family Tax Benefit Part B (FTB-B). Parenting Payment (Single) starts to reduce once the sole parent’s income exceeds $6,000. Because Parenting Payment (Single) exceeds the tax-free threshold of $18,200, this sole parent nominally starts to pay income tax from the first dollar of income. However their tax is also reduced by the LITO and the Senior Australian and Pensioner Tax Offset (SAPTO) so they will be a net beneficiary of the tax-transfer system until their private income level reaches $64,000. When private income exceeds $55,000, the family loses Parenting Payment (Single). The sole parent receives the maximum amount of FTB-B until their private income goes above $100,000. The amount of FTB-A decreases as private income increases over $55,000 and is withdrawn completely when private income exceeds $105,000.
10 While CAPITA can measure a family’s EMTR as the proportion of income lost from each additional dollar earned, there are other approaches. For example, the Productivity Commission suggest that EMTRs evaluated over larger increases in income provide a more realistic indication of the effect of tax-transfer system on an individual’s willingness to work(Productivity Commission, 2015).
14
EMTR EMTR
Private income ($)
CAPITA - Treasury's microsimulation model of Personal Income Tax and Transfers
Chart 7: Breakdown of benefits received and tax paid –sole parent with two children, aged 6 and 2 in 2017-18
3500-70,000
-60,000
-50,000
-40,000
-30,000
-20,000
-10,000
0
10,000
20,000
30,000
40,000
50,000
-70,000
-60,000
-50,000
-40,000
-30,000
-20,000
-10,000
0
10,000
20,000
30,000
40,000
50,000Benefit ($) Benefit ($)Parenting Payment (Single)
Low income tax offsetFTB-A
FTB-B
Medicare levyNet bene-fit
Senior Australian and Pensioner Tax Offset
Income tax
As indicated in the chart, the slope of the blue line is steepest, and thus the EMTR is highest, when the family loses FTB-B (at around $100,000). At this point, earning an extra dollar of income actually reduces the sole parent’s disposable income over a narrow income range.
A dual income family with two children, aged 14 and 10
Chart 8 shows the breakdown of benefits received and tax paid for a dual income family with two children aged 14 and 10 years old. Both partners earn the same amount of income. This family structure receives a combination of Newstart Allowance, FTB-A and FTB-B. Their tax is reduced by the LITO and BENTO.
Chart 8: Breakdown of benefits received and tax paid –dual income family with two children aged 14 and 10 in 2017-18
3500-70,000
-60,000
-50,000
-40,000
-30,000
-20,000
-10,000
0
10,000
20,000
30,000
40,000
50,000
-70,000
-60,000
-50,000
-40,000
-30,000
-20,000
-10,000
0
10,000
20,000
30,000
40,000
50,000Benefit ($) Benefit ($)
Newstart Allowance
FTB-A
Medicare levy
Low income tax off-set
FTB-B
Income tax
Net benefit
Beneficiary Tax Off-set
For a dual income family, FTB-B begins to withdraw at a rate of 20 per cent when the secondary earner’s income exceeds $5,500. This family becomes a net-tax payer when their private income exceeds $75,000.
15

CAPITA - Treasury's microsimulation model of Personal Income Tax and Transfers
As the Australian personal tax system applies to individual incomes but the transfer system is calculated based on couple incomes, family outcomes depend on the relative incomes of the member of a couple. In contrast to Chart 8 where private income is split evenly between the primary and secondary income earners, Chart 9 shows the payments and taxes for the same family structure when all the income is earned by one member of the couple. The different outcomes for these seemingly similar families illustrate the complexity of the interaction between an individual based tax system and a family based transfer system. The amount of FTB-B received by the single income family is higher however, the amount of income tax is also higher as private income increases, as the primary income earner faces higher marginal tax rates (compared to the previous example). The point at which this couple pays net tax is $64,000, which is lower than the net tax point of $75,000 for the couple with equal earnings.
Chart 9: Breakdown of benefits received and tax paid –single income couple with two children aged 14 and 10
3500-70,000
-60,000
-50,000
-40,000
-30,000
-20,000
-10,000
0
10,000
20,000
30,000
40,000
50,000
-70,000
-60,000
-50,000
-40,000
-30,000
-20,000
-10,000
0
10,000
20,000
30,000
40,000
50,000Benefit ($) Benefit ($)
Newstart Allowance
FTB-A
Medicare levy
Low income tax off-set
FTB-B
Income tax
Net Benefit
Beneficiary Tax Off-set
6.PUBLIC RELEASE OF THE MODELTreasury is making the SAS code underpinning the CAPITA model available to the general public. The model will be available to download from a link on the Treasury website and data.gov.au. Users of the model will need to comply with a user licence agreement and obtain access to the 2013-14 Survey of Income and Housing (SIH) and 2011-12 Census from the ABS (costs involved in acquiring these datasets are detailed on the ABS website).
Treasury is providing this model to the public to ensure more people can contribute rigorous, evidence based policy analysis to the public policy debate in Australia. Treasury also encourages users of the model to share any suggested improvements to progress the development of the CAPITA model into the future.
7.FUTURE DIRECTIONSTreasury will continue to regularly update and release CAPITA for changes to: the underlying data; tax and transfer policies, and economic parameters. Treasury will also investigate improvements and extensions to the model and welcomes opinions from users on the following.
16
CAPITA - Treasury's microsimulation model of Personal Income Tax and Transfers
This first release of CAPITA covers the personal income tax and transfer system. Similar models often include the impacts of indirect taxes (such as the GST) and social transfers in kind (such as health and education). With the pending release of the 2015-16 Household Expenditure Survey microdata, Treasury’s forward work program will look at including expenditure data in CAPITA to allow the analysis of indirect taxes. Including information on social transfers in kind would allow the model to measure final income. More generally, current open data developments may offer alternative data sources for CAPITA’s base data.
The version of CAPITA in this first public release has been designed for use by trained Treasury analysts in the Treasury environment, rather than specifically as a model for the public. CAPITA could potentially be made more accessible to a wider number of users by the addition of a user-interface or the use of open-source modelling languages.
8.CONCLUSIONStatic microsimulation models are important tools in the policy development process because they allow for holistic consideration of the interaction of tax and transfer policy outcomes on different sections of the population. Treasury’s CAPITA model is a useful tool for analysing the distributional effects of changes to tax-transfer policy in Australia. Treasury encourages members of the public to use and contribute to the development of CAPITA to ensure the model can be used to provide rigorous, evidence based policy for many years to come.
17

BIBLIOGRAPHYAustralian Bureau of Statistics. (2011-12). Household Income and Income Distribution, Australia.
Australian Bureau of Statistics. (2015). Australian Bureau of Statistics. Retrieved July 10, 2017, from Survey of Income and Housing, User Guide, Australia, 2013-14: http://www.abs.gov.au/ausstats/[email protected]/Lookup/by%20Subject/6553.0~2013-14~Main%20Features~Using%20the%20survey~20
Australian Bureau of Statistics. (2015). Australian Bureau of Statistics. Retrieved July 25, 2017, from Survey of Income and Housing, User Guide, Australia, 2013-14: http://www.abs.gov.au/ausstats/[email protected]/Lookup/by%20Subject/6553.0~2013-14~Main%20Features~Introduction~1
Creedy, J. (2015). Labour Supply in New Zealand and the 2010 Tax and Transfer change.
Creedy, J. (n.d.). Labour Supply and Microsimulation: The Evaluation of Tax Policy Reforms.
HM Treasury. (2015). Impact of April 2015 tax and welfare measures on households. HM Treasury.
McDonagh, D., & Chomik, R. (n.d.). Policy Simulation Model. Retrieved July 2017, from https://www.ukdataservice.ac.uk/media/428511/chomikmcdonagh.pdf
Murphy, C. (2017). Review of Economic Modelling at Treasury. Independent Economics.
NATSEM. (2017). STINMOD+. Retrieved July 26, 2017, from National Centre for Social and Economic Modelling: http://www.natsem.canberra.edu.au/models/stinmod/
Productivity Commission. (2015). Tax and Transfer Incidence in Australia, Commission Working Paper.
Statistics Canada. (n.d.). The Social Policy Simulation Database and Model (SPSD/M). Retrieved July 2017, from Statistics Canada: http://www.statcan.gc.ca/eng/microsimulation/spsdm/spsdm
Sutherland, H. a. (2013). EUROMOD: the European Union tax-benefit microsimulation model. International Journal of Microsimulation, 6(1) pp.4-26.
Whiteford, P. (2015). The Tax-Transfer System, Progressivity and Redistribution: How Progressive is the Australian Transfer System? . Retrieved 2017, from The Tax and Transfer Policy Institute: http://www.austaxpolicy.com/the-tax-transfer-system-progressivity-and-redistribution-part-1-how-progressive-is-the-australian-transfer-system/
18