capillary gc systems method development for - agilent e-seminar... · gas advantages disadvantages...
TRANSCRIPT

Slide 1
Method Development for Capillary GC Systems

Slide 2
AREAS TO OPTIMIZE
• Injector
• Carrier gas
• Column temperature
Slide 3
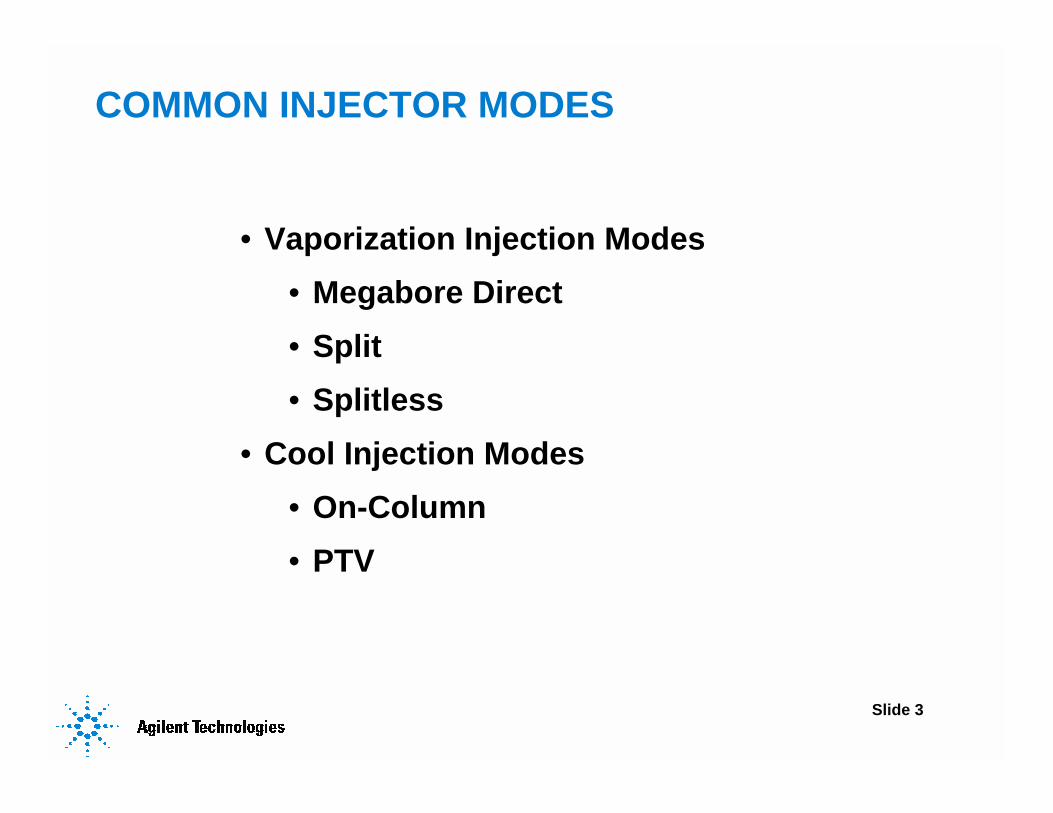
COMMON INJECTOR MODES
• Vaporization Injection Modes• Megabore Direct• Split• Splitless
• Cool Injection Modes• On-Column• PTV

Slide 4
INJECTORS
Split
Splitless
Slide 5
SPLIT INJECTOROverview
• Introduces only a small amount of sample into the column
• Used for concentrated samples
• Produces narrow and sharp peaks
Slide 6
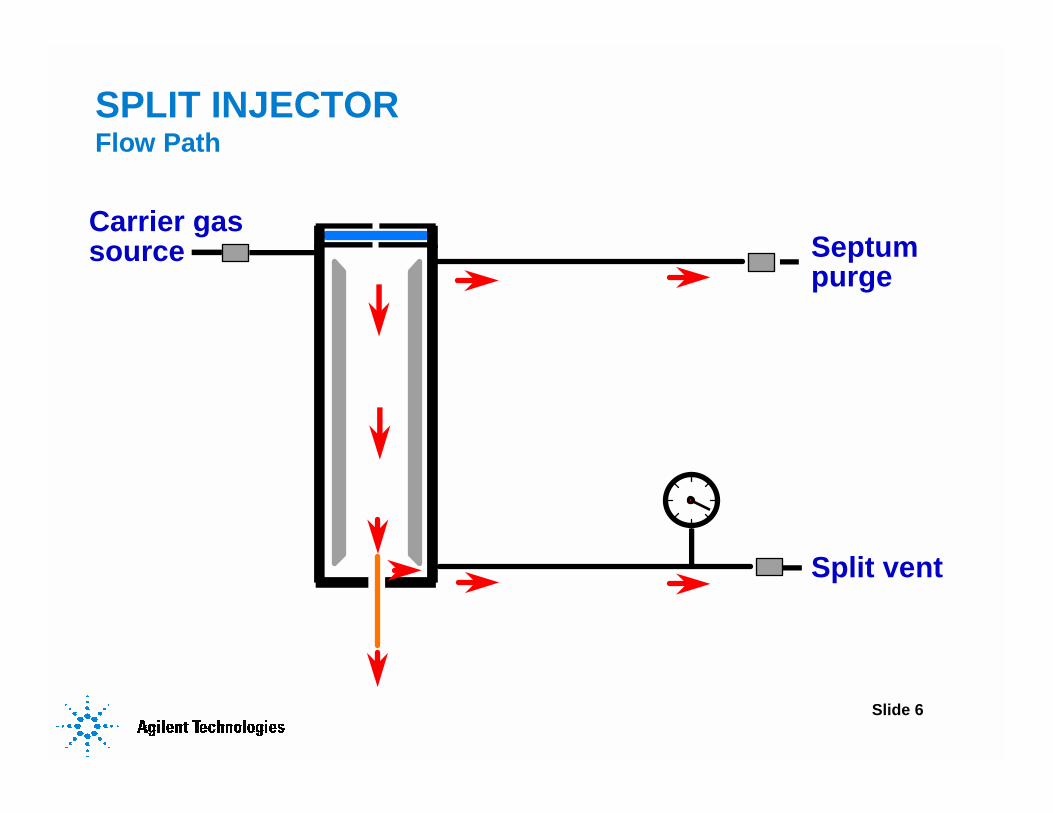
SPLIT INJECTORFlow Path
Carrier gassource Septum
purge
Split vent

Slide 7
SPLIT INJECTORMajor Variables
• Split ratio
• Liner
• Temperature
• Injection volume

Slide 8
SPLIT INJECTORSplit Ratio
• Determines the amount of sample entering the column
• Typically 20:1 to 100:1
Higher ratio = Less sample into the column

Slide 9
SPLIT INJECTOR50:1 Split Ratio
DB-1, 15 m x 0.25 mm i.d., 0.25 µm60°C for 1 min, 60-180°C at 20°/min; Helium at 30 cm/sec1. n-heptane 2. toluene 3. n-decane 4. n-butylbenzene 5. n-tridecane
1 2 3 4 5 6Time (min.)
1
2
3
4
5

Slide 10
SPLIT INJECTOR5:1 Split Ratio
DB-1, 15 m x 0.25 mm i.d., 0.25 µm60°C for 1 min, 60-180°C at 20°/min; Helium at 30 cm/sec1. n-heptane 2. toluene 3. n-decane 4. n-butylbenzene 5. n-tridecane
1 2 3 4 5 6Time (min.)
1
2 3
4 5

Slide 11
MINIMUM RECOMMENDED SPLIT RATIO
mm I.D. Lowest ratio0.10 1:50 - 1:750.18 - 0.25 1:10 - 1:200.32 1:8 - 1:150.53 1:2 - 1:5
Slide 12
SPLIT INJECTORSplit Ratio
• Too low: Poor peak shapeColumn overload
• Too high: Poor sensitivityWastes carrier gas
• Usually non-linear
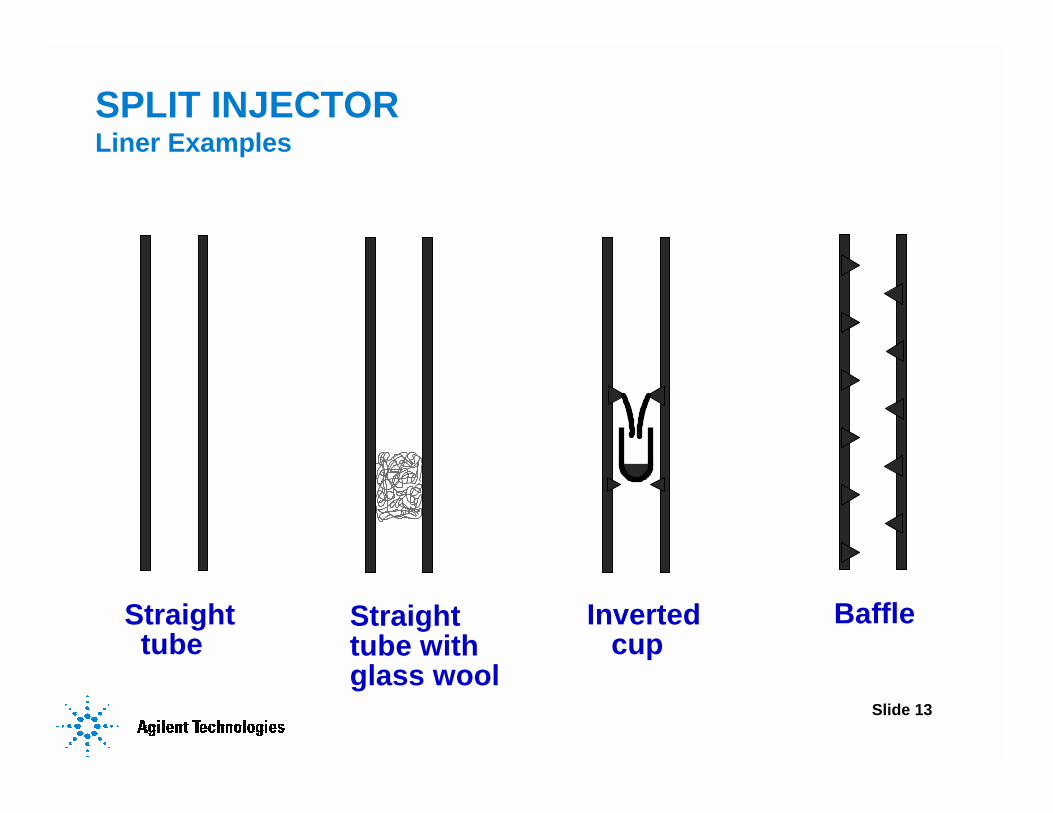
Slide 13
SPLIT INJECTORLiner Examples
Straighttube
Straighttube withglass wool
Invertedcup
Baffle

Slide 14
SPLIT LINER
C10
C40
C10
C40
Packed with Glass Wool
Without Glass Wool Packing
Peak Area Ration-C40/n-C10 = 0.64
Peak Area Ration-C40/n-C10 = 0.37
Slide 15
SPLIT INJECTORTemperature
• Hot enough to rapidly vaporize the sample
• May degrade sample or result in injector contamination if too hot
• Typically 200-250°C
• Injector temperature may not be critical
• Use same temperature for reproducible results

Slide 16
SPLIT INJECTORInjection Volume
• Typically 1-3 µl
• Injection volume is not linear
• Inject same volume for all samples and standards for accurate and precise results

Slide 17
Break Number 1
• For Questions and Answers
• Press *1 on Your Phone to
• Ask a Question
Slide 18
INJECTORS
Split
Splitless
Slide 19
SPLITLESS INJECTOROverview
• Most of the sample is introduced into the column
• Used for low concentration samples
• Wider peaks are obtained than for split injections

Slide 20
SPLITLESS INJECTORPurge Off At Injection
Flow through injector = Column flow only
Carrier gassource Septum
purge
Split vent

Slide 21
SPLITLESS INJECTOR Purge On After Injection
Flow through injector = Column flow + Split Vent Flow
Carrier gassource Septum
purge
Split vent
Slide 22
SPLITLESS INJECTORMajor Variables
• Purge activation time
• Liner
• Injection volume
• Temperature

Slide 23
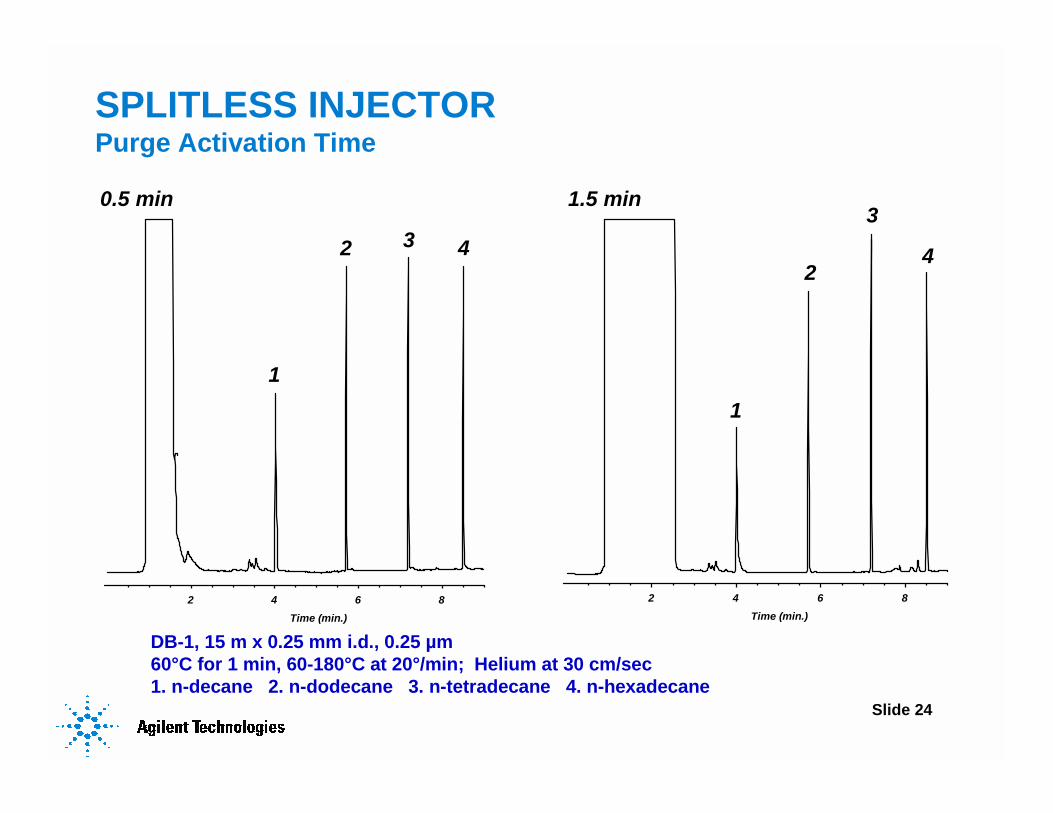
SPLITLESS INJECTORPurge Activation Time
• Purges injector of residual sample
• Reduces solvent front size
• Typically 0.25-1.5 minutes
Longer purge time = More sample in column and larger solvent front
Slide 24
SPLITLESS INJECTORPurge Activation Time
DB-1, 15 m x 0.25 mm i.d., 0.25 µm60°C for 1 min, 60-180°C at 20°/min; Helium at 30 cm/sec1. n-decane 2. n-dodecane 3. n-tetradecane 4. n-hexadecane
2 4 6 8Time (min.)
2 4 6 8Time (min.)
0.5 min 1.5 min
1
2 3 4
1
2
3
4

Slide 25
SPLITLESS INJECTOR Purge Time vs. Peak Size
SoluteSolvent
0 10 20 30 40 50 60 70 80 90 100
RelativeAreaCounts
Ideal
Purge Activation Time (sec)
100
0

Slide 26
SPLITLESS INJECTORPurge Activation Time
• Longer time introduces more sample into the column
• Not linear
• Very long times result in large solvent fronts
Usually 0.5-0.75 min

Slide 27
SPLITLESS INJECTORLiner
• Usually a straight tube
• Top and bottom restriction recommended*
*Sometimes called "double gooseneck"
Slide 28
SPLITLESS INJECTORInjection Volume
• Typically 1-2 µl
• Not linear
• Wider peaks often occur for >2 µL
• Potential backflash problems with larger volumes
Slide 29
SPLITLESS INJECTORInjector Temperature
• Hot enough to vaporize the sample
• Long residence time of sample in the injector
• Typically 200-250°C
• Injector temperature may not be critical
• Use same temperature for reproducible results

Slide 30
SPLITLESS INJECTOR Sample Re-focusing
• Sample re-focusing improves efficiency
• Use low column temperature to refocus solvent
• Called the solvent effect

Slide 31
SPLITLESS INJECTORColumn TemperatureSolvent Effect
• Initial column temperature at least 10°C belowsample solvent boiling point
• Required to obtain good peak shapes*
*Except if cold trapping occurs

Slide 32
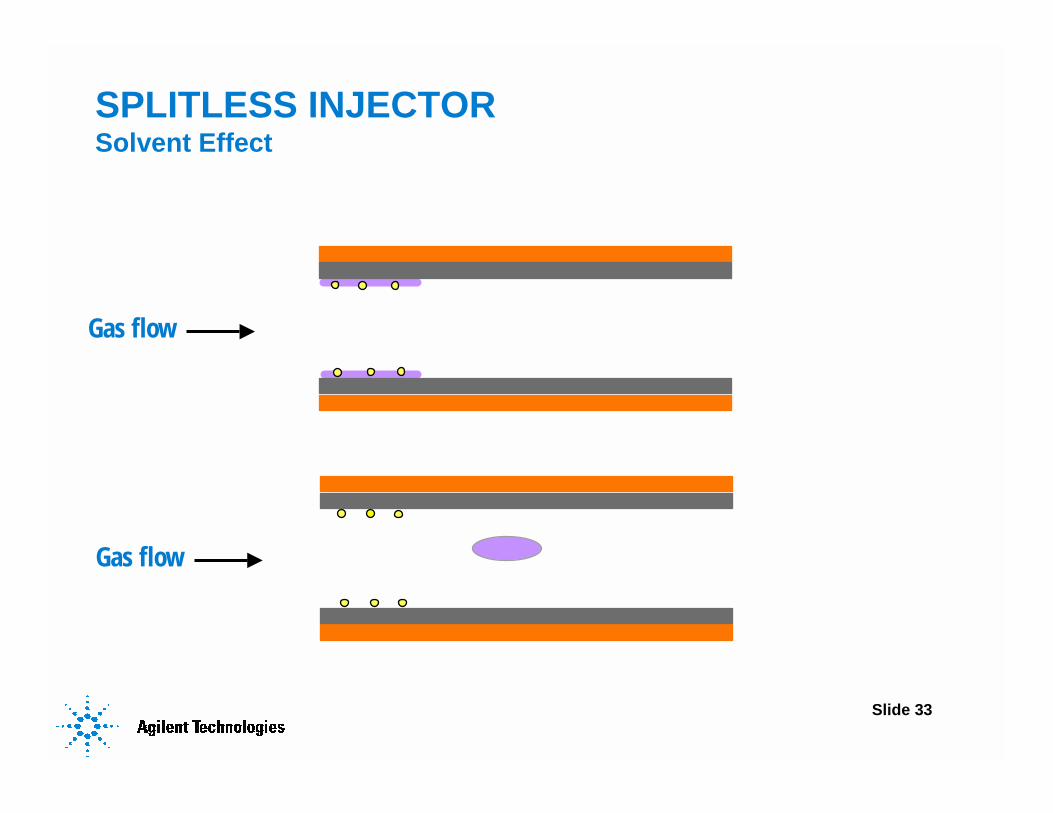
SPLITLESS INJECTOR Solvent Effect
Solvent andsolutes
Solvent film
Gas flow
Gas flow
Slide 33
SPLITLESS INJECTOR Solvent Effect
Gas flow
Gas flow

Slide 34
SPLITLESS INJECTORInitial Column TemperatureHexane Solvent (BP = 68-69°C)
DB-1, 15 m x 0.25 mm i.d., 0.25 µm50°C or 70°C for 0.5 min, to 210°C at 20°/min; Helium at 30 cm/sec1. n-decane 2. n-dodecane 3. n-tetradecane 4. n-hexadecane
2 4 6 8Time (min.)
2 4 6 8Time (min.)
50°C 70°C
1
2 3 4
1
2
3 4

Slide 35
SPLITLESS INJECTOR Cold Trapping
• Solvent effect not always necessary
• If solute BP >150°C above initial column temperature, the solute will cold trap
Slide 36
COLD TRAPPING
• Has the same result as the solvent effect
• Greater efficiency than solvent effect

Slide 37
SPLITLESS INJECTORRetention Gap
• Retention gaps often improve peak shapes
• Greatest impact on earlier eluting peaks, especially if there is a polarity mismatch between solvent and phase

Slide 38
SPLITLESS Sample Solvent
• Avoid very low or high BP solvents
• Solvent should be lowest BP sample component
• Avoid mixed solvents
Slide 39
Break Number 2
• For Questions and Answers
• Press *1 on Your Phone to
• Ask a Question

Slide 40
CARRIER GAS
Mobile Phase

Slide 41
CARRIER GAS
• Carries the solutes down the column
• Selection and velocity influences efficiency and retention time

Slide 42
RESOLUTION VS. LINEAR VELOCITYHelium
DB-1, 15 m x 0.32 mm ID, 0.25 um60°C isothermal1,3- and 1,4-Dichlorobenzene
R = 1.46 R = 1.31 R = 0.97
4.50 3.84 3.36
30 cm/sec 35 cm/sec 40 cm/sec
4.4 psig 5.1 psig 5.8 psig

Slide 43
VAN DEEMTER CURVE
10 20 30 40 50 60
0.25
0.50
0.75
1.00
u (cm/sec)
H
uoptOPGV
Slide 44
uopt and OPGV
uopt:Maximum efficiency
OPGV:Optimal practical gas velocity
Maximum efficiency per unit time
1.5 - 2x uopt

Slide 45
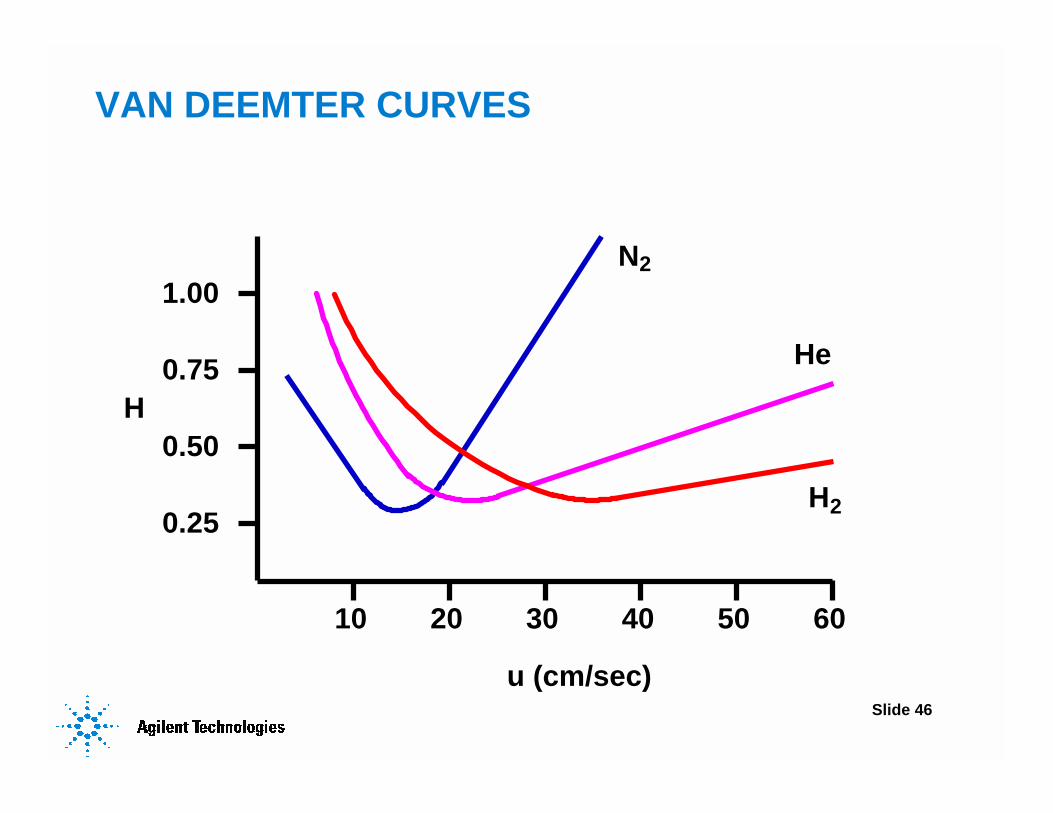
COMMON CARRIER GASES
Nitrogen
Helium
Hydrogen
Slide 46
VAN DEEMTER CURVES
10 20 30 40 50 60
0.25
0.50
0.75
1.00
u (cm/sec)
H
He
N2
H2

Slide 47
CARRIER GASHelium vs. Hydrogen
DB-1, 15 m x 0.25 mm i.d., 0.25 µm50°C for 2 min, 50-110°C at 20°/min
0 2 4 6 8 10 12Time (min.)
0 2 4 6 8Time (min.)
Helium (35 cm/sec) Hydrogen (73 cm/sec)
10.5 min 7.8 min
1 32
4
5
6
78
9
1
2
3
4
5
6 7 8
9

Slide 48
CARRIER GAS
Hydrogen is difficult to explode under GC conditions
Gas Advantages DisadvantagesNitrogen Cheap, Readily available Long run timesHelium Good compromise, Safe ExpensiveHydrogen Shorter run times, Cheap Explosive
Slide 49
COLUMN TEMPERATURE
• Most powerful variable
• Most difficult to develop
• Often involves trial and error

Slide 50
COLUMN TEMPERATURE
• Isothermal
• Temperature Program
Slide 51
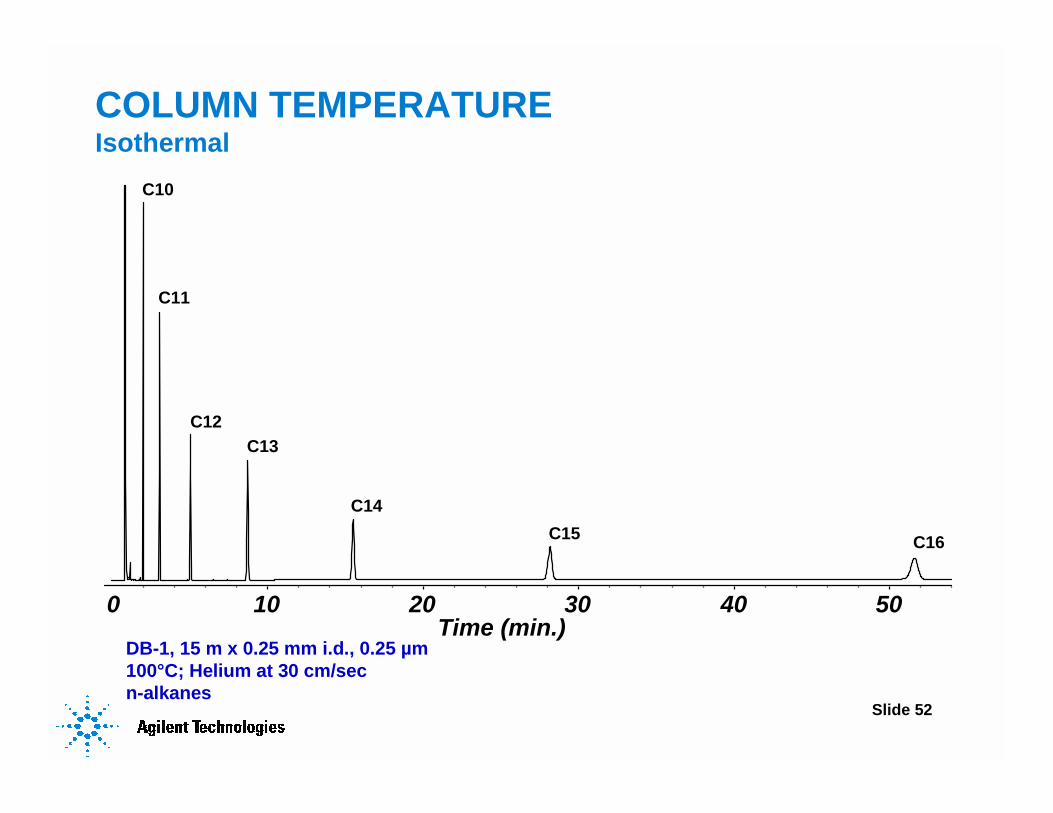
COLUMN TEMPERATUREIsothermal
• For compounds with similar retention
• Peak widths increase as retention increases
Slide 52
COLUMN TEMPERATUREIsothermal
DB-1, 15 m x 0.25 mm i.d., 0.25 µm100°C; Helium at 30 cm/secn-alkanes
0 10 20 30 40 50Time (min.)
C10
C11
C12C13
C14
C16C15

Slide 53
COLUMN TEMPERATURETemperature Program
• For compounds with dissimilar retention
• Little peak broadening with increasing retention
• Requires cool down between analyses

Slide 54
COLUMN TEMPERATURETemperature Program
DB-1, 15 m x 0.25 mm i.d., 0.25 µm60°C for 1 min, 60-180°C at 20°/min; Helium at 30 cm/secn-alkanes
0 2 4 6 8Time (min.)
C10C11
C12
C13
C14C15
C16

Slide 55
COLUMN TEMPERATUREDeveloping Temperature Programs
• More difficult prediction and development
• Natural log (ln) relationship between retention and temperature
• Factor in cool down time
Slide 56
DEVELOPING TEMPERATURE PROGRAMSFirst Step - Linear Program
• Initial temperature: 40-50°C
• Ramp rate: 10°C/min
• Final temperature: Column's upper limit*
• Final hold: Until the last peak elutes
*Or until the last peak elutes from the column

Slide 57
DEVELOPING TEMPERATURE PROGRAMSLinear Program50-130°C at 10°/min
DB-1, 15 m x 0.25 mm i.d., 0.25 µm
0 1 2 3 4 5 6 7Time (min.)
12
3 4
5
6,7
8
9

Slide 58
CARRIER GASCompound List for Chromatograms
Peak Compound
1 3-heptanone2 2-heptanone3 cyclohexanone4 1,3-dichlorobenzene5 1,4-dichlorobenzene6 1,2-dichlorobenzene7 iodobenzene8 naphthalene9 3-nitrobenzene

Slide 59
DEVELOPING TEMPERATURE PROGRAMSSecond Step
Change initial hold time
or
Change initial temperature
Slide 60
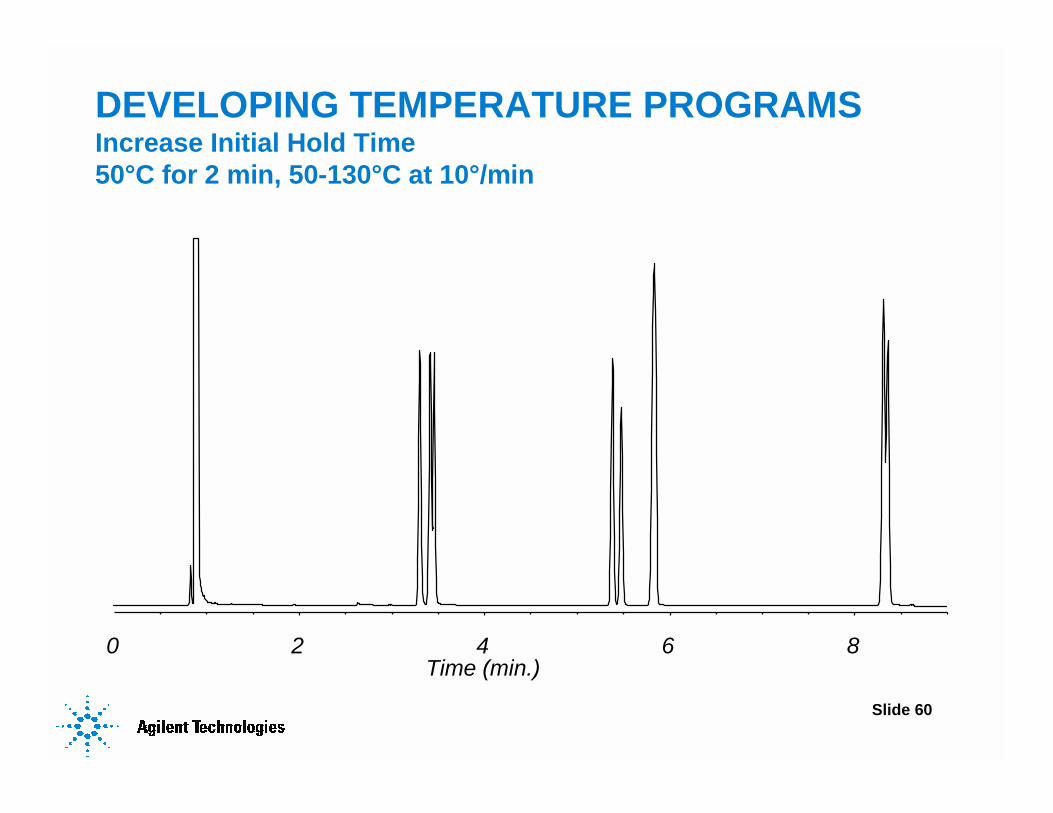
DEVELOPING TEMPERATURE PROGRAMSIncrease Initial Hold Time50°C for 2 min, 50-130°C at 10°/min
0 2 4 6 8Time (min.)

Slide 61
DEVELOPING TEMPERATURE PROGRAMSIncrease Initial Hold Time50°C for 4 min, 50-130°C at 10°/min
0 2 4 6 8 10Time (min.)
Slide 62
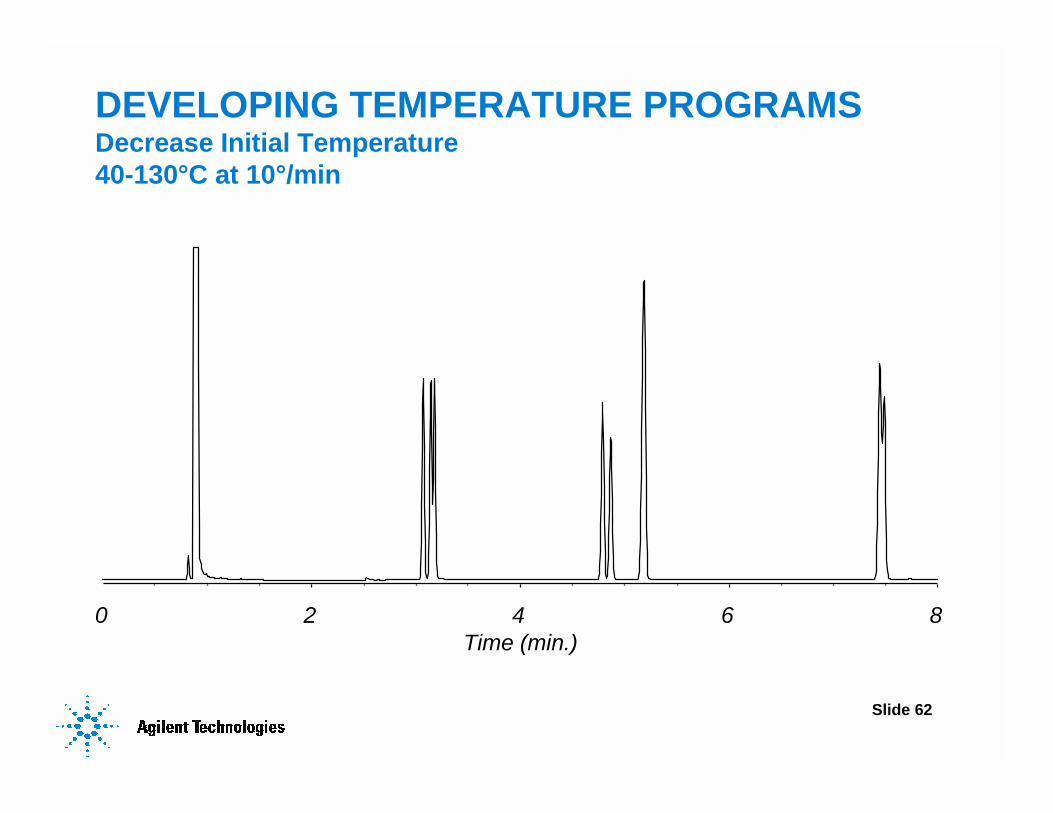
DEVELOPING TEMPERATURE PROGRAMSDecrease Initial Temperature40-130°C at 10°/min
0 2 4 6 8Time (min.)

Slide 63
DEVELOPING TEMPERATURE PROGRAMSDecrease Initial Temperature & Increase hold 40°C for 2 min, 40-130°C at 10°/min
0 2 4 6 8 10Time (min.)

Slide 64
DEVELOPING TEMPERATURE PROGRAMSThird Step
• Change the ramp rate
• ±5°C/min per change
Slide 65
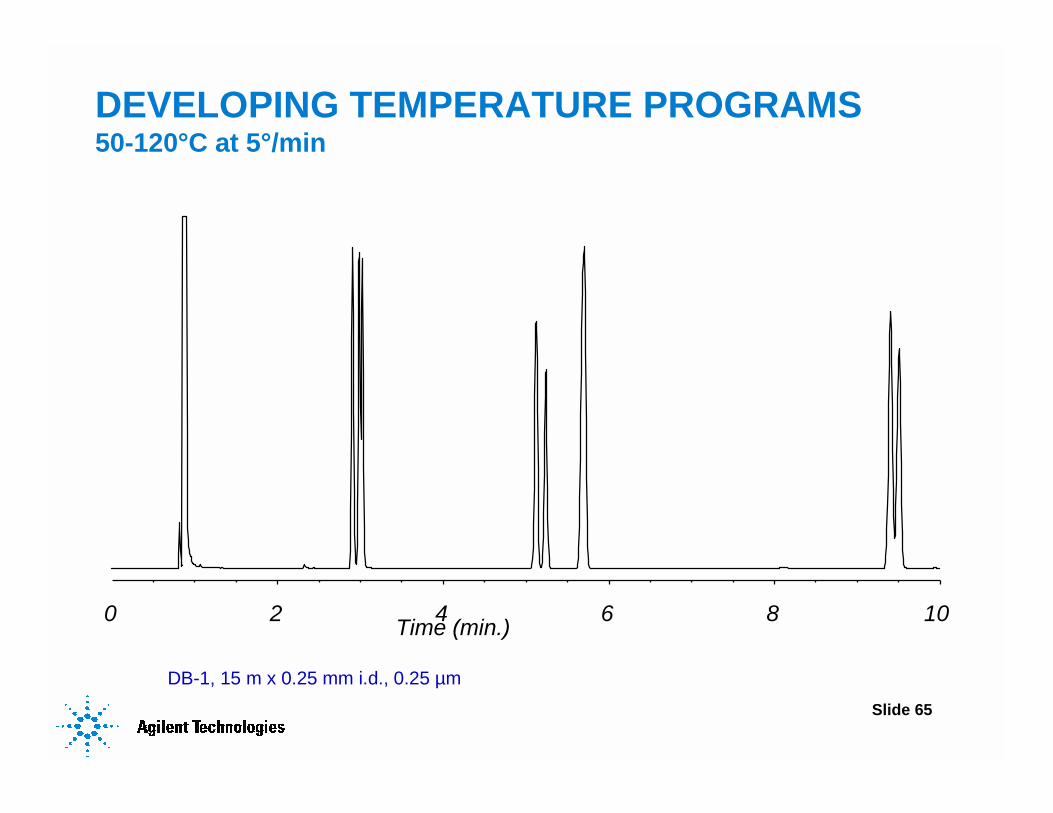
DEVELOPING TEMPERATURE PROGRAMS50-120°C at 5°/min
DB-1, 15 m x 0.25 mm i.d., 0.25 µm
0 2 4 6 8 10Time (min.)
Slide 66
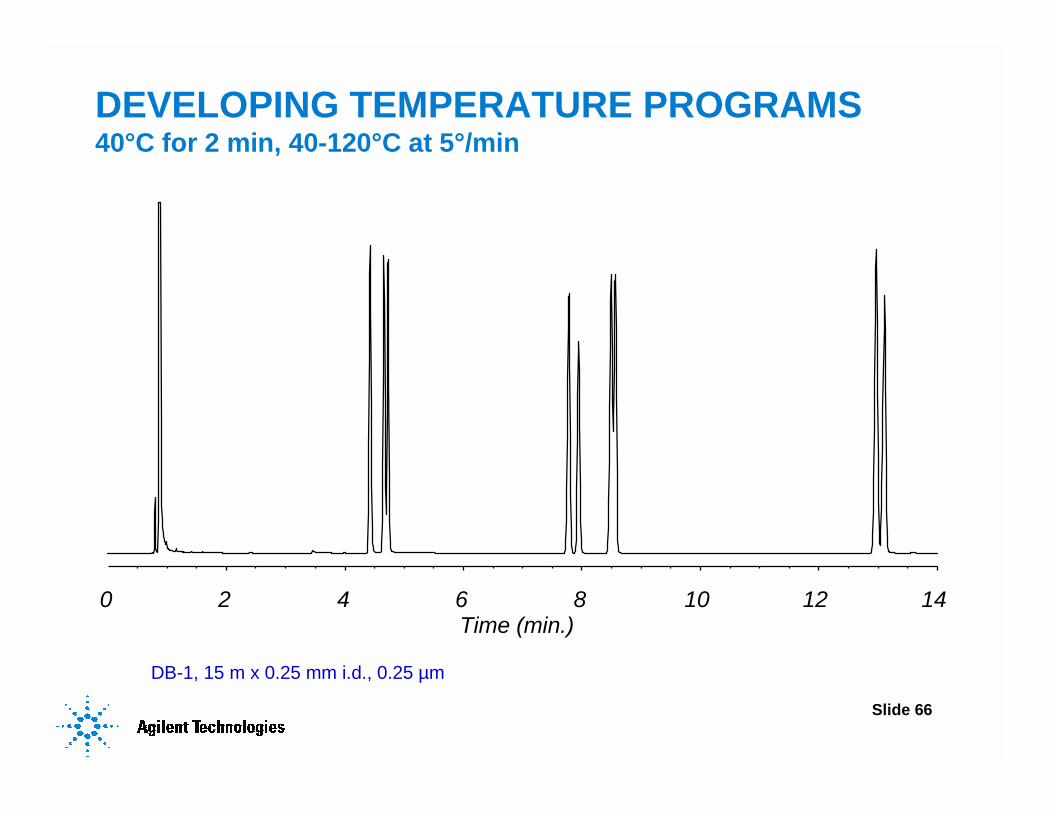
DEVELOPING TEMPERATURE PROGRAMS40°C for 2 min, 40-120°C at 5°/min
DB-1, 15 m x 0.25 mm i.d., 0.25 µm
0 2 4 6 8 10 12 14Time (min.)

Slide 67
DEVELOPING TEMPERATURE PROGRAMSMid Ramp Holds
• Isothermal portion during the temperature program
• 2-5 minute hold
• 20-30°C below elution temperature of peaks

Slide 68
DEVELOPING TEMPERATURE PROGRAMS40-70°C at 10°/min, 70°C for 3 min, 70-120°C at 10°/minHold at 20° below elution of peaks 6 & 7
DB-1, 15 m x 0.25 mm i.d., 0.25 µm
0 2 4 6 8 10Time (min.)

Slide 69
DEVELOPING TEMPERATURE PROGRAMS40-60°C at 5°/min, 60°C for 3 min, 60-120°C at 5°/minHold at 30° below elution of peaks 6&7
DB-1, 15 m x 0.25 mm i.d., 0.25 µm
0 2 4 6 8 10 12Time (min.)
Slide 70
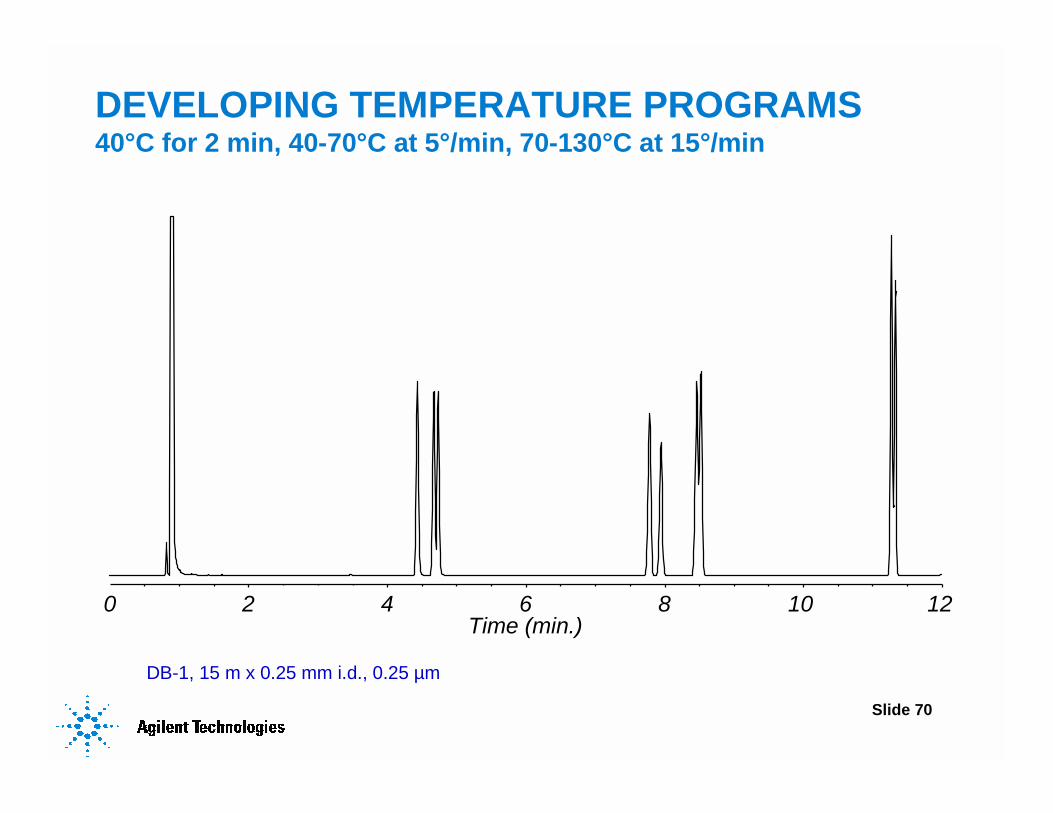
DEVELOPING TEMPERATURE PROGRAMS40°C for 2 min, 40-70°C at 5°/min, 70-130°C at 15°/min
DB-1, 15 m x 0.25 mm i.d., 0.25 µm
0 2 4 6 8 10 12Time (min.)

Slide 71
DEVELOPING TEMPERATURE PROGRAMS80-190°C at 20°/minDB-WAX, 15 m x 0.32 mm i.d., 0.25 µm
0 1 2 3 4 5Time (min.)
12
3 4
5
6 7
8
9

Slide 72
DEVELOPING TEMPERATURE PROGRAMSLowering the Initial Temperature
• Improves resolution of earlier peaks
• Smaller resolution improvement of later peaks*
*Resolution increases are smaller for longer columns
Slide 73
DEVELOPING TEMPERATURE PROGRAMSIncreasing Initial Temperature Hold Time
• Similar, but smaller effect as lowering the initial temperature
Slide 74
DEVELOPING TEMPERATURE PROGRAMSChanging Ramp Rate
• Affects resolution of later peaks
• Minimal effects resolution improvement on earlier peaks
• Substantial changes in analysis time

Slide 75
DEVELOPING TEMPERATURE PROGRAMSMid Ramp Hold
• Sometimes improves resolution of co-eluting peaks in the middle of the chromatogram
• May cause peak broadening
• More complicated programs

Slide 76
DEVELOPING TEMPERATURE PROGRAMSCombining Parameters
• Offset retention increases by adjusting another parameter

Slide 77
Agilent J&W Scientific Technical Support
800-227-9770 (phone: US & Canada)*
302-993-5304 (phone)*
* Select option 4, then option 1.
916-608-1964 (fax)
www.agilent.com/chem