cape reference number - eric · cape reference number: 2006-001-01 mathematica reference number:...
TRANSCRIPT


CAPE Reference Number: 2006-001-01
Mathematica Reference Number: 6319-520
Submitted to: The Joyce Foundation 70 West Madison Street, Suite 2750 Chicago, IL 60602-4317 Project Officer: John Luczak
Submitted by: Mathematica Policy Research 600 Maryland Avenue, SW Suite 550 Washington, DC 20024-2512 Telephone: (202) 484-9220 Facsimile: (202) 863-1763 Project Director: Steven Glazerman
An Evaluation of the Teacher
Advancement Program (TAP) in
Chicago: Year Two Impact Report
May 17, 2010
Steven Glazerman Allison Seifullah

v

Acknowledgments Mathematica Policy Research
v
This study is the product of many people’s efforts. At Chicago Public Schools, Ann Chan, Laurel Crown, Victoria Van-Nguyen, and other Chicago TAP staff provided data, offered useful feedback on earlier presentations and drafts, and cooperated with the study in many ways. John Luczak at the Joyce Foundation offered useful guidance.
At Mathematica, Dominic Harris, Jeremy Page, and Sarah Prenovitz provided expert assistance cleaning and analyzing data. Allen Schirm carefully reviewed drafts of the report and provided helpful comments on the study design and report. The report was prepared for publication by Donna Dorsey.


Contents Mathematica Policy Research
vii

Contents Mathematica Policy Research
viii

Tables Mathematica Policy Research
ix


Figures Mathematica Policy Research
xi


Executive Summary Mathematica Policy Research
xiii
In 2007, the Chicago Public Schools (CPS) began implementing a schoolwide reform called the Teacher Advancement Program (TAP) using funds from the federal Teacher Incentive Fund (TIF) and private foundations. Under the TAP model, teachers can earn extra pay and responsibilities through promotion to mentor or master teacher as well as annual performance bonuses based on a combination of their value added to student achievement and observed performance in the classroom. The model also includes weekly meetings of teachers and mentors (―cluster groups‖), and regular classroom observations by a school leadership team to help teachers meet their performance goals. The idea behind the program is that performance incentives, combined with tools for teachers to track performance and improve instruction, should help schools attract and retain talented teachers and help all teachers produce greater student achievement.
This report provides evidence on the impacts of TAP during the 2008-2009 school year, the second year of the program’s rollout in CPS. CPS began implementing its version of TAP (called ―Chicago TAP‖) with 10 schools in the first year and has been adding 10 new TAP schools each year of the grant’s four-year implementation period. Chicago TAP is based on a national TAP model developed by the Milken Family Foundation in the late 1990s, but with some local adaptations. For instance, the compensation amounts are set locally and the Chicago TAP model includes performance pay for principals and other school staff in addition to teachers. Teachers received an average performance bonus of $1,100 in the first year of implementation, with a maximum payout of $2,045. In the second year of implementation the performance bonuses averaged just over $2,600 to a maximum of $6,320. Teachers who were selected to be mentor teachers received a salary augmentation of $7,000 and lead (master) teachers received $15,000.
After the second year of CPS rolling out TAP, we found no evidence that the program raised student test scores. Student achievement growth as measured by average math and reading scores on the Illinois Standards Achievement Test (ISAT) did not differ significantly between TAP and comparable non-TAP schools.
We also found that TAP did not have a detectable impact on rates of teacher retention in the school or district during the second year it was rolled out in the district. We did not find statistically significant differences between TAP and non-TAP retention rates for teachers overall or for subgroups defined by teaching assignment and years of service in CPS. The findings of no significant impacts on student achievement or teacher retention are robust to the use of different samples and estimation methods. We did not have reliable data on the quality of teachers retained or the career paths of teachers who left TAP and non-TAP schools, but will examine these aspects of teacher mobility in future reports.
Our approach to estimating the impacts of Chicago TAP is based on a hybrid study design that relies on both the random assignment of schools to year of implementation and the careful matching of TAP schools to non-TAP schools in the district. Of the 16 CPS elementary (K–8) schools that voluntarily applied for Chicago TAP and successfully completed the selection process, we randomly assigned 8 to a treatment group that began implementing TAP in 2007 (cohort 1) and

Executive Summary Mathematica Policy Research
xiv
the other 8 to a control group that began TAP in 2008 (cohort 2). In addition, CPS purposively assigned two high schools and two charter schools; however, we exclude high schools and charter schools from this report because random assignment was not possible and their data were not comparable. The experimental strategy has the advantage that any systematic differences in outcomes between cohorts 1 and 2 of TAP schools can be causally attributed to experiencing one additional year of TAP implementation. On the other hand, the pool of schools to randomize was small. There may be chance differences between the eight treatment and eight control schools that make it difficult to detect true impacts.
To complement the experimental analysis, we used propensity score matching procedures to form a non-TAP comparison group. We gathered administrative data on over 300 CPS schools that were not participating in TAP and identified the schools that were most closely matched to the TAP schools on pre-intervention characteristics such as size, school demographics, student achievement, and teacher retention. This quasi-experimental strategy does not offer the same protection against bias due to unobservable differences that the experimental strategy does. In order to infer program impacts from comparing TAP schools to matched comparison schools, we must assume that the observable characteristics used to match schools are sufficiently similar and comprehensive so that the remaining differences in outcomes can be attributed to TAP itself and not to unobserved factors, such as a dynamic principal or an especially motivated teaching staff. Nevertheless, the matched comparison group can be much larger than the experimental control group and allows us to compare TAP schools to schools that will remain non-TAP schools throughout the study period.
This second-year report focuses primarily on results from the matched comparison. We reached the same conclusions when we used alternative estimation approaches: estimating impacts separately for cohort 1 schools (those that are in their second year of TAP in 2008-2009) and cohort 2 schools (those in their first year of TAP), using alternative matching algorithms to create different matched comparison groups, and estimating impacts using different regression assumptions. We also present experimental estimates, which showed that schools with two years of TAP implementation did not have better outcomes than schools that had just begun implementing the program.
From the previous year—2007–2008—we had found no impacts on test scores for the early adopters of TAP (cohort 1), although we had found evidence of a positive impact on teacher retention in the school (Glazerman et al. 2009). Survey data covering that first year of implementation in cohort 1 schools indicated that changes had taken place inside the schools as a result of the program’s introduction. This suggested that for the period over which we have data, the lack of impacts in the second year of district rollout is not the result of a failure to implement TAP at all. At the same time, however, Chicago TAP is still in its early years of implementation and was not necessarily tested at its full strength.
Several important caveats should be noted. First, we rely heavily on the matched comparison group as an indication of what happens in the absence of TAP. We carefully chose the comparison group to be observationally similar to the TAP schools. Nevertheless, there could be unobserved reasons why non-TAP schools were on track to have better (or worse) outcomes than their counterpart schools, in which case impact estimates would be biased.

Executive Summary Mathematica Policy Research
xv
Second, the timing of the data collection should be considered in interpreting the results. Student achievement was measured in March 2009, about two-thirds of the way through the second year of TAP implementation for cohort 1 and the first year of implementation for cohort 2. Teacher reforms such as TAP take time to change attitudes and alter the school culture. This report focuses on test scores and teacher retention, which may be thought of as final outcomes that take longer to change than—and may be dependent upon—intermediate outcomes such as teacher attitudes, knowledge, or practices. The evidence is preliminary and does not reflect the impacts of the program in its steady state. The study design anticipated the possibility of startup effects at both the district and school levels as Chicago TAP is phased in over time. For example, the performance bonus amounts were low and not highly differentiated in the first year.
Finally, we caution that a lack of impact finding is simply a lack of evidence rather than a proof of no impact. We estimate that true impacts would need to have been about four percent of a standard deviation in test scores or about three percentage points of teacher retention in order for us to detect them.
Future reports will present findings from the third and fourth years of Chicago TAP rollout. In spring 2009, we randomly assigned 16 more schools to start TAP in fall 2009 (cohort 3) or fall 2010 (cohort 4). We will continue to follow the experiences of the first two cohorts and will add in the experiences of the last two cohorts. Collectively, these future reports will provide a more complete picture of the impacts of TAP implementation in its first few years.


I: Introduction Mathematica Policy Research
1
Paying and promoting teachers for their classroom performance is gaining momentum in the United States. One program in particular, the Teacher Advancement Program (TAP), which links teacher performance measures to pay as well as mentoring and professional development, has become a model for schools around the country. Below we discuss TAP, how more evidence is needed to understand its impact on teachers and students, and our approach for generating such evidence.
TAP was developed in the late 1990s by the Milken Family Foundation (MFF) as a schoolwide program to improve schools by raising teacher quality. Under the TAP model, teachers can earn extra pay and responsibilities through promotion to mentor or master teacher as well as annual performance bonuses based on a combination of their value added to student achievement and observed performance in the classroom. The model also includes weekly meetings of teachers and mentors (―cluster groups‖), and regular classroom observations by a school leadership team to help teachers meet their performance goals. The idea behind the program is that performance incentives, combined with tools for teachers to track performance and improve instruction, should help schools attract and retain talented teachers and help all teachers produce greater student achievement.
TAP has been implemented in more than 200 schools in 13 states around the country and is overseen by the National Institute for Excellence in Teaching (NIET), an organization started by MFF. The most recent expansion of TAP came via the U.S. Department of Education’s Teacher Incentive Fund (TIF), which makes grants to localities implementing performance-based compensation systems in high-need schools. These and related efforts to reform teacher pay and promotion, by the Bill and Melinda Gates Foundation among others, have aroused a great deal of interest and controversy. The question for researchers is whether or not there is any evidence that TAP or other teacher pay reforms generate the intended impacts by improving the teaching workforce and accelerating student learning.
Much of the existing evidence about the effects of TAP comes from four reports. The program developers have conducted studies of their own program (Schacter et al. 2002; 2004; Solmon et al. 2007) and one independent research team conducted a study using schools in two unnamed states (Springer et al. 2008). The two studies by Schacter et al. relied on comparison groups that were small, self-selected samples. The more recent NIET report by Solmon et al. includes larger numbers of comparison schools and teachers, a total of 61 TAP and 285 non-TAP schools across six states. As with the two earlier reports, the comparison schools were chosen as a convenience sample and may not be representative of the outcomes that would have been realized in the TAP schools had the TAP schools not adopted the program. Because TAP schools are carefully selected and they typically volunteer to go through the many steps required to adopt the program, comparisons with non-selected schools could lead to biased program impact estimates.
Springer et al. used a panel data set of math scores of TAP and non-TAP schools from two states and found positive impacts for elementary grades but undetectable or negative impacts at middle and high school grades. Importantly, the Springer et al. report presents evidence of selection

I: Introduction Mathematica Policy Research
2
effects, which is not surprising given the screening and self-selection that must take place for a school to adopt TAP. To become a TAP school, the faculty must vote to adopt the program, usually must raise substantial funds to finance the bonus pool, and often must be found worthy of the investment by NIET or a state or local sponsor.
This report focuses on one TIF grantee, the Chicago Public Schools (CPS), which began implementing TAP in 2007. The school system planned to add 10 new TAP schools each year of the grant’s four-year implementation period. Chicago’s version of TAP (called ―Chicago TAP‖) is based on the national model but with some local adaptations. For instance, the compensation amounts are set locally and the Chicago TAP model includes performance pay for principals and other school staff in addition to teachers.
Mentor teachers receive $7,000 per year and lead teachers receive $15,000 as a salary augmentation for performing their extra duties. In the first year of implementing Chicago TAP, the pool for teacher performance bonuses is supposed to support an average bonus of $2,000 per teacher based on value added to student achievement and observed classroom performance. In subsequent years, the target average payout rises to $4,000 per teacher. Principals can earn up to $5,000 each year based on the quality of program implementation and school-wide value added. Other school staff can receive up to $500 in the first year and $1,000 in subsequent years based on school-wide value added.
Data provided to the authors by CPS suggest that the teacher payouts averaged somewhat lower than the target amounts in the first two years. We found that the average performance bonus payout for the first year of implementation was approximately $1,100 per teacher, with a range of $0 to $2,045 in year 1 and $2,458 in year 2. For the second year of implementation the average payout was $2,653 with a maximum of $6,320.
Chicago TAP provides a unique opportunity to learn about the impacts of the widely implemented TAP model. To address issues of selection bias raised above, we designed a randomized experiment to estimate the impacts of TAP on student and teacher outcomes. School officials had to apply to become a TAP school, and the selection process involved an initial application, site visits by TAP and CPS staff, a faculty vote (with at least 75 percent approval), and a successful final application with responses to essay questions. Of the 16 elementary schools that went through this process and were selected by district officials as finalists, we randomly assigned 8

I: Introduction Mathematica Policy Research
3
to a treatment group that began implementing TAP in 2007-2008 and the other 8 to a control group that delayed implementation until 2008-2009.1
This report presents findings on the impacts of Chicago TAP in all 16 CPS elementary (K-8) schools in 2008-2009, the second year of rollout in the district. First, however, we provide some background based on program implementation findings from studies conducted by the research and evaluation office within CPS (Foster 2008; Crown 2010) and from other data supplied by NIET and CPS as well as the findings from a first year impact study we completed a year ago (Glazerman et al. 2009).
The national TAP office rated program implementation fidelity for the Chicago TAP schools in this study as approximately 3 points on average on a 5-point scale, where a 5 represents ―the fullest, most complete, and high quality level of implementation‖ according to Program Review Reports supplied by CPS to the authors. Every spring, NIET conducts site visits to TAP schools to verify that they are implementing the program according to the organization’s standards. Schools are rated along several dimensions and given a summary score (―cumulative program review score‖) that describes their implementation. The average scores disaggregated by year and cohort (shown in Table I.2) are close to 3.0.
An internal implementation study by CPS (Foster 2008) used stakeholder surveys and focus groups to document the degree to which staff in the TAP schools understood the program, were finding it helpful, and implemented it faithfully. The study reported that teachers required time to see TAP’s ―big picture‖ and that their understanding of the program evolved over the year. The majority of these teachers participated in the cluster activities focusing on learning new skills, such as seeing a demonstration by an expert teacher and receiving feedback from a colleague or mentor. The CPS implementation study also found that teachers reported TAP coaching to be more frequent than in the year prior to implementation and that the professional development delivered through the program was perceived as more effective than other forms of professional development.
1 All 16 schools had grades K-8, referred to in CPS as elementary schools. In addition, the district purposively
assigned 2 high schools and 2 charter schools to implement TAP—one of each beginning in 2007 and the others in 2008. We excluded high schools and charter schools from this report because random assignment was not possible and their data were not comparable. However, we will discuss charters and high schools in a future report. Twenty additional schools were assigned in March 2009 to implement TAP in 2009 or 2010. Those schools will be the subject of future impact reports from this study.

I: Introduction Mathematica Policy Research
4
In a follow-up study (Crown 2010), CPS reported a generally favorable teacher reaction to TAP implementation, with more enthusiasm for professional development and less for performance- based pay. The author found that teachers in TAP schools ―assigned favorable ratings to the impact of TAP in their schools.‖ The study cites coaching, training, and support as the key to TAP’s success. Teachers report that cluster group meetings occur weekly as planned and last at least 45 minutes in ―most, but not all‖ TAP schools. TAP teachers ―overwhelmingly endorse‖ the observation and coaching system, finding it to be ―very useful.‖ However, performance-based pay is seen to have ―a minimal impact on how teachers view their jobs, and a moderate impact on teachers’ motivation to improve their performance.‖ The survey showed that the first two cohorts of TAP teachers reported both improvements and challenges over time, with a sentiment expressed that it takes time for the program to become established.
Our study differs from the NIET and CPS efforts in that we incorporate data from non-TAP schools to provide additional context. This allows us to describe implementation and impacts relative to the norm for the district or for district schools that might have implemented TAP but did not. The first year results from our study were presented in 2009 (Glazerman et al. 2009). In that report we showed that the introduction of TAP led to reported changes inside the school that were consistent with the TAP program model. Teachers reported receiving higher levels of mentoring support than their control group counterparts. Veteran teachers reported providing support to their colleagues at levels consistent with program expectations, although their control group counterparts generally reported providing similar levels of support. Furthermore, compensation expectations for both TAP and non-TAP teachers were consistent on average with the expected payouts of performance-based bonuses, which were present in TAP schools and absent in non-TAP schools. However, these changes had not produced measurable impacts on test scores as of March 2008, the first year of the program. We did find evidence that TAP increased retention of teachers in their schools.2 We also reported that 88 percent of TAP teachers versus 83 percent of non-TAP teachers (a statistically significant difference) returned to their schools for the start of the next year (fall 2008). Teachers in TAP schools did not report higher satisfaction or more positive attitudes toward their principals than did control teachers. While we did not find evidence of impact on these positive attitudes, we also did not find evidence of negative attitudes. Specifically, we did not find any evidence that TAP, which involves differentiated pay, harmed the school climate.
The rest of this report discusses the results from our analysis of the second year of Chicago TAP rollout. In Chapter II we discuss the methods and data used and describe the characteristics of students and teachers in the study sample. The impacts of TAP on student achievement in the 2008–2009 school year are described in Chapter III and in Chapter IV we present the impacts of TAP on teacher retention. Chapter V summarizes the findings, noting important caveats and limitations, and discusses future reports from the study.
2 The analysis of teacher retention was not based on the randomized control group, but a matched comparison
group, as discussed in Chapter II of this report.

II: Methods and Data Mathematica Policy Research
5
Our approach to estimating the impacts of Chicago TAP is based on a hybrid study design that relies on both the random assignment of schools to year of implementation and the careful matching of TAP schools to non-TAP CPS schools. Below we discuss these methods in detail as well as the data on which the analysis is based and present some simple descriptive statistics on the study sample.
This study relies on a hybrid design that employs two parallel design strategies. First, we randomly assigned 16 pre-selected3 K–8 schools to either a treatment group that began implementing TAP in 2007 or to a control group that began TAP in 2008.4 The treatment group will be referred to as cohort 1 and the control group as cohort 2. Comparisons between cohorts 1 and 2 can be informative, but they have some limitations, as discussed below.
Second, we used propensity score matching to form a comparison group. We gathered administrative data on over 300 Chicago schools that were not participating in TAP and identified the schools, using methods described below, that were most closely matched to the TAP schools in order to form an additional comparison group for cohorts 1 and 2 schools.
We refer to the random assignment strategy as ―experimental‖ and the matched comparison is considered ―quasi-experimental.‖ Both design strategies have advantages that complement each other and offset disadvantages.
The experimental strategy has the advantage that any systematic differences in outcomes between cohorts 1 and 2 of TAP schools can be causally attributed to the early implementation of the program. In the first year of the study’s observation period, the 2007–2008 school year, this provides us with a comparison between TAP and non-TAP schools. In subsequent years, such as the one covered by this report, we must interpret the differences in outcomes between these cohorts as the effect of having one extra year of experience implementing the program.
A disadvantage of the experimental design is the reliance on just sixteen schools. There may be chance differences between the eight treatment and eight control schools that make it difficult to detect any true impacts.
Another drawback of random assignment to a delayed implementation status is that once the delay period is over, the control group is no longer untreated. For outcomes that can be affected by knowledge of future implementation, such as teacher retention, the randomized control group is never a pure standard of comparison. That is, the control group is also affected by TAP, although
3 The schools had been pre-selected by CPS using a series of school information sessions, initial interest
applications, and site visits to assess staff’s ability and readiness to benefit from the program.
4 We also collected data on two high schools and two charter schools, one of each was assigned by CPS to begin TAP implementation in 2007 and the others to begin in 2008. Because the charter and high schools were not randomly assigned and data was not available on test scores (for high schools) or teacher assignments (for charter schools), we focus this report on CPS elementary (K-8) schools.

II: Methods and Data Mathematica Policy Research
6
less directly than the treatment group. On the other hand, the matched comparison group can be much larger than the randomized control group and its members would continue to be non-TAP schools during the course of the study, allowing more years for a comparison between TAP and non-TAP schools. However, in order to use the matched comparison group to infer program impacts, we must assume that the observable characteristics used to match schools are sufficiently similar and comprehensive so that the remaining differences in outcomes can be attributed to TAP itself and not to other factors that were not observed, such as a dynamic principal or a motivated teaching staff.
1. Random Assignment Procedures
The schools were not assigned with equal probability to treatment and control groups. Some schools were thought by the district to be more ready to implement the program. To accommodate the preference for schools of greater readiness, we had the program manager rate each prospective school as A, B, or C, with A being most ready and C being least ready. We then assigned to the treatment group the schools in group A with the highest probability (three out of four), group B with the next highest probability (three out of seven), and group C with the lowest probability (two out of five). Comparisons between cohorts 1 and 2 in this report are weighted to reflect the unequal treatment assignment probabilities (where weights are the inverse of the assignment probabilities), so that they represent the original sample. To reflect the theoretical probability of assignment to cohort 1 or 2, matched comparison schools are given an assignment probability weight of .50, where such weights are used and all three groups are compared. As discussed below, however, the featured results combine cohorts 1 and 2 and therefore do not incorporate randomization weights. The results did not change whether we used weights or not. (Comparisons that combine cohorts 1 and 2 and that involve the matched comparison group are discussed in Section B, below).
To increase statistical precision, we randomized schools in such a way as to balance school size, the predominant race/ethnicity of the student population, and geographic location. This method is based on constrained minimization (see Glazerman et al. 2006). Specifically, we imposed constraints on the randomization that required the largest and smallest school (in terms of student enrollment) to be in the same TAP cohort (treatment or control), prevented the three schools with a student body that was not predominantly African American from being in the same cohort, and prevented either cohort from having more than one pair of schools from the same geographic area of the city.
2. Propensity Score Matching Procedures
Propensity score matching methods were used to identify non-TAP schools whose students were as nearly similar to the TAP schools as possible (see Appendix A for a technical discussion of the quality of the matches achieved). We first eliminated schools that had fewer than 50 percent of their students eligible for free or reduced price lunch. In order to be selected for TAP in Chicago, a school has to have at least 75 percent of its students qualifying for free or reduce price lunch. We also eliminated from consideration any schools that had been selected to implement TAP beginning in either fall 2009 or 2010. Teacher behavior in these schools may have been influenced by their knowledge that the school was slated to begin the program in the near future. Then we matched the remaining schools along dimensions we believed to be related to the study’s outcomes of interest: student achievement and teacher retention. All variables were measured before any schools implemented TAP. We matched along the following dimensions:
School size, measured using student enrollment and student enrollment squared (to capture non-linearities in the relationship between size and outcomes)
II: Methods and Data Mathematica Policy Research
7
Teacher retention, measured as the percentage of novice teachers (with less than 5 years of experience) in 2005 who returned to the school in 2006 and the percentage of mid-career teachers (5–24 years of experience) in 2005 who returned in 2006
School accountability status, measured as indicators of the number of years since the school last met adequate yearly progress (AYP) as of 2006–2007
Student achievement, measured using average math and reading scores on the Illinois Standards Achievement Test (ISAT) from March 2007, standardized within grade across the district
Student race/ethnicity, measured as the percentage of students in 2006–2007 who were non-Hispanic African American or Hispanic, collapsed into three categories: more than two-thirds, between one-third and two-thirds, and less than one-third
Student poverty, measured as the percentage of students qualifying for free or reduced price lunch
High truancy, measured as an indicator for schools that have more than 50 percent of its students truant during the 2006–2007 school year
The procedure itself is a propensity score match with a fixed caliper. That means that we listed the observable factors that predict selection into the TAP finalist pool (treatment or control) and used them in a logistic regression model to predict the probability of being in that pool. The predicted probability (―propensity score‖) from this model was used to rank all the schools sequentially along a number line, and each TAP school (cohort 1 or 2) was matched to all of the non-TAP schools whose propensity score fell within a fixed distance or caliper.5 If non-TAP schools matched with more than one TAP school, then they received proportionally more weight in the analysis.
The result of this matching was a group of non-TAP schools that was observationally similar to the TAP schools once we applied the appropriate weights. The degree of similarity is illustrated in Section D of this chapter and in Appendix A, which provides more technical details on the matching. We made our decision to feature results using the particular matching algorithm and caliper size that we chose before seeing the outcome data, based solely on the quality of the match. However, we drew the same conclusions when we used alternative matching methods.
The impacts of TAP can be estimated by comparing the outcomes observed in TAP schools to those observed for similar non-TAP schools. The non-TAP schools are used to approximate the counterfactual condition, that is, the outcomes that would have been observed had the TAP schools not implemented the program. After two years of TAP in Chicago, we have several comparisons to choose from. Cohorts 1 and 2 can be considered individually or together—and there are several
5 We determined that a caliper with a radius size of 0.025 produced the most efficient matches but we repeated all
the analyses using different caliper sizes. We also used different matching algorithms including ones that selected the nearest neighbor on the number line, nearest five neighbors, and all neighbors with weights related to distance (known as kernel density matching).

II: Methods and Data Mathematica Policy Research
8
ways to form a comparison group of non-TAP schools, depending on which matching algorithm we follow.
We focus here primarily on results from the comparison of all TAP schools (cohorts 1 and 2) with the matched comparison group of non-TAP schools. We then show that we generally reach the same conclusions if we use any of the alternative approaches: use cohort 1 schools alone (those that are in their second year of TAP in 2008–2009) and cohort 2 schools alone (those in their first year of TAP), if we use alternative matching algorithms, and if we estimate impacts using different regression assumptions. All of these results are quasi-experimental.
The ―experimental‖ comparison is somewhat more difficult to interpret for the 2008–2009 school year. It represents the effect, in a TAP school’s second year, of a one-year implementation head start. In a design report (Glazerman et al. 2007), we proposed summing the experimental impacts from years 1 and 2 to obtain the cumulative impact of implementing TAP for two years. While we present these estimates as well, the evidence from the two years and two cohorts does not support the hypothesis that TAP impacts are positive and grow over time, so the 2008-2009 experimental comparison is less informative and plays a less prominent role in the presentation of findings than the quasi-experimental comparison.
1. Dropouts, Consolidations, and School Closures
Effective for the 2009–2010 school year, two TAP schools discontinued the program and another TAP school was closed and its faculty and students consolidated with a non-TAP school. These events pose a complication for the estimation of TAP impacts. Fortunately, the matching method provides a straightforward solution because each school effectively has its own comparison group. Thus, if a TAP school discontinues the program, we assume that the matched non-TAP school(s) would likely have discontinued the program as well, had they originally adopted the program.
For the test score analysis, we did not need to make any adjustments to account for these transitions. Because the staff knew of these changes late in the 2008–2009 school year, we assume that they did not affect the March 2009 test score results.
For the teacher retention analysis, however, we did have to drop some observations from the analysis. This analysis measures the outcome (teachers returning to the same school or to the district) as of fall 2009—after the school changes took place—so we dropped the affected schools and their matches. Specifically, we dropped from the analysis the two program leavers and the consolidating school as well as their comparison group counterparts.
2. Regression-Adjusted Means
When presenting outcomes in this report, we typically show ―regression-adjusted‖ means. A regression-adjusted mean for a particular group (e.g., TAP schools) represents a predicted average outcome for the entire analysis sample (including non-TAP schools) if everyone had been assigned to that group. The prediction is based on a regression model—a linear model for continuous outcomes and a logistic model for dichotomous outcomes—that controls for a range of teacher or student characteristics. Regression-adjusted means have the useful property that their difference equals the impact estimate, although they do typically differ slightly from the unadjusted mean.
II: Methods and Data Mathematica Policy Research
9
By way of illustration, the regression-adjusted mean 2009 ISAT test score in reading was 219.6 for students in TAP cohort 1 schools when we used the sample that included only TAP cohorts 1 and 2 schools. When we compared cohort 1 schools to matched comparison schools, we obtained a regression-adjusted mean outcome in the TAP schools of 225.6 points on the reading ISAT. The discrepancy of 6.0 points simply represents the difference in the types of students who happened to be in each sample, neither of which is incorrect, and does not affect the impact estimate, which remains unbiased.
For teacher retention analyses, the regression model controlled for teacher education (having a master’s or higher degree), teaching assignment (teaching a tested or non-tested academic subject in grades four through eight), years of service in CPS, teacher retention at the school (percentage of novice teachers and percentage of mid-career teachers in 2005 who returned to the school in 2006), student achievement (average math and reading ISAT scores), student race/ethnicity (percentage of students who were African American or Hispanic), student language (percentage of students who were limited English proficient), student poverty (percentage of students who qualified for free/reduced-price lunch), and school size. For student test score analyses, we controlled for family poverty (eligibility for free/reduced-price lunch), special needs (whether an individualized education plan was in place), language (whether limited English proficient), race/ethnicity, grade level, and over normal age for a grade. We accounted for the clustering of students or teachers within schools by estimating robust standard errors. In addition, we conducted numerous sensitivity tests to determine whether the results were robust to the choice of regression model or other decisions. Those tests are described in more detail in the discussion of findings.
The data from this report come from CPS—assessment data from student testing records and information on teachers from human resources records.
1. Student Achievement Data
We obtained student assessment data on tests routinely collected by CPS including test scores on state assessments in mathematics and reading for grades three through eight. In addition, we obtained data on student background information, such as race, gender, free/reduced-price lunch eligibility, enrollment status, and disability or special education status. CPS provided these data for the 2006–2007 through 2008–2009 school years and we will request future years of data through at least 2010–2011 for future reports.
To support TAP and related policies for data-driven school improvement, researchers at the University of Wisconsin provided CPS with estimates of each school’s value added to student achievement. In addition to our analysis of student-level test score data, we also examined the school value-added measures and found similar conclusions, although with far less statistical precision.
2. Administrative Teacher Data
Administrative records data on teacher credentials, years of service in the district, and teaching assignment were provided to us by the CPS department of human resources. Data covers the 2005–2006 through 2009–2010 school years and the study aims to request similar data in future years.

II: Methods and Data Mathematica Policy Research
10
Figures II.1 through II.3 show the characteristics of the schools in the study by examining their students at baseline and their teachers during the study period. The statistics are presented by school group, with students and teachers in TAP cohort 1 schools compared to their counterparts in cohort 2 and matched comparison schools. We present tests of statistical significance of the difference between cohort 1 and each of the other two groups. Readers should be aware that statistical significance is not the same as policy relevance. A great degree of similarity in these observable student and teacher characteristics is reassuring, but not necessary for unbiased estimation of the experimental impacts of TAP because we control for observable differences through regression adjustment. What is required is that the groups be similar in terms of unobserved determinants of student achievement growth and teacher retention. Readers should exercise caution in interpreting the quasi-experimental findings because these unobserved determinants of student achievement and teacher mobility may be confounded with TAP status, leading to bias of unknown direction and magnitude.
Figure II.1 shows the balance in terms of characteristics of the students attending in 2006-2007, the year before TAP was introduced.6 Race/ethnicity and family income are proxied by eligibility for free/reduced-price lunch. The cohort 2 schools had significantly more African American and fewer Hispanic students than cohort 1 schools at baseline. Some difference along this dimension was unavoidable even with random assignment (or any assignment rule) because there were only three schools without a majority of African-American students and three cannot be divided evenly between two groups. For the same reason, cohort 2 schools had fewer limited English proficient (LEP) students as well. The percentage of students with low family income (percent eligible for free/reduced-price lunch) was more than 90 percent in the cohort 1, cohort 2, and comparison groups, although the cohort 1 versus cohort 2 difference (97 versus 94 percent) was statistically significant. We did find not any statistically significant differences between cohort 1, cohort 2, or matched comparison schools in terms of 2007 test scores (Figure II.2); nor did we find any significant differences in the characteristics of teachers in cohort 1 schools and cohort 2 or comparison schools in 2008-2009 (Figure II.3).
6 These student characteristics are presented to illustrate the types of schools included in the study but are not
identical to the students who were used in the test score analysis sample pertaining to the 2008-2009 school year. We tabulated statistics for those students from the impact analysis sample and found similar results as those presented here.

II: Methods and Data Mathematica Policy Research
11
86
13
0
98
5
15
5
30
93
5
0
95
0
15
6
29
86
12
1
94
3
15
7
29
0 10 20 30 40 50 60 70 80 90 100
*African American
*Hispanic
#Other/unknown
*#Eligible for free/reduced-price lunch
*Limited English proficient
Special education(has Individualized Education Program)
#Changed schools
Over age for grade
Cohort 1 Cohort 2 Matched Comparison

II: Methods and Data Mathematica Policy Research
12
226
212
224
211
224
211
180 190 200 210 220 230 240
ISAT 2007 Math
ISAT 2007 Reading
Cohort 1 Cohort 2 Matched Comparison

II: Methods and Data Mathematica Policy Research
13
Differences cohort 1 and cohort 2 teachers and between cohort 1 and matched comparison teachers are not statistically significant at the 10% level.
60
39
29
10
37
54
60
30
35
10
36
57
60
34
31
11
32
58
0 10 20 30 40 50 60 70 80 90 100
Master's or higher degree
Taught academic subject, tested grade
Taught academic subject, nontested grade/subject
Years of service
< 5 years of service
5 to 24 years of service
Cohort 1 Cohort 2 Matched Comparison


III: Impact on Student Achievement Mathematica Policy Research
15
According to CPS, Chicago TAP was designed to support and develop high quality teaching, which in turn would boost student learning (Chicago TAP 2009). Consequently, student test scores are the main outcomes of interest for the study. We focus on tested grades and subjects: math and reading in grades four through eight. This chapter explains our findings—after the second year of CPS rolling out TAP, we found no evidence that the program was associated with increases in student test scores.
As discussed in Chapter II, we followed three groups of schools: one group began implementing TAP in fall 2007 (cohort 1), one in fall 2008 (cohort 2), and the third group was not scheduled to implement TAP at all. TAP schools were assigned by lottery to cohort 1 or 2 so that the only systematic difference between those two groups of schools was the timing of their TAP implementation. The no-TAP comparison group was formed using propensity score matching, also discussed in Chapter II.
We first summarize the data for these groups over time in Figures III.1 and III.2. The data are descriptive and may reflect many factors beyond TAP implementation, but they serve as a useful starting point for examining outcomes for the study population.
Also discussed in Chapter II, all three groups had similar ISAT test scores in March 2007, before TAP began. In fact, each group of schools had average ISAT scores within one point of the others in reading (Figure III.1) and two points in math (Figure III.2).7 In March 2008, after TAP had been introduced in cohort 1 schools, the test scores for the three groups were higher for the two groups that were not implementing TAP in that year, but scores for all three groups were still within two points of each other.
The scores for the third year, 2009, present a more pronounced version of the same pattern observed in 2008. The mean test scores for cohort 2 schools were five points higher than cohort 1 schools in reading and four points in math. In that year, however, both cohorts 1 and 2 were implementing TAP. The cohort 1 schools were in their second year of the program and the cohort 2 schools had just begun implementation. The average test scores of cohort 2 schools were three points higher than the non-TAP schools in both subjects.8
The mean test scores shown in Figures III.1 and III.2 are not adjusted to account for variations in grade level and student background characteristics, which are important for making apples to apples comparisons. The rest of this chapter presents regression-adjusted means for each group and
7 For perspective, these numbers can be compared to the standard deviations of the ISAT scores, which varied by
grade and subject but were approximately 25 points within grade level—27 points across grades for reading and 30 points across grades for math.
8 The unadjusted test scores in Figures III.1 and III.2 include students in grade 3, who were not included in the impact estimation sample because they did not take a test in the prior year. The patterns of unadjusted scores for grades 4 through 8 (not shown) are nearly identical to those presented here.

III: Impact on Student Achievement Mathematica Policy Research
16
formal hypothesis tests to determine the statistical significance of each contrast. As we show, the impact of TAP on test scores is not statistically significant.
211214 214
211215 217
212 213 212
185
195
205
215
225
235
245
March 2007 March 2008 March 2009
ISATReading
Score
Comparison Cohort 2 Cohort 1
FirstYearof TAP
FirstYearof TAP
SecondYearof TAP
224 225 226224 226229
226 225 225
195
205
215
225
235
245
255
March 2007 March 2008 March 2009
ISATMathScore
Comparison Cohort 2 Cohort 1
FirstYearof TAP
FirstYearof TAP
SecondYearof TAP

III: Impact on Student Achievement Mathematica Policy Research
17
Below we present estimates of the impact of TAP schools in the second year of rollout—cohort 1 schools in their second year and cohort 2 schools in their first year. An earlier report from this study showed that by March 2008, the schools implementing TAP in 2007–2008 (cohort 1) did not have significantly higher test scores than the comparison group of non-TAP schools(Glazerman et al. 2009).
The results summarized in Table III.1 show that the differences in reading and math test scores between students in TAP schools and similar non-TAP schools were not statistically significant in March 2009. The regression-adjusted ISAT math and reading scores, shown in Table III.1, control for baseline test scores and student background characteristics. These results represent the estimated mean scores in March 2009 from a growth model, which accounts for the March 2008 achievement level. The estimated score for students in a TAP school was 226 points on the reading test, the same as that for students in comparison schools. For math, the estimated impact (242 scale points for TAP versus 241 for comparison) was equal to two percent of a standard deviation and was not statistically significant.9
Disaggregating the results by grade level conveys a similar picture of no significant differences between TAP and non-TAP comparison students. Because the ISAT is vertically scaled, the scores should be higher for each grade level and the score level comparisons within grade have a more meaningful interpretation. In fact, they can be compared to state-set criteria for whether the students are meeting standards. The average reading and math scores shown in Table III.2 were in the category for ―meets standards‖ for every grade and both subjects.10 None of the TAP-comparison differences was statistically significant.
9 Standard deviations used to calculate effect sizes are derived from the distribution of the full sample for each
outcome. Grade three is not included in the benchmark impact analysis because there is no pretest.
10 The range of scores that define each category can be found in the official 2009 guide to the ISAT issued by the state (Illinois State Board of Education 2009).

III: Impact on Student Achievement Mathematica Policy Research
18
We found that the results were robust. To test the sensitivity of the findings, we re-estimated the test score impacts several times, with each new model making one change to the model used in Table III.1. We refer to this as the benchmark against which alternative models are compared. The results are summarized in Tables III.3 and III.4. For our sensitivity tests, we estimated impacts with weights that accounted for the unequal assignment probabilities of schools to cohort 1 or 2 (referred to as ―readiness weights‖ after the measure of readiness used to stratify the schools before random assignment), with limited or no covariates, with a specification that treated the school effect as a random variable, and with specifications that correct for pretest measurement error using a variety of methods. We also tried several alternative methods for constructing the comparison group and found that the matching method did not make a substantial difference.11 The impact estimates changed only slightly under the alternative specifications and their size was always within two or three hundredths of a standard deviation in student test scores for both reading and math. None of the differences was statistically significant.
11 The alternative matching algorithms are described in Chapter II. The different algorithms make tradeoffs
between quality of the match and quantity of units matching to the original. In some cases we lose the ability to include certain Chicago TAP schools for which we cannot find acceptable matches, but the results did not change when we restricted the sample in this way.

III: Impact on Student Achievement Mathematica Policy Research
19

III: Impact on Student Achievement Mathematica Policy Research
20
The findings presented above combined cohorts 1 and 2 to obtain an overall estimate of the
TAP effect in 2008–2009. We examined whether the average impact estimate masked significant impacts for one cohort or the other and found that it did not. Table III.5 presents impact estimates for the TAP group defined as cohort 1 only or cohort 2 only, in each case comparing to the matched comparison group. In both cases the impact estimate was not significantly different from zero for reading or for math. We conducted sensitivity tests for these contrasts using the same approach as the sensitivity analysis presented above and found that the lack of significant impacts was a robust finding.

III: Impact on Student Achievement Mathematica Policy Research
21
It is possible that unobservable differences between the TAP schools and their matched comparisons are confounded with treatment effects. For example, if the TAP selection process identified the schools that were struggling the most despite similarities with other schools in terms of test scores and demographics, then the observed impact estimates would understate the true impacts of TAP. If this were the case, then an alternative approach would be to rely only on experimental impacts (those determined through random assignment of schools to cohort 1 or 2). The experimental impact after two years would be defined as the sum of year 1 differences between cohorts 1 and 2 and year 2 differences between the same sets of schools (Glazerman et al. 2007). For example, if TAP has a beneficial impact that increases over time as schools gain experience with the program, we would expect to see a positive difference, favoring cohort 1 relative to cohort 2, in each year. The positive difference (in favor of cohort 1) in year 2 would indicate an improvement in average student achievement during the second year of implementation beyond that experienced in the first year of implementation.
The data, however, are not consistent with a hypothesis that TAP has a more beneficial effect as schools spend more time with the program. Table III.6 shows that the differences in the first year, while not statistically significant, favor cohort 2, which had not yet begun implementing TAP; differences in the second year still favored cohort 2. Thus, the estimated cumulative experimental effect is negative. When we estimated the cumulative experimental impact using longitudinal data (see Appendix B), we were able to conduct a formal test of the statistical significance of the cumulative impact estimate. The cumulative effect was negative and statistically significant for both math and reading. When we accounted for the fact that TAP may have improved outcomes in cohort 2 schools, however, the cumulative experimental impact was smaller and not significantly different from zero.

III: Impact on Student Achievement Mathematica Policy Research
22
These findings could mean that either starting TAP too early had a harmful effect on a school’s ability to raise student achievement or that there was a difference between the two groups, where cohort 2 happened to have better outcomes.
Unfortunately, the data supported the possibility of both hypotheses being correct without being able to distinguish between them. We complemented the experimental analysis by estimating a regression using the longitudinal data set including cohorts 1 and 2 and the matched comparison schools. This analysis included student test score and demographic data from 2007–2009. Using this approach, we estimated an overall TAP effect, a cohort effect, and the experimental impact (TAP interacted with cohort). These analyses made the most efficient use of the pre-intervention measures of the outcomes, providing measures of student growth over time for each school. The result was that the cohort effect, which favored cohort 2, was statistically significant for reading but not math. The TAP effect for cohort 1 was negative and significant for reading, but not for math. All of the effect estimates, both positive and negative, were less than 2 ISAT points. The full set of results is presented in Appendix B.
IV: Impact on Teacher Retention Mathematica Policy Research
23
TAP is hypothesized to help schools retain their best teachers by rewarding performance, providing professional development and leadership opportunities, and creating a sense of a career ladder. In this chapter we examine the impacts of TAP on teacher retention rates, defined as the percentages of teachers returning to the school or the district from year to year, or in some cases over a longer period. We did not find a detectable difference between TAP and similar non-TAP schools on teacher retention in the school or district during the second year the program was rolled out in the district. In future reports, when more detailed data are available, we will examine the groups of teachers retained and follow the career paths of those who left TAP and non-TAP schools.
As noted in Chapter II, knowledge of a school’s future TAP implementation may influence the career plans of its teachers. The two TAP cohorts learned of their future participation in spring 2007, with implementation to begin in fall 2007 for cohort 1 and fall 2008 for cohort 2; schools in the third group, the matched comparison group, were not scheduled to implement TAP at all.
Figures IV.1 and IV.2 show school and district retention rates, respectively, for the three groups over time.12 These data are descriptive and may reflect many factors beyond TAP implementation, but they serve as a useful starting point for examining outcomes for the study population.
In 2005–2006, prior to any knowledge of future TAP participation, all three groups had similar school retention rates (Figure IV.1). Each group had an average school retention rate within one point of the other two groups.
More pronounced differences in school retention rates emerged in 2006–2007, the year when the TAP cohorts learned when they would start TAP. Cohort 2 and non-TAP comparison schools continued to have average rates that were within one point of one another. However, the average school retention rate in cohort 1 schools exceeded that of the other two groups by more than seven percentage points.
12 Due to differences in data availability, the definition of retention varies slightly across years. The 2005–2006
school retention rate is defined as the percentage of fall 2005 classroom teachers who returned to the same schools as classroom teachers in fall 2006. For 2006–2007 and all subsequent years, the school retention rate is defined as the percentage of classroom teachers who returned to the same schools in any education-related capacity, regardless of whether they are a classroom teacher. Similarly, the 2005–2006 district retention rate is the percentage of fall 2005 classroom teachers who return to CPS as classroom teachers, whereas the district retention rate in subsequent years is the percentage of teachers who return to CPS in any education-related capacity. We did not have the data to create the more general set of retention variables for 2005–2006. For 2006–2009, the results are substantively similar regardless of which set of definitions we use.

IV: Impact on Teacher Retention Mathematica Policy Research
24
In 2007–2008, the TAP cohorts exhibited school retention rates that were similar to one another but higher than the average retention rate in the non-TAP comparison schools. Average school retention rates at cohort 1 and 2 schools differed by less than one point. For both TAP cohorts, school retention rates exceeded the comparison group rates on average by nearly four points.
All three groups experienced similar school retention rates to one another in 2008–2009. In that
school year, when both cohorts 1 and 2 were implementing TAP, the average retention rate for cohort 1 schools was about one point higher than the average rates for the other two groups.
Average district retention rates between groups differed by three or fewer points each year (Figure IV.2). In 2005–2006, each group had an average district retention rate within three points of the other two groups. Unlike the finding for school retention, we did not find a pronounced difference between cohort 1 schools and the other schools (cohort 2 or non-TAP comparison) in 2006–2007; the cohort 1 average district retention rate was within three points of the cohort 2 rate and within one point of the comparison group rate. In 2007-2008, the average district retention rate in cohort 1 exceeded the comparison group rate by less than three points and was within one point of the cohort 2 rate. In 2008–2009, average district retention rates in the TAP cohorts were nearly identical to one another and exceeded the non-TAP comparison group rate by less than one point.
The average retention rates shown in Figures IV.1 and IV.2 are not regression adjusted and may reflect differences in school or teacher background characteristics that are not related to TAP. In the remainder of this chapter we present regression-adjusted findings for the second year of TAP implementation in CPS. We focus on the comparison between all TAP schools with the non-TAP matched comparison group and conduct formal hypothesis tests to determine whether the differences are likely to be ―real‖ or just reflective of chance differences. As discussed below, we do
76 7482 83
7773
86 8377
8186 84
0
10
20
30
40
50
60
70
80
90
100
2005–2006 2006–2007 2007–2008 2008–2009
Per
cen
t R
etu
rnin
g to
Sam
e Sc
ho
ol
Comparison Cohort 2 Cohort 1
FirstYearof TAP
FirstYearof TAP
SecondYearof TAP

IV: Impact on Teacher Retention Mathematica Policy Research
25
not find evidence of a statistically significant impact of TAP on either school retention or district retention.
Below we present regression-adjusted estimates of the impact of TAP from the second year of rollout. Results from the first year—2007–2008—suggested that TAP increased the retention rate of teachers in their schools (Glazerman et al. 2009). In the second year, we found evidence of a positive impact on school retention in cohort 1 schools both for teachers overall and for teachers in non-tested academic subjects, although we were not able to detect impacts for other teaching assignment subgroups. We did not find a measurable impact on district retention.
After controlling for teacher baseline characteristics, we did not find a detectable impact of TAP on school retention during the second year (Table IV.1). For TAP schools (cohorts 1 and 2 combined), we estimated that 85 percent of 2008–2009 teachers returned to the same schools in 2009–2010, versus 84 percent for comparison schools; this one-point difference was not statistically significant.
We hypothesized that teachers in tested grades would behave differently than those in non-tested grades because they differed in their ability to affect value-added measures that help determine performance-based compensation. We did not find evidence in support of this hypothesis. For each teaching assignment subgroup, average school retention rates differed by less than two points between TAP and non-TAP schools; the differences were not statistically significant.

IV: Impact on Teacher Retention Mathematica Policy Research
26
We also examined teacher experience subgroups, defined by years of service in CPS. None of the TAP-comparison differences by years of service subgroups was statistically significant.
We did not find statistically significant differences when we defined retention as staying in the district. Table IV.2 shows the percentage of 2008–2009 teachers in TAP and non-TAP comparison schools who returned to CPS in 2009–2010. We found no significant differences overall. The regression-adjusted district retention rate for TAP teachers was 95 percent and for teachers in comparison schools it was 94 percent. None of the subgroup impacts, also shown in Table IV.2, was statistically significant.
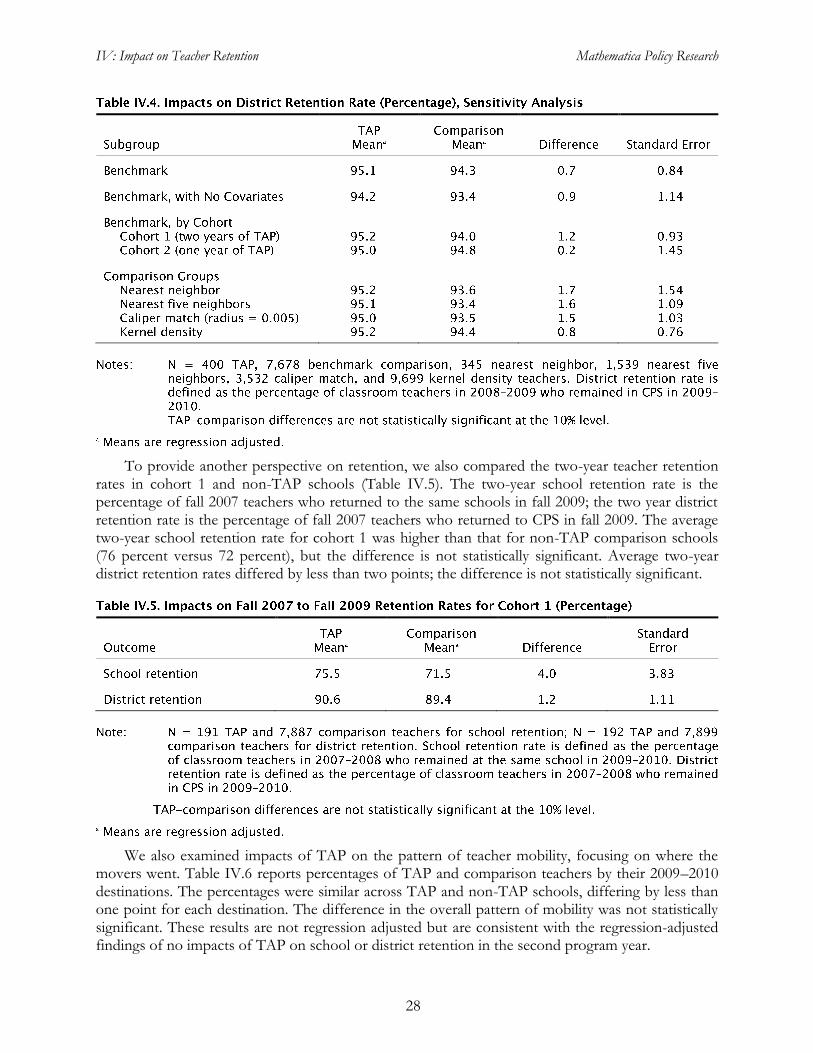
As shown in Tables IV.3 and IV.4, the findings of no detectable impact on teacher retention is robust to several alternative estimation approaches. Comparing unadjusted average school retention rates—that is, estimating the impact without covariates—yielded a difference of less than one point between TAP and non-TAP schools (Table IV.3). When we estimated the school retention impact separately by cohort, comparing each TAP cohort to the non-TAP matched comparison group, we again did not find significant impacts. We also tried several alternative algorithms to construct the non-TAP matched comparison group; none of the differences between the TAP group and the alternative comparison groups was statistically significant. The lack of a statistically significant impact on district retention is similarly robust to these alternative approaches (Table IV.4).

IV: Impact on Teacher Retention Mathematica Policy Research
27
IV: Impact on Teacher Retention Mathematica Policy Research
28
To provide another perspective on retention, we also compared the two-year teacher retention rates in cohort 1 and non-TAP schools (Table IV.5). The two-year school retention rate is the percentage of fall 2007 teachers who returned to the same schools in fall 2009; the two year district retention rate is the percentage of fall 2007 teachers who returned to CPS in fall 2009. The average two-year school retention rate for cohort 1 was higher than that for non-TAP comparison schools (76 percent versus 72 percent), but the difference is not statistically significant. Average two-year district retention rates differed by less than two points; the difference is not statistically significant.
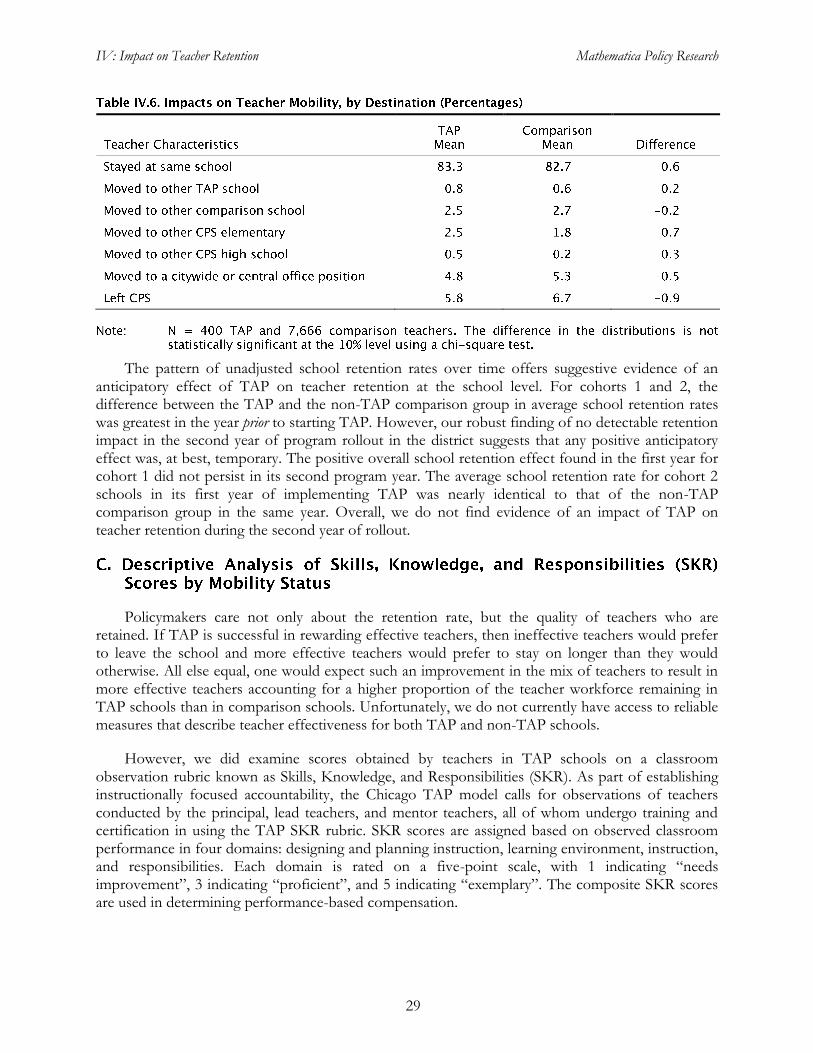
We also examined impacts of TAP on the pattern of teacher mobility, focusing on where the movers went. Table IV.6 reports percentages of TAP and comparison teachers by their 2009–2010 destinations. The percentages were similar across TAP and non-TAP schools, differing by less than one point for each destination. The difference in the overall pattern of mobility was not statistically significant. These results are not regression adjusted but are consistent with the regression-adjusted findings of no impacts of TAP on school or district retention in the second program year.
IV: Impact on Teacher Retention Mathematica Policy Research
29
The pattern of unadjusted school retention rates over time offers suggestive evidence of an anticipatory effect of TAP on teacher retention at the school level. For cohorts 1 and 2, the difference between the TAP and the non-TAP comparison group in average school retention rates was greatest in the year prior to starting TAP. However, our robust finding of no detectable retention impact in the second year of program rollout in the district suggests that any positive anticipatory effect was, at best, temporary. The positive overall school retention effect found in the first year for cohort 1 did not persist in its second program year. The average school retention rate for cohort 2 schools in its first year of implementing TAP was nearly identical to that of the non-TAP comparison group in the same year. Overall, we do not find evidence of an impact of TAP on teacher retention during the second year of rollout.
Policymakers care not only about the retention rate, but the quality of teachers who are retained. If TAP is successful in rewarding effective teachers, then ineffective teachers would prefer to leave the school and more effective teachers would prefer to stay on longer than they would otherwise. All else equal, one would expect such an improvement in the mix of teachers to result in more effective teachers accounting for a higher proportion of the teacher workforce remaining in TAP schools than in comparison schools. Unfortunately, we do not currently have access to reliable measures that describe teacher effectiveness for both TAP and non-TAP schools.
However, we did examine scores obtained by teachers in TAP schools on a classroom observation rubric known as Skills, Knowledge, and Responsibilities (SKR). As part of establishing instructionally focused accountability, the Chicago TAP model calls for observations of teachers conducted by the principal, lead teachers, and mentor teachers, all of whom undergo training and certification in using the TAP SKR rubric. SKR scores are assigned based on observed classroom performance in four domains: designing and planning instruction, learning environment, instruction, and responsibilities. Each domain is rated on a five-point scale, with 1 indicating ―needs improvement‖, 3 indicating ―proficient‖, and 5 indicating ―exemplary‖. The composite SKR scores are used in determining performance-based compensation.
IV: Impact on Teacher Retention Mathematica Policy Research
30
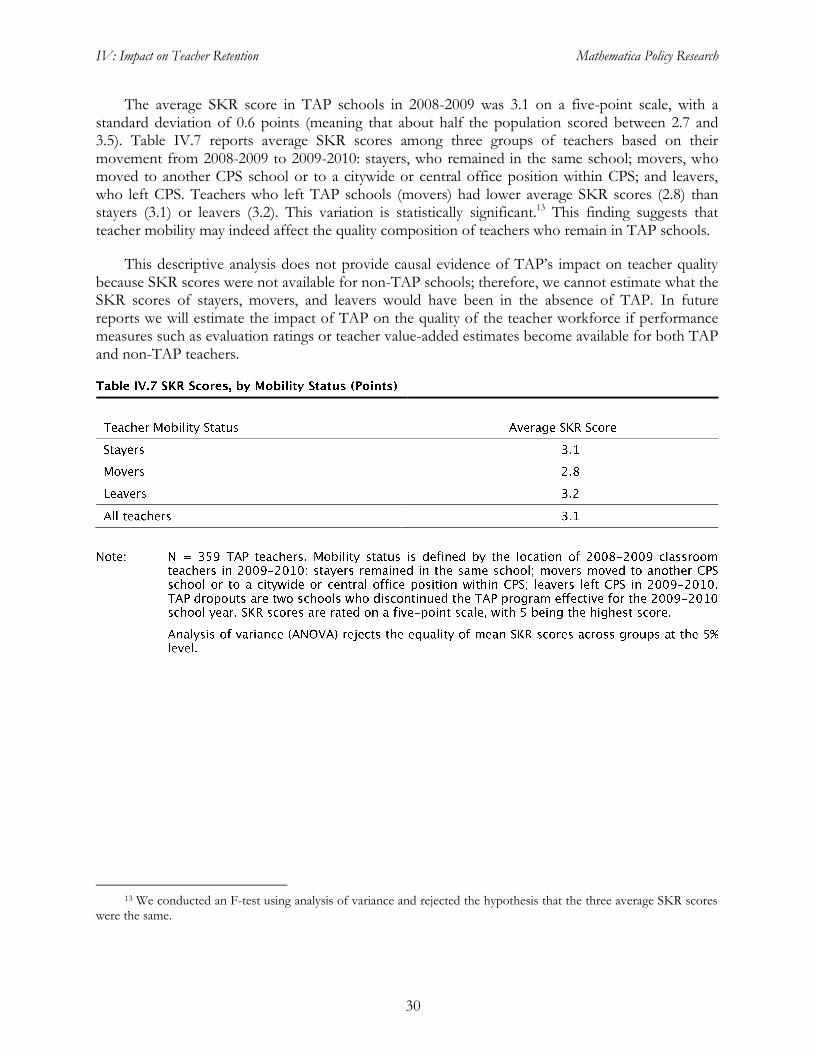
The average SKR score in TAP schools in 2008-2009 was 3.1 on a five-point scale, with a standard deviation of 0.6 points (meaning that about half the population scored between 2.7 and 3.5). Table IV.7 reports average SKR scores among three groups of teachers based on their movement from 2008-2009 to 2009-2010: stayers, who remained in the same school; movers, who moved to another CPS school or to a citywide or central office position within CPS; and leavers, who left CPS. Teachers who left TAP schools (movers) had lower average SKR scores (2.8) than stayers (3.1) or leavers (3.2). This variation is statistically significant.13 This finding suggests that teacher mobility may indeed affect the quality composition of teachers who remain in TAP schools.
This descriptive analysis does not provide causal evidence of TAP’s impact on teacher quality because SKR scores were not available for non-TAP schools; therefore, we cannot estimate what the SKR scores of stayers, movers, and leavers would have been in the absence of TAP. In future reports we will estimate the impact of TAP on the quality of the teacher workforce if performance measures such as evaluation ratings or teacher value-added estimates become available for both TAP and non-TAP teachers.
13 We conducted an F-test using analysis of variance and rejected the hypothesis that the three average SKR scores
were the same.

V: Summary and Discussion of Findings Mathematica Policy Research
31
This report focused on student and teacher outcomes in CPS K-8 elementary schools during the 2008–2009 school year, the second year of Chicago TAP’s rollout. During that year, there were eight elementary schools in their second year of implementation and eight more in their first year. We compared these 16 schools as a group to a carefully matched group of comparison schools and found that test score growth was not measurably better, nor were there detectable impacts on the rates at which teachers were retained in the school or in the district. The finding of no significant impacts is robust to the use of different samples and methods.
From the previous year—2007–2008—we had found no impacts on test scores for the early adopters of TAP, although we had found evidence of a positive impact on teacher retention in the school (Glazerman et al. 2009). Survey data covering that first year of implementation in cohort 1 schools indicated that changes had taken place as a result of the program’s introduction. This suggested that for the period over which we have data, the lack of impacts is not the result of a failure to implement TAP at all. However, it should be noted that the Chicago TAP is being phased in over time, as discussed below, and was not necessarily tested at its full strength.
The first point of caution regarding the study findings is methodological. Readers should be aware that the new results presented in this report pertain to the period after the randomized control group (cohort 2) had begun to implement TAP, and therefore we rely heavily on the matched comparison group as an indication of what happens in the absence of TAP. This aspect of the study design assumes that the outcomes for observationally similar non-TAP schools represent the outcomes we would have observed had the TAP schools not implemented the program. As shown in Appendix A, the non-TAP schools were a close fit to the TAP schools on a number of school characteristics thought to be related to study outcomes. Nevertheless, there could be unobserved reasons why non-TAP schools were on track to have better (or worse) outcomes than their counterpart schools. For example, schools could have been chosen for TAP because their principals and teaching faculty were motivated to change, in which case the impact estimate would be upward biased. Alternatively, the schools selected for TAP could have been those facing challenges that are not reflected in the objective administrative data we used for matching, in which case the observed impact estimates would be downward biased.
Another important factor to account for in interpreting the results is the timing of data collection. Student achievement was measured in March 2009. This is about two-thirds of the way through the second year of TAP implementation for cohort 1 and the first year of implementation for cohort 2. To the extent that teacher reforms such as TAP take time to change attitudes and alter the school culture, the evidence is preliminary and does not reflect the impacts of the program in its steady state.
Specifically, timing is important because the TAP program is phased in over time and the study design anticipated the possibility of startup effects at both the district and school levels. We focused on test scores and retention, which may be thought of as final outcomes that take longer to change

V: Summary and Discussion of Findings Mathematica Policy Research
32
than—and may be dependent upon—intermediate outcomes such as teacher attitudes, knowledge, or practices. At the district level, three aspects of the program were evolving:
1. Capacity to measure teacher performance resulted in a performance pay component that has been phased in over time. In the first year of the program rollout, the district was unable to systematically link student test scores to individual teachers, so TAP’s performance pay formula was based on school average value added (staff contribution to student achievement growth) in addition to classroom observation measures. In the second year the payouts were tied to value added that was measured at the grade level and subject within each school. By the 2008-2009 school year, the observation period for this report, the district had not begun routine reporting of value-added measures of performance at the level of the individual teacher. These changes affect the degree to which pay can be meaningfully differentiated.
2. CPS staff are gaining experience implementing the model. The effectiveness of TAP cohorts may vary over time as CPS learns how to select schools to participate, train school staff, and maintain program support for an increasing number of TAP schools.
3. The average size of the performance incentives is initially small by design and grows after the first year of implementation. The program’s founding document sets an average teacher bonus pool of $2,000 in the first year and $4,000 in subsequent years. Payout data from the district suggest that the actual performance based payouts were smaller, averaging approximately $1,100 in the first year and $2,700 in the second year.
4. General awareness of the program’s incentive component may require time to diffuse to teachers. As with any employee incentive program, the impact of offering bonuses may be greater over time as more people become familiar with the payouts and the relationship between payouts and performance. The first set of payments was made along with a public announcement in December 2008, more than three months into the second year of the rollout.
At the school level there may be additional startup effects. Mentor and lead teachers have to become accustomed to their roles, trained as observers and mentors, and gain experience with the TAP system of cluster group meetings and observations. It is possible that these activities take time to develop to full capacity and effectiveness. Implementing TAP for several years also gives principals time to observe and make changes to their roster of mentor and lead teachers.
In addition to startup effects, one might worry about ―finite horizon‖ effects. That is, Chicago TAP was funded in large part by a federal grant of fixed duration. The impact of the program on teachers’ career decisions, such as attracting them to work in TAP schools, may have been blunted by teacher expectations that the program would not be financially sustained beyond the grant period. This is speculation, however, as no data are currently available on teacher attitudes about the duration of Chicago TAP.
Finally, we should caution that a lack of impact finding is simply a lack of evidence rather than a proof of no impact. The first two years of the TAP rollout provided us with evidence based on 16 program schools, and 3 of those schools dropped out of the retention analysis sample due to consolidation or program dropout. As a result, true impacts would needed to have been about four percent of a standard deviation in test scores or about three percentage points of retention in order for us to detect them.

V: Summary and Discussion of Findings Mathematica Policy Research
33
The next year of the rollout, however, will add two new cohorts of schools. We randomly assigned these schools in spring 2009, with implementation starting in fall 2009 and fall 2010. Adding 16 more program schools will double the sample size available for the analysis. We will continue to release annual impact reports for the third and fourth year of rollout to follow the experiences of the first two cohorts and to add in the experiences of the last two cohorts. Collectively, these future reports will provide a more complete picture of the impacts of TAP implementation in its first few years.


References Mathematica Policy Research
35
Chicago TAP. ―Chicago TAP: Recognizing Excellence in Academic Leadership.‖ Available at [http://www.chicagotapschools.org/]. Accessed March 3, 2010.
Crown, Laurel. ―Interim Report for the Year 3 Internal Evaluation of Chicago TAP; Findings from the Fall, 2009 Chicago TAP Teacher Survey.‖ Chicago, IL: Chicago Public Schools, March, 2010.
Foster, Jessica. ―Year 1 Preliminary Implementation Findings from the Internal Evaluation of the Chicago TAP Program.‖ Chicago, IL: Chicago Public Schools, October 16, 2008.
Glazerman, Steven, Allison McKie, and Nancy Carey. ―An Evaluation of the Teacher Advancement Program (TAP) in Chicago: Year One Impact Report.‖ Washington, DC: Mathematica Policy Research, April 2009.
Glazerman, Steven, Allison McKie, Nancy Carey, and Dominic Harris. ―Evaluation of the Teacher Advancement Program (TAP) in Chicago Public Schools: Study Design Report.‖ Washington, DC: Mathematica Policy Research, November 2007.
Glazerman, Steven, Sarah Senesky, Neil Seftor, and Amy Johnson. ―Design of an Impact Evaluation of Teacher Induction Programs.‖ Washington, DC: Mathematica Policy Research, January 2006.
Illinois State Board of Education. ―Interpretative Guide 2009 Illinois Standards Achievement Test: Reading Mathematics Science Writing.‖ Available at [http://www.isbe.state.il.us/assessment/pdfs/ISAT_Interpr_Guide_2009.pdf]. Accessed March 3, 2010.
Schacter, John, Tamara Schiff, Yeow Meng Thum, Cheryl Fagnano, Micheline Bendotti, Lew Solmon, Kimberly Firetag, and Lowell Milken. ―The Impact of the Teacher Advancement Program on Student Achievement, Teacher Attitudes, and Job Satisfaction.‖ Santa Monica, CA: Milken Family Foundation, November 2002.
Schacter, John, Yeow Meng Thum, Daren Reifsneider, and Tamara Schiff. ―The Teacher Advancement Program Report Two: Year Three Results from Arizona and Year One Results from South Carolina TAP Schools.‖ Santa Monica, CA: Milken Family Foundation, March 2004.
Solomon, Lewis, J. Todd White, Donna Cohen, and Deborah Woo. ―The Effectiveness of the Teacher Advancement Program.‖ Santa Monica, CA: National Institute on Effectiveness in Teaching, April 2007.
Springer, Matthew, Dale Ballou, and Art (Xiao) Peng. ―Impact of the Teacher Advancement Program on Student Test Score Gains: Findings from an Independent Appraisal.‖ National Center on Performance Incentives Working Paper 2008-19. Available at [http://www.performanceincentives.org/data/files/news/PapersNews/Springer_et_al_2008.pdf]. Accessed March 3, 2010.


Appendix A Mathematica Policy Research
A-1
We identified nearly 300 CPS K-8 elementary schools to serve as potential matched comparison schools for the TAP schools in the study (cohorts 1 and 2). To form the best possible comparison group from among these schools, we employed several propensity score matching algorithms. Using the same set of propensity scores, each algorithm selects a different set of comparison schools and generates a corresponding set of weights. The goal was to find a comparison group with a close fit to the TAP schools under study, judging from pre-intervention measures of school characteristics related to study outcomes. The procedures are described in Chapter II. This appendix provides additional detail on the matching algorithms.
1. Exact Match Criteria/Filters
Before estimating propensity scores, we first selected schools that met the following basic criteria as a potential comparison school:
General school (this excludes military schools and schools that serve special-needs populations).
School was open during the 2006–2007 school year and had data from that year.
Previously not selected for TAP cohort 3 or 4. We did not want the possibility of a comparison school’s staff knowing it would be implementing the program in the future.
Minimum 50 percent of students with low income (eligible for free/reduced-price lunch). To be eligible for Chicago TAP, the school had to serve at least 75 percent low-income students. We used percentage of low-income as a matching variable, but allowed the possibility of schools below the threshold to match with schools above it, even though in practice it was unlikely that any matches would come from this group.
2. Matching Variables
We matched schools on variables that were measured before the rollout of TAP including pre-intervention measures of the outcomes of interest: student test scores and teacher retention. We standardized spring 2007 math and reading ISAT scores within grade to have a common mean and standard deviation by grade (zero and one, respectively) and then averaged across grades for each school. Standardizing the test scores reduces the influence of having different proportions of students in different grade levels. Retention rates were expressed as the percentage of classroom teachers in fall 2005 returning to the same school as classroom teachers in fall 2006, based on CPS human resources data. Separately, we measured retention for teachers who were in their first four years of service in the district and those who had 5 to 24 years of service. We did not take into account retention rates for teachers close to retirement age. This group could not be stably estimated nor does it have the same interpretation as early- and mid-career retention.
We also used 2006–2007 student demographic information, including total school enrollment, enrollment squared (to improve matches for very small or large schools), and race/ethnicity. Because we observed that most TAP schools could be categorized as nearly all African American, with a few nearly all Hispanic or mixed, we collapsed school race/ethnicity into a small number of categories to emphasize substantive, rather than minute, qualitative differences. A school that had
Appendix A Mathematica Policy Research
A-2
less than one-third of its students who were African American was given a value of one; one-third to two-thirds had a value of two; and more than two-thirds a value of three. (This is equivalent to rounding the fraction of African American students to the nearest third). We coded the percentage of Hispanic students in the same way. We also used the percentages of students who were low income (eligible for free/reduced-price lunch), special education (had an individualized education program), and limited English proficient. The last set of matching characteristics we used for 2006–2007 were indicators of whether the school had made adequate yearly progress (AYP) and if they had a truancy rate greater than 50 percent.
All of the matching variables were used in a logistic regression to estimate the theoretical probability for selecting a pool of TAP schools to be randomly assigned to cohort 1 or 2. The predicted probability is the propensity score. We examined the score distributions and selected or reweighted potential comparison schools to form the best possible comparison group.
3. Matching Algorithms
There are several alternative algorithms for selecting a comparison group, each of which has advantages and disadvantages. The nearest neighbor method is probably the most intuitive because it is analogous to a balanced random assignment experiment, yesand gives each TAP school a fixed number of comparison schools (albeit with some counting more than once because of replacement). The propensity score was used to rank all the schools sequentially along a number line. We formed two nearest neighbor comparison groups: one using the single nearest neighbor to each TAP school and one the other using the five nearest neighbors.
Another algorithm is called the caliper method because we define a fixed distance in terms of propensity score from each TAP school and select all comparison schools that fall within that distance, known as a radius. The radius size for the caliper is arbitrary and involves a tradeoff between the quality and quantity of matches. A larger radius captures more comparison schools, but a smaller one captures more closely matched ones. We examined radii of different lengths and used the ones that rendered superior matches in terms of the matching variables described above.
Finally, we used kernel density matching, which uses the full set of comparison schools but allows the weights to vary with distance from TAP schools. For each TAP school, the weight corresponding to each comparison school is smaller as the distance from the TAP school is greater.14
4. Diagnostics
Most of the matching algorithms produced similar results but we had to select one to simplify the presentation. We chose the caliper match with a radius of 0.025. This algorithm appeared to reduce the initial TAP-comparison differences more than the others. The means for matching variables under each method are shown in Table A.1. The first column of data shows the TAP means for cohorts 1 and 2 combined and the second shows the unadjusted means for the full set of potential comparison schools. In some cases, the means were quite different without any
14 The magnitude of the weight is based on the probability density function (PDF) for the normal distribution,
which looks like a bell-shaped curve sitting on a number line, centered on the propensity score for each TAP school. The weight is proportional to the height of the curve (the kernel) of the normal PDF.

Appendix A Mathematica Policy Research
A-3
adjustment. The weighted comparison group means appear much closer to the TAP means, as we would expect.
A balancing test was applied to each set of comparison means and all passed. That is, we did not reject the hypothesis that the distribution of observable characteristics differed between TAP and matched comparison schools for any of the matching algorithms. Visual inspection reveals that the best match on any given characteristic was always one of the caliper matching algorithms. We selected the larger radius caliper because the magnitudes of the differences between that group and the TAP group were smaller than those for any other group.


Appendix B Mathematica Policy Research
B-1
Chapter III presented estimates of the impact of TAP in 2008-2009. In order to combine these findings with those from 2007-2008, the first year of TAP rollout, and to take advantage of data from the prior year as a baseline, before TAP was implemented at all, we conducted a longitudinal analysis of data from all three years.
We conducted the analysis by estimating the same regression that produced the results in Chapter III, but with a stacked dataset including each of the three years, year indicators, cohort indicators, and the student covariates listed in Chapter II. We adjusted the standard errors to account for non-independence of observations and specified the TAP effect in different ways: interacted with cohort, interacted with year of implementation, and entered as a main effect with no interactions.
The longitudinal analysis confirms that there was no detectable overall TAP effect from the first two years of rollout. We also used the longitudinal data to estimate a TAP effect specific to each cohort and alternatively, a TAP effect specific to the first or second year of implementation. The regression results, presented in Table B.1, show both interaction models with a statistically significant interaction effect for reading achievement. The same models for math scores showed similar regression coefficients, but larger standard errors and hence the effects were not statistically significant. Results from the first model (columns 1 and 4), imply that TAP was associated with reductions in test scores of almost 2 ISAT points in cohort 1 schools, and increases in test scores of almost the same amount in cohort 2 schools. Columns 2 and 5 imply that scores were lower in TAP schools in their second year of implementation. Again, only the reading effect estimates are statistically significant. The other differences are small enough that it is more plausible that they could have arisen by chance even if there were no true effect of TAP. The results for overall TAP effect are shown in columns 3 and 6.
We conducted a similar analysis that was confined to the schools that had been subject to random assignment, which we refer to as the experimental contrast. The experimental results suggest that there was a significant negative impact of TAP in cohort 1 schools; TAP was associated with test scores that were about 2 ISAT points lower than non-TAP schools in both reading in math. However, when we considered the possibility that TAP had an effect on cohort 2 schools (see columns 2 and 4 of Table B.2), the remaining negative effect attributable to TAP was smaller and not statistically significant.

Appendix B Mathematica Policy Research
B-2

Appendix B Mathematica Policy Research
B-3


www.mathematica-mpr.com
■ ■ ■ ■ ■