capacity - icao.int meetings seminars and workshops/icao... · regional performance framework...
TRANSCRIPT

20 May 2013 Page 1
Capacity KPA
Regional Performance Framework Workshop, Bishkek, Kyrgyzstan, 21‐23 May 2013
ICAO European and North Atlantic Office

20 May 2013 Page 2
Capacity (Doc 9854)
• Doc 9854 Appendix D– The global ATM system should exploit the inherent capacity to
• meet airspace user demands at peak times and locations• while minimizing restrictions on traffic flow.
– To respond to future growth, capacity must increase,• along with corresponding increases in efficiency, flexibility and predictability,
• while ensuring that there are no adverse impacts on safety• and giving due consideration to the environment.
– The ATM system must be resilient to service disruption and the resulting temporary loss of capacity.

20 May 2013 Page 3
Capacity KPA – Overview
KPA CapacityObjective Ensure that Air Navigation Service capacity
meets demand in en‐route airspace and at airports
Indicators ‐ Average ATFM delay per flight generated by the airspace volume (en‐route)‐ Average ATFM delay per flight in the main airports (to be identified by States in advance and based on the regional relevance)

20 May 2013 Page 4
Origin of indicators
• Re‐use of indicators as defined in SES Performance Scheme Regulation– En‐route: The average minutes of en route ATFM delay per flight, defined as the difference between:
• the estimated take‐off time requested by the aircraft operator in the last submitted flight plan and
• the calculated take‐off time allocated by the central unit of ATFM
– Airport: The average minutes of arrival ATFM delay per inbound flight
• attributable to terminal and airport air navigation services and• caused by landing restrictions at the destination airport

20 May 2013 Page 5
• Graph shows situation at a “node”:• Airspace volume or• Airport
• Both capacity and demand are variable
Capacity, Demand and ATFCM
Time
Mov/hrCapacity
Demand
Capacity/Demand imbalance
ATFM regulationrequested by ACC
ArrivalAirport
DepartureAirport
ACC anticipating capacity shortfall
NM
Aircraft held atdep. airport
•Mitigation of capacity/demand imbalance: ATFCM• Capacity management: increase capacity if possible• Demand management: reduce flow rate
• Reroute traffic around the “node” which is the bottleneck, or• Allow traffic queuing
• In Europe: application of ATFM delay (ground holding)

20 May 2013 Page 6
Reasons for Capacity/Demand ImbalanceCode Description Examples of usage ATC & Aerodrome Capacity C ATC Capacity Demand exceeds the capacity; Planned staff
shortage G Aerodrome Capacity Lack of parking; taxiway closure; areas (runways,
taxiways) closed for maintenance; demand exceeds the declared airport capacity; runway configuration (winds)
S ATC Staffing Unplanned staff shortage ATC Other V Environmental Issues Noise I Industrial Action (ATC) Controllers’ strike R ATC Routeing Phasing in of new procedures; ATFCM scenarios,
Network Solutions T Equipment (ATC) Radar failure; RTF failure Weather W Weather Thunderstorm; low visibility; Strong cross winds,
CBs D De-icing De-Icing All other causes A Accident/incident RWY23 closed due accident E Equipment (non-ATC) Runway or taxiway lighting failure M Airspace management Airspace availability; Military exercise N Industrial Action (non-ATC) Firemen’s strike O Other To be used only if no other reason can fit P Special event European football cup; Heads of Government
meetings; Upgrade of ATM systems
20 May 2013 Page 7
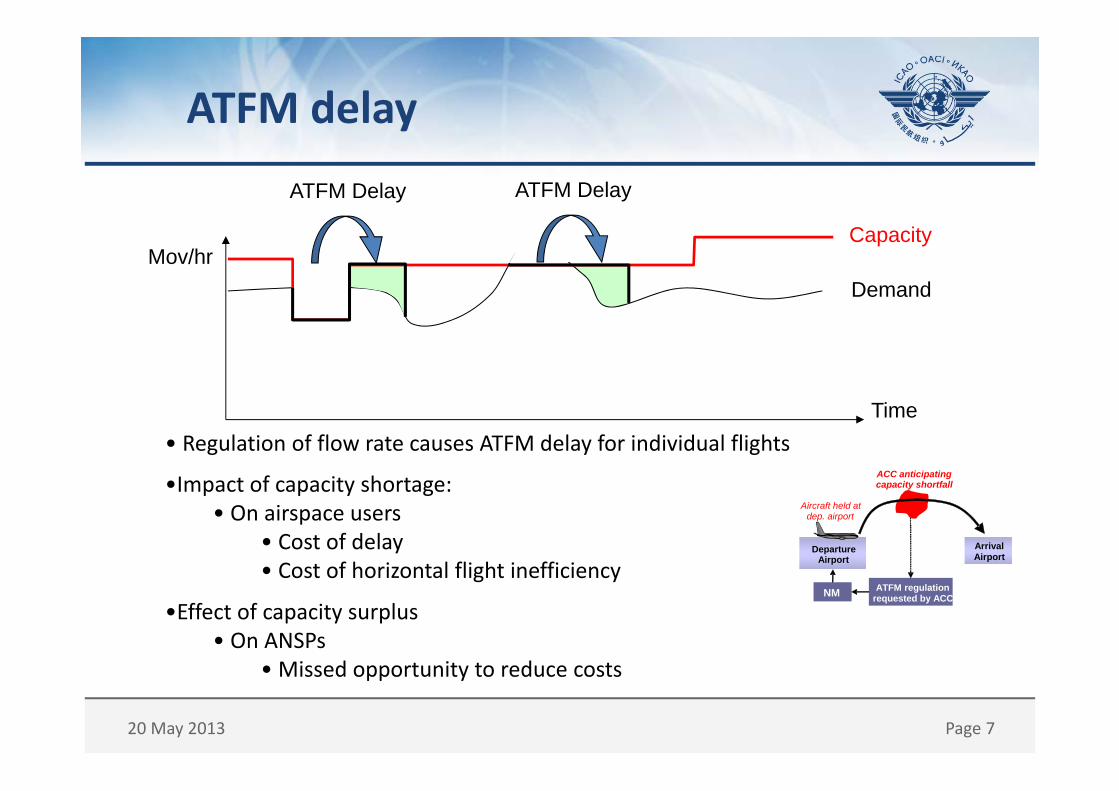
• Regulation of flow rate causes ATFM delay for individual flights
ATFM delay
Time
Mov/hrCapacity
Demand
ATFM Delay ATFM Delay
ATFM regulationrequested by ACC
ArrivalAirport
DepartureAirport
ACC anticipating capacity shortfall
NM
Aircraft held atdep. airport
•Impact of capacity shortage:• On airspace users
• Cost of delay• Cost of horizontal flight inefficiency
•Effect of capacity surplus• On ANSPs
• Missed opportunity to reduce costs
20 May 2013 Page 8
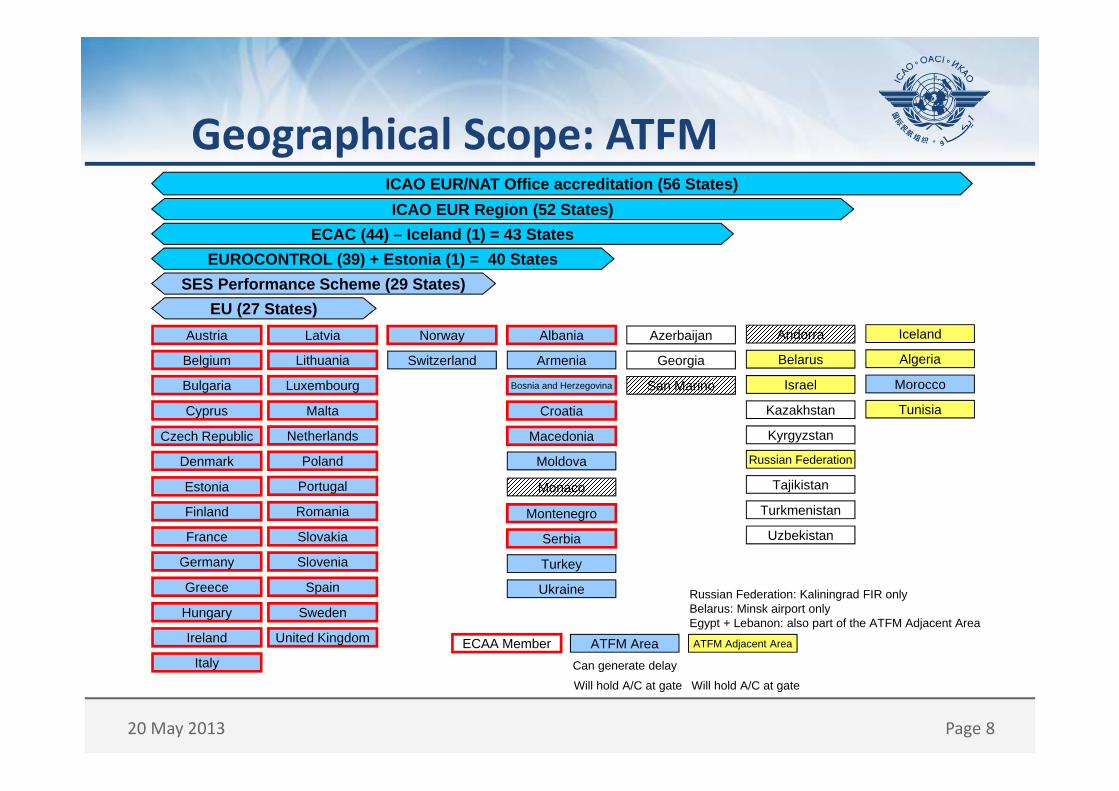
Geographical Scope: ATFM
Austria
Belgium
Bulgaria
Cyprus
Czech Republic
Denmark
Finland
France
Germany
Greece
Hungary
Ireland
Italy
Latvia
Lithuania
Luxembourg
Malta
Netherlands
Poland
Portugal
Romania
Slovakia
Slovenia
Spain
Sweden
United Kingdom
Estonia
Norway
Switzerland
Albania
Armenia
Bosnia and Herzegovina
Croatia
Macedonia
Moldova
Monaco
Montenegro
Serbia
Turkey
Ukraine
Azerbaijan
Georgia
San Marino
Andorra
Belarus
Israel
Kazakhstan
Kyrgyzstan
Russian Federation
Tajikistan
Turkmenistan
Uzbekistan
EU (27 States)SES Performance Scheme (29 States)
EUROCONTROL (39) + Estonia (1) = 40 StatesECAC (44) – Iceland (1) = 43 States
ICAO EUR Region (52 States)
ECAA Member
Iceland
Algeria
Morocco
Tunisia
ICAO EUR/NAT Office accreditation (56 States)
ATFM Area ATFM Adjacent Area
Russian Federation: Kaliningrad FIR onlyBelarus: Minsk airport onlyEgypt + Lebanon: also part of the ATFM Adjacent Area
Can generate delay
Will hold A/C at gate Will hold A/C at gate

20 May 2013 Page 9
Calculation of indicator
• A flight might encounter multiple capacity bottlenecks along the route, however:– All ATFM delay of a flight is attributed to most constraining “node”
• Aggregation of attributed ATFM delay by “node”– Delay is measured for nodes, not for flights
• ATFM delay caused by a “node” accumulates over time– Measurement: accumulated ATFM delay of a “node” by the end of the year
• Aggregation of “nodes”– Geographical aggregation of ATFM delay possible– Geographical aggregation of flights (entering node) not possible
• Indicator “average delay per flight” for a “node”:– Accumulated ATFM delay / number of flights through the “node”– Can be calculated at any aggregation level, for any time period
Flight delayFlight delaySingle Flight delay
Flightat departure airport
Minutes ofATFM Delay
Nodeairspace, ACC ordestination airport
Delay accumulated by a Node ATFM regulationrequested by ACC
ArrivalAirport
DepartureAirport
ACC anticipating capacity shortfall
NM
Aircraft held atdep. airport

20 May 2013 Page 10
Existing Data (en‐route ATFM delay)Source: http://prudata.webfactional.com/Dashboard/eur_view_2012.html

20 May 2013 Page 11
Existing Data (airport ATFM delay)Source: http://prudata.webfactional.com/Dashboard/eur_view_2012.html

20 May 2013 Page 12
ATFM delay vs. punctuality
• Punctuality: many delay reasons, not just ATFM• Flight and departure centric• Recorded by airlines in IATA delay codes
• ATFM delay indicator: needs attribution of delay to network nodes• Airspace and airport centric
• Identifies where the bottleneck is, not where the delay is taken• Recorded by Central Executive ATFM Unit (CEU)

20 May 2013 Page 13
Reporting Table Capacity En-route ATFM delays (continental airspace) B35 Total en-route ATFM delay generated in the State (all
causes) (=B37+B38+B39+B40) Min/year
B36 Average ATFM delay per flight (=B35/A11) Min/flight B37 En-route ATFM delay generated in the State (ATC
capacity causes, see Table 1) Min/year
B38 En-route ATFM delay generated in the State (ATC other causes, see Table 1)
Min/year
B39 En-route ATFM delay generated in the State (Weather causes, see Table 1)
Min/year
B40 En-route ATFM delay generated in the State (All other causes, see Table 1)
Min/year
Airport ATFM delays Airport #1 ICAO code B41-1 Total number of IFR arrivals at the airport Arrivals/year B42-1 Total airport ATFM delay generated by the airport (all
causes) (=B44+B45+B46+B47) Min/year
B43-1 Average ATFM delay per arrival (=B42/B41) Min/arrival B44-1 Airport ATFM delay generated by the airport (ATC &
aerodrome capacity causes, see Table 1) Min/year
B45-1 Airport ATFM delay generated by the airport (ATC other causes, see Table 1)
Min/year
B46-1 Airport ATFM delay generated by the airport (Weather causes, see Table 1)
Min/year
B47-1 Airport ATFM delay generated by the airport (All other causes, see Table 1)
Min/year
Airport #2 ICAO code Repeat fields B41 – B47 for each airport included in the
report
A11

20 May 2013 Page 14
Conclusions
• Indicators measure– The location where the problem is, not where the delay is taken (departure airport)
– Performance of airspace volumes and airports, not flights• Despite the expression as a value “per flight”
– Within the Capacity KPA• Demand/capacity imbalance• Not capacity itself
• Limitations• Not designed to measure excess capacity• No data if airspace or airport does not participate in a centralised ATFCM process

20 May 2013 Page 15
Discussion
• Do you (sometimes) have capacity shortfalls?
– En‐route– At airports
• If yes, how do handle capacity shortfalls?– Do you have an ATFCM capability to handle
demand/capacity imbalances?– Does this include delaying flights at the departure
airport• What if the departure airport is not within your
State?– Other approach(es)?
• Current data collection and National indicators
– Do you currently record capacity or delay data?– Do you compute National capacity or delay
indicators?• Your views
– Would you consider the proposed indicators as useful for your State?
– Would you consider it useful if the proposed indicators would be reported for all States in the EUR Region?
– What support would you expect or need to participate in this EANPG reporting process?
Capacity shortfall in...(Indicator computed for...)
Group 1ATFM Area
Group 2ATFM
Adjacent Area
Group 3Other
Countries
Departure airport in...
Group 1ATFM
Area
ATFM delay
? ?
Group 2ATFM
Adjacent Area
ATFM delay
? ?Group 3Other
CountriesNo ATFM delay
? ?
IcelandMinsk airportKaliningrad FIR AlgeriaEgypt (*)IsraelLebanon (*)Tunisia
(*) Non‐EUR
AzerbaijanBelarusGeorgiaKazakhstanKyrgyzstanRussian FederationTajikistanTurkmenistanUzbekistan
+ Non‐EUR Region
39 Ectrl StatesEstoniaMorocco
ArrDep