capacity building in applications of geoinformatics … building in applications of geoinformatics...
TRANSCRIPT
byManzul Hazarika Ph.D.
Geoinformatics Center (GIC)Asian Institute of Technology (AIT), Bangkok
E-mail: [email protected]
Capacity Building in Applications of Geoinformatics in Flood Hazard Mapping
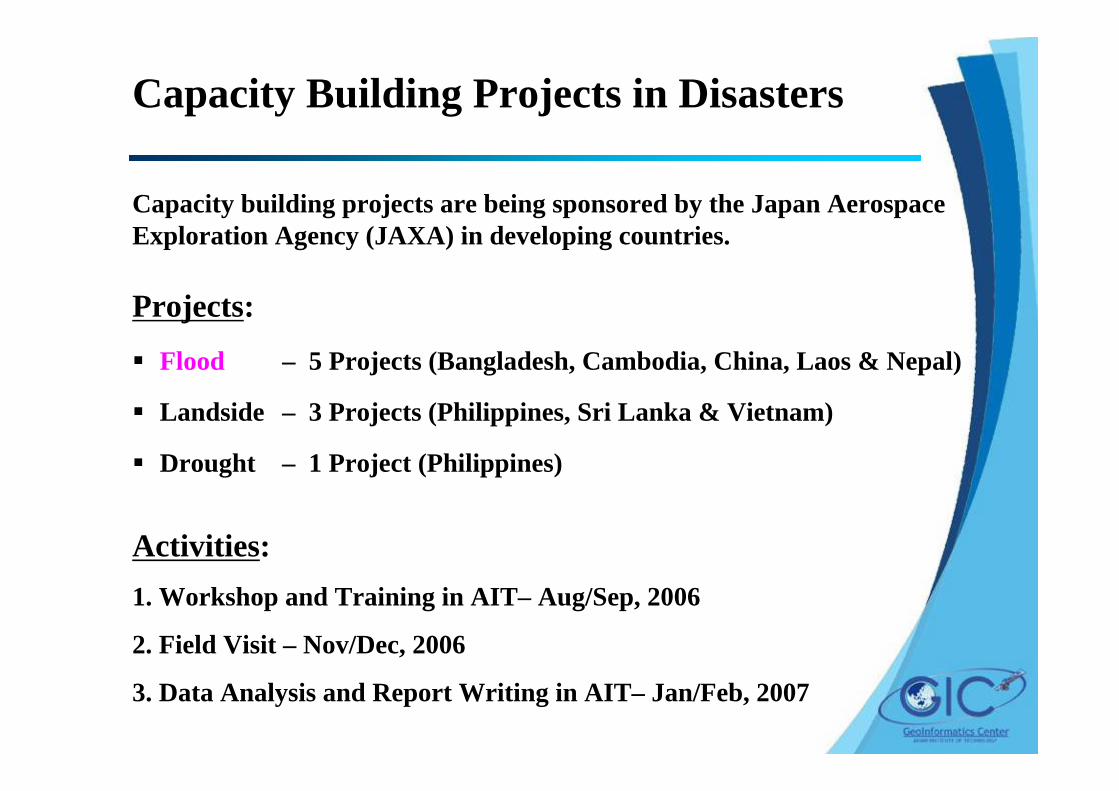
Capacity Building Projects in Disasters
Capacity building projects are being sponsored by the Japan Aerospace Exploration Agency (JAXA) in developing countries.
Activities:1. Workshop and Training in AIT– Aug/Sep, 2006
2. Field Visit – Nov/Dec, 2006
3. Data Analysis and Report Writing in AIT– Jan/Feb, 2007
Projects:
Flood – 5 Projects (Bangladesh, Cambodia, China, Laos & Nepal)
Landside – 3 Projects (Philippines, Sri Lanka & Vietnam)
Drought – 1 Project (Philippines)
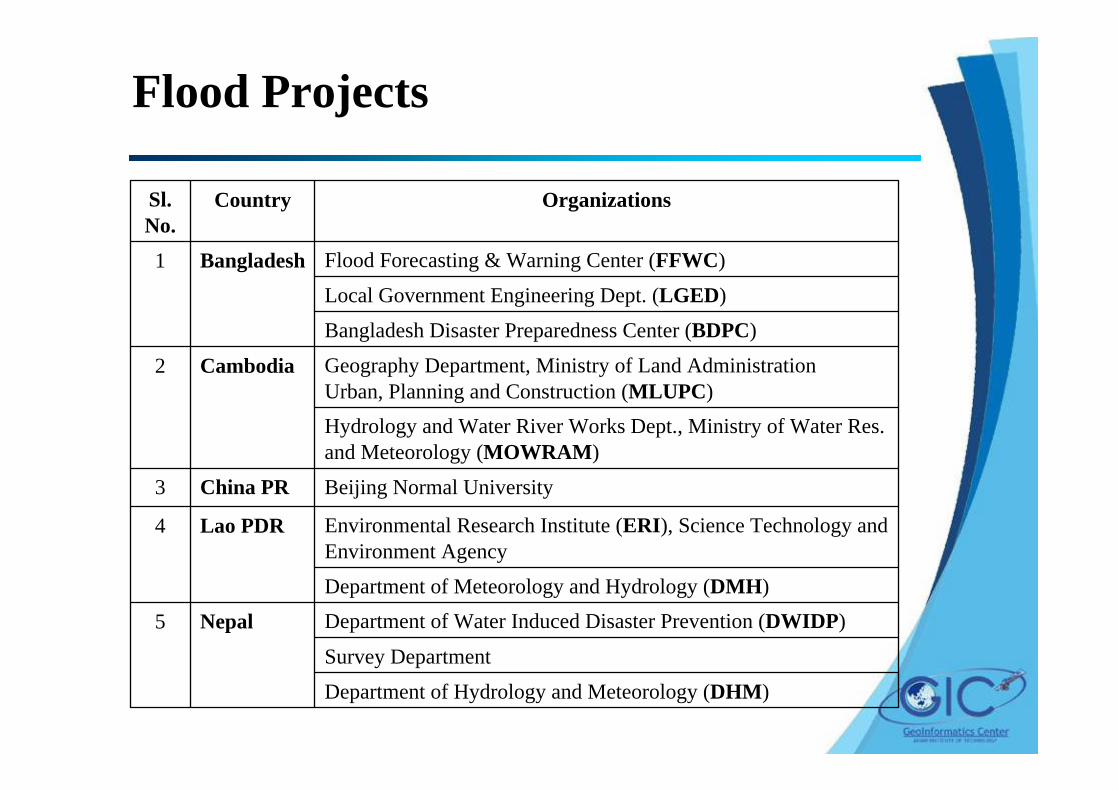
Flood Projects
Survey Department
Department of Hydrology and Meteorology (DHM)
Department of Water Induced Disaster Prevention (DWIDP)Nepal5
Department of Meteorology and Hydrology (DMH)
Environmental Research Institute (ERI), Science Technology and Environment Agency
Lao PDR4
Beijing Normal UniversityChina PR3
Hydrology and Water River Works Dept., Ministry of Water Res. and Meteorology (MOWRAM)
Geography Department, Ministry of Land AdministrationUrban, Planning and Construction (MLUPC)
Cambodia2
Bangladesh Disaster Preparedness Center (BDPC)
Local Government Engineering Dept. (LGED)
Flood Forecasting & Warning Center (FFWC)Bangladesh1
OrganizationsCountrySl. No.
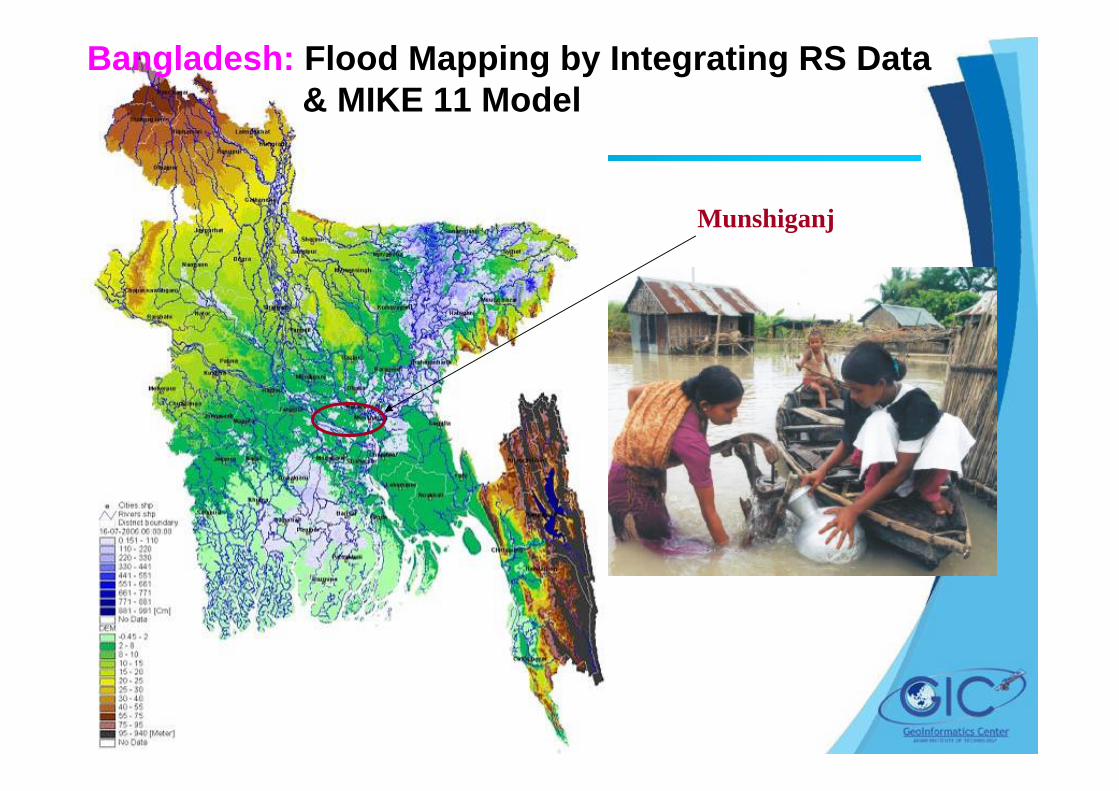
Munshiganj
Bangladesh: Flood Mapping by Integrating RS Data & MIKE 11 Model
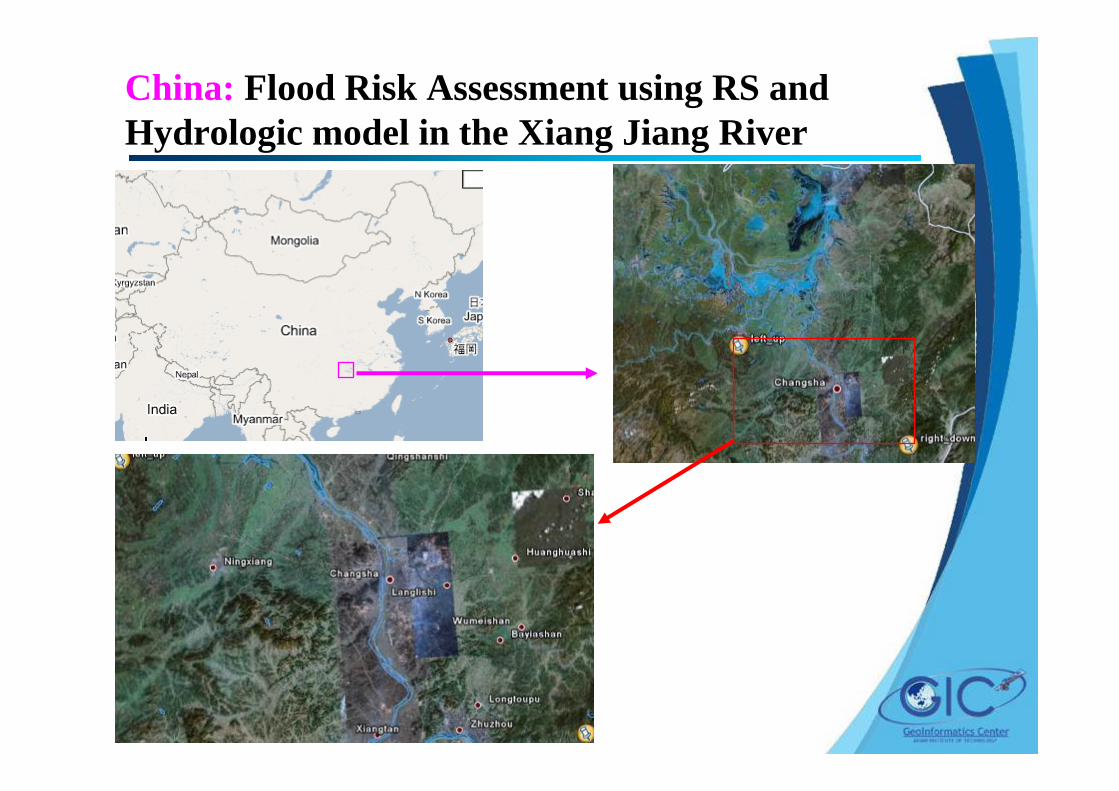
China: Flood Risk Assessment using RS and Hydrologic model in the Xiang Jiang River
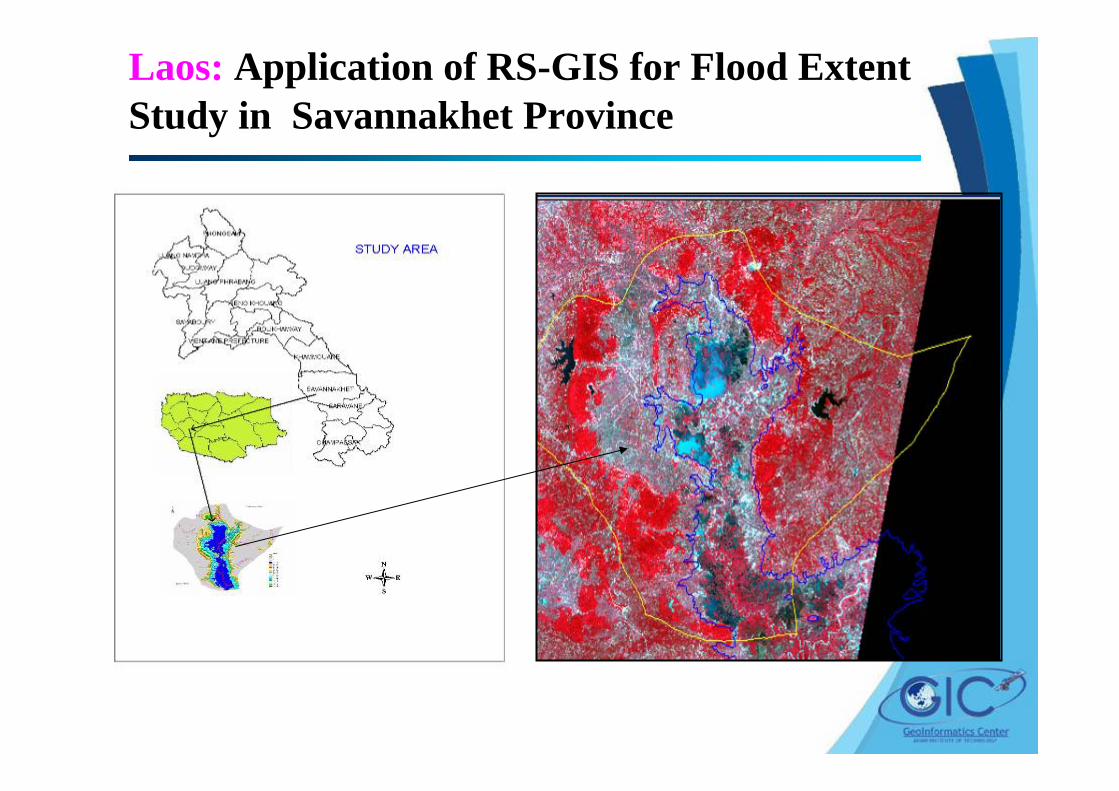
Laos: Application of RS-GIS for Flood Extent Study in Savannakhet Province

CambodiaA Detail Example for Flood
Hazard Mapping
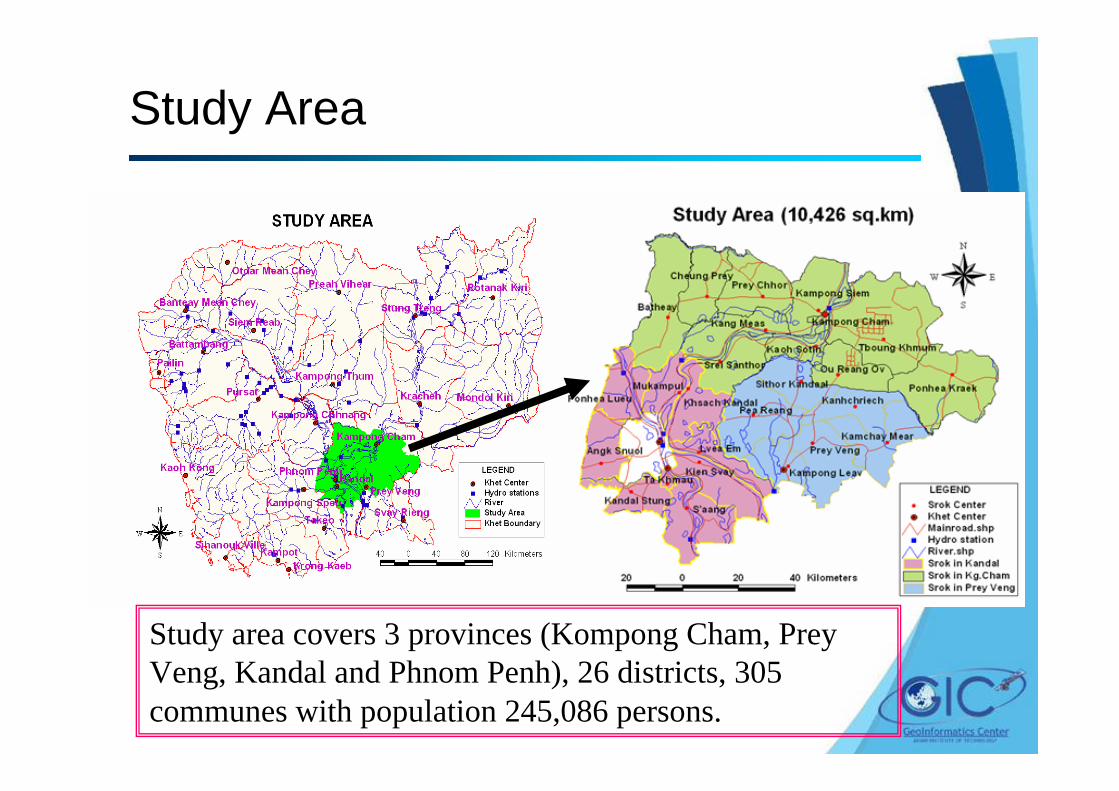
Study Area
Study area covers 3 provinces (Kompong Cham, Prey Veng, Kandal and Phnom Penh), 26 districts, 305 communes with population 245,086 persons.
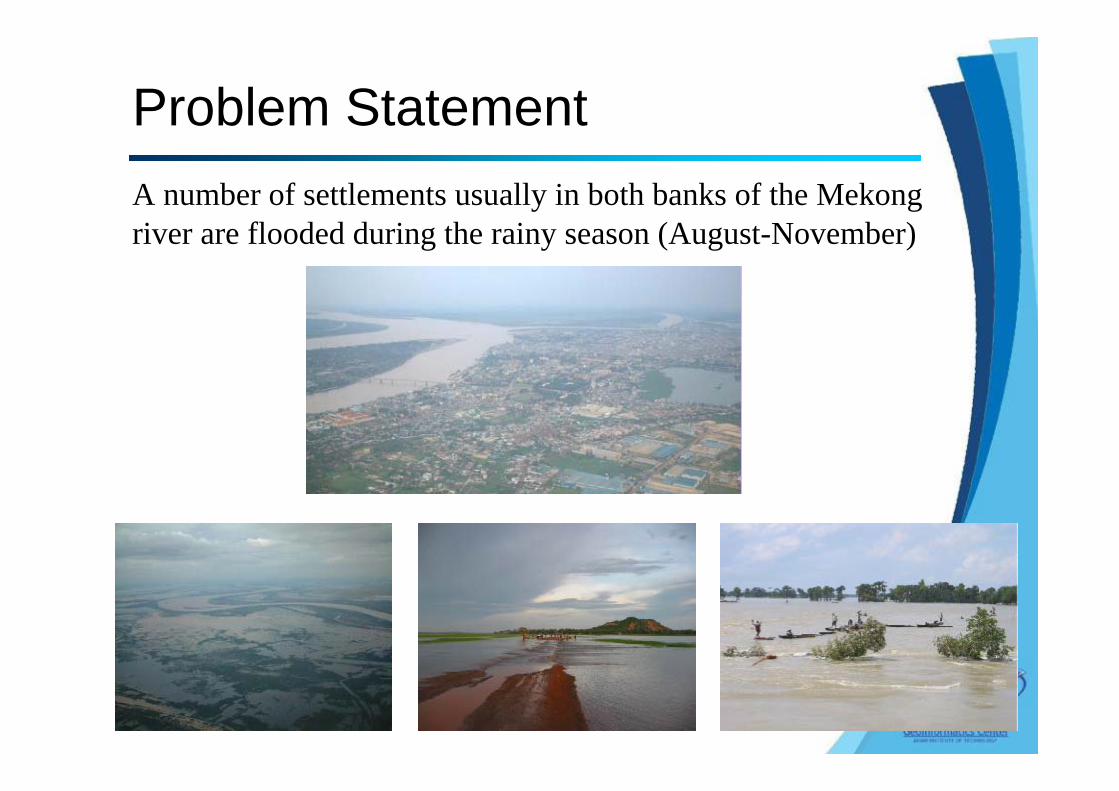
Problem Statement A number of settlements usually in both banks of the Mekong river are flooded during the rainy season (August-November)
Major Floods in Recent Years
• From 10 Aug. to 1 Nov., 2006 (84 days)• 68 dead, 33,000 displaced• 143,300 sq. km area flooded
Year 2006
Year 2000
• On 28 Aug., 2000 • 1139 dead, 6,574,000 displaced• 208200 sq. km area flooded• Property Damage 78.2 Million US$
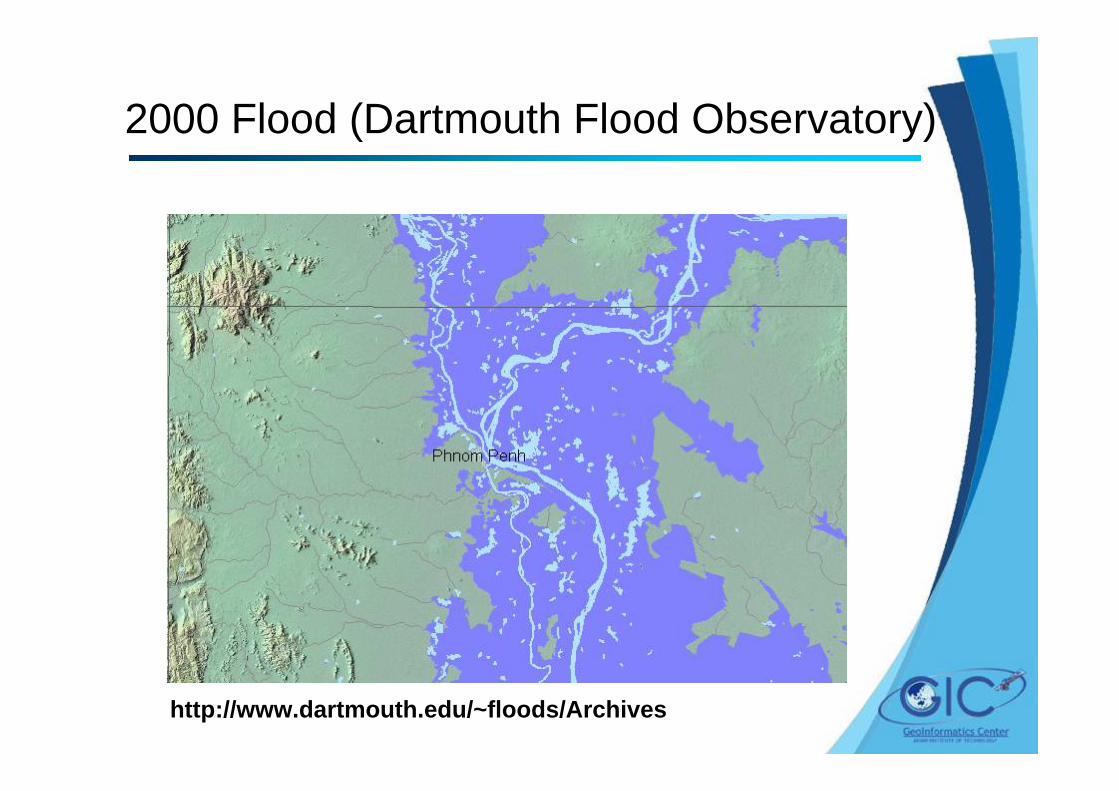
2000 Flood (Dartmouth Flood Observatory)
http://www.dartmouth.edu/~floods/Archives
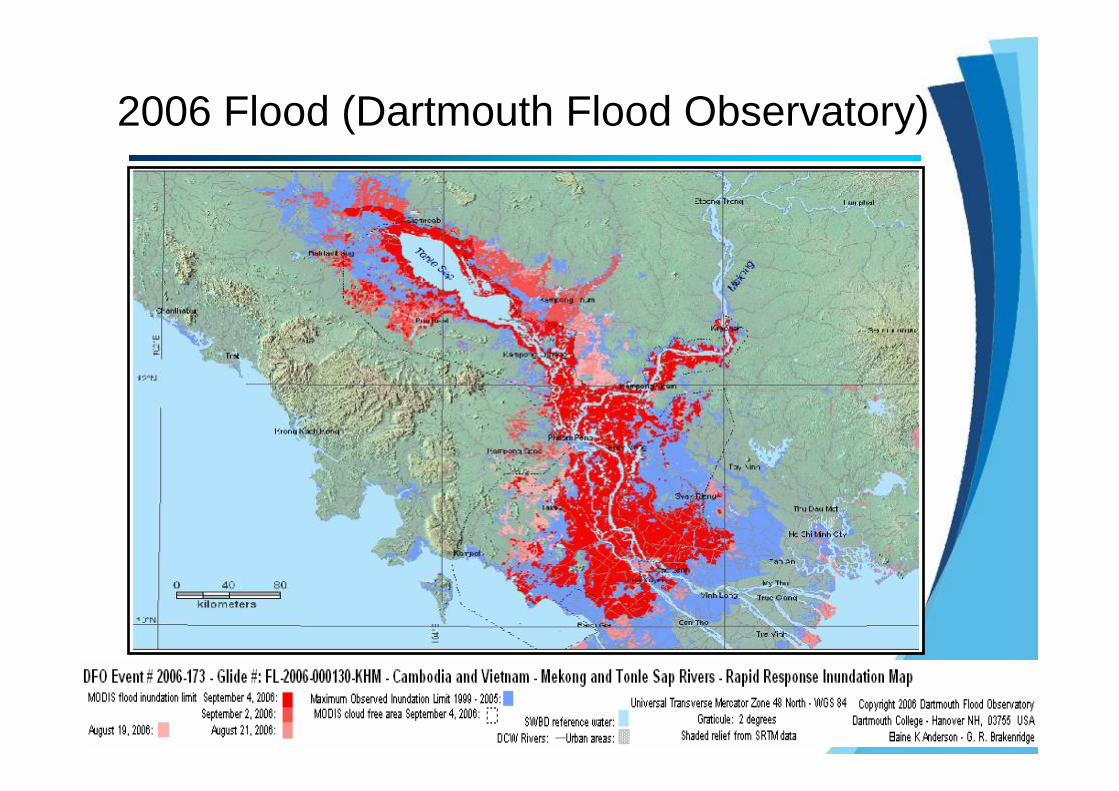
2006 Flood (Dartmouth Flood Observatory)
Main Objectives of the Study
• To integrate a flood simulation model and remotely sensed data with the available topographic and socio economic data in a GIS environment
• To validate the model by comparing the flood inundation area and depth with the available flood maps and remote sensing image.
• Preparing hazard maps using depth map and the socio-economic data
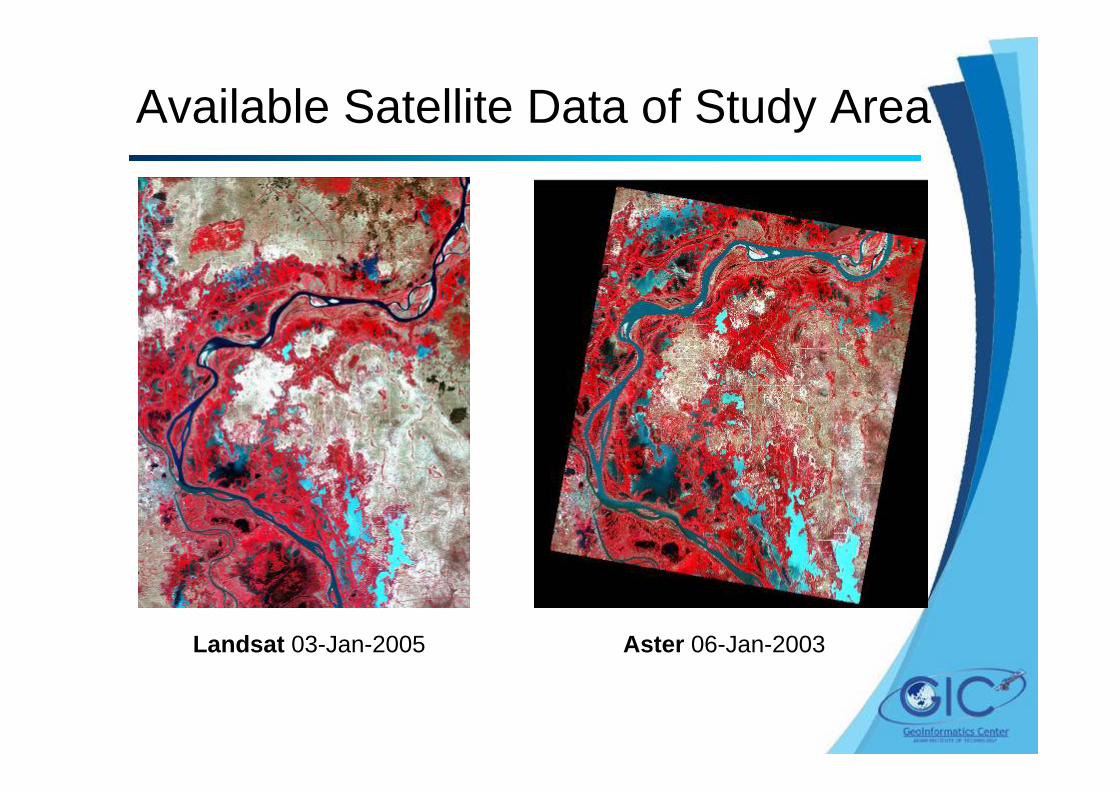
Available Satellite Data of Study Area
Landsat 03-Jan-2005 Aster 06-Jan-2003
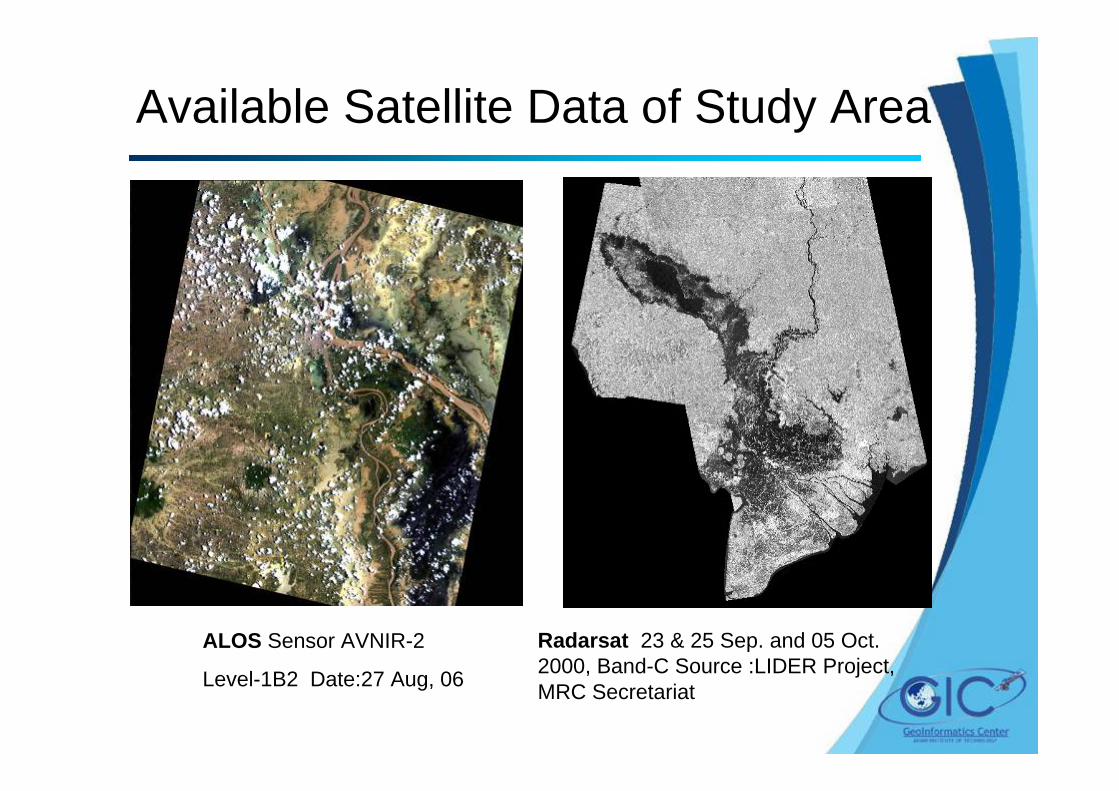
ALOS Sensor AVNIR-2
Level-1B2 Date:27 Aug, 06
Radarsat 23 & 25 Sep. and 05 Oct. 2000, Band-C Source :LIDER Project, MRC Secretariat
Available Satellite Data of Study Area
Available hydrological data for study
• Daily average river discharge data (m³/s) (Kampong Cham and Chroui Changvar) (from 1991 to 2002)
• Water surface heights (MSL) (Kampong Cham and Chroui Changvar) (1991 to 2002)
• Manning’s co-efficient of Roughness for the River bed and the flood plain derived from the landuse map.
Available ancillary data for study
• Census data• Socio-Economic data (CELA Program, UNDP)• Spot heights of the flood plain/river bed • Topographic maps (1:50,000) (Geography Department)• Administrative and other vector maps
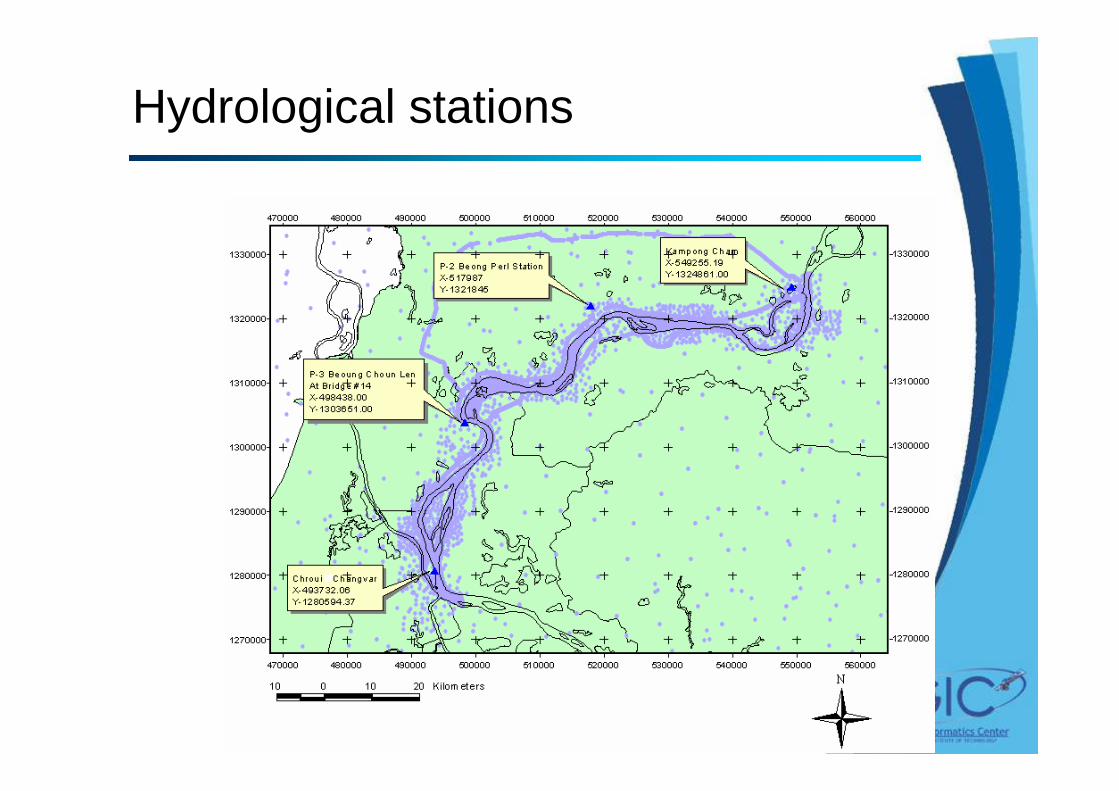
Hydrological stations
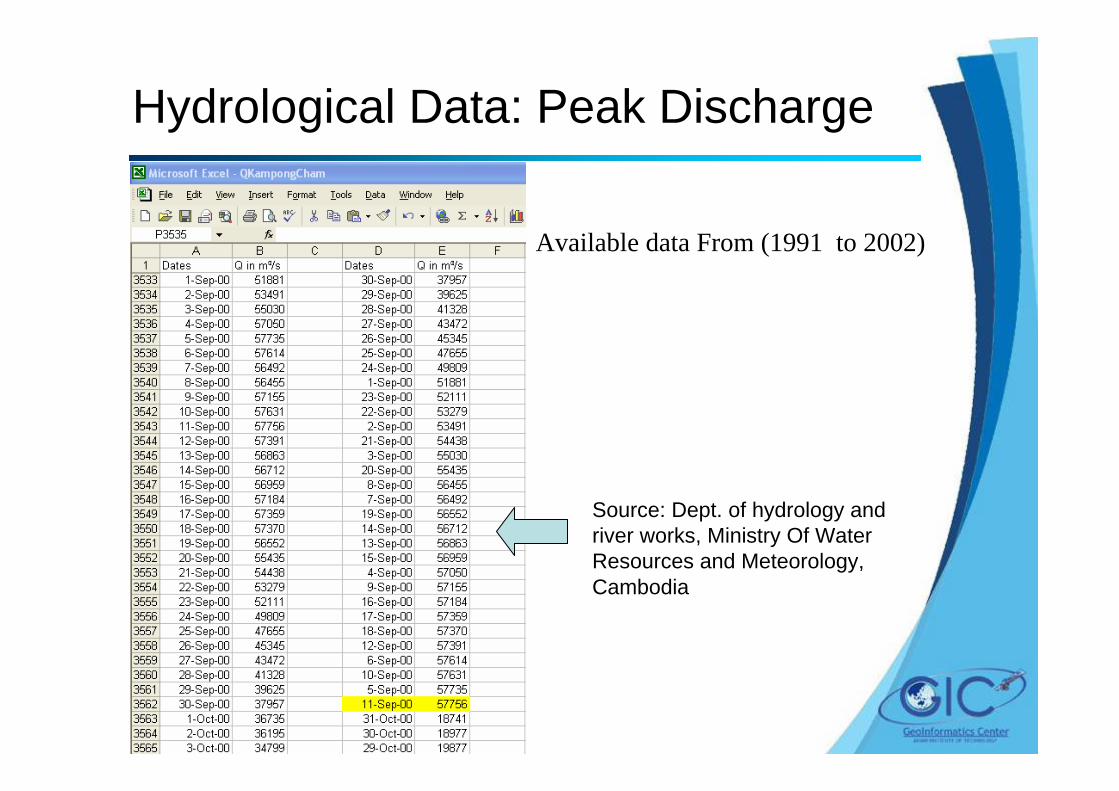
Hydrological Data: Peak Discharge
Available data From (1991 to 2002)
Source: Dept. of hydrology and river works, Ministry Of Water Resources and Meteorology, Cambodia
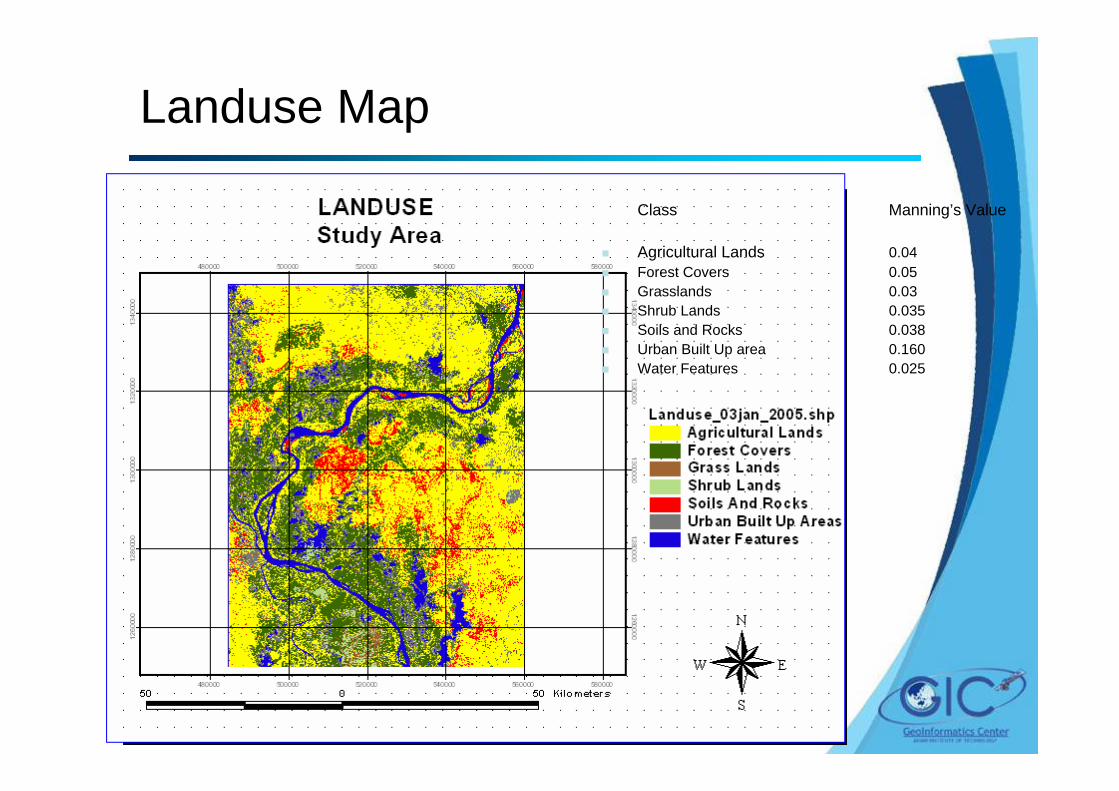
Landuse Map
Class Manning’s Value
Agricultural Lands 0.04Forest Covers 0.05Grasslands 0.03Shrub Lands 0.035Soils and Rocks 0.038Urban Built Up area 0.160Water Features 0.025
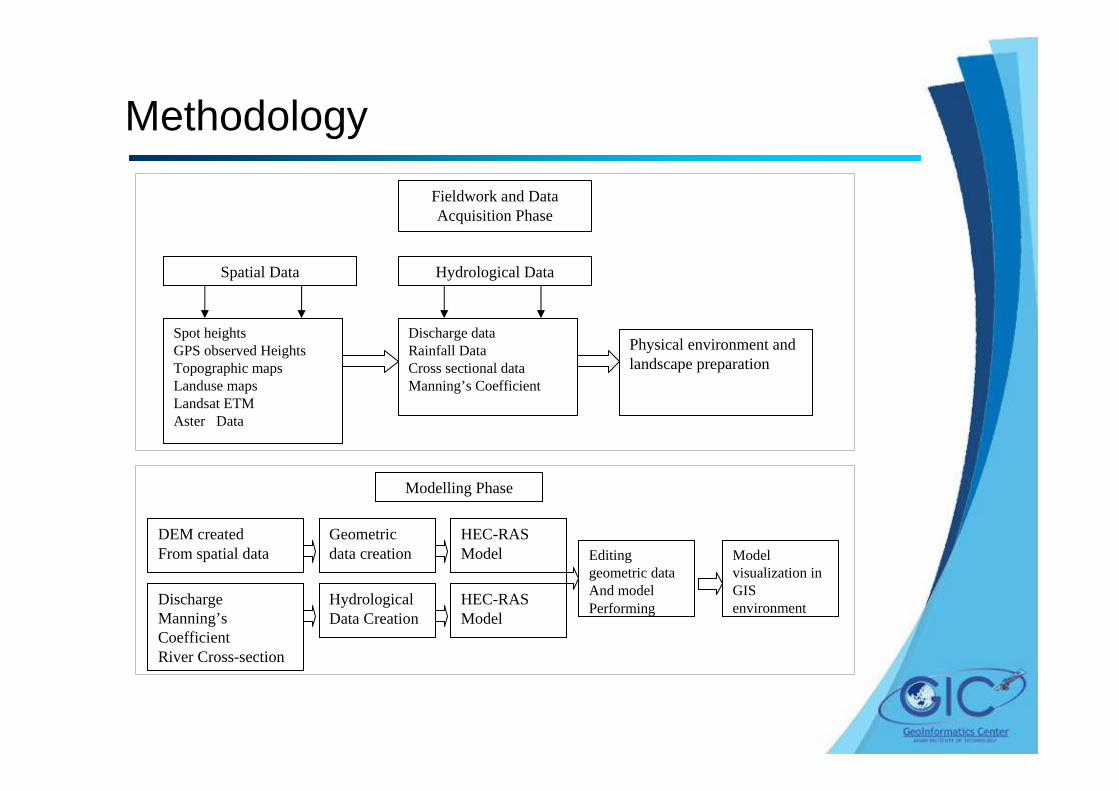
Methodology
Spot heightsGPS observed HeightsTopographic mapsLanduse mapsLandsat ETM Aster Data
Fieldwork and Data Acquisition Phase
Spatial Data Hydrological Data
Discharge dataRainfall DataCross sectional dataManning’s Coefficient
Physical environment and landscape preparation
Modelling Phase
DEM createdFrom spatial data
Geometric data creation
HEC-RAS Model
DischargeManning’s CoefficientRiver Cross-section
Hydrological Data Creation
HEC-RAS Model
Editing geometric dataAnd model Performing
Model visualization in GIS environment
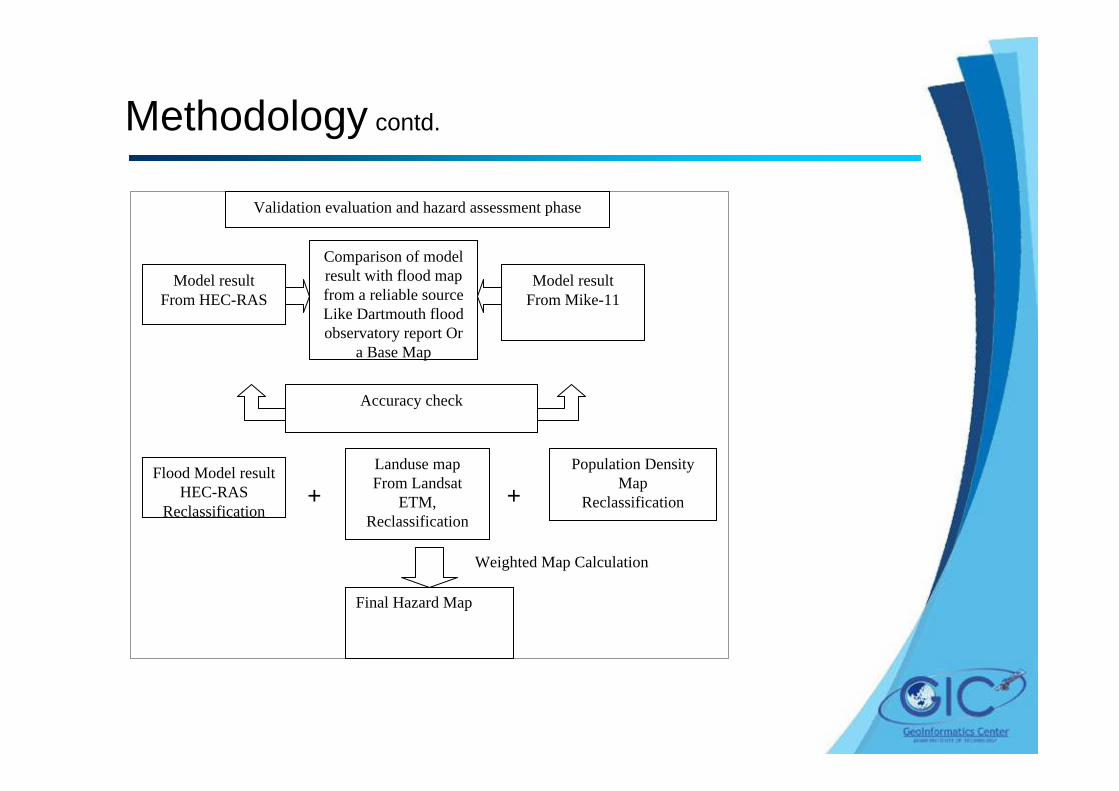
Validation evaluation and hazard assessment phase
Model resultFrom HEC-RAS
Comparison of model result with flood mapfrom a reliable sourceLike Dartmouth flood observatory report Or
a Base Map
Model resultFrom Mike-11
Accuracy check
Flood Model resultHEC-RAS
Reclassification
Landuse mapFrom Landsat
ETM,Reclassification
Population Density Map
Reclassification
Final Hazard Map
+ +
Weighted Map Calculation
Methodology contd.
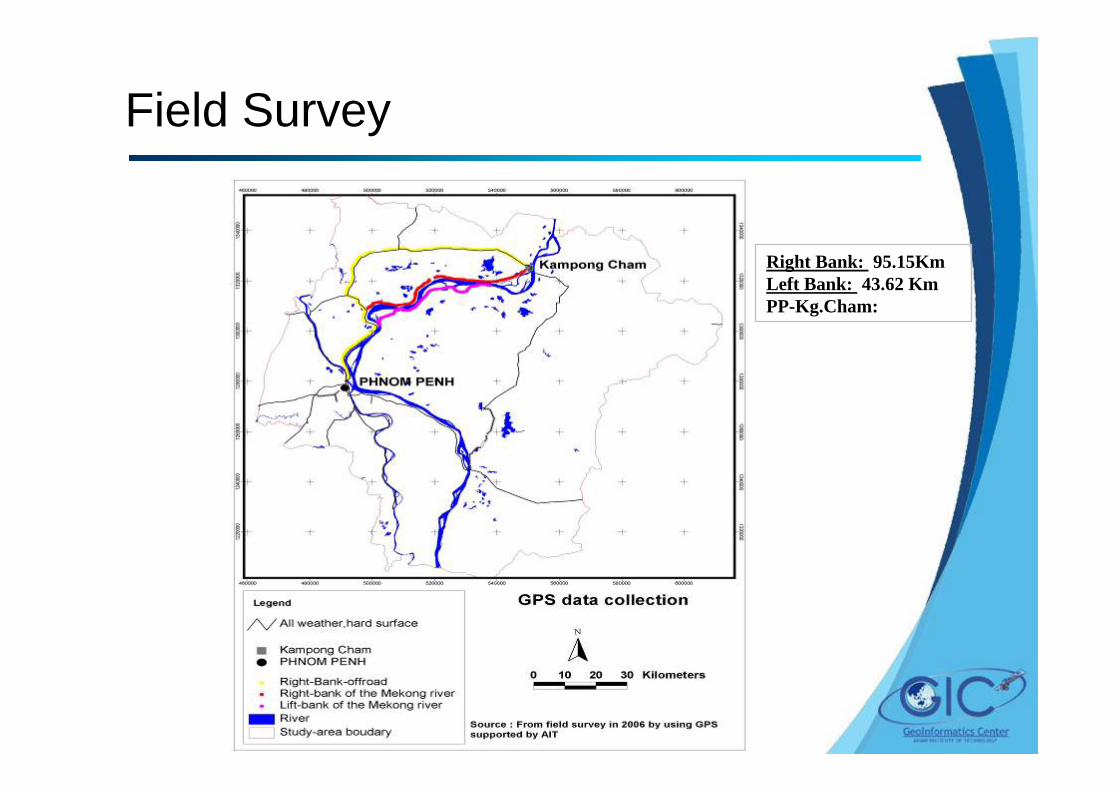
Right Bank: 95.15KmLeft Bank: 43.62 KmPP-Kg.Cham:
Field Survey
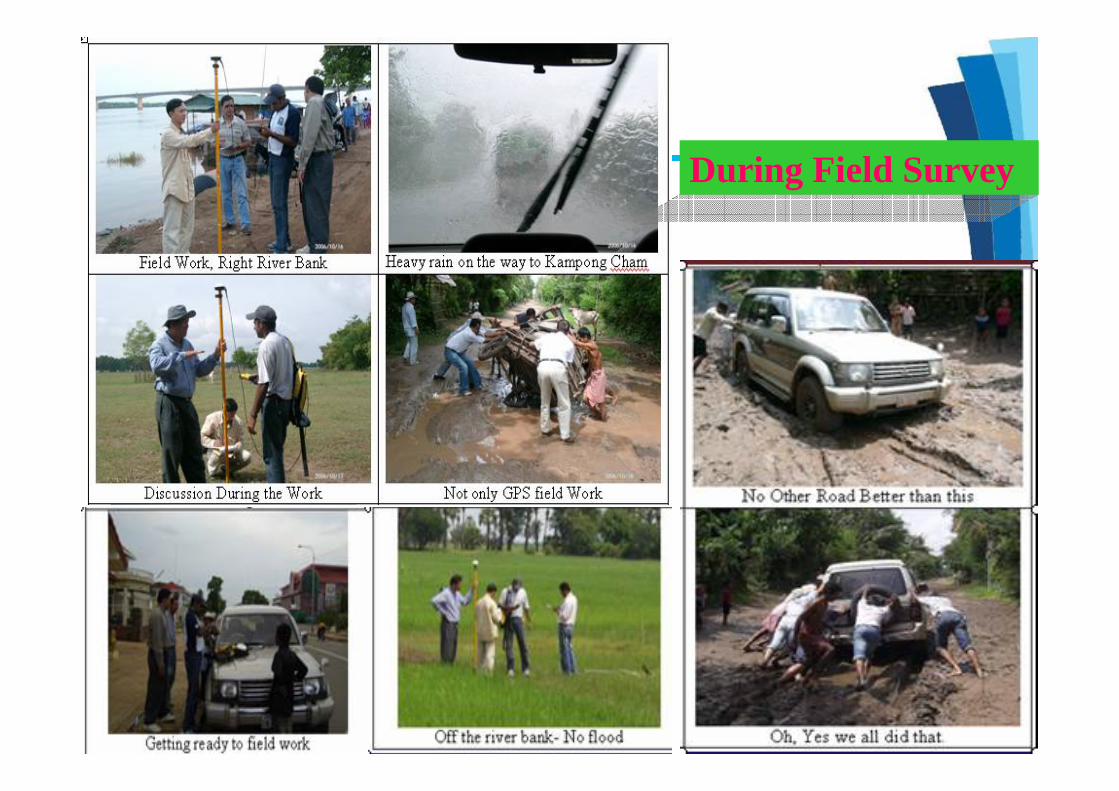
During Field Survey
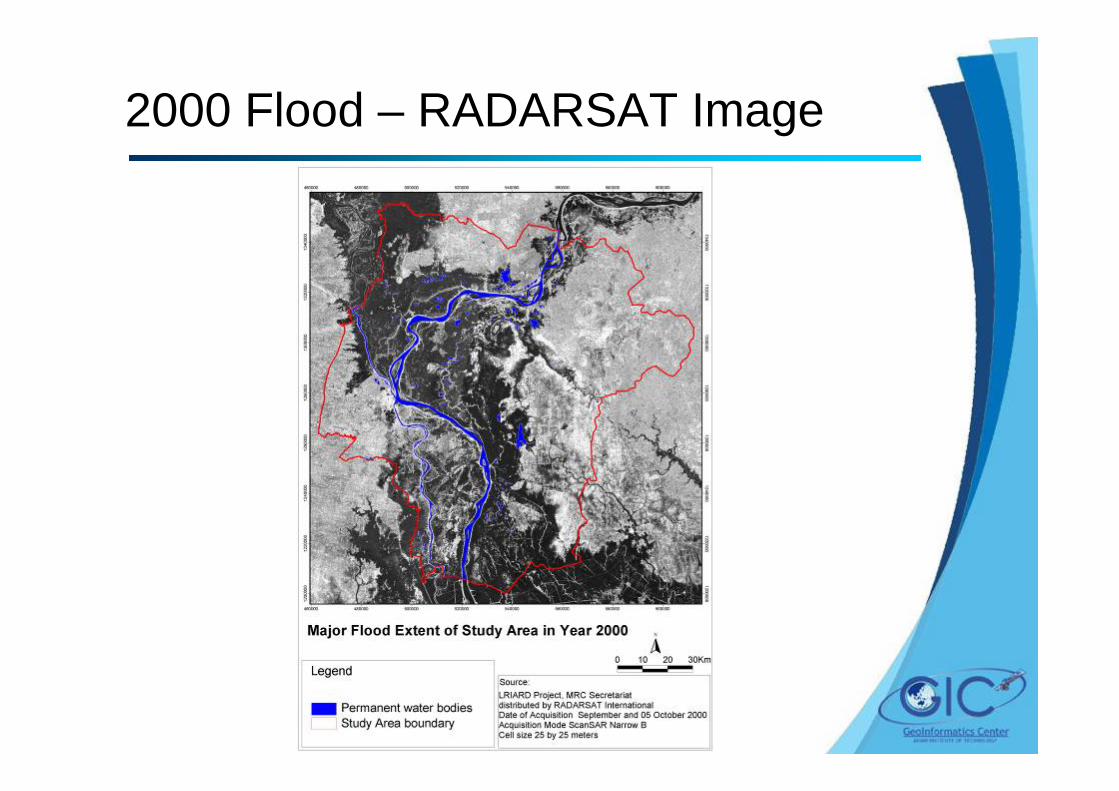
2000 Flood – RADARSAT Image
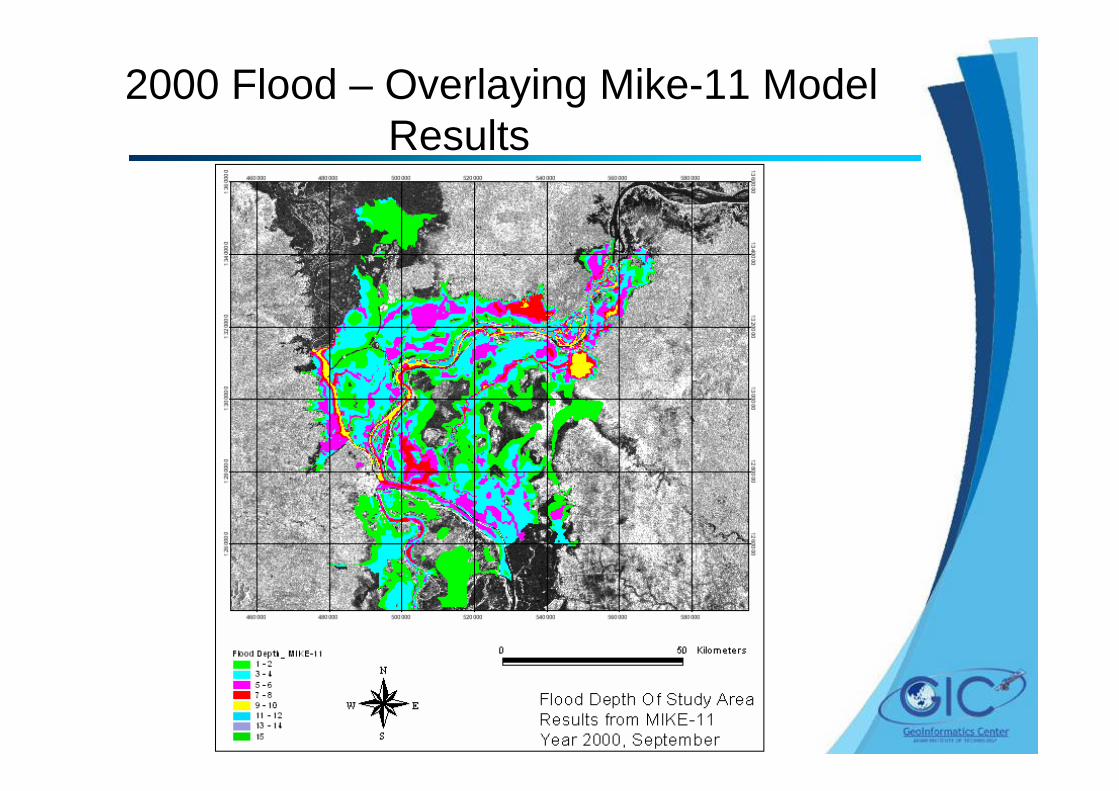
2000 Flood – Overlaying Mike-11 Model Results
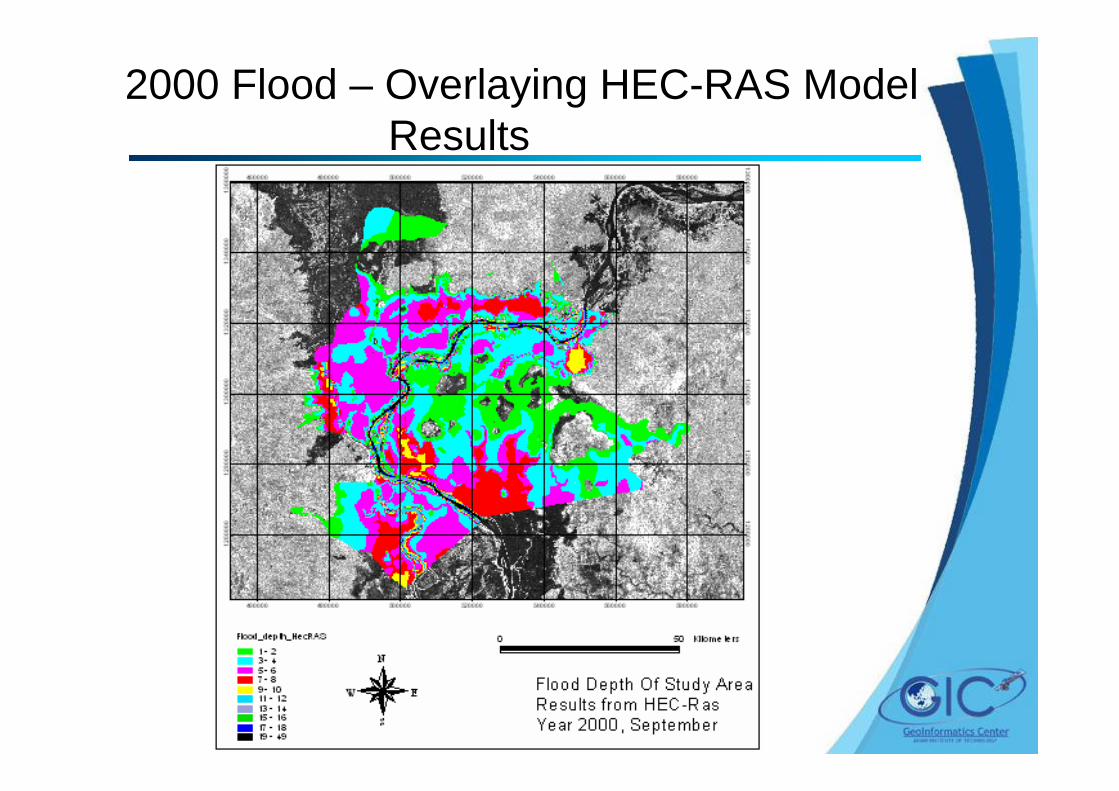
2000 Flood – Overlaying HEC-RAS Model Results
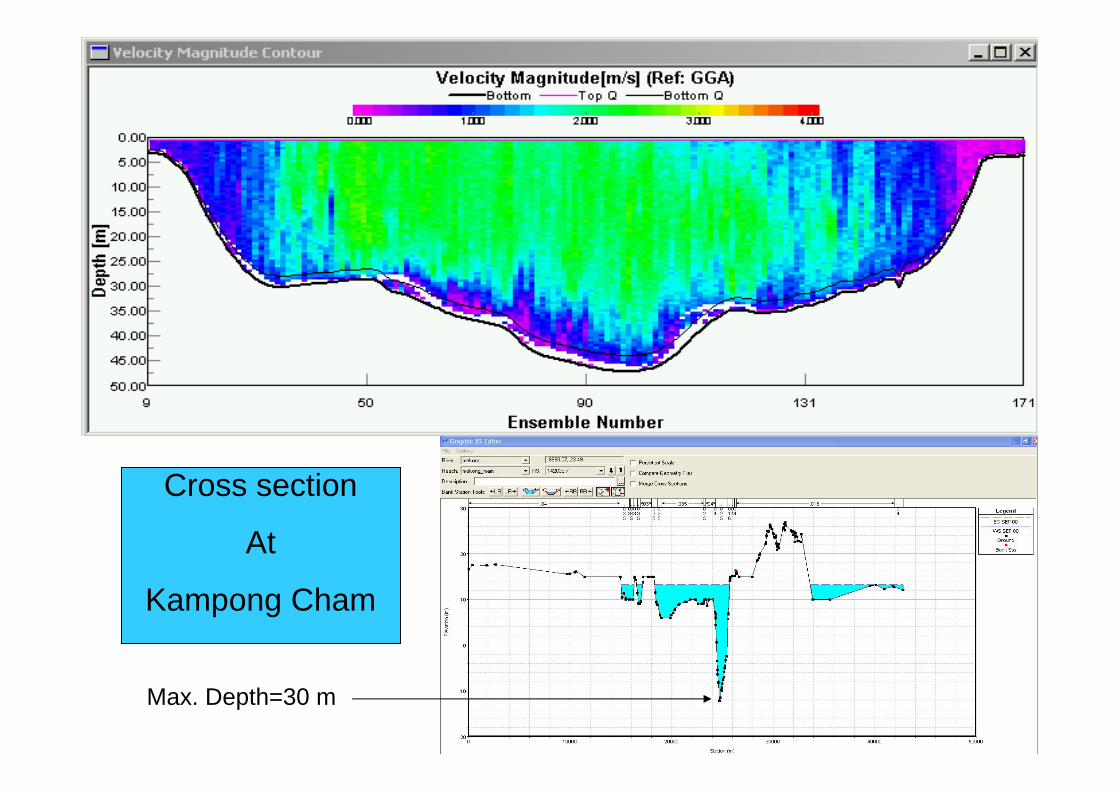
Cross Section at Kampong Cham
Max. Depth=30 m
Cross section
At
Kampong Cham
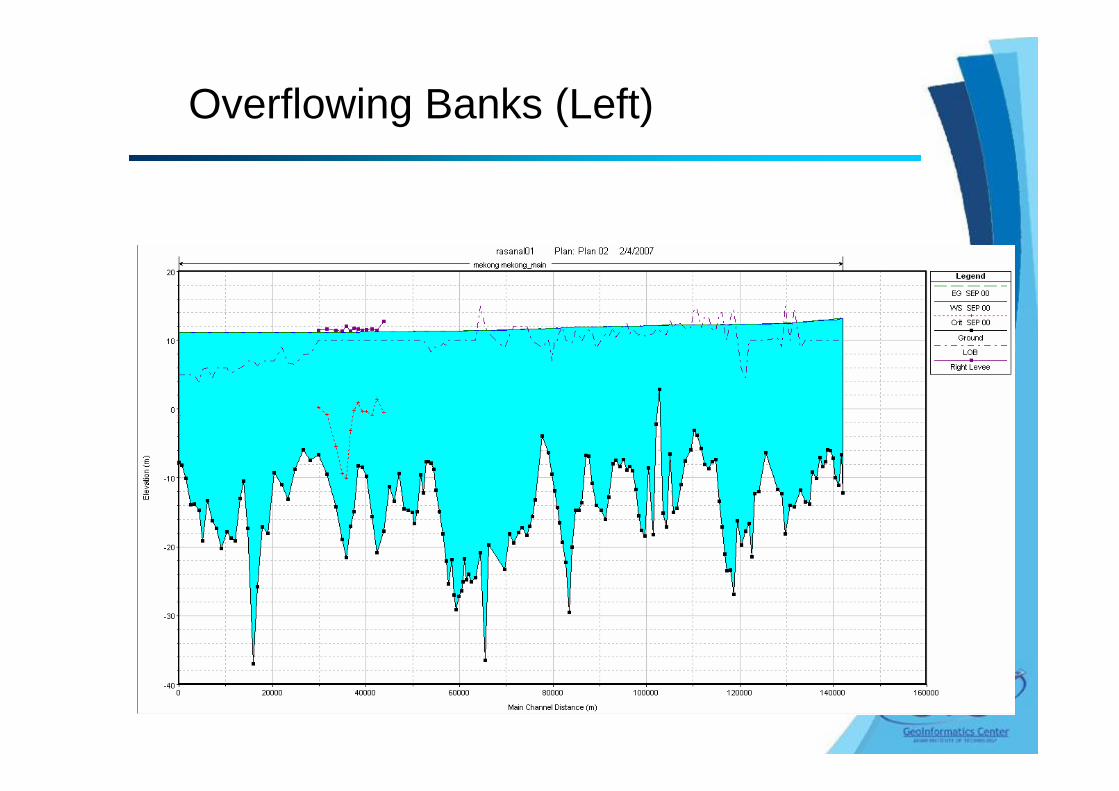
Overflowing Banks (Left)
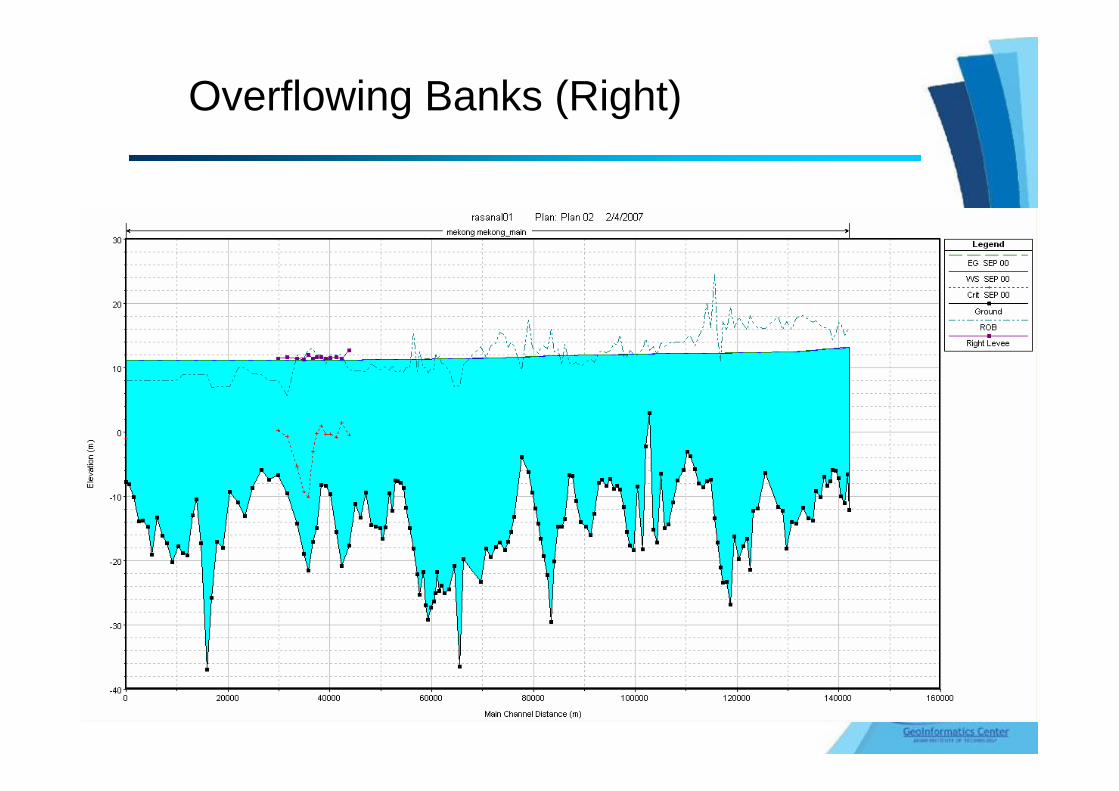
Overflowing Banks (Right)
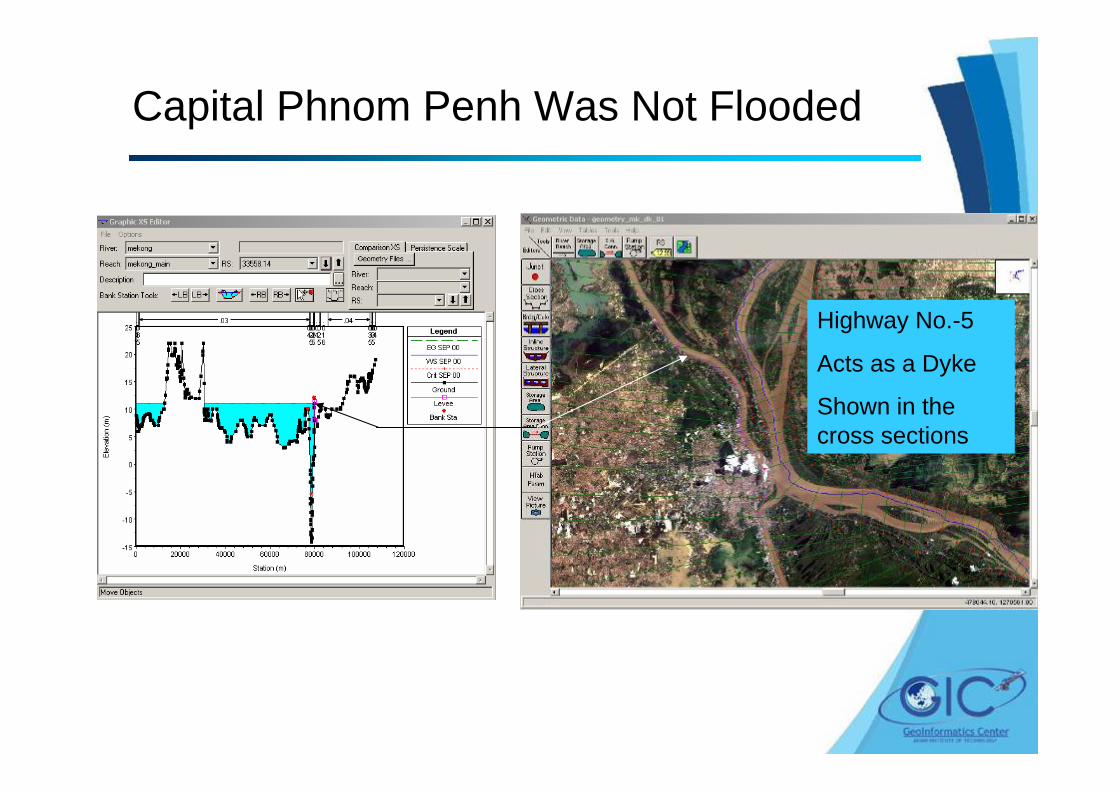
Capital Phnom Penh Was Not Flooded
Highway No.-5
Acts as a Dyke
Shown in the cross sections
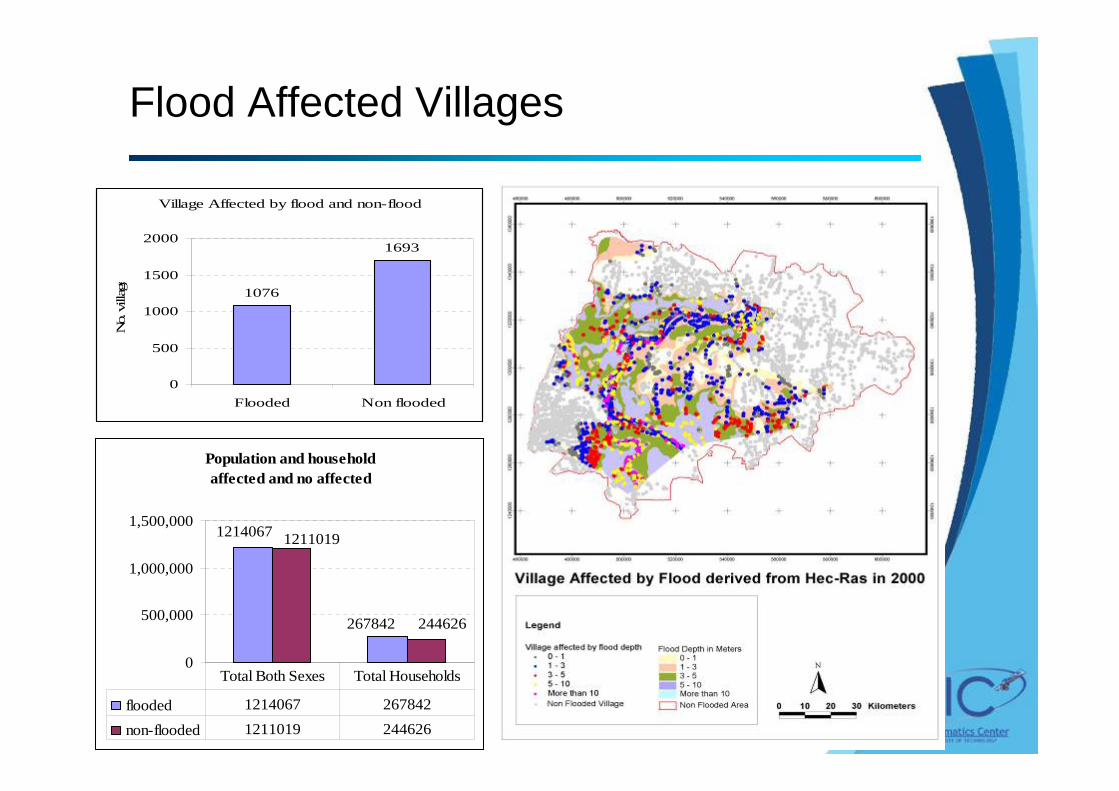
Flood Affected Villages
Village Affected by flood and non-flood
1076
1693
0
500
1000
1500
2000
Flooded Non flooded
No.
vill
age
Population and householdaffected and no affected
267842
1214067
244626
1211019
0
500,000
1,000,000
1,500,000
flooded 1214067 267842
non-flooded 1211019 244626
Total Both Sexes Total Households

Area For Flood Hazard Mapping
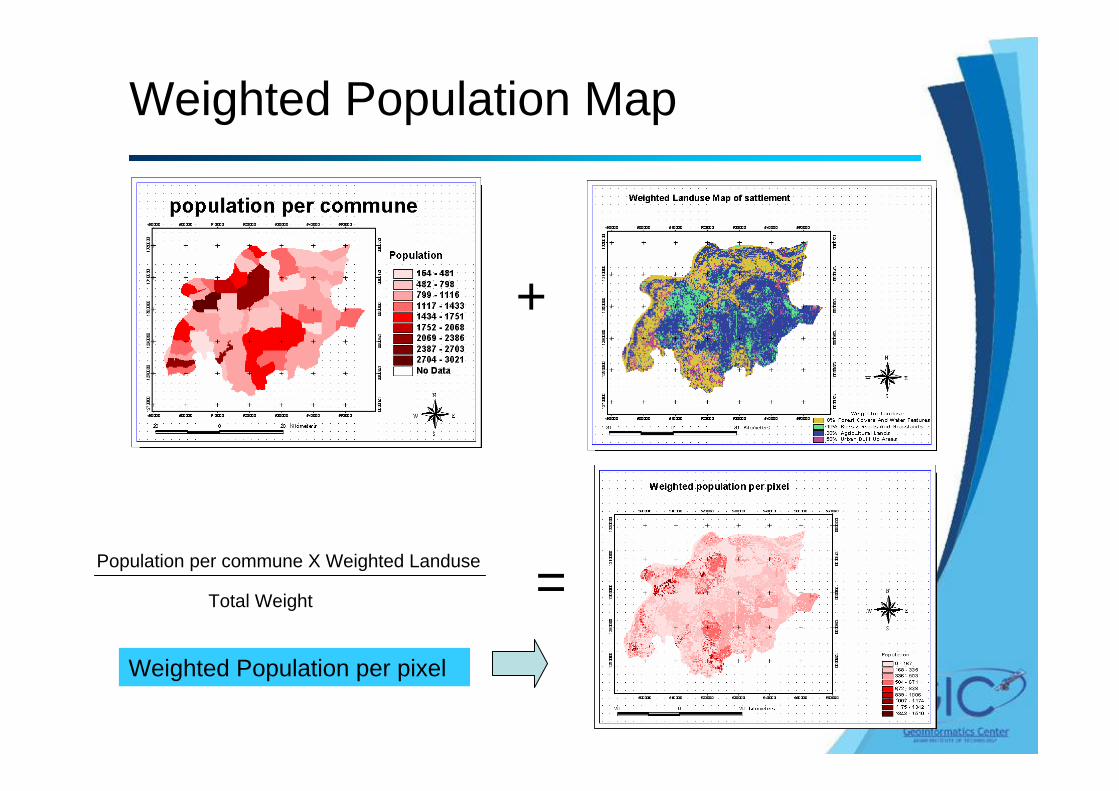
Weighted Population Map
+
=Weighted Population per pixel
Population per commune X Weighted Landuse
Total Weight
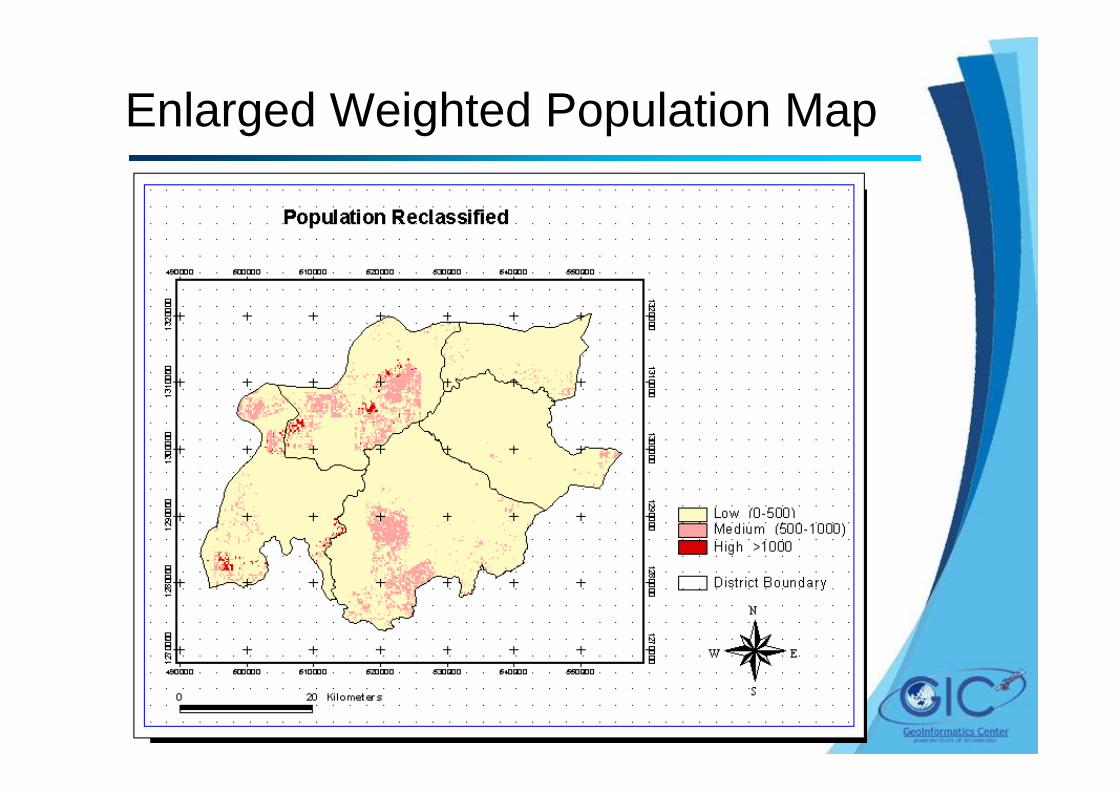
Enlarged Weighted Population Map
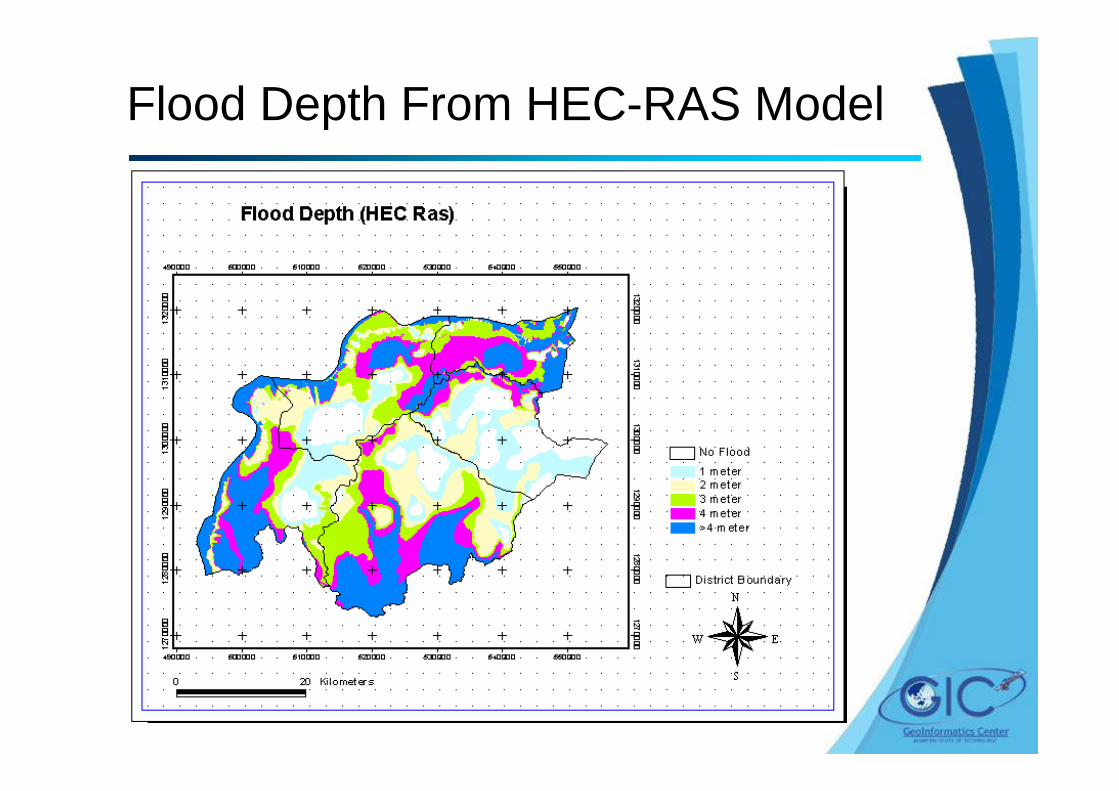
Flood Depth From HEC-RAS Model
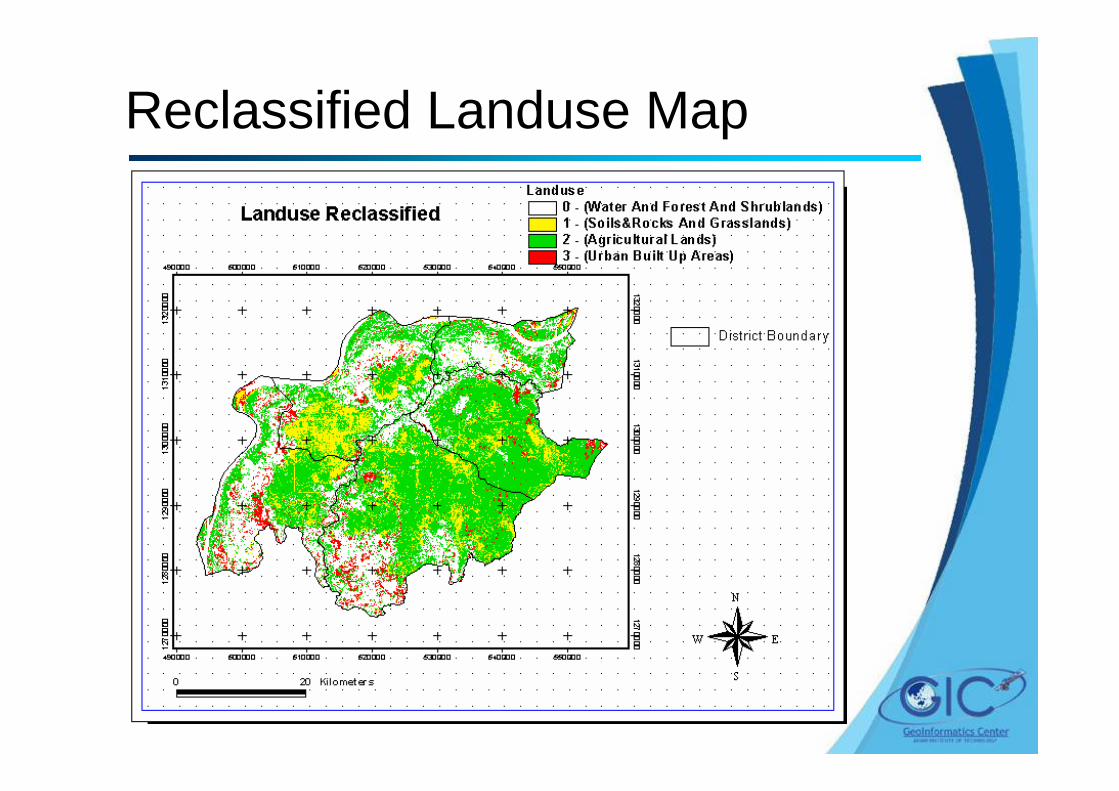
Reclassified Landuse Map
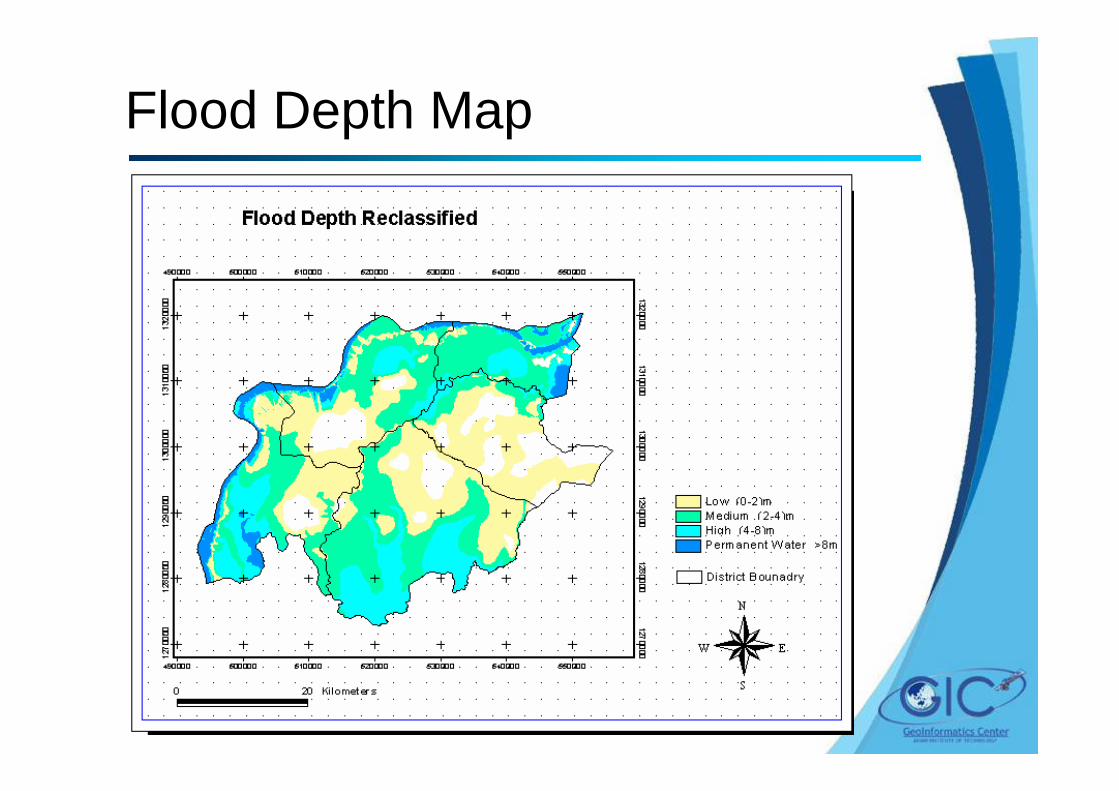
Flood Depth Map
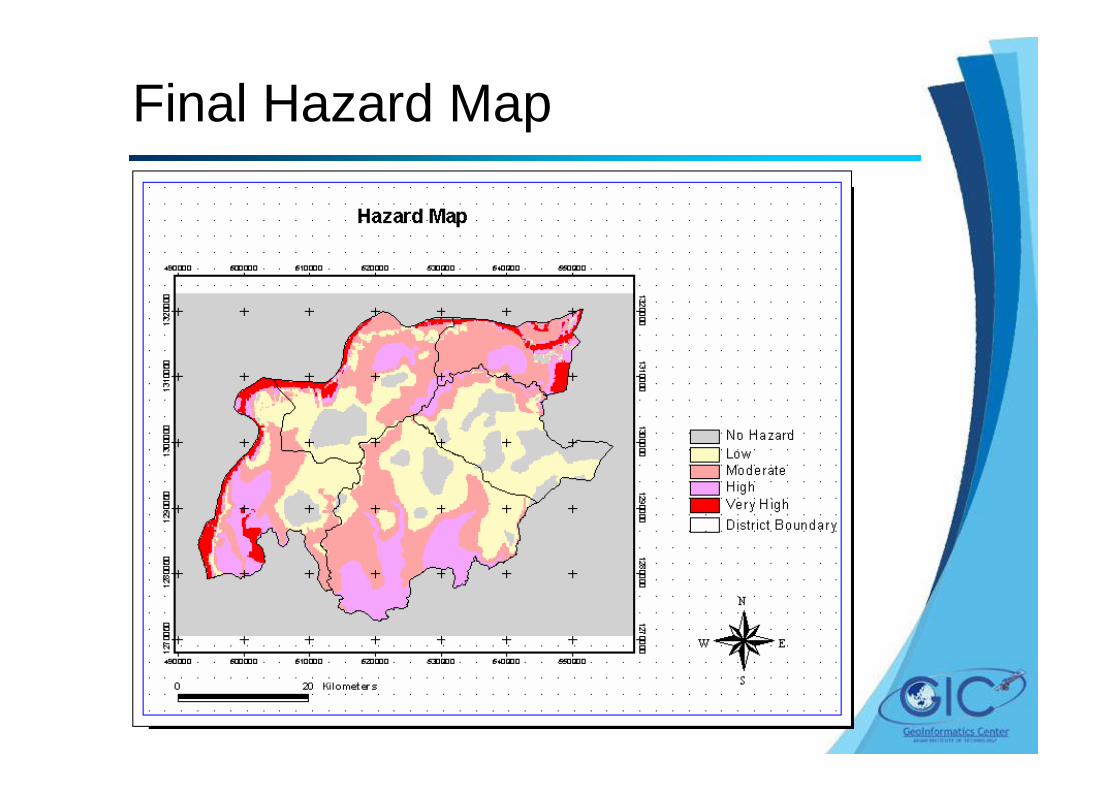
Final Hazard Map
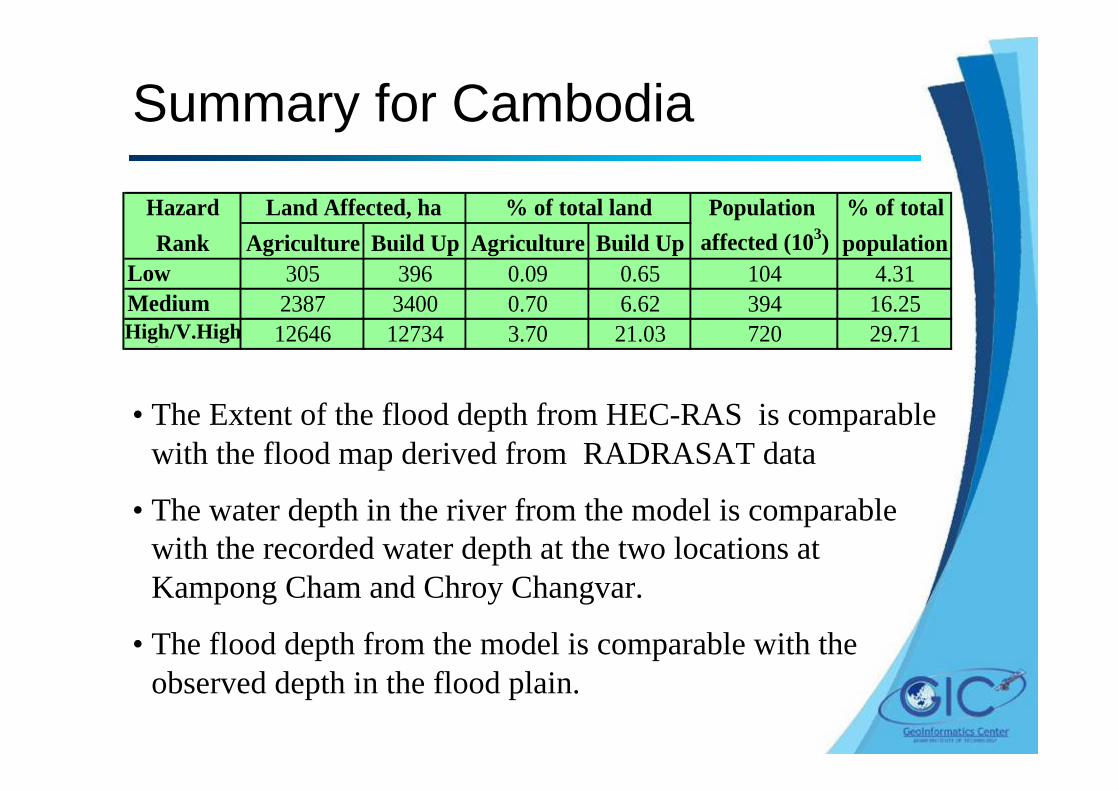
Summary for Cambodia
Hazard Population % of totalRank Agriculture Build Up Agriculture Build Up affected (103) population
Low 305 396 0.09 0.65 104 4.31Medium 2387 3400 0.70 6.62 394 16.25High 12646 12734 3.70 21.03 720 29.71
Land Affected, ha % of total land
• The Extent of the flood depth from HEC-RAS is comparable with the flood map derived from RADRASAT data
• The water depth in the river from the model is comparable with the recorded water depth at the two locations at Kampong Cham and Chroy Changvar.
• The flood depth from the model is comparable with the observed depth in the flood plain.
High/V.High
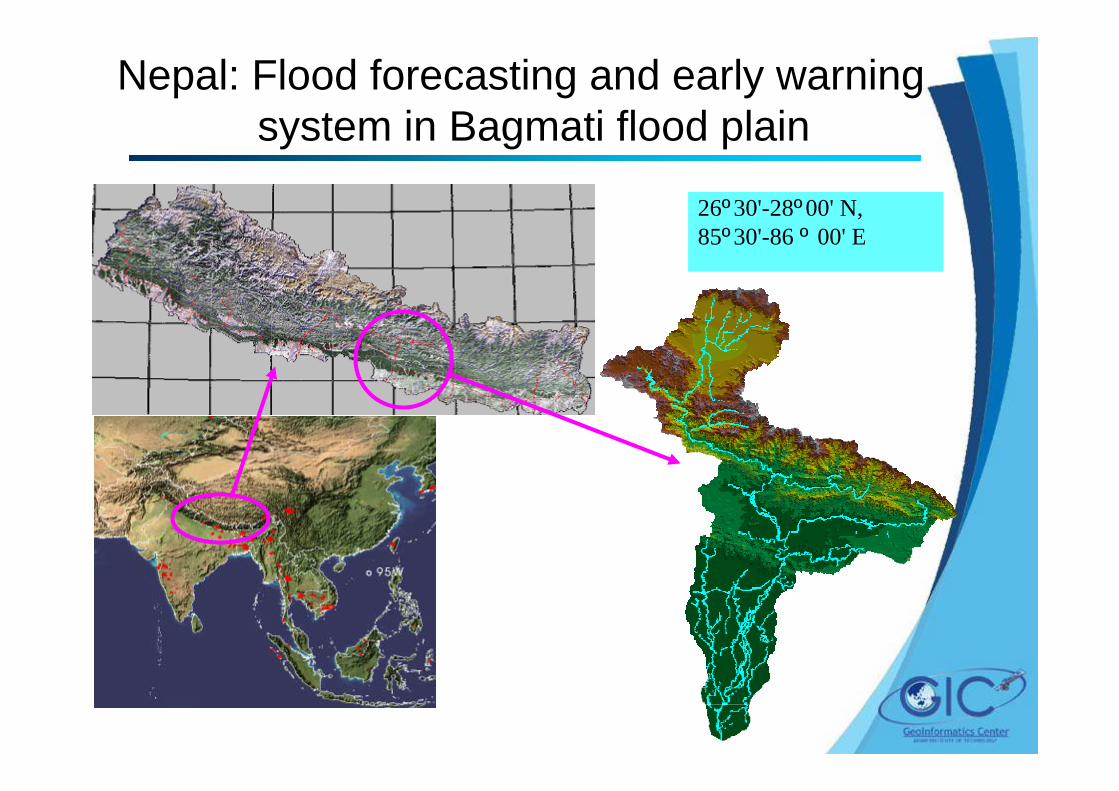
26º30'-28º00' N, 85º30'-86 º 00' E
Nepal: Flood forecasting and early warning system in Bagmati flood plain
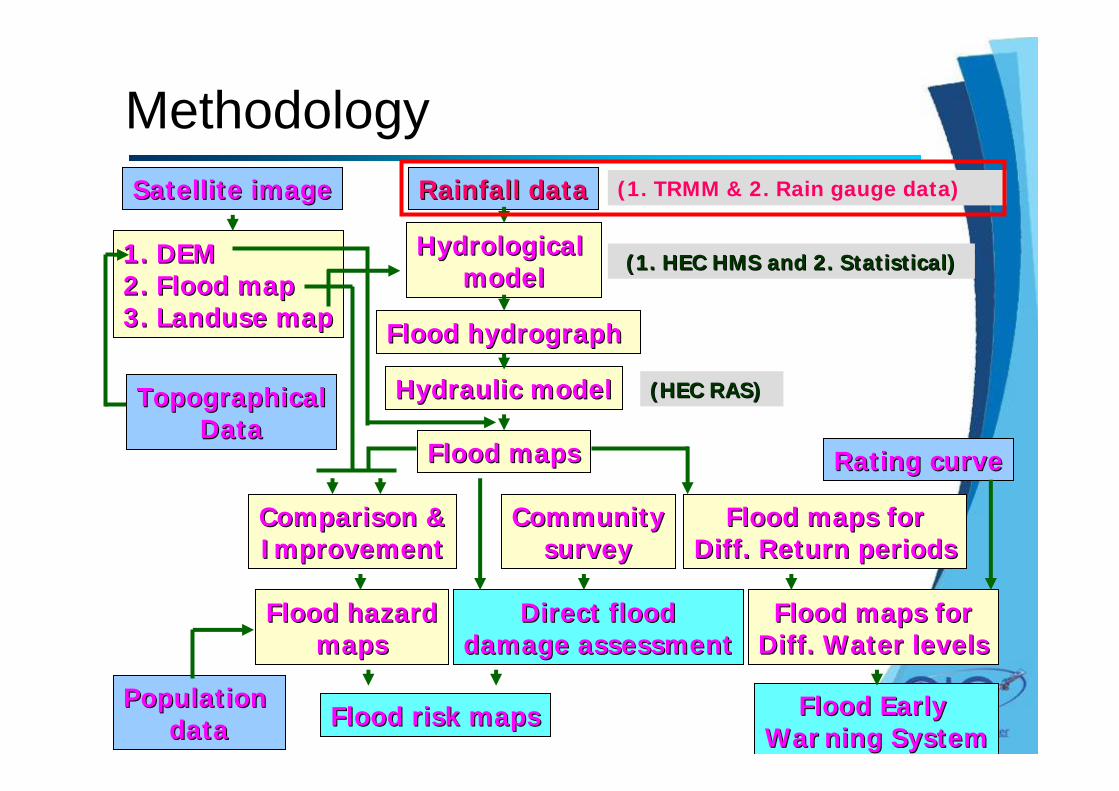
MethodologyRainfall dataRainfall data
Hydrological Hydrological modelmodel
Flood hydrograph Flood hydrograph
Hydraulic modelHydraulic model
Flood mapsFlood maps
Comparison &Comparison &ImprovementImprovement
Direct floodDirect flooddamage assessmentdamage assessment
Population Population datadata Flood risk mapsFlood risk maps
Satellite imageSatellite image
1. DEM1. DEM2. Flood map2. Flood map3. Landuse map3. Landuse map
Flood maps forFlood maps forDiff. Return periodsDiff. Return periods
Rating curveRating curve
Flood Early Flood Early WarWar ning Systemning System
Flood maps forFlood maps forDiff. Water levelsDiff. Water levels
TopographicalTopographicalDataData
(1. TRMM & 2. Rain gauge data)
(1. HEC HMS and 2. Statistical)(1. HEC HMS and 2. Statistical)
(HEC RAS)(HEC RAS)
Flood hazardFlood hazardmapsmaps
CommunityCommunitysurveysurvey
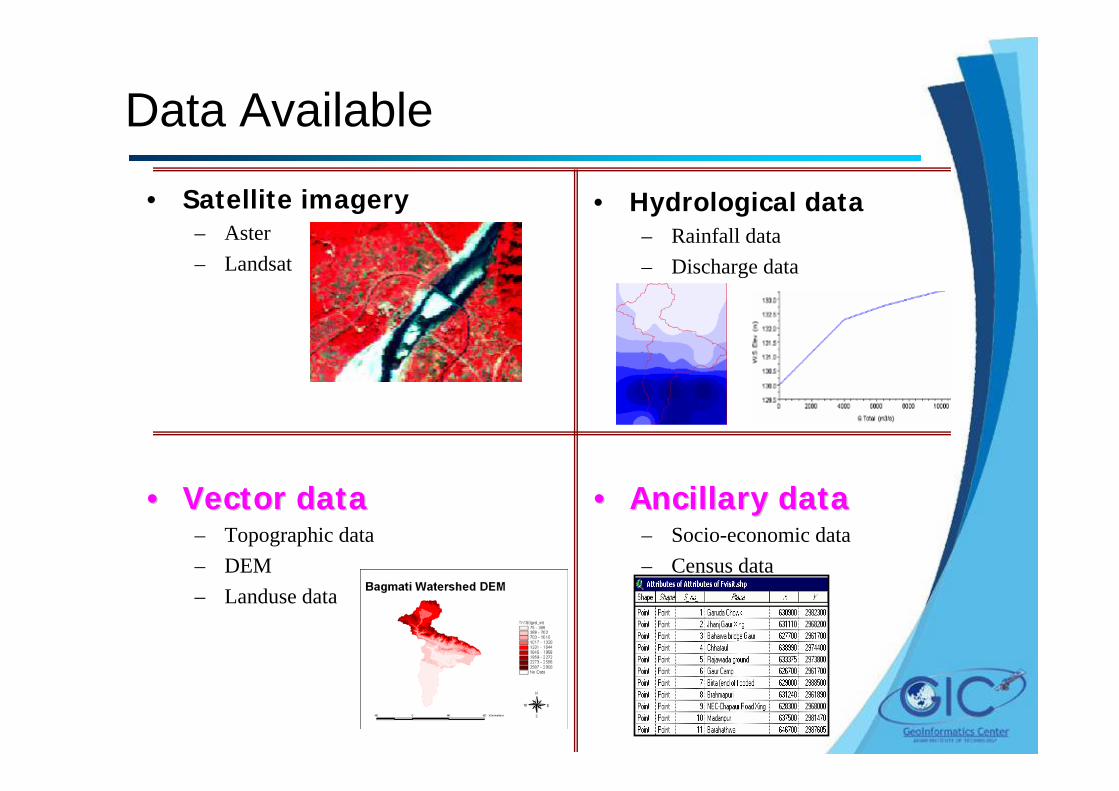
Data Available
• Satellite imagery– Aster– Landsat
• Hydrological data– Rainfall data– Discharge data
•• Vector dataVector data– Topographic data– DEM– Landuse data
•• Ancillary dataAncillary data– Socio-economic data– Census data
Assumption and Steps for discharge prediction
• TRMM rainfall data is used
• Time of Concentration = max. 24 hours
• Partially or fully covered 3B42RT grids = 15
• Contributing Grids at Gauging Station = 11
Regression Analysis Approach of Peak Discharge Prediction
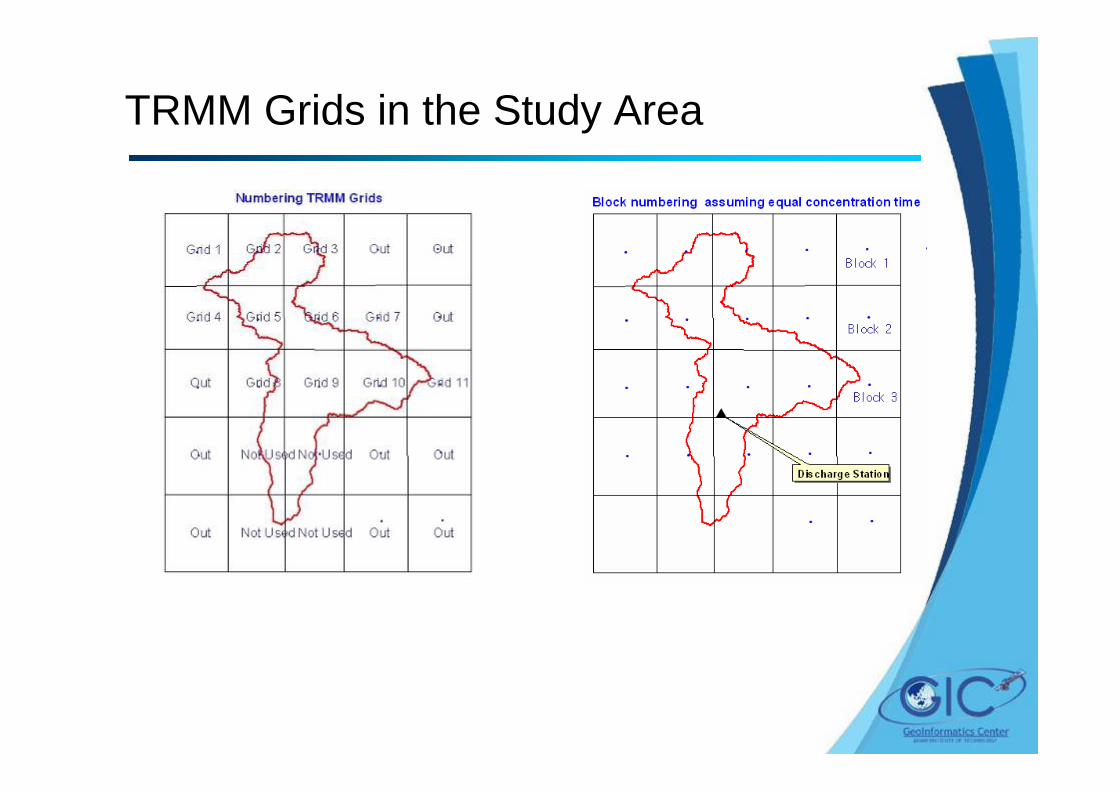
TRMM Grids in the Study Area
• Grid rainfall data are weighted according to their
aerial coverage
• Grids having equal time of concentration are grouped
together (called Block)
• Discharge (Q) = f (weighted time series of 3-hourly
rainfall)
Regression Analysis Approach of Extreme Discharge Prediction (Contd.)
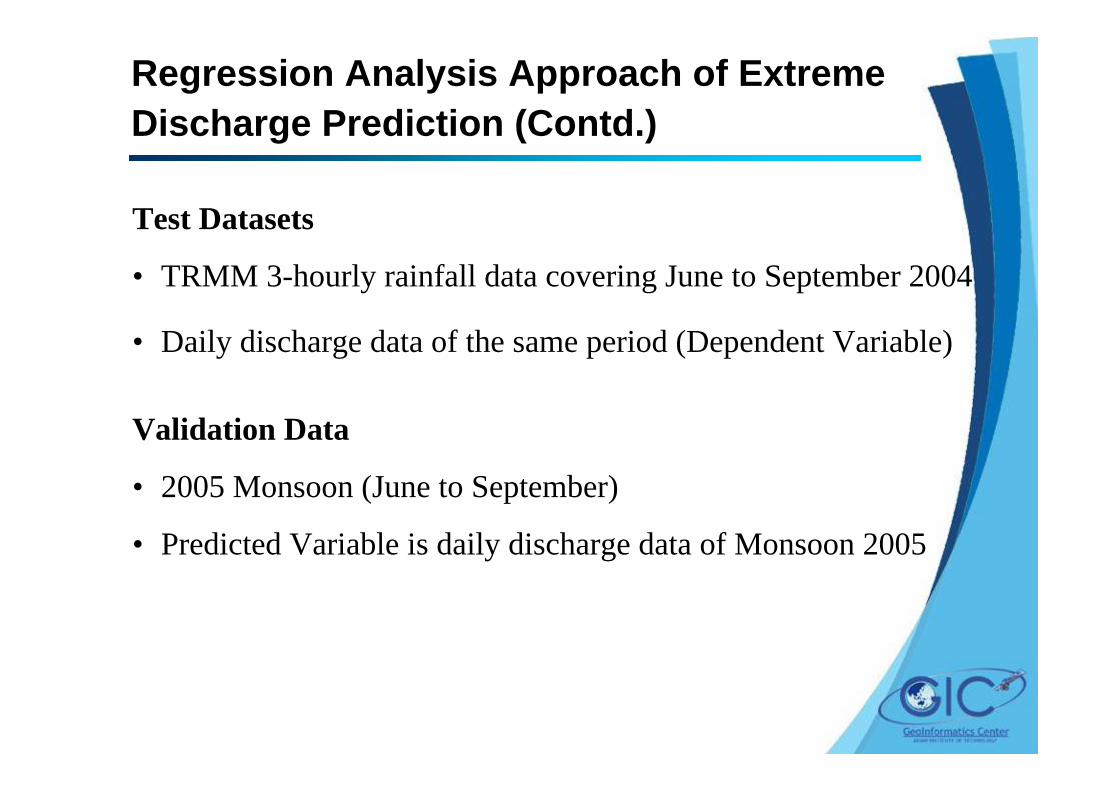
Test Datasets
• TRMM 3-hourly rainfall data covering June to September 2004
• Daily discharge data of the same period (Dependent Variable)
Validation Data
• 2005 Monsoon (June to September)
• Predicted Variable is daily discharge data of Monsoon 2005
Regression Analysis Approach of Extreme Discharge Prediction (Contd.)
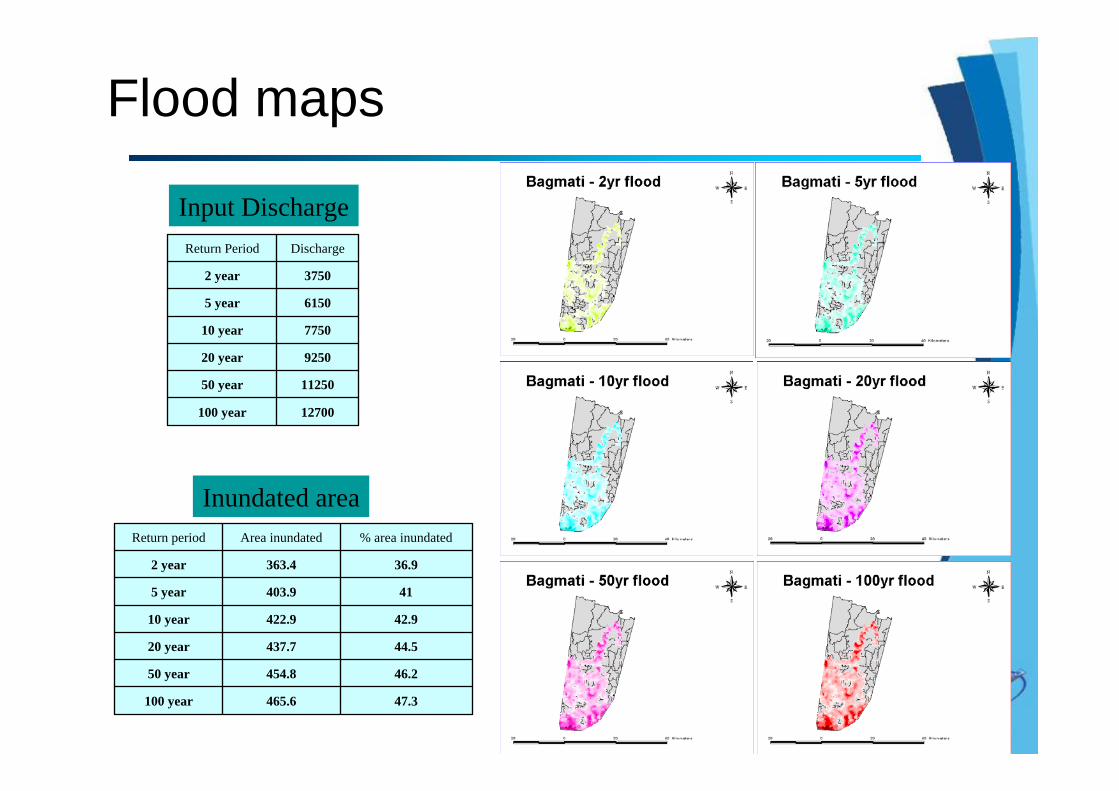
Flood maps
Input Discharge
12700100 year
1125050 year
925020 year
775010 year
61505 year
37502 year
DischargeReturn Period
47.3465.6100 year
46.2454.850 year
44.5437.720 year
42.9422.910 year
41403.95 year
36.9363.42 year
% area inundatedArea inundatedReturn period
Inundated area
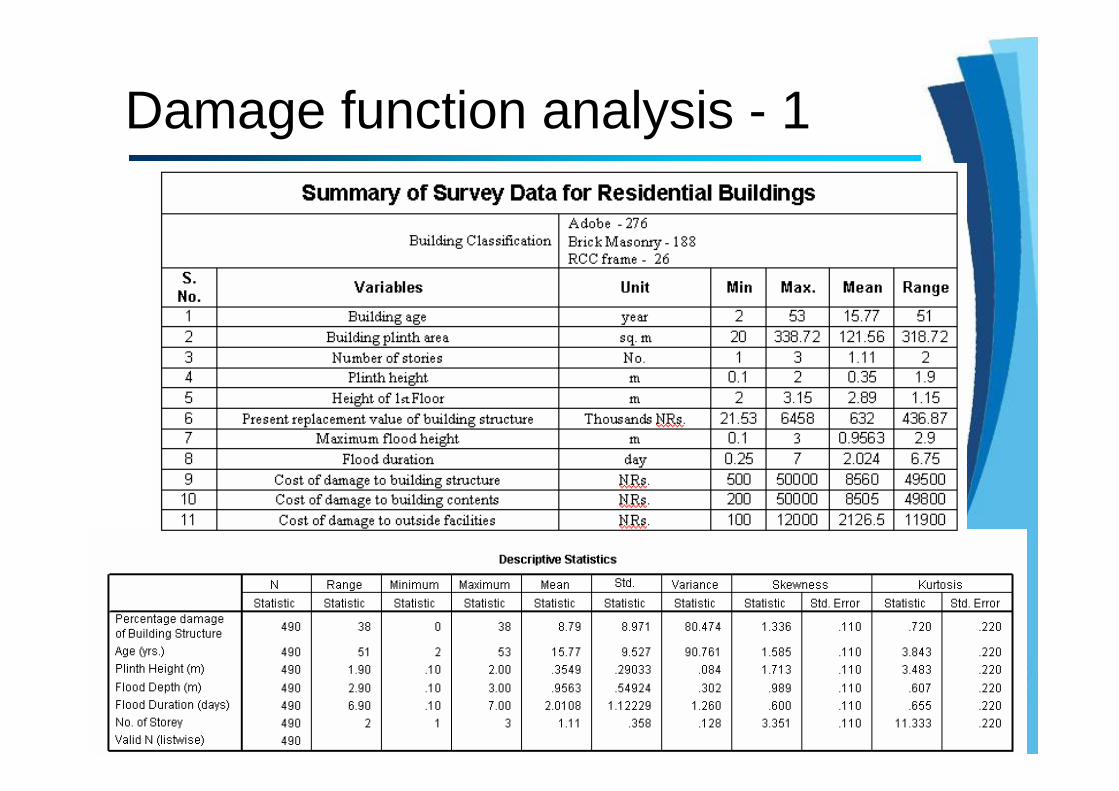
Damage function analysis - 1
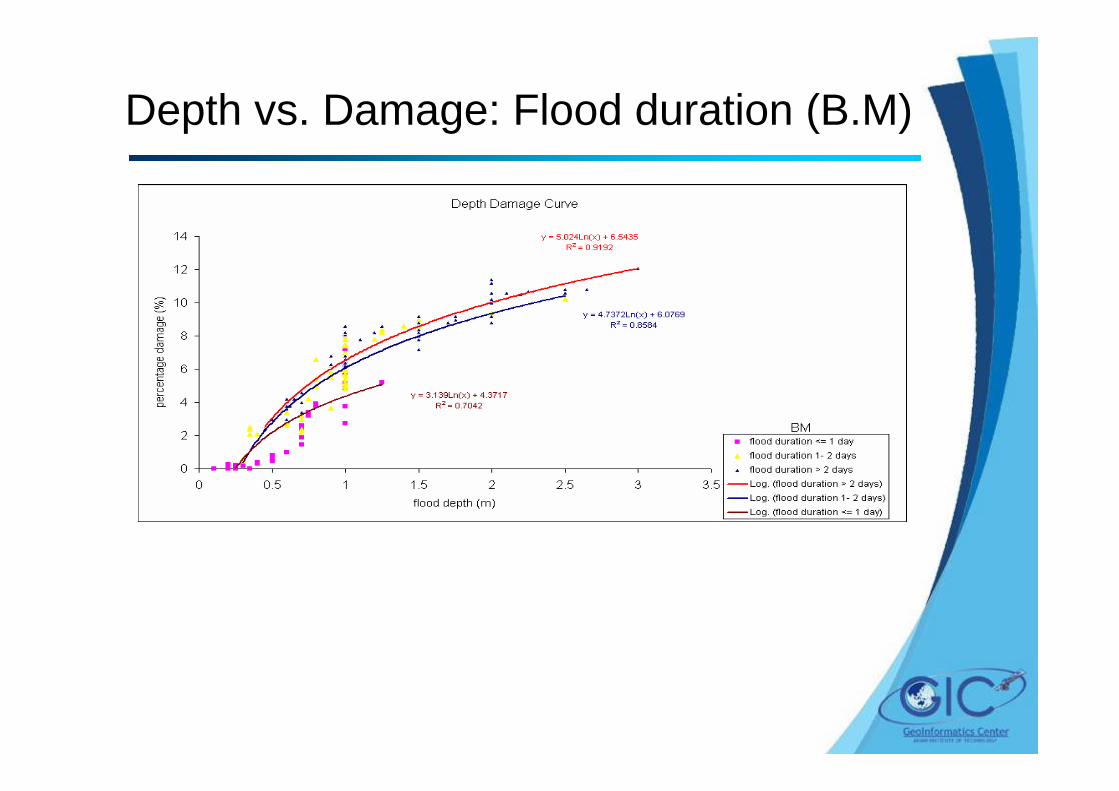
Depth vs. Damage: Flood duration (B.M)
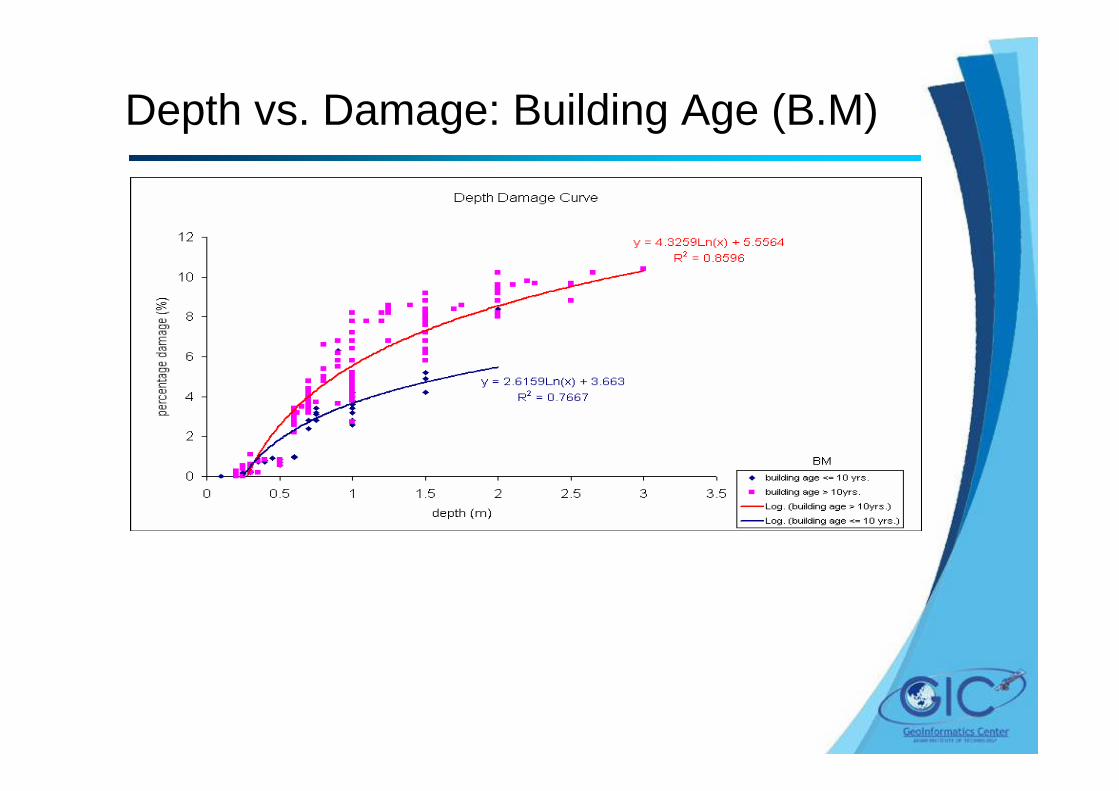
Depth vs. Damage: Building Age (B.M)
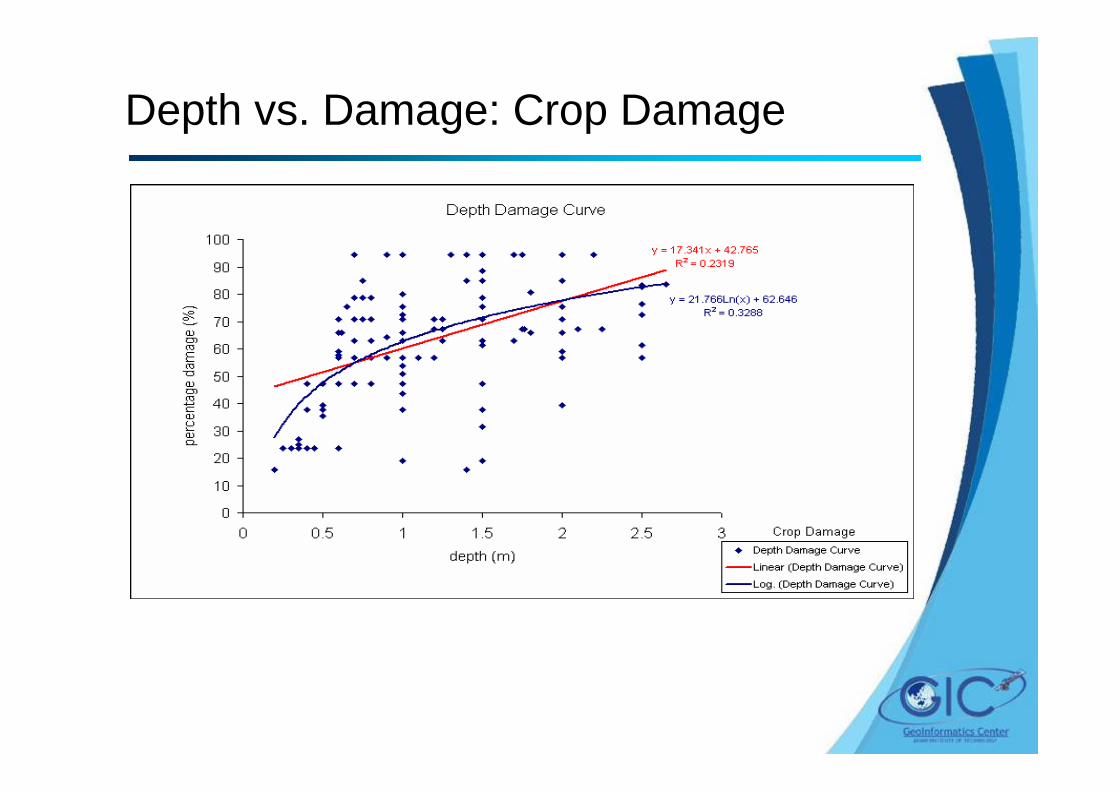
Depth vs. Damage: Crop Damage

Summary for Nepal
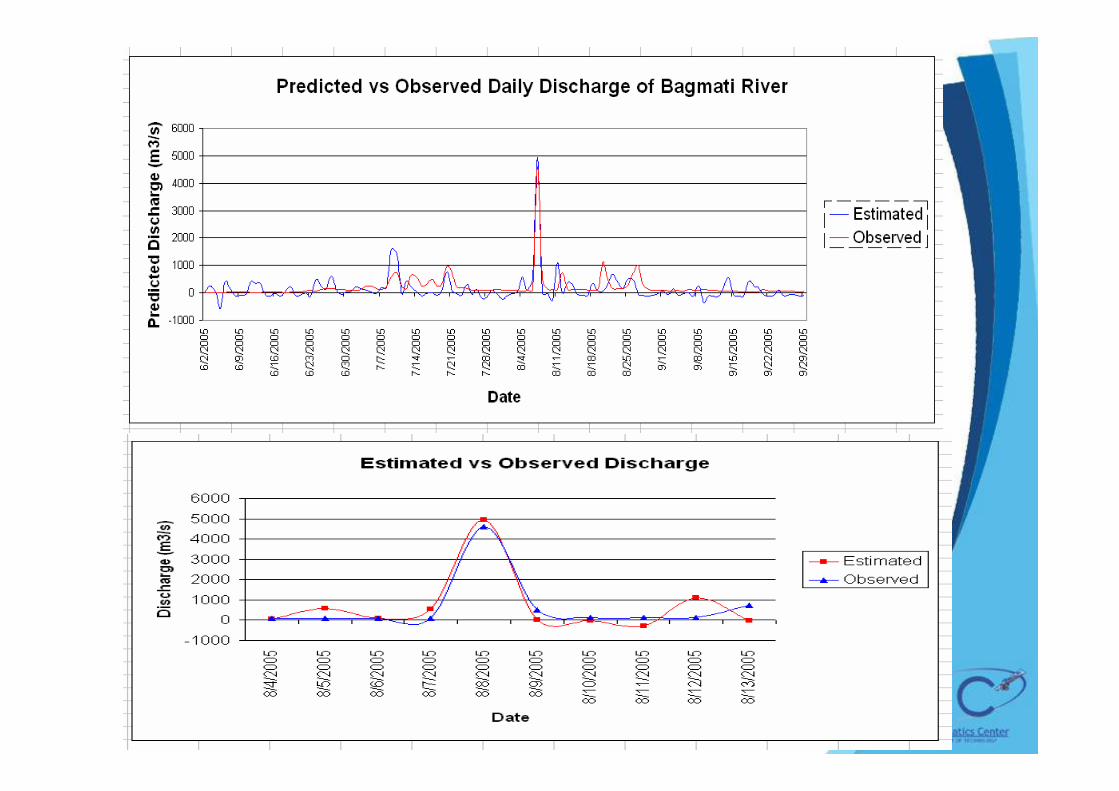
• Diurnal variability of TRMM rainfall field is well captured • TRMM rainfall field is more associated with the average
rainfall field rather than a point rainfall• Weighted time series 3-hourly TRMM data is well predict
the peak discharge which can be directly used for flood forecasting.
• The flood maps prepared for six return periods of 2, 5, 10, 20, 50 & 100yrs showed inundation area ranged from 363 – 465 sq. km. (37-47% of the total area of the two districts)
• Flood loss functions were generated for structural damage of residential and commercial buildings
Cambodia1. Yin Savuth Ministry of Water Resources and Meteorology2. Ro Narith Ministry of Land Management, Urban,
Planning and Construction3. Noun Kunthea RFMMC, Mekong River Commission
NepalSudarshan Karki Survey DepartmentRishi Ram Sharma Dept of Hydro. and Met.Rajan Shrestha Dept of Water Induced Disaster Prevention
Geoinformatics Center/AITMr. Tanka Kafle
Acknowledgements

Thank you for your kind attention