capacity: a follow-up study of the coexistence of hf and
TRANSCRIPT

Page 1/27
Responses to Incremental Exercise and the Impactof the Coexistence of HF and COPD on ExerciseCapacity: A Follow-up StudyPolliana B. Dos Santos
Federal University of Sao CarlosRodrigo P. Simões
Federal University of AlfenasCassia L. Goulart
Federal University of Sao CarlosGuilherme P. T. Arêas
Federal University of AmazonasRenan S. Marinho
Federal University of Sao CarlosPatrícia F. Camargo
Federal University of Sao CarlosMeliza G. Roscani
Federal University of Sao CarlosRenata F. Arbex
Federal University of Sao CarlosCláudio R. Oliveira
Federal University of São Carlos - UFSCarRenata G. Mendes
Federal University of Sao CarlosRoss Arena
University of Illinois at ChicagoAudrey Borghi-silva ( [email protected] )
Federal University of Sao Carlos
Research Article
Keywords: heart failure, chronic obstructive pulmonary disease, overlap syndrome, cardiopulmonaryexercise testing
Posted Date: August 6th, 2021

Page 2/27
DOI: https://doi.org/10.21203/rs.3.rs-757797/v1
License: This work is licensed under a Creative Commons Attribution 4.0 International License. Read Full License
Version of Record: A version of this preprint was published at Scienti�c Reports on January 31st, 2022.See the published version at https://doi.org/10.1038/s41598-022-05503-5.

Page 3/27
AbstractAim: Our aim was to evaluate: 1) the prevalence of coexistence of heart failure (HF) and chronicobstructive pulmonary disease (COPD) in the studied population; 2) the impact of HF+COPD on exerciseperformance and contrasting exercise responses in patients with only a diagnosis of HF or COPD; and 3)the relationship between clinical characteristics and measures of cardiorespiratory �tness; 4) verify theoccurrence of cardiopulmonary events in the follow-up period of up to 24 months years.
Methods: The current study included 124 patients (HF:46, COPD: 53 and HF+COPD:25) that performedadvanced pulmonary function tests, echocardiography, analysis of body composition by bioimpedanceand symptom-limited incremental cardiopulmonary exercise testing (CPET) on a cycle ergometer. Allpatients were contacted by telephone every 6 months and questioned about exacerbations,hospitalizations for cardiopulmonary causes and death.
Results: We found a 20% prevalence of HF + COPD overlap in the studied population. Patients withHF+COPD demonstrated a lower work rate (WR), peak oxygen uptake (V̇O2), rate pressure product (RPP),circulatory power (CP) and ventilatory power (VP) compared to those only diagnosed with HF and COPD.In addition, signi�cant correlations were observed between lean mass and peak V̇O2 (r: 0.56 p< 0.001),the oxygen uptake e�ciency slope (OUES) (r: 0.42 p<0.001), and O2 pulse (r: 0.58 p<0.001), lung diffusingfactor for carbon monoxide (DLCO) and WR (r: 0.51 p< 0.001), DLCO and VP (r: 0.40 p: 0.002), forcedexpiratory volume in �rst second (FEV1) and peak V̇O2 (r: 0.52; p< 0.001), and FEV1 and WR (r: 0.62;p<0.001). There were no signi�cant differences in the occurrence of events and deaths contrasting bothgroups.
Conclusion: the coexistence of HF+COPD induces greater impairment on exercise performance whencompared to patients without overlapping diseases, however the overlap of the two diseases did notincrease the probability of the occurrence of cardiopulmonary events and deaths when compared togroups with isolated diseases in the period studied. CPET provides important information to guideeffective strategies for these patients with the goal of improving exercise performance and functionalcapacity. Moreover, given our �ndings related to pulmonary function, body composition and exerciseresponses, evidenced that the lean mass, FEV1 and DLCO in�uence important responses to exercise.
IntroductionThe incidence and prevalence of chronic-degenerative diseases in a progressively elderly population hasincreased worldwide over the last several decades1. In this context, cardiopulmonary disease (CPD) isincreasing and remains the leading cause of death in many countries; in Brazil, CPD is responsible forapproximately 20% of all deaths in adults 30 years of age or older2,3.
Heart failure (HF) and chronic obstructive pulmonary disease (COPD) are predominant chronic diseases;the growing prevalence of HF and COPD re�ects a combination of increasing incidence, an aging

Page 4/27
population, and improvements in the treatment of both diseases4,5,6. HF and COPD share similar signsand symptoms, and often coexist, leading to a worse prognosis, as well as greater challenges fordiagnosis and the establishment of therapeutic interventions. It is estimated that the prevalence of HF inpatients with COPD and vice versa is between 10% and 25% in developed countries7,8.
One of the most common and impactful symptoms in patients with either independent or overlapping HFand COPD is decreased exercise capacity; a commonly reported subjective symptom in dyspnea withexertion9,10. Therefore, a comprehensive assessment of exercise capacity is relevant in these patientpopulations from diagnostic, prognostic and therapeutic e�cacy perspective.
Cardiopulmonary exercise testing (CPET) is the gold-standard approach to assessing exercise capacityand more broadly cardiorespiratory �tness; an evidence-based panel of core CPET measures allows for amore comprehensive evaluation11. Through CPET, ventilatory and gas exchange, as well as heart rate(HR), electrocardiogram, and blood pressures, are measured to provide detailed information on thecardiovascular, pulmonary, and muscular systems as well as detect the primary limitation to exercise inthese chronic conditions12.
Both patients with HF and COPD have been studied extensively, but largely as separate and distinctclinical diagnoses. The coexistence of HF and COPD has important therapeutic and prognosticimplications, the knowledge about the prevalence of the concomitance of these diseases is clinicallyrelevant. Moreover, follow-up studies have contributed substantially to the understanding of diseaseprogression, clinical outcomes, mortality, and use of resource in health, as both conditions are quitedisabling, generating heightened concern when these conditions coexist.
In the present study, we hypothesized that HF+COPD would further deteriorate cardiorespiratory �tnesscompared to patients diagnosed with HF and COPD in isolation. We additionally hypothesized that thereare relationships between clinical characteristics and CPET measures of cardiorespiratory �tness. Thespeci�c aims of this study was to assess: 1) the prevalence of HF and COPD overlap in the studiedpopulation; 2) the impact of the overlapping HF+COPD on exercise capacity and cardiorespiratory �tnessand to contrast these measures in patients with either HF or COPD in isolation; and 3) the relationshipbetween clinical characteristics and measures of cardiorespiratory �tness 4) verify the occurrence ofexacerbations, hospitalizations and deaths in the follow-up period of up to 24 months.
Methods
Study Design and Subjects This cross-sectional study was reported following recommendations of the Strengthening the Reportingof Observational Studies in Epidemiology (STROBE) statement13. Three-hundred �fteen patients werescreened from 3 cardiology and pneumology outpatient clinics of the University Hospital of the FederalUniversity of São Carlos, from 01 June 2017 to 30 December 2019. All patients who attended during this

Page 5/27
period with the diagnosis of HF with reduced or borderline ejection fraction (EF) and/or COPD werecontacted by phone and was asked questions regarding diagnosis, clinical conditions, disease stability,drug optimization, and functional mobility. For all patients, eligibility criteria were: 1) age range of 40–85years; 2) clinically stable for at least 3 months (i.e., no worsening of symptoms, exacerbation ordecompensation); 3) no change in dose or change in medication for at least 3 months; 4) nohospitalizations for any cause for at least 3 months; and 5) absence of any condition that may affectexercise performance (e.g., anemia, neuromuscular disorders, or malignancies). Exclusion criteriaincluded: 1) long-term O2 therapy; 2) musculoskeletal disease that would impact exercise performance(e.g., osteoarthritis, osteonecrosis, trauma, etc.); and 3) peripheral arterial disease associated withclaudication. Moreover, HF or COPD exacerbation or hospitalization during the study was a criterion forstudy drop-out. All patients who met the eligibility criteria were invited for an initial assessment and teststo con�rm the diagnosis of one (HF or COPD) or both (HF+COPD) diseases being assessed in the currentstudy.
Disease treatment was optimized before study entry and patients underwent CPET only after anagreement had been reached between pneumologists and cardiologists regarding disease stability. Asshowed in Figure 1, 124 patients with a con�rmed diagnosis of HF and/or COPD were included. TheStudy followed the resolution no. 466 of the National Health Council (current guideline in Brazil) and TheDeclaration of Helsinki and was approved by the Ethics and Research Committee of the FederalUniversity of São Carlos. All participants were informed about the objectives, experimental proceduresand potential risks involved in this study and gave written informed consent statement prior toparticipation.
Cardiac and Lung function AssessmentsAll patients underwent a transthoracic two-dimensional and Doppler echocardiographic (HD11 XE,Philips, Amsterdam, Netherlands) examination at baseline to con�rm the diagnosis, stratify the degree ofsystolic dysfunction, and obtain the necessary measures for cardiac function in the HF and HF+COPDgroups and con�rm the absence of reduced ejection fraction in the COPD group. Patients with HF weredetermined according to left ventricle ejection fraction ≤50%14. Advanced pulmonary functionassessment (Masterscreen Body, Mijnhardt/Jäger, Würzburg, German) was performed to obtain dynamicand static lung volumes and capacities, such us Forced Expiratory Volume in 1s (FEV1), Forced VitalCapacity (FVC), Residual Volume (RV), Total Lung Capacity (TLC), Inspiratory Capacity (IC), and DiffusionCapacity Carbon Monoxide (DLCO) pre and post-bronchodilator therapy. The GOLD criteria [post-
bronchodilator FEV1/ FVC ratio < 0.70] was used to con�rm a COPD diagnosis15.
Cardiopulmonary exercise testing

Page 6/27
All patients underwent a symptom-limited CPET on an electronically braked cycle ergometer (CorivalRecumbent, Lode, Groningen, Netherlands) using the Oxycon Mobile System (Mijnhardt/Jäger, Würzburg,German). The exercise protocol started with 5 min of data collection at rest, followed by unloaded cyclingfor 1 min with a subsequent increment of 5–10 watts each minute (ramp protocol). Patients wereinstructed to pedal at the cadence of 60 rotation per minute and the work rate (WR) increment wasindividually selected according to reported exercise tolerance. Breath-by-breath V̇O2 (L/min), V̇CO2
(L/min), and V̇E (L/min) were recorded. The CPET variables were reported as 20-second averaged data.During the exercise test, HR, twelve-lead electrocardiogram (ECG), blood pressure (BP), and arterialoxygen saturation were monitored. Arterial oxygen saturation was measured non-invasively by pulseoximetry (SpO2, %). Breathlessness and leg effort scores were rated according to the 10-point Borg
category ratio16. Established exercise test termination criteria were followed and included angina (scoreabove 2 on a scale of 0-10), life-threatening arrhythmias, electrocardiographic evidence of ischemia, adrop in systolic blood pressure, or arterial oxygen saturation ≤ 84% were considered to interrupt thetest17. Key CPET variables were calculated for all patients as previously described. The V̇E/V̇CO2 slope
was obtained through linear regression analysis18. Additionally, the linear relationship between oxygenuptake and the log transformation of V̇E (OUES) was calculated using the following equation: V̇O2= a log
V̇E+ b, with the constant ‘a’ referring to the rate of increase of V̇O219. Circulatory power (CP) was obtained
through the product of peak V̇O2 and peak systolic blood pressure and Ventilatory Power (VP) was
calculated by dividing peak systolic blood pressure by the V̇E/V̇CO2 slope 20,21.
Patients follow-up All patients were followed for 24 months. The follow-up of patients was carried out through telephonecontact every six months, where the patient or caregiver (in case the patient was unable to respond)answered a questionnaire with information regarding occurrence of cardiopulmonary events such asdiseases exacerbations, hospitalizations by cardiopulmonary causes [acute myocardial infarction (AMI),stroke, cardiac or pulmonary surgery] and death.
Statistical analysisA sample calculation was performed (GPower 3.1- University of Kiel, Kiel, Germany) using the peakV̇O2 obtained in pilot studies previously performed in our laboratory with individuals who were diagnosedwith HF and COPD. From this sample calculation, 42 subjects, 14 for each group, were needed to reachsu�cient statistical power (1-β err prob) of 0.80. The Shapiro-Wilk test was used to verify the datadistribution. Descriptive variables were expressed as mean ± standard deviation, when normaldistribution was present, or median and interquartile, when non-normal distribution was not present.Categorical variables are expressed as frequencies and percentages and compared using the chi-squaretest. A one-way ANOVA was used to compare anthropometric measures, cardiac and pulmonary function

Page 7/27
measures and CPET measures. A two-way ANOVA was used to compare the exercises responses betweengroups at different times of exercise. Relationships between measures collected in the current study wereassessed by the Pearson Correlation coe�cient which correlation strengths will be classi�ed as trivial -<0.1, small – 0.30 – 0.50, large - 0.50 – 0.70, very large - >0.70 – 0.90, nearly perfect - >0.9022. Theanalysis of the occurrence of events: number of disease exacerbations, number of hospitalizations forcardiopulmonary causes in the period, onset of AMI, stroke, cardiac or pulmonary surgery and death fromcardiopulmonary causes was evaluated by the analysis of Klapan-Meier survival with the groups beingcompared using the Log-rank test. A p-value <0.05 was considered as statistically signi�cant for all tests.All statistical analyses were performed using the Statistical Package for the Social Sciences (SPSS) 20.0(IBM, Armonk, New York) and PRISM 9.0 (GraphPad, San Diego, California).
Results
Clinical and resting characteristicsFigure 2 demonstrates that the prevalence of coexisting HF and COPD diagnoses in the studiedpopulation was 20%. Of the 25 patients who were included in the HF + COPD group, only 18 patients(72%) had a previous diagnosis of overlap, while 7 (28%) patients were diagnosed with the overlap afterperforming the echocardiogram or advanced pulmonary assessment in our study. The 7 patients where adiagnosis of HF or COPD was newly identi�ed were referred for medication optimization and, after 3months, returned to complete data collection for the current study.
Patient characteristics are reported in Table 1. Signi�cant differences were found for mostanthropometric and clinical variables amongst HF, COPD and HF + COPD groups. Most patients in bothgroups were male while patients in the COPD and HF + COPD groups were older (p < 0.05). In relation tocardiac function, as expected, patients with COPD presented with preserved systolic function, while in theHF and HF + COPD demonstrated similar levels of systolic dysfunction, although differences between HFand HF + COPD groups were found in systolic dysfunction staging (p < 0.05). Differences were found inthe Mitral E wave in the HF and COPD groups. As expected, COPD and HF + COPD patients showedevidence of an obstructive ventilatory disorder. The frequency of patients in stage 2 according to theGOLD guidelines was greater in the COPD group. HF patients showed lower static lung volumes whencompared to the COPD group (p < 0.05); differences were also found in Residual volume (RV), % predictedTLC and DLCO. Comorbidities the most common in the HF group with hypertension being the mostfrequent comorbidity.

Page 8/27
Table 1Anthropometric and clinical characteristics of studied subjects.
Variables HF
n = 46
COPD
n = 53
HF + COPD
n = 25
p
Age, years 60 ± 8 65 ± 7* 68 ± 7* < 0.000
Gender, M/F (n) 32/14 37/16 25/0 0.007
Height, m 1.66 ± 0.93 1.66 ± 0.26 1.75 ± 0.1*# < 0.000
Weight, kg 80 ± 16 69 ± 15* 71 ± 14 0.003
BMI, kg/m2 29 ± 6 25 ± 4* 25 ± 4* 0.002
Lean mass, % 50 ± 10 42 ± 8* 48 ± 9 0.02
Fat-free mass, % 53 ± 10 45 ± 8* 51 ± 10 0.01
Body fat, % 26 ± 9 20 ± 9 19 ± 8 0.06
Protein, % 10.4 ± 2 8 ± 1* 10.1 ± 2 0.02
Minerals, % 3.6 ± 0.7 2.9 ± 0.5* 3.4 ± 0.7 0.005
Cardiac Function
Ejection Fraction, % 40 ± 7 70 ± 8* 38 ± 8# < 0.000
Mild/Moderate/Severe LV dysfunction (n) 26/17/3 - 10/11/4 < 0.000
Indexed LA volume, ml/m2 39 ± 18 36 ± 13 44 ± 11 0.21
Mitral E wave, cm/sec 76 ± 24 63 ± 14* 68 ± 25 0.03
Mitral e’ wave, cm/sec 7 ± 2 9 ± 2 7 ± 5 0.30
E/e’ ratio. cm/sec 11 ± 7 8 ± 3 10 ± 6 0.11
RVD, mm 33(30–44) 32(25–37) 33(31–41) 0.14
Used ANOVA one way for continuous variables and used chi-square test for categorical variables; HF:Heart Failure, COPD: Chronic Obstructive Pulmonary Disease, M: male, F: Female, BMI: Body MassIndex, LV: Left ventricle, LA: Left atrium, RVD: Right ventricle diameter, FEV1: Forced Expiratory Volumein 1s, FVC: Forced Vital Capacity, RV: Residual Volume, TLC: Total Lung Capacity, IC: InspiratoryCapacity, DLCO: Diffusion Capacity Carbon Monoxide NYHA: New York Heart Association, mMrc:modi�ed Medical Research Council scale, DM: Diabetes mellitus, CI: Coronary insu�ciency, OSA:obstructive sleep apnea. Patients that peformed DLCO: 58 (HF:28, COPD:20, HF + COPD:10)
* Signi�cant difference (p < 0.05) in relation to the HF group.
# Signi�cant difference (p < 0.05) in relation to the COPD group.

Page 9/27
Variables HF
n = 46
COPD
n = 53
HF + COPD
n = 25
p
Pulmonary Function
FEV1, L/s 2.55 ± 0.7 1.38 ± 0.9 2.00 ± 0.6 0.49
FEV1, % predicted 84 ± 20 54 ± 21* 65 ± 25* < 0.000
FVC, L/s 3.31 ± 0.9 2.80 ± 2 3.40 ± 0.8 0.65
FVC, % predicted 89 ± 16 79 ± 25 87 ± 22 0.05
FEV1/FVC, L/s 0.78 ± 0.7 0.52 ± 0.1* 0.59 ± 0.1* 0.03
RV, L 2.6 ± 1.1 3.9 ± 1.7* 3.3 ± 1.0 0.004
RV, % predicted 127 ± 49 203 ± 93* 143 ± 44 < 0.000
TLC, L 5.2 ± 1.6 6.0 ± 1.7 5.9 ± 1.3 0.19
TLC, % predicted 88 ± 24 112 ± 36* 99 ± 30 0.01
RV/TLC 0.48 ± 0.12 0.65 ± 0.15* 0.55 ± 0.11 < 0.000
IC, L 1.9 ± 0.8 1.6 ± 0.8 1.3 ± 0.5 0.08
IC, % predicted 75 ± 32 70 ± 25 51 ± 19 0.07
DLCO, mL/ mim/ mmHg 20 ± 5 13 ± 5* 17 ± 6 0.001
DLCO, % predicted 82 ± 13 61 ± 23* 72 ± 20 0.002
GOLD Stage, I/II/III/IV - 7/28/14/4 9/11/5/0 < 0.000
Pack/years 40 ± 33 83 ± 77* 59 ± 30 0.005
Functional Classi�cation
NYHA, I/II/II/IV 20/20/6/0 - 8/11/6/0 0.70
Used ANOVA one way for continuous variables and used chi-square test for categorical variables; HF:Heart Failure, COPD: Chronic Obstructive Pulmonary Disease, M: male, F: Female, BMI: Body MassIndex, LV: Left ventricle, LA: Left atrium, RVD: Right ventricle diameter, FEV1: Forced Expiratory Volumein 1s, FVC: Forced Vital Capacity, RV: Residual Volume, TLC: Total Lung Capacity, IC: InspiratoryCapacity, DLCO: Diffusion Capacity Carbon Monoxide NYHA: New York Heart Association, mMrc:modi�ed Medical Research Council scale, DM: Diabetes mellitus, CI: Coronary insu�ciency, OSA:obstructive sleep apnea. Patients that peformed DLCO: 58 (HF:28, COPD:20, HF + COPD:10)
* Signi�cant difference (p < 0.05) in relation to the HF group.
# Signi�cant difference (p < 0.05) in relation to the COPD group.

Page 10/27
Variables HF
n = 46
COPD
n = 53
HF + COPD
n = 25
p
mMRC, 0/I/II/III/IV - 10/24/11/4/4 4/12/5/1/3 0.92
Comorbities
Hypertension, n (%) 33 31 22*# 0.01
DM, n (%) 15# 2 11# < 0.000
CI, n (%) 8 5* 5* 0.005
OSA, n (%) 4# 18 1# 0.001
Dyslipidemia, n(%) 19# 8 15# < 0.000
Other, n (%) 28 23 15 0.19
Comorbities per patients, n (%) 3.2 ± 1 2.0 ± 1* 3.0 ± 1 0.001
Medications
Betablockers, n 46 - 24 < 0.000
Bronchodilator, n 1# 53 21 < 0.000
Antihypertensive, n 38# 50 20# < 0.000
Diuretics, n 35 40* 24 < 0.000
Used ANOVA one way for continuous variables and used chi-square test for categorical variables; HF:Heart Failure, COPD: Chronic Obstructive Pulmonary Disease, M: male, F: Female, BMI: Body MassIndex, LV: Left ventricle, LA: Left atrium, RVD: Right ventricle diameter, FEV1: Forced Expiratory Volumein 1s, FVC: Forced Vital Capacity, RV: Residual Volume, TLC: Total Lung Capacity, IC: InspiratoryCapacity, DLCO: Diffusion Capacity Carbon Monoxide NYHA: New York Heart Association, mMrc:modi�ed Medical Research Council scale, DM: Diabetes mellitus, CI: Coronary insu�ciency, OSA:obstructive sleep apnea. Patients that peformed DLCO: 58 (HF:28, COPD:20, HF + COPD:10)
* Signi�cant difference (p < 0.05) in relation to the HF group.
# Signi�cant difference (p < 0.05) in relation to the COPD group.
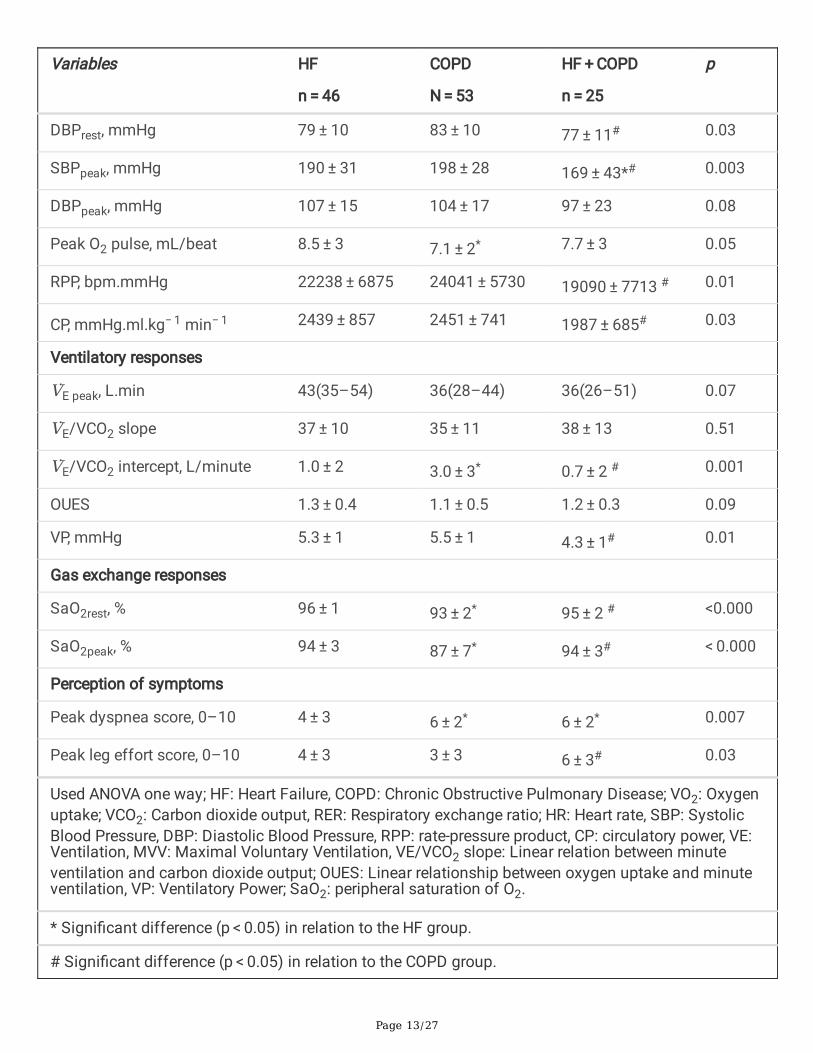
Metabolic, Cardiovascular and Ventilatory responses toExerciseTable 2 lists the responses to the CPET and the comparisons between groups. The WR and V̇O2 at peakexercise were signi�cantly lower in the HF + COPD group when compared to the HF group (p < 0.05).

Page 11/27
Similar ventilatory responses were found between groups; however, the COPD group had higher V̇E/V̇CO2
intercept values compared to the other groups. Ventilatory power (PV) was signi�cantly higher in theCOPD group when compared to the HF + COPD group (p < 0.05). However, the COPD group demonstrateda signi�cantly lower O2 pulse compared to the HF group (p < 0.05). The HR recovery was worse in theCOPD group when compared to the HF group, and in relation to systolic and diastolic BP at peak exercise,the HF + COPD group presented lower values compared to the other groups (p < 0.05).

Page 12/27
Table 2Comparison between group responses to incremental CPET.
Variables HF
n = 46
COPD
N = 53
HF + COPD
n = 25
p
Work rate, Watts 75 ± 32 61 ± 34 54 ± 21* 0.02
Metabolic responses
V̇O2 predicted, mL.min 1891 ± 352 1625 ± 269* 1586 ± 296* < 0.000
V̇O2 peak, mL.min 1011 ± 414 859 ± 228 806 ± 300* 0.02
V̇O2 % of predicted, % 53 ± 16 53 ± 14 51 ± 15 0.81
V̇O2 peak, ml.kg−1.min−1 12.5 ± 3 12.3 ± 3 12.1 ± 3 0.88
V̇O2/WR, mL.min.W 14 ± 4 16 ± 7 15 ± 5 0.20
V̇CO2, mL.min 1127 ± 430 908 ± 371* 732 ± 306* 0.001
RER peak 1.08 ± 0.1 1.04 ± 0.1 1.05 ± 0.09 0.12
Cardiovascular responses
HR rest, bpm 72 ± 10 75 ± 10 79 ± 16 0.09
HR maximal, bpm 168 ± 8 154 ± 7* 151 ± 7* < 0.000
HR peak, bpm 118 ± 21 120 ± 17 110 ± 25 0.13
HR % of maximal 73 ± 12 77 ± 12 72 ± 17 0.25
HR rec, bpm 101 ± 22 110 ± 18 102 ± 22 0.09
∆ HRrec, bpm 17 ± 17 8 ± 9* 13 ± 18 0.02
SBPrest, mmHg 122 ± 14 133 ± 14* 119 ± 22# < 0.000
Used ANOVA one way; HF: Heart Failure, COPD: Chronic Obstructive Pulmonary Disease; VO2: Oxygenuptake; VCO2: Carbon dioxide output, RER: Respiratory exchange ratio; HR: Heart rate, SBP: SystolicBlood Pressure, DBP: Diastolic Blood Pressure, RPP: rate-pressure product, CP: circulatory power, VE:Ventilation, MVV: Maximal Voluntary Ventilation, VE/VCO2 slope: Linear relation between minuteventilation and carbon dioxide output; OUES: Linear relationship between oxygen uptake and minuteventilation, VP: Ventilatory Power; SaO2: peripheral saturation of O2.
* Signi�cant difference (p < 0.05) in relation to the HF group.
# Signi�cant difference (p < 0.05) in relation to the COPD group.
Page 13/27
Variables HF
n = 46
COPD
N = 53
HF + COPD
n = 25
p
DBPrest, mmHg 79 ± 10 83 ± 10 77 ± 11# 0.03
SBPpeak, mmHg 190 ± 31 198 ± 28 169 ± 43*# 0.003
DBPpeak, mmHg 107 ± 15 104 ± 17 97 ± 23 0.08
Peak O2 pulse, mL/beat 8.5 ± 3 7.1 ± 2* 7.7 ± 3 0.05
RPP, bpm.mmHg 22238 ± 6875 24041 ± 5730 19090 ± 7713 # 0.01
CP, mmHg.ml.kg− 1 min− 1 2439 ± 857 2451 ± 741 1987 ± 685# 0.03
Ventilatory responses
V̇E peak, L.min 43(35–54) 36(28–44) 36(26–51) 0.07
V̇E/VCO2 slope 37 ± 10 35 ± 11 38 ± 13 0.51
V̇E/VCO2 intercept, L/minute 1.0 ± 2 3.0 ± 3* 0.7 ± 2 # 0.001
OUES 1.3 ± 0.4 1.1 ± 0.5 1.2 ± 0.3 0.09
VP, mmHg 5.3 ± 1 5.5 ± 1 4.3 ± 1# 0.01
Gas exchange responses
SaO2rest, % 96 ± 1 93 ± 2* 95 ± 2 # <0.000
SaO2peak, % 94 ± 3 87 ± 7* 94 ± 3# < 0.000
Perception of symptoms
Peak dyspnea score, 0–10 4 ± 3 6 ± 2* 6 ± 2* 0.007
Peak leg effort score, 0–10 4 ± 3 3 ± 3 6 ± 3# 0.03
Used ANOVA one way; HF: Heart Failure, COPD: Chronic Obstructive Pulmonary Disease; VO2: Oxygenuptake; VCO2: Carbon dioxide output, RER: Respiratory exchange ratio; HR: Heart rate, SBP: SystolicBlood Pressure, DBP: Diastolic Blood Pressure, RPP: rate-pressure product, CP: circulatory power, VE:Ventilation, MVV: Maximal Voluntary Ventilation, VE/VCO2 slope: Linear relation between minuteventilation and carbon dioxide output; OUES: Linear relationship between oxygen uptake and minuteventilation, VP: Ventilatory Power; SaO2: peripheral saturation of O2.
* Signi�cant difference (p < 0.05) in relation to the HF group.
# Signi�cant difference (p < 0.05) in relation to the COPD group.

Page 14/27
The presence of hypoxemia on exertion, assessed by SpO2, did not differ between the HF and HF + COPDgroups, but it was signi�cantly reduced in the COPD group (p < 0.05). The subjective perception ofexertion (i.e., dyspnea and fatigue in the legs) was higher in the COPD and HF + COPD groups, the mainreason for the end of the test being dyspnea.
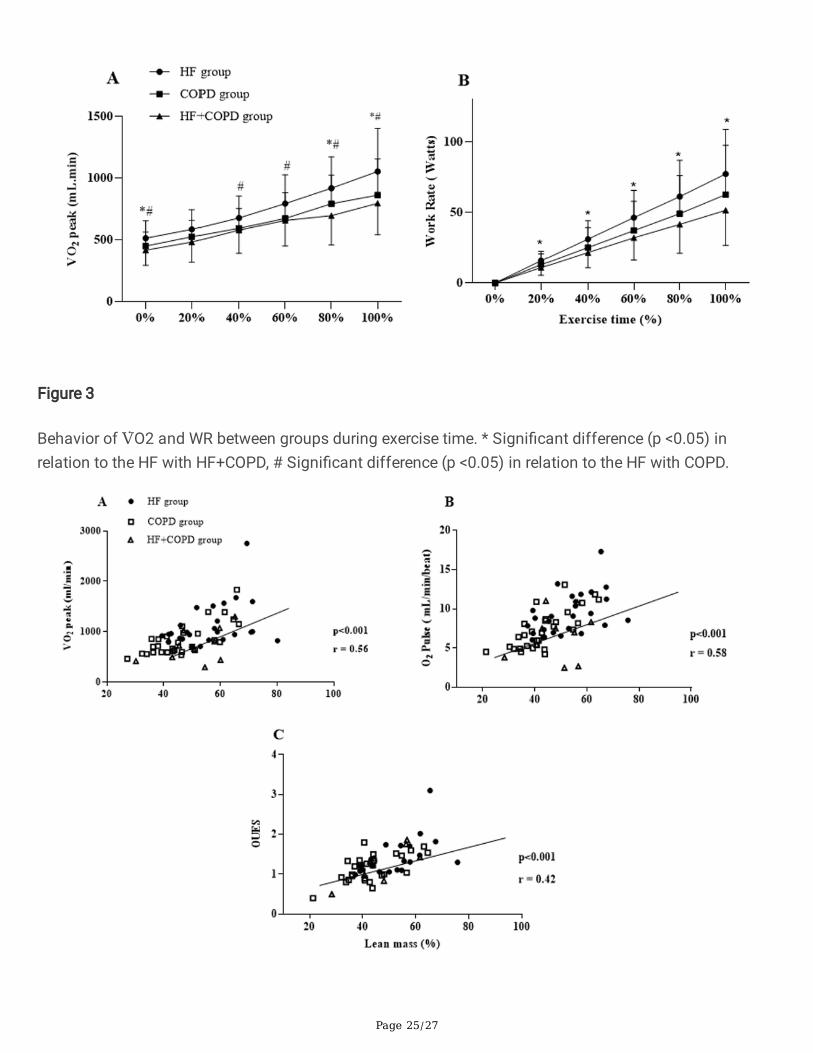
The HF group showed better cardiorespiratory �tness compared to the other groups when we evaluateddifferent moments of the incremental exercise (Fig. 3). From rest to peak exercise, the increment in V̇O2
and TC were greater in the HF group compared to the COPD and HF + COPD groups.
Relationships between measures of pulmonary function,anthropometric measures, clinical characteristics andexercise responsesWe found associations between components of pulmonary function, anthropometric measures, clinicalcharacteristics and CPET variables (Figs. 4 and 5). Combining the three groups, signi�cant correlationswere observed between lean mass and peak V̇O2 (r: 0.56 p < 0.001), lean mass and OUES (r: 0.42 p < 0.001), lean mass and peak O2 pulse (r: 0.58 p < 0.001), DLCO and WR (r: 0.51 p < 0.001), and DLCO and VP(r: 0.40 p: 0.002). In addition, we found that FEV1 was correlated with peak V̇O2 (r: 0.52; p < 0.001) andpeak WR (r: 0.62; p < 0.001).
Occurrence of cardiopulmonary events in the follow-upperiodIn Table 3, we can see that the occurrence of the events obtained was not different between the groups.The Fig. 6 shows the Klapan-Meier analysis in both groups. No differences were found between groups incardiopulmonary outcomes when evaluating disease exacerbations, hospitalizations forcardiopulmonary causes, acute myocardial infarction, stroke or cardiac/pulmonary surgery (Fig. 6A).Regarding the assessment of survival determined by the occurrence of deaths, we could observe nosigni�cant differences were found between the groups (Fig. 6B).

Page 15/27
Table 3Occurrence of cardiopulmonary events during the follow-up period.
Outcomes HF
n = 46
COPD
n = 53
HF + COPD
n = 25
p
Disease exacerbation, n (%) 16 (34.7) 20 (37.7) 10 (40) 0.85
AMI, n (%) 3 (6.5) 0 (0) 0 (0) 0.07
Stroke, n (%) 3 (6.9) 4 (7.5) 1 (4) 0.97
Hospitalization, n (%) 10 (21.7) 13 (28.2) 7 (15.2) 0.40
Death, n (%) 4 (6.5) 5 (9.4) 5 (16) 0.59
Others, n (%) 9 (19.6) 4 (7.5) 1 (4) 0.07
AMI: acute myocardial infarction, Others: gastric or renal or intestinal surgery, decompensation ofnon-cardiopulmonary diseases.
DiscussionThe main original �ndings of the present investigation involving patients with HF, COPD and coexistingHF + COPD are as follows: 1) the prevalence of HF + COPD overlap was 20% in the studied population. 2)patients with HF + COPD had the greatest impairment with cardiorespiratory �tness, expressed by lowervalues in key CPET variables; 3) when groups were contrasted at different distinct exercise time points,the HF group has better responses compared to the other two groups, including WR, peak V̇O2; 4)correlations in the overall group suggest that components of pulmonary function and anthropometriccharacteristics can in�uence CPET variables; 5) after the follow-up period of both groups, no differenceswere found in the occurrence of cardiopulmonary events and deaths.
The aging population is a worldwide phenomenon; due to the health issues associated with aging, ahigher proportion of the global population are at risk for chronic disease and diagnoses as well ascomorbidity23. A coexistance of HF and COPD (overlap syndrome) has been associated with increasedmorbidity and decreased quality of life as well as a greater use of health resources; the literature indicatesa HF + COPD prevalence between 10–30%8,24,25. Age, sex and anthropometric characteristics have beenshown to in�uence cardiorespiratory �tness26. In our study, these factors were different between groups,being that the COPD and HF + COPD groups were older than the HF group (p < 0.05), moreover bodycomposition was different between HF and COPD groups. These �ndings may indicate an advantage forthis group, although the groups are in an age range between 60–70 years on average. These differencesmay explain the slightly more favorable exercise response in the HF group.
Left ventricular EF has been an important survival marker in patients with cardiopulmonary diseases. Ithas been shown that age has an in�uence on systolic function, and although differences in EF were notfound between HF and HF + COPD, the mean age of the overlap group was higher. Shah et al. assessed

Page 16/27
18,398 subjects with reduced EF and found that the mean survival of patients aged 65–69 was 4years27,28. In relation to pulmonary function, no differences were found between the two groups withCOPD in spirometric values. Nevertheless, static lung values demonstrated that the COPD grouppresented with compatible volumes with greater air trapping, as expected, and a worse DLCO. In general,in�ammation and structural changes in the airways resulting from COPD increase expiratory �owlimitations and worsens with advancing disease severity. This pathophysiologic manifestation is knownrelated to the degree of limitations in performing activities of daily life and participation in leisure timephysical activities29.
The association of comorbidities in individuals with cardiopulmonary diseases increases the risk ofclinical events and mortality30. We found signi�cant differences for the main evaluated comorbidities,speci�cally the HF group had higher mean values of comorbidities when compared to the COPD group.These comorbidities are risk factors for the development of cardiopulmonary disease and can often bethe initial trigger or the aggravating etiological factor of the disease31.
It is already well known that patients with HF and COPD have reduced exercise performance, due toimpaired ventilatory function and systemic manifestations that affect the muscular and cardiopulmonarysystem, increasing the limitation to exertion32,33. CPET allows a rigorous evaluation of the interactionbetween respiratory de�ciencies caused by diseases and reduced exercise capacity in individuals underphysiological stress, being possible to verify which is the main limiting factor to physical exercise34.Thus, in the present study, the HF + COPD group had a lower WR when compared to the HF group. Theassociation between advanced age, intrapulmonary conditions, impaired cardiovascular function andloss of muscle strength and endurance in these patients leads to impaired performance during exercise,and intolerance to high workloads35,36. Peak V̇O2 is the main marker of aerobic capacity. In our study, weonly found differences in absolute values; no differences were found for the relative values. Acombination of factors leads to a reduction in peak V̇O2 of patients with HF + COPD: ventilatoryabnormalities that generate ine�ciency in capitation, changes in the heart pump that lead to impaireddelivery, and changes in muscle cell composition that contribute to reduced oxygen utilization37, 38.
A comprehensive assessment of several measures obtained from CPET provide for a morecomprehensive cardiorespiratory �tness evaluation39. The O2 pulse is a strong predictor of disease
severity and adverse events40. Mathematically, the O2 pulse is determined by the product of the strokevolume and arteriovenous oxygen difference, and changes in O2 pulse during exercise suggested
alterations in the stroke volume41. In the current study, we observes that the HF group, when compared tothe COPD group, have higher O2 pulse values. The RPP was signi�cantly lower in the HF + COPD groupwhen compared with the COPD group, indicating poorer cardiac function, as expected in this comorbiditygroup. The in�uence of HF in the group with overlap syndrome can increase myocardial oxygenconsumption, leading to exhaustion of coronary blood �ow reserve and impaired myocardial perfusion42.Another important variable that re�ects central and peripheral components of cardiac work is CP. Our HF

Page 17/27
+ COPD group presented with worse CP values, this can be explained by the fact that the association ofthe two diseases leads to reduced cardiac function, which during high-intensity exercise can lead topulmonary congestion, and that, associated with higher pulmonary arterial pressure and pulmonaryvascular resistance, increases ventilation–perfusion incompatibility, producing ventilatory ine�ciencyand contributing to low CP values43.
In recent years, more complex variables derived from CPET have proved to be strong prognostic variables,capable of providing complementary and superior information compared to the isolated use of peak V̇O244. In our study, no differences were found for the V̇E/VCO2 slope, although all groups demonstrated amean value above the normal threshold (i.e., > 30), thus observing a worse prognosis for these patients.Guazzi et al followed 213 cardiac patients and found that V̇E/V̇CO2 slope values ≥ 34 associated with
V̇O2 peak ≤ 14 ml.kg − 1.min − 1 were strong predictors of hospitalization and mortality45.
The V̇E/V̇CO2 intercept is a new parameter, and in patients with lung diseases it increases with the
severity of disease46. Surprisingly, only the COPD group had higher values of V̇E/V̇CO2 intercept,suggesting an increased dead space on exercise, something that was not seen in our overlap group. Nevertheless, HF + COPD presented reduced VP in comparison with HF group (p < 0.05). The VP has beenstudied as a prognostic marker in cardiopulmonary diseases47,48. This variable re�ects peak cardiacoutput, alveolar perfusion, peripheral perfusion and the chemo-afferent re�exes of the skeletal muscle,with values below 3.5 mmHg indicating worsening survival21.
Pulmonary and systemic cardiocirculatory maladjustments occur in both HF and COPD and in individualswith overlap, these effects are more prominent. Muscle weakness is the most common systemic effect,as it occurs in chronic processes such as what occurs in both diseases. The systemic effects of thesediseases directly affect the ventilatory function, which manifest a pronounced intolerance to exercise,worse health status and higher mortality49,50. In the current study, the HF + COPD group had worseperception of symptoms, when compared to the HF group; the perception of dyspnea was higher, andwhen compared to the COPD group, fatigue values were higher (p < 0.05).
The HF group presented with better responses to incremental exercise when contrasted with the COPDand HF + COPD groups (Fig. 3). We believe that the fact that the HF group is composed of the majority ofpatients with mild staging re�ected better physiological adjustments to exercise, furthermore, theassociation between advanced age, intrapulmonary conditions, impaired cardiovascular function (thateven in COPD is present) and loss of muscle strength and endurance in COPD and HF + COPD patientsleads to further deterioration cardiorespiratory �tness, making these patients not tolerate high workloadsand present with a poorer exercise performance51,36.
Important correlations between clinical variables, body composition and CPET variables were found inthis study. It is important to note that lean mass moderately in�uenced peak V̇O2, OUES and O2 pulseresponses in the patients studied. An adequate interaction between the ventilatory, cardiovascular and

Page 18/27
muscular systems is a determining factor for appropriate oxygen metabolism during incrementalexercise. Cardiopulmonary disease initially leads to a compromise of the pulmonary and cardiovascularsystems, however, with disease progression, lean mass alterations occur in these populations affectingmuscle performance during exercise. These changes occur due factors such as hypoxia, oxidative stress,disuse, nutritional depletion, systemic in�ammation and changes in muscle morphology, �ber typedistribution and metabolism52. Other important �ndings correlate DLCO, and FEV1 with peak V̇O2, WR andVP. Impaired lung function due to air �ow limitations, increased intrathoracic pressures, increasedintrathoracic blood volume and chronic pulmonary congestion and accumulation of extravascular lungwater has a direct effect on the cardiopulmonary response to exercise, leading to increased pulmonaryventilation, ventilatory ine�ciency and, consequently, low peak V̇O2 and WR8,53.
Surprisingly, we found no differences between the outcomes assessed in the follow-up of patients in bothgroups. Although the HF + COPD group has a greater impairment of cardiorespiratory �tness, it is possibleto note that the HF and COPD groups also present values of key cardiopulmonary variables for thestudied populations compatible with a worse prognosis and high risk of adverse events in the period from1 to 4 years of follow-up54. Furthermore, advances in the clinical treatment of both diseases together withgreater access to cardiopulmonary rehabilitation have favored better control of the progress of thesediseases55.
Study LimitationsThis study has some limitations which are inherent to its nature that consider the screening of patients attwo ambulatory clinics (pneumology and cardiology) diagnosed with at least one of the diseases andaged over 50 years. As the purpose of the present study was to evaluate the coexistence of one conditionin the other, it would be expected that some clinical variables would be different. In this context, theabsence of female individuals in the HF + COPD group and the difference of age between groups canin�uence the CPET response. However, to mitigate this bias, knowing that some variables could bein�uenced by age and sex, we performed a linear regression analysis to verify the in�uence on CPETvariables that differed. We veri�ed that age and sex had weak but signi�cant in�uence on WR (R2:0.22 p:0.000), absolute peak V̇O2 (R2:0.25 p: 0.000), O2 pulse (R2:0.20 p: 0.000) and CP (R2:0.09 p: 0.02).
ConclusionsIn conclusion, the coexistence of HF+COPD induces greater impairment on exercise performance whencompared to patients without overlapping diseases, however the overlap of the two diseases did notincrease the probability of the occurrence of cardiopulmonary events and deaths when compared togroups with isolated diseases in the period studied. CPET provides important information to guideeffective strategies for these patients with the goal of improving exercise performance and functionalcapacity. Moreover, given our �ndings related to pulmonary function, body composition and exerciseresponses, evidenced that the lean mass, FEV1 and DLCO in�uence important responses to exercise.

Page 19/27
Declarations
ACKNOWLEDGEMENT OF GRANT SUPPORT: We would like to thank the Fundação de Amparo a Pesquisa do Estado de São Paulo (FAPESP) and theCoordenação de Apoio a Pessoal do Ensino Superior (CAPES) for providing �nancial support, allowingthis work to be carried out. We extend our gratitude to the University Hospital of the Federal University ofSão Carlos for supporting patient recruitment for this study. Borghi-Silva A is an Established Investigator(level IB) of the Conselho Nacional de Desenvolvimento Científico e Tecnológico, Brazil. We are alsograteful to all physical therapy team for technical support. More importantly, however, we are indebted tothe patients for their effort and enthusiastic cooperation throughout the study.
DISCLOSURE: The authors report no relationships that could be construed as a con�ict of interest.
CREDIT AUTHORSHIP CONTRIBUTION STATEMENT:All authors made substantial contributions to conception and design, acquisition of data, or analysis andinterpretation of data; took part in drafting the article or revising it critically for important intellectualcontent; agreed to submit to the current journal; gave �nal approval of the version to be published; andagree to be accountable for all aspects of the work.
References1. Vetrano, D. L. et al. ;. Frailty and Multimorbidity: A Systematic Review and Meta-analysis. J Gerontol
A Biol Sci Med Sci. 2019 Apr 23;74(5):659–666.
2. World Health Organization. Cardiovascular disease. Accessed on 6/6/11; Available from:http://www.who.int/mediacentre/factsheets/ fs317/en/index.html.
3. Go, A. S. et al. ;. Heart disease and stroke statistics–2014 update: a report from the American HeartAssociation. Circulation. 2014 Jan 21;129(3):e28-e292.
4. Vestbo, J. et al. Global strategy for the diagnosis, management, and prevention of chronicobstructive pulmonary disease: GOLD executive summary. Am J Respir Crit Care Med, 15 (4), 347–365 (2013 Feb).
5. Bleumink, G. S. et al. Quantifying the heart failure epidemic: prevalence, incidence rate, lifetime riskand prognosis of heart failure The Rotterdam Study. Eur Heart J, 25 (18), 1614–1619 (2004 Sep).
�. Liu, L. & Eisen, H. J. Epidemiology of heart failure and scope of the problem.Cardiol Clin.2014Feb;32(1):1–8, vii.

Page 20/27
7. Dumitru, L. et al. Disability in COPD and Chronic Heart Failure Is the Skeletal Muscle the FinalCommon Pathway? Maedica (Bucur). 2013 Jun;8(2):206–13.
�. Neder, J. A., Rocha, A., Berton, D. C. & O'Donnell, D. E. Clinical and Physiologic Implications ofNegative Cardiopulmonary Interactions in Coexisting Chronic Obstructive Pulmonary Disease-HeartFailure. Clin Chest Med, 40 (2), 421–438 (2019 Jun).
9. Wagner, P. D. Chronic Cardiopulmonary Disease and the Skeletal Muscle.Respir Care2006:37–40
10. Neder, J. A. et al. Current challenges in managing comorbid heart failure and COPD. Expert RevCardiovasc Ther, 16 (9), 653–673 (2018 Sep).
11. Ross, R. et al. ; ; Council on Cardiovascular and Stroke Nursing; Council on Functional Genomics andTranslational Biology; Stroke Council. Importance of Assessing Cardiorespiratory Fitness in ClinicalPractice: A Case for Fitness as a Clinical Vital Sign: A Scienti�c Statement From the American HeartAssociation. Circulation. 2016 Dec 13;134(24):e653-e699.
12. Nelson, N. & Asplund, C. A. Exercise Testing: Who, When, and Why? PM R. 2016 Mar;8(3 Suppl):S16-23.
13. von Elm, E. et al. ;. The Strengthening the Reporting of Observational Studies in Epidemiology(STROBE) statement: guidelines for reporting observational studies.J Clin Epidemiol.2008Apr;61(4):344–9.
14. Lang, R. M. et al. Recommendations for cardiac chamber quanti�cation by echocardiography inadults: an update from the American Society of Echocardiography and the European Association ofCardiovascular Imaging. J Am Soc Echocardiogr, 28 (1), 1–3914 (2015 Jan).
15. Global Initiative for Chronic Obstructive Lung Disease. Global strategy for the diagnosis,management, and prevention of chronic obstructive pulmonary disease. Chronic Respir Dis, 1, 1–141(2020).
1�. Borg, G. A. Psychophysical bases of perceived exertion. Med Sci Sports Exerc, 14 (5), 377–381(1982).
17. Balady, G. J. et al. Council on Peripheral Vascular Disease; Interdisciplinary Council on Quality ofCare and Outcomes Research. Clinician's Guide to cardiopulmonary exercise testing in adults: ascienti�c statement from the American Heart Association., 13 (2), 191–225 (2010 Jul).
1�. Arena, R., Myers, J., Aslam, S. S., Varughese, E. B. & Peberdy, M. A. Technical considerations related tothe minute ventilation/carbon dioxide output slope in patients with heart failure., 124 (2), 720–727(2003 Aug).
19. Baba, R. et al. Oxygen uptake e�ciency slope: a new index of cardiorespiratory functional reservederived from the relation between oxygen uptake and minute ventilation during incremental exercise.J Am Coll Cardiol, 15 (6), 1567–1572 (1996 Nov).
20. Cohen-Solal, A. et al. A non-invasively determined surrogate of cardiac power ('circulatory power') atpeak exercise is a powerful prognostic factor in chronic heart failure. Eur Heart J, 23 (10), 806–814(2002 May).

Page 21/27
21. Forman, D. E. et al. Ventilatory power: a novel index that enhances prognostic assessment ofpatients with heart failure. Circ Heart Fail. 2012 Sep 1;5(5):621-6.
22. Hinkle, D. E., Wiersma, W. & Jurs, S. G. Applied Statistics for the Behavioral Sciences 5th edn(Houghton Mi�in, Boston, 2003).
23. Gijsen, R. et al. Causes and consequences of comorbidity: a review. J Clin Epidemiol, 54 (7), 661–674(2001 Jul).
24. Macchia, A. et al. Unrecognised ventricular dysfunction in COPD. Eur Respir J, 39 (1), 51–58 (2012Jan).
25. de Miguel Díez, J., Chancafe Morgan, J. & Jiménez García, R. The association between COPD andheart failure risk: a review. Int J Chron Obstruct Pulmon Dis, 8, 305–312 (2013).
2�. Neder, J. A. et al. Prediction of metabolic and cardiopulmonary responses to maximum cycleergometry: a randomised study. Eur Respir J, 14 (6), 1304–1313 (1999 Dec).
27. Lakatta, E. G. & Levy, D. Arterial and cardiac aging: major shareholders in cardiovascular diseaseenterprises: Part II: the aging heart in health: links to heart disease. Circulation. 2003 Jan21;107(2):346 – 54.
2�. Shah, K. S. et al. Heart Failure With Preserved, Borderline, and Reduced Ejection Fraction: 5-YearOutcomes. J Am Coll Cardiol, 14 (20), 2476–2486 (2017 Nov).
29. Barnes, P. J. In�ammatory mechanisms in patients with chronic obstructive pulmonary disease. JAllergy Clin Immunol, 138 (1), 16–27 (2016 Jul).
30. Manuel, D. G., Schultz, S. E. & Kopec, J. A. Measuring the health burden of chronic disease and injuryusing health adjusted life expectancy and the Health Utilities Index. J Epidemiol Community Health,56 (11), 843–850 (2002).
31. Mosterd, A. & Hoes, A. W. Clinical epidemiology of heart failure.Heart. 2007Sep;93(9):1137–46.
32. Güder, G. & Rutten, F. H. Comorbidity of heart failure and chronic obstructive pulmonary disease:more than coincidence. Curr Heart Fail Rep, 11 (3), 337–346 (2014 Sep).
33. Hawkins, N. M., Virani, S. & Ceconi, C. Heart failure and chronic obstructive pulmonary disease: thechallenges facing physicians and health services. Eur Heart J, 34 (36), 2795–2803 (2013 Sep).
34. Ingle, L. Theoretical rationale and practical recommendations for cardiopulmonary exercise testing inpatients with chronic heart failure. Heart Fail Rev, 12 (1), 12–22 (2007 Mar).
35. Steinborn, W. & Anker, S. Cardiac cachexia: pathophysiology and clinical implications. Basic ApplMyol, 13, 191–201 (2003).
3�. Agustí, A. G. et al. Systemic effects of chronic obstructive pulmonary disease. Eur Respir J, 21 (2),347–360 (2003 Feb).
37. Agostoni, P., Cattadori, G., Bussotti, M. & Apostolo, A. Cardiopulmonary interaction in heart failure.Pulm Pharmacol Ther, 20 (2), 130–134 https://doi.org/10.1016/j.pupt.2006.03.001 (2007).
3�. Arena, R. & Sietsema, K. E. Cardiopulmonary exercise testing in the clinical evaluation of patientswith heart and lung disease., 15 (6), 668–680 (2011 Feb).
Page 22/27
39. Guazzi, M. et al. 2016 focused update: clinical recommendations for cardiopulmonary exercisetesting data assessment in speci�c patient populations. Eur Heart J. 2018 Apr 7;39(14):1144–1161.doi: 10.1093/eurheartj/ehw180.
40. Bhambhani, Y., Norris, S. & Bell, G. Prediction of stroke volume from oxygen pulse measurements inuntrained and trained men. Can J Appl Physiol, 19 (1), 49–59 (1994 Mar).
41. Mahler, D. A., Parker, H. W. & Andresen, D. C. Physiologic changes in rowing performance associatedwith training in collegiate women rowers. Int J Sports Med, 6 (4), 229–233 (1985 Aug).
42. Dini, F. L. et al. Coronary �ow reserve in idiopathic dilated cardiomyopathy: relation with leftventricular wall stress, natriuretic peptides, and endothelial dysfunction. J Am Soc Echocardiogr, 22(4), 354–360 (2009 Apr).
43. Witte, K. K. & Clark, A. L. Why does chronic heart failure cause breathlessness and fatigue? Progressin Cardiovascular Diseases, 49, 366–384 (2007).
44. Arena, R., Myers, J. & Guazzi, M. Cardiopulmonary exercise testing is a core assessment for patientswith heart failure. Congest Heart Fail, 17 (3), 115–119 (2011 May-Jun).
45. Arena, R., Myers, J., Aslam, S. S., Varughese, E. B. & Peberdy, M. A. Peak VO2 and VE/VCO2 slope inpatients with heart failure: a prognostic comparison. Am Heart J, 147 (2), 354–360 (2004 Feb).
4�. Apostolo, A. et al. Impact of chronic obstructive pulmonary disease on exercise ventilatory e�ciencyin heart failure. Int J Cardiol, 189, 134–140 (2015).
47. Goulart, C. D. L. et al. The Value of Cardiopulmonary Exercise Testing in Determining Severity inPatients with both Systolic Heart Failure and COPD. Sci Rep. 2020 Mar 9;10(1):4309.
4�. Dos Santos, P. B. et al. Eccentric Left Ventricular Hypertrophy and Left and Right Cardiac Function inChronic Heart Failure with or without Coexisting COPD: Impact on Exercise Performance.Int J ChronObstruct Pulmon Dis. 2021 Feb3;16:203–214.
49. Montes de Oca, M. et al. Peripheral muscle composition and health status in patients with COPD.Respir Med, 100 (10), 1800–1806 (2006 Oct).
50. Buller, N. P., Jones, D. & Poole-Wilson, P. A. Direct measurement of skeletal muscle fatigue in patientswith chronic heart failure. Br Heart J, 65 (1), 20–24 (1991 Jan).
51. Steinborn, W. & Anker, S. Cardiac cachexia: pathophysiology and clinical implications. Basic ApplMyol, 13, 191–201 (2003).
52. Gosker, H. R., Wouters, E. F., van der Vusse, G. J. & Schols, A. M. Skeletal muscle dysfunction inchronic obstructive pulmonary disease and chronic heart failure: underlying mechanisms andtherapy perspectives. Am J Clin Nutr, 71 (5), 1033–1047 (2000 May).
53. Alencar, M. C. et al. Does Exercise Ventilatory Ine�ciency Predict Poor Outcome in Heart FailurePatients With COPD? J Cardiopulm Rehabil Prev, 36 (6), 454–459 (2016 Nov/Dec).
54. Guazzi, M. et al. 2016 focused update: Clinical recommendations for cardiopulmonary exercisetesting data assessment in speci�c patient populations.Circulation. 2016.

Page 23/27
55. World Health Organization. Innovative care for chronic conditions: building blocks for action (WHO,Geneva, Switzerland, 2012). [2016-09-21].
Figures
Figure 1

Page 24/27
Study �ow chart.
Figure 2
Prevalence of patients with HF+COPD overlap in studied populations. HF: heart failure, COPD: ChronicObstructive Pulmonary Disease
Page 25/27
Figure 3
Behavior of V̇O2 and WR between groups during exercise time. * Signi�cant difference (p <0.05) inrelation to the HF with HF+COPD, # Signi�cant difference (p <0.05) in relation to the HF with COPD.

Page 26/27
Figure 4
Correlation between body composition and CPET responses; Used Pearson correlation coe�cient. A:Relationship between lean mass and oxygen uptake (V̇O2); B: Relationship between lean mass andOxygen pulse; C: Relationship between lean mass and oxygen uptake e�ciency slope.
Figure 5
Correlation between lung function and CPET responses; Used Pearson correlation coe�cient. A:Relationship between diffusion capacity carbon monoxide (DLCO) and work rate; B: Relationship betweenDLCO and ventilatory power; C: Relationship between forced expiratory volume in the �rst second (FEV1)and peak oxygen uptake (V̇O2); D: Relationship between FEV1 and peak work rate. Patients thatpefromed DLCO: 58 (HF:28, COPD:20, HF+COPD:10)

Page 27/27
Figure 6
Kaplan-Meier curve. A: probability of occurrence of cardiopulmonary events; B: probability of survivalassessed by occurrence of deaths.