capacities, challenges, and opportunities. introduction challenges to reducing health disparities in...
TRANSCRIPT
What Community-Based Organizations Told Us About Their Use of Data:
Capacities, Challenges, and Opportunities
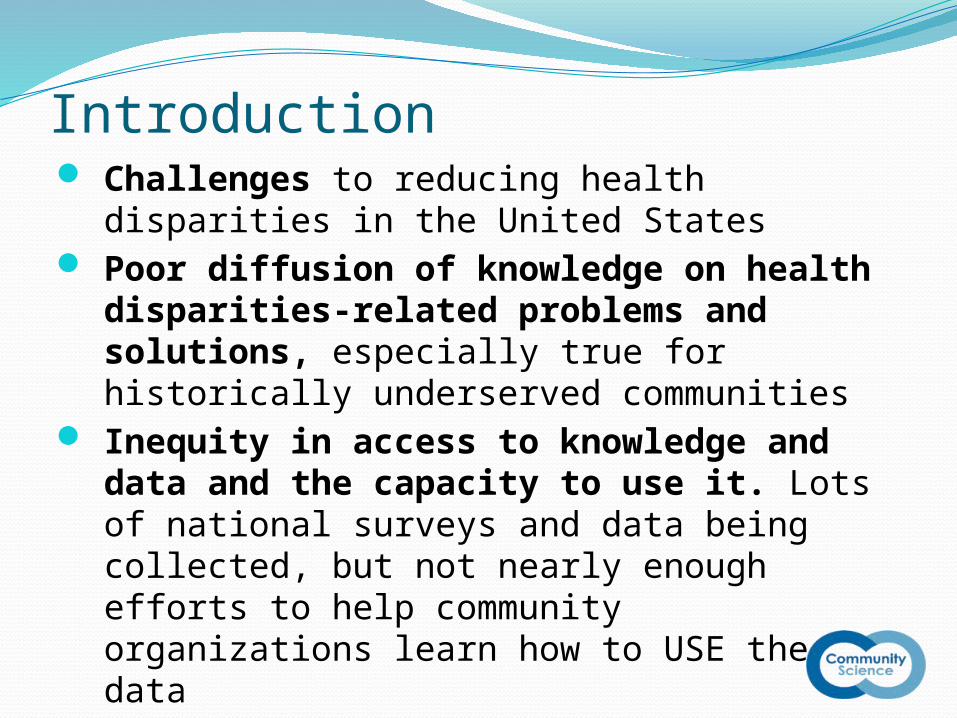
Introduction Challenges to reducing health disparities in
the United States Poor diffusion of knowledge on health
disparities-related problems and solutions, especially true for historically underserved communities
Inequity in access to knowledge and data and the capacity to use it. Lots of national surveys and data being collected, but not nearly enough efforts to help community organizations learn how to USE the data
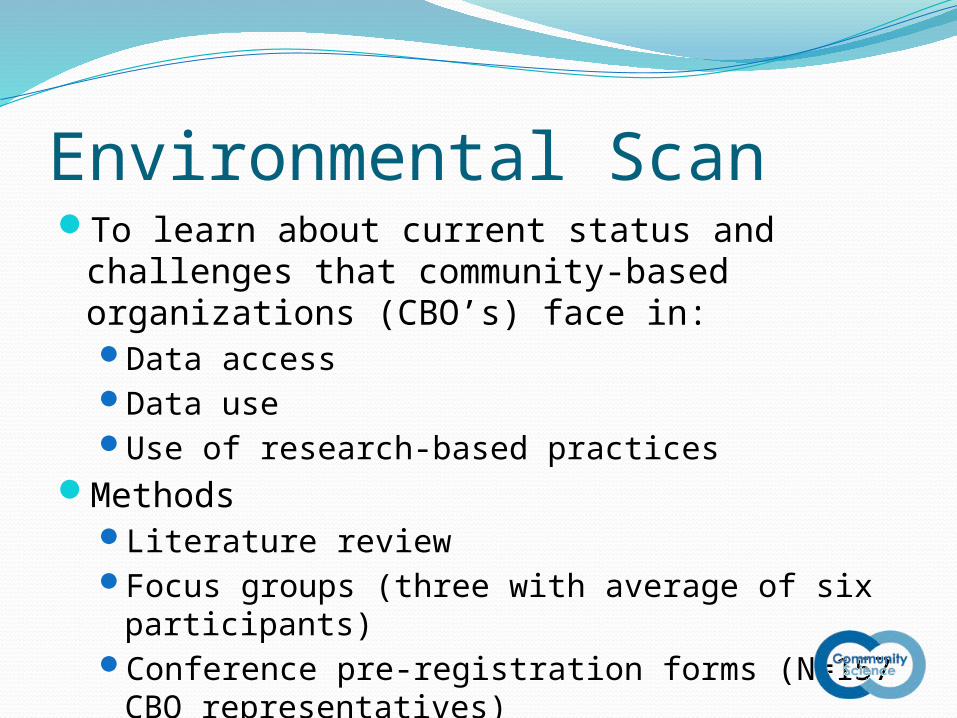
Environmental ScanTo learn about current status and challenges
that community-based organizations (CBO’s) face in:Data accessData useUse of research-based practices
MethodsLiterature reviewFocus groups (three with average of six
participants) Conference pre-registration forms (N=157
CBO representatives)
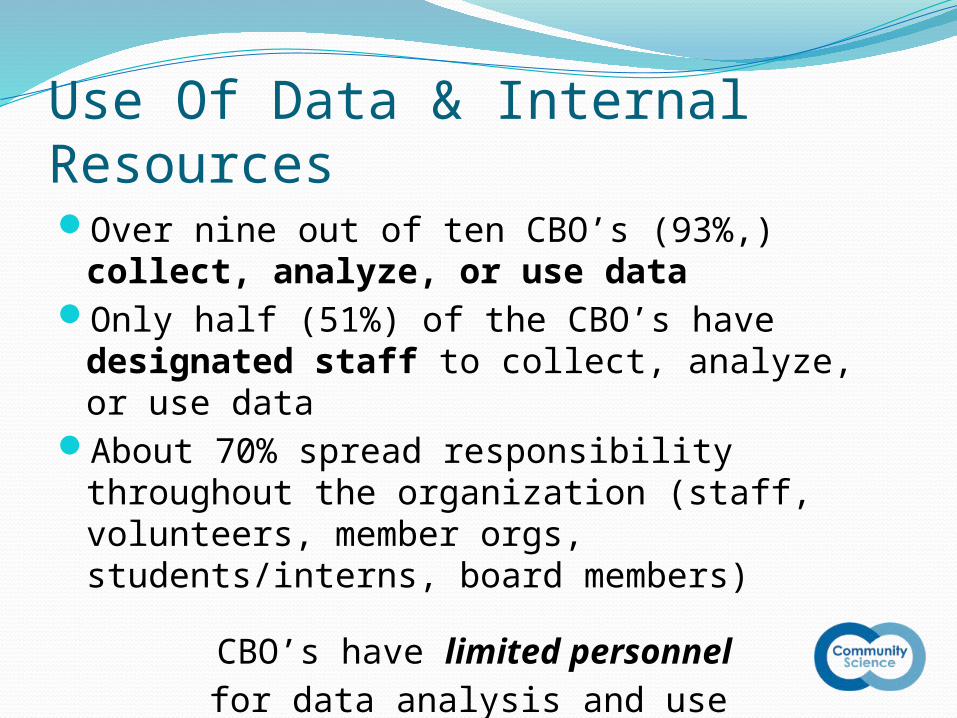
Use Of Data & Internal ResourcesOver nine out of ten CBO’s (93%,) collect,
analyze, or use dataOnly half (51%) of the CBO’s have
designated staff to collect, analyze, or use data
About 70% spread responsibility throughout the organization (staff, volunteers, member orgs, students/interns, board members)
CBO’s have limited personnel for data analysis and use
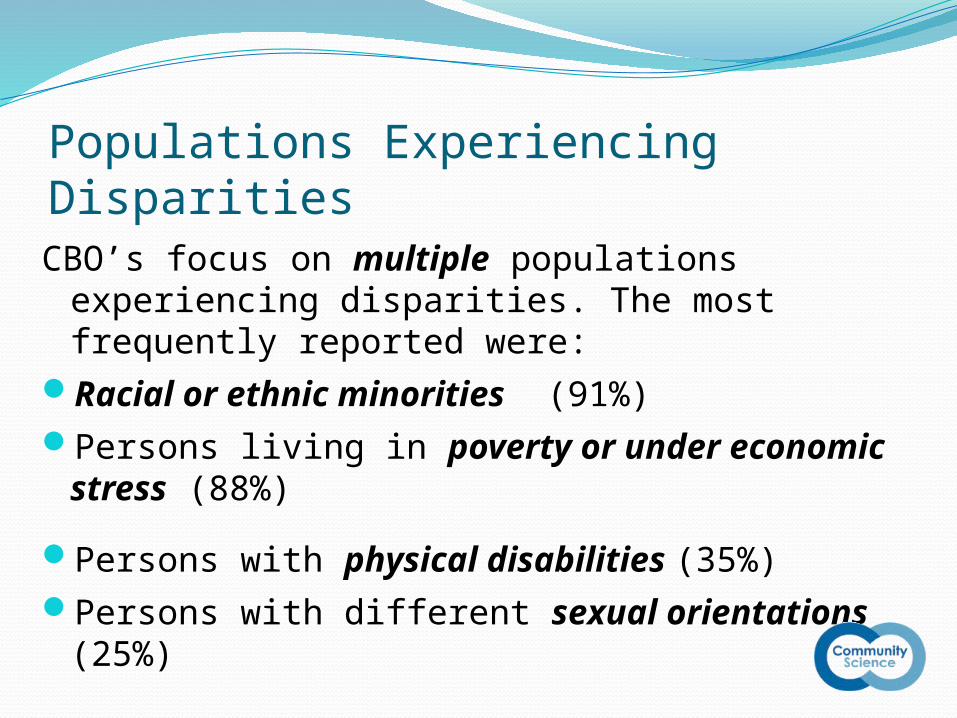
Populations Experiencing DisparitiesCBO’s focus on multiple populations
experiencing disparities. The most frequently reported were:
Racial or ethnic minorities (91%)Persons living in poverty or under economic
stress (88%)Persons with physical disabilities (35%)Persons with different sexual orientations
(25%)
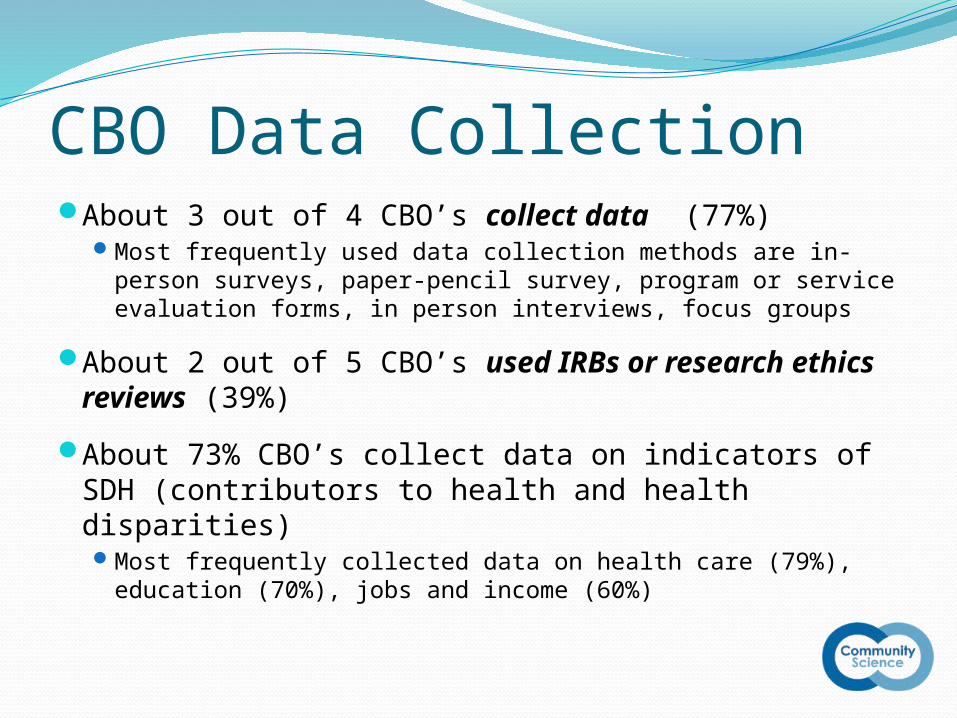
CBO Data CollectionAbout 3 out of 4 CBO’s collect data (77%)
Most frequently used data collection methods are in-person surveys, paper-pencil survey, program or service evaluation forms, in person interviews, focus groups
About 2 out of 5 CBO’s used IRBs or research ethics reviews (39%)
About 73% CBO’s collect data on indicators of SDH (contributors to health and health disparities)Most frequently collected data on health care (79%),
education (70%), jobs and income (60%)
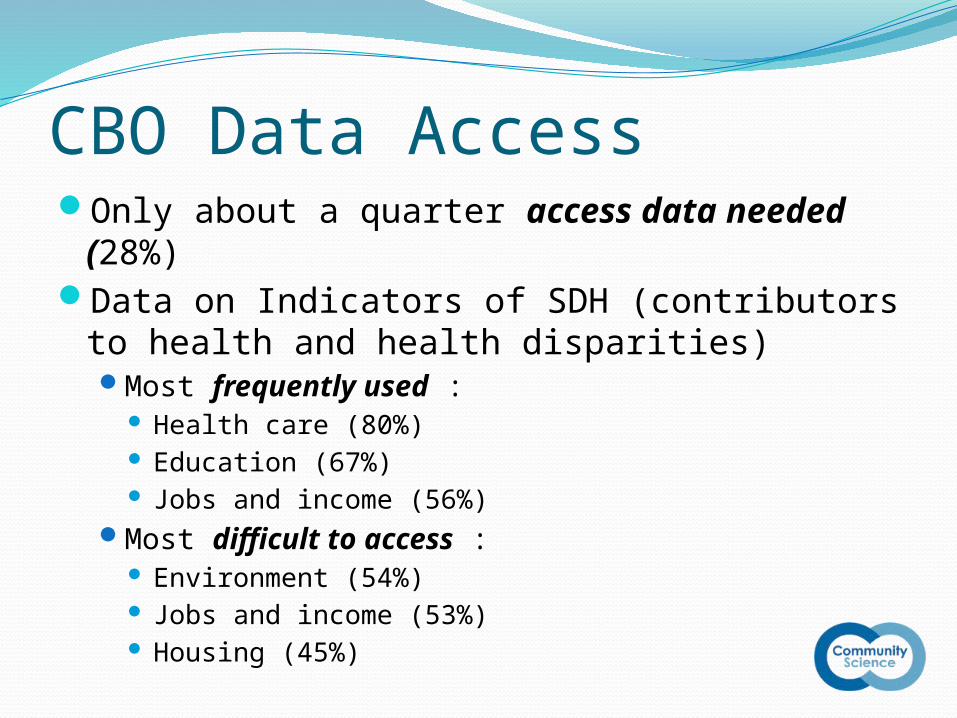
CBO Data AccessOnly about a quarter access data needed
(28%)Data on Indicators of SDH (contributors to
health and health disparities)Most frequently used :
Health care (80%) Education (67%) Jobs and income (56%)
Most difficult to access : Environment (54%) Jobs and income (53%) Housing (45%)

CBO Data Access (cont’d)
Most Used State or Local Data sourcesMost reported using data from state health
departments (71%) or county or city health departments (70%)
Although 77% of organization collect their own data, only about half (55%) used their own data
National Data Sources (more on next slide)Most known and used: American FactFinder
(US Census Bureau) (Known – 68%; Used – 62%)
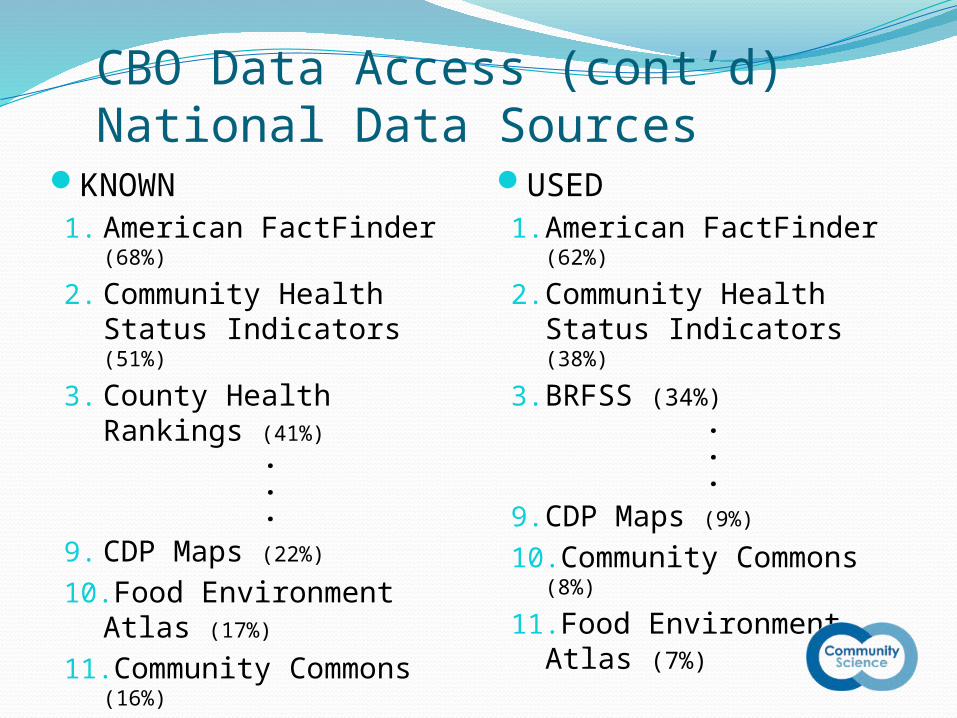
CBO Data Access (cont’d)National Data Sources
KNOWN1. American FactFinder
(68%)
2. Community Health Status Indicators (51%)
3. County Health Rankings (41%)
.
.
.
9. CDP Maps (22%)
10.Food Environment Atlas (17%)
11.Community Commons (16%)
USED1. American FactFinder
(62%)
2. Community Health Status Indicators (38%)
3. BRFSS (34%)...
9. CDP Maps (9%)
10.Community Commons (8%)
11.Food Environment Atlas (7%)

Data Analysis Used By CBO’sData Analysis Techniques and Methods
# of CBO’s %
Descriptive Statistics (comparing %) 105 811
Geographic (maps) 84 651
Statistical (correlation) 69 531
Comparing rates per 100,000 59 461
Ratios 55 432
Qualitative techniques 52 401
1: Out of 129 CBOs2: Out of 132 CBOs
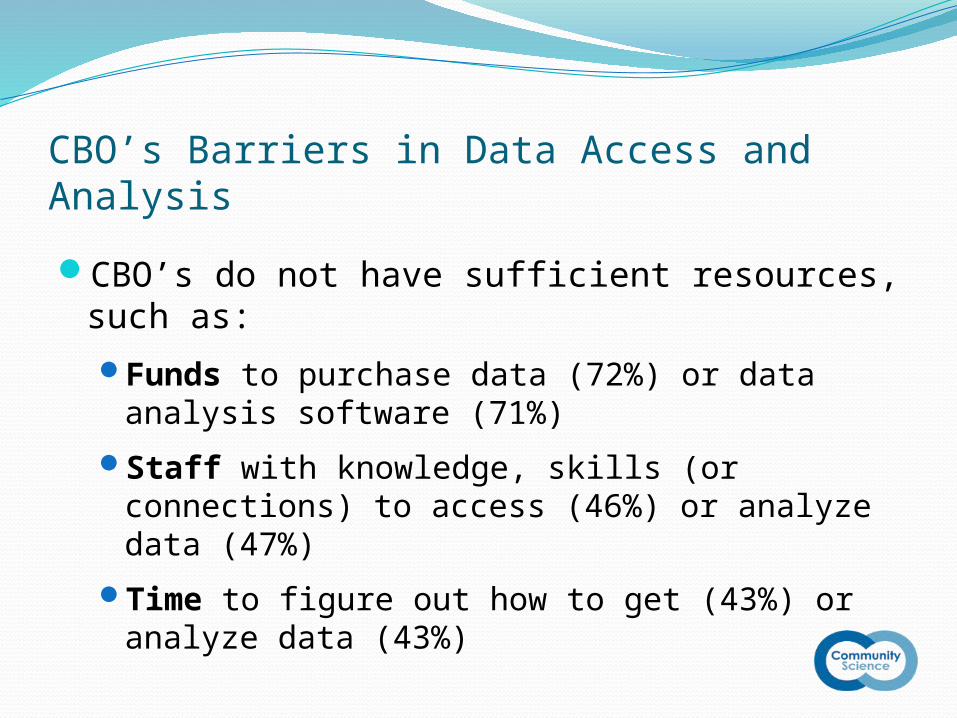
CBO’s Barriers in Data Access and AnalysisCBO’s do not have sufficient resources, such
as:
Funds to purchase data (72%) or data analysis software (71%)
Staff with knowledge, skills (or connections) to access (46%) or analyze data (47%)
Time to figure out how to get (43%) or analyze data (43%)

CBO’s Barriers in Data Access and Analysis (cont’d)
Top 3 issues with quality of data
1. Not collected using same areas or classifications, making it hard to compare (47%)
2. Not collected frequently enough (45%)3. Not reported for the groups of interest
(e.g., African immigrants or refugees; Asian Americans; Pacific Islanders; American Indians; Hispanics) (40%)
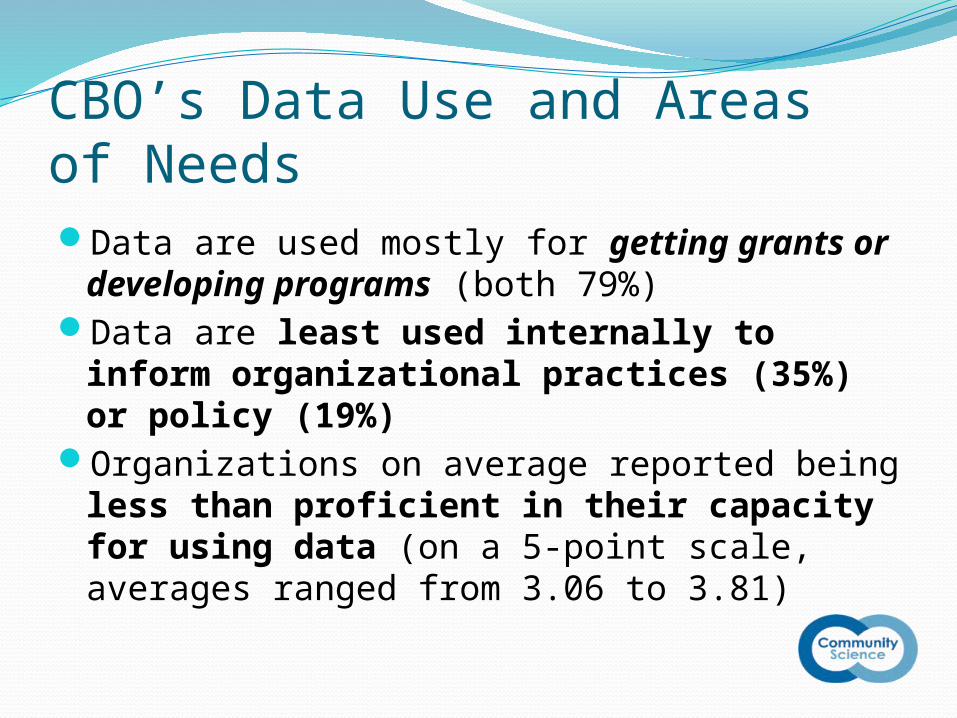
CBO’s Data Use and Areas of NeedsData are used mostly for getting grants or
developing programs (both 79%)Data are least used internally to inform
organizational practices (35%) or policy (19%)
Organizations on average reported being less than proficient in their capacity for using data (on a 5-point scale, averages ranged from 3.06 to 3.81)
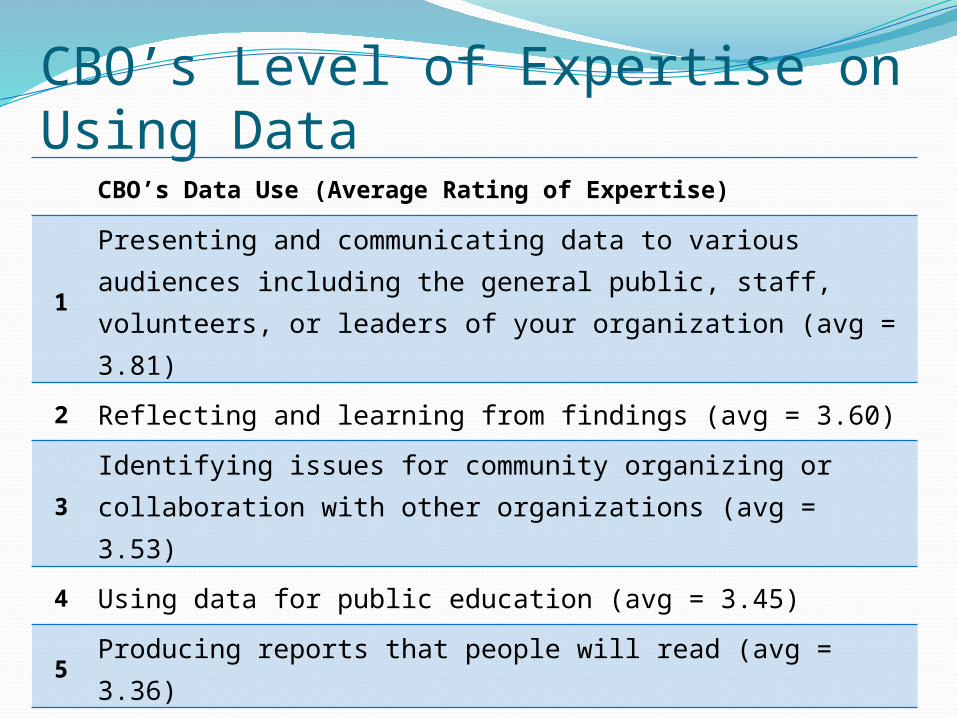
CBO’s Level of Expertise on Using DataCBO’s Data Use (Average Rating of Expertise)
1Presenting and communicating data to various audiences including the general public, staff, volunteers, or leaders of your organization (avg = 3.81)
2 Reflecting and learning from findings (avg = 3.60)
3Identifying issues for community organizing or collaboration with other organizations (avg = 3.53)
4 Using data for public education (avg = 3.45)
5 Producing reports that people will read (avg = 3.36)
6Using data for strategy development and improvement (avg = 3.33)
7 Using data for advocacy on government policy (avg = 3.06)
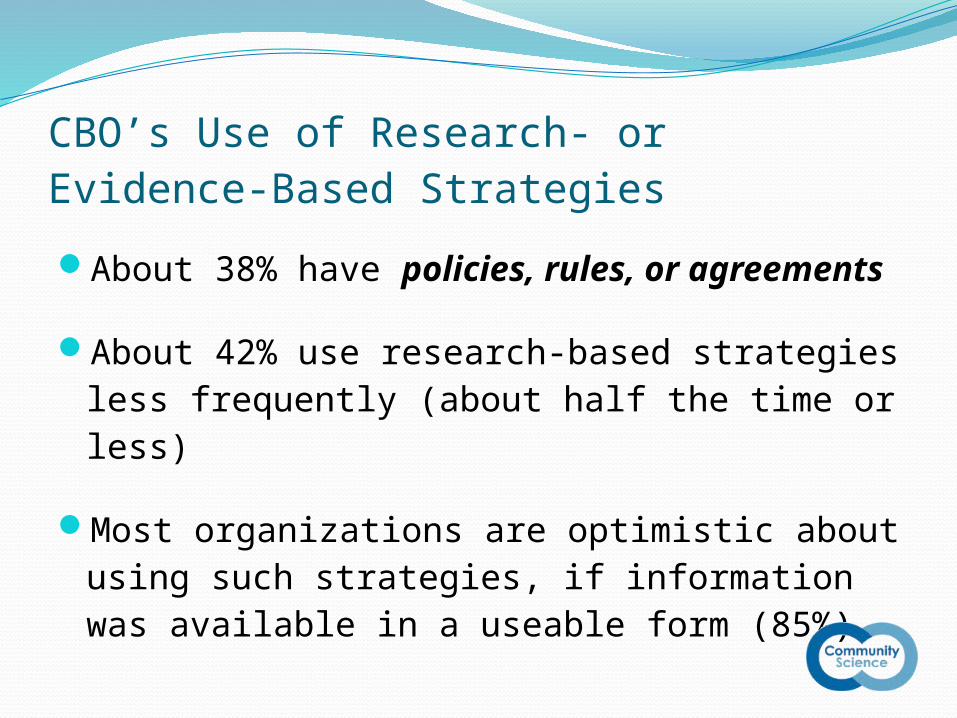
CBO’s Use of Research- or Evidence-Based StrategiesAbout 38% have policies, rules, or
agreements
About 42% use research-based strategies less frequently (about half the time or less)
Most organizations are optimistic about using such strategies, if information was available in a useable form (85%)

CBO’s Use of Research- or Evidence-Based Strategies (cont’d)
Sources most never used: Practitioner publications (26%)Peer-reviewed journals (23%)
Sources most useful: Residents (avg = 3.29)Other similar organizations (avg = 3.07)Conferences (avg = 2.99)Websites (avg = 2.94)
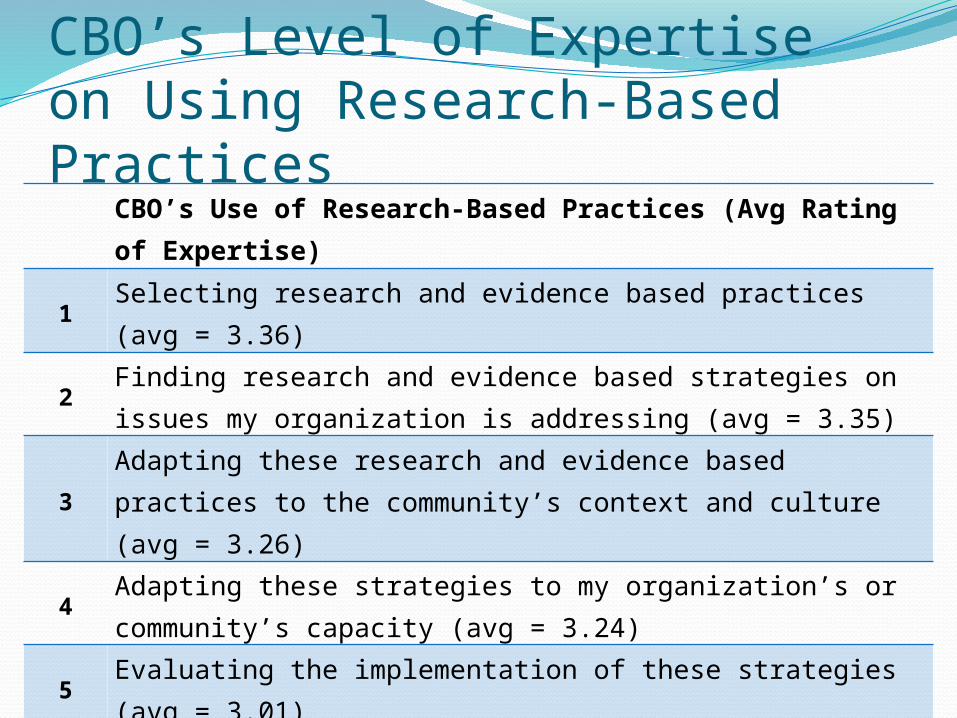
CBO’s Level of Expertiseon Using Research-Based Practices
CBO’s Use of Research-Based Practices (Avg Rating of Expertise)
1Selecting research and evidence based practices (avg = 3.36)
2Finding research and evidence based strategies on issues my organization is addressing (avg = 3.35)
3Adapting these research and evidence based practices to the community’s context and culture (avg = 3.26)
4Adapting these strategies to my organization’s or community’s capacity (avg = 3.24)
5Evaluating the implementation of these strategies (avg = 3.01)

Assistance on Data Collection and Analysis for CBO’sSources most never used by CBO’s:
Books or printed toolkits (33% never used)Online guides or toolkits (31% never used)
Top 3 sources of assistance CBO’s found most usefulUniversity and college faculty or students (avg
= 3.06)Local nonprofit or data collaborative (avg =
3.04)Consultants (avg = 2.98)

Assistance on Data Collection and Analysis for CBO’s (cont’d)
CBO’s ranked types of assistance that are more personal higher than those that are not
Most Useful Type of Assistance for CBO’s (in rank order)1. Workshops2. Consultation or coaching3. Online peer learning networks (bulletin boards,
listservs, and learning communities)4. Online guides5. Webinars6. Printable workbooks

Questions and Discussion