cap rates paper
TRANSCRIPT

The effects of eco-certification on office properties: a caprates-based analysis
Karen M. McGrath*
Department of Economics, Finance and Accounting, Coventry University, BusinessEnvironment and Society, William Morris Building, Priory Street, CV1 5FB, Coventry, UK
(Received 31 January 2012; final version received 19 December 2012)
Though the effects of eco-certification on individual property cash flows andvaluations have been addressed in previous literature, the question has remainedas to the worth investors place on eco-certification, and whether there is per-ceived value in the capital outlays often needed in order to achieve eco-certifica-tion. This paper is the first to provide credible empirical evidence through theanalysis of excess capitalisation rates that investors place on increased value onthe property-specific benefits of eco-certification. Based upon a data-set of Lead-ership in Energy and Environmental Design (LEED) and Energy Star-labelledcommercial office properties and their non-certified counterparts, this paperinvestigates the effects of eco-certification on the excess capitalisation rates ofcommercial office properties. Hedonic regression analysis is used to determinewhether premiums in rent and sales price associated with eco-certified propertiestranslate into lower excess capitalisation rates vs. their non-certified counter-parts. The results suggest that overall eco-certified properties have excess capi-talisation rates that are 0.364 lower than their non-certified counterparts.Additionally, those properties with only the Energy Star label also exhibit loweraverage excess capitalisation rates, with properties achieving the Energy Star rat-ing post-sale having lower excess capitalisation rates than those purchased withthe Energy Star rating in place. However, due to the small sample size, theresults surrounding properties that are LEED-only certified or that possess boththe LEED and Energy Star labels are inconclusive.
Keywords: sustainability; green labels; property investment; capitalisation rates;energy efficiency
1. Introduction
The advent of numerous voluntary environmental certification schemes for buildingsis indicative of a growing call to mitigate the negative ecological impacts of the USreal estate industry. This is related to the fact that buildings have been estimated tobe responsible for approximately 30% of the total greenhouse gas emissions, 39%of the total primary energy use and 70% of the total electricity consumption in theUSA (Nelson, 2007). The US Department of Energy (USDoE) reported that floorspace and primary energy consumption for commercial properties in the USA grewby 54 and 74%, respectively, between 1980 and 2008 (USDoE, 2011). Thoughthese growth rates are expected to slow, the above figures illustrate the increasingenvironmental impact of our commercial property investment choices.
*Email: [email protected]
Journal of Property Research, 2013Vol. 30, No. 4, 345–365, http://dx.doi.org/10.1080/09599916.2012.762034
� 2013 Taylor & Francis

As the adoption of eco-certification credentials for real estate assets becomesmore widespread, the number of eco-labelled properties has increased to the pointwhere a number of studies have endeavoured to quantify the financial benefits asso-ciated with such certification. The main focus of the majority of these studies hasbeen on the impact of eco-certification on rents and sales price, which represent cur-rent income and capital value. However, it is the capitalisation rate set by the inves-tor that is a prime determinate regarding a property’s capital value. This paperbuilds on the hypothesis that capitalisation rates incorporate factors that are associ-ated with the classic capital asset pricing model as well as variables that reflect theexpectation that the market value of the property will change over time. Lowercomparative capitalisation rates would typically indicate that there is less perceivedinvestment risk, reflecting an increasing demand for the product or higher expectedincome growth rates. Thus, in examining the factors that influence capitalisationrates, we gain a greater understanding into the value that investors place upon eco-certification beyond that of current income. Otherwise, ceteris paribus, there wouldbe no significant difference between the certified and non-certified propertiesbecause capitalisation rates would already reflect those increased rental and salesvalue found in the previous literature.
Our analysis is achieved through the examination of the effects of voluntaryeco-certification on the capitalisation rates of US commercial office properties.Using hedonic regression analysis, we compare the excess capitalisation rate, orreported capitalisation rate less the risk-free rate, of eco-certified properties to asample of non-certified properties within the same submarkets as the certified prop-erties, controlling for differences in age, height, class, land area and sale year.Given that properties with eco-certification signal potential economic benefit thatexceeds that of their non-certified peers, it was expected that the anticipated futuregain related to reduction of risk would be reflected in lower excess capitalisationrates relative to their non-certified counterparts. Through our estimation of theexcess capitalisation rates, the results suggest that eco-certified buildings exhibitexcess capitalisation rates that are roughly 0.365 lower than their non-certifiedcounterparts.
The rest of the paper is organised as follows. First, there is a brief overview ofvoluntary commercial certification schemes in the USA. This is followed by a dis-cussion of the costs and benefits of eco-certification. Next, there is a review of theliterature relevant to this study on both eco-certification and capitalisation rates.Data and methodology are outlined with a discussion of the results. Finally,concluding remarks are made.
2. Background
2.1. Voluntary US Real Estate Environmental Certification schemes
There are numerous voluntary certification schemes in the USA that seek tomeasure building sustainability and/or energy efficiency, such as Leadership inEnergy and Environmental Design (LEED), Energy Star, Green Globes, EarthAdvantage and Building Performance Compass. However, two of the most widelyaccepted certification schemes for commercial property are Energy Star and LEED.It must be noted that these two schemes are very different, both in their approachand in what is actually measured. Energy efficiency is the sole focus of Energy
346 K.M. McGrath

Star; whereas, LEED seeks to measure overall human and environmental impact, ofwhich energy efficiency is only one part. Additionally, the costs and length of timeto achieve certification associated with LEED accreditation scheme are significantlyhigher relative to achieving the Energy Star label.
Energy Star is a joint programme between the US Environmental ProtectionAgency (EPA) and USDoE with the label being applied to commercial properties in1999. Energy Star for commercial properties monitors the total energy use of abuilding and relates that to the average energy use of all properties of similar type.Energy use must be certified by a professional engineer, and commercial propertiescan earn the Energy Star label if a property’s energy usage ranks within the topquartile, relative to its peers. Properties must meet these specific benchmarks forenergy usage annually in order to maintain their Energy Star label; thus, some prop-erties may not consistently possess Energy Star certification.
The US Green Building Council’s (USGBC) LEED certification system wasintroduced in 1999 as a means to promote sustainable building practices. This holis-tic approach focuses on five main areas: energy savings, water efficiency, CO2
emissions reduction, improved indoor environmental quality and stewardship ofresources and sensitivity to their impacts. LEED is a points-based system, requiringthird-party certification to achieve one of four achievement levels: certified, silver,gold and platinum. Points can be earned through a variety of means, each withinseveral categories, making each building unique despite having earned a setachievement level. However, this unique certification process can be problematic inassessing a set perceived value for a certification system as there may be significantdifferences in the future benefits to a property in areas such as energy efficiencywhich would not be quantifiable in a study such as this one.
The LEED certification system has traditionally been focused on the construc-tion or renovation phase of a given property. A property registers for certificationbased upon the characteristics it possessed, and criteria met regarding the method ofconstruction. Upon completion, the property gains permanent certification basedupon the attainment of those criteria. However, a new LEED certification scheme,LEED for Existing Buildings: Operations and Maintenance (EB: O&M), wasintroduced in 2009. This scheme differs markedly from previous LEED certificationsystems, in that it seeks to monitor the performance of a building over time. Thus,where traditional LEED certifications are static in nature, and a property that hasachieved the LEED designation retains it throughout the building’s lifecycle, LEEDEB: O&M provides an ongoing evaluation of a building’s performance, and wouldprovide property owners with certification that reflects ongoing benefits, both intrin-sic and economic that are more akin to the Energy Star label. This system appearsto have been well received, accounting for between 16 and 36% of all newcommercial office property LEED certifications annually since its inception.
Properties that achieve dual certification, or are both LEED-certified and possessthe Energy Star label, may be trying to capitalise on both the static criteria, post-construction, that LEED denotes as well as signalling their ongoing energy effi-ciency through the Energy Star label. Interestingly, however, at least two-thirds ofthe properties in this study that possessed dual certification had obtained LEED cer-tification through the EB: O&M system. This may be due to the fact that the LEEDcertification scheme is new, relative to Energy Star certification, that owners feelthat each certification scheme represents a separate economic benefit or it may bethat the property characteristics that allow for Energy Star certification are similar
Journal of Property Research 347

enough in nature to allow for certification under the LEED EB: O&M system withlittle additional cost.
Despite the fact that LEED and Energy Star are the two dominant eco-certifica-tion schemes for commercial properties in the USA, the number of propertiesachieving these schemes has been relatively limited and is a small percentage ascompared to the overall existing stock of commercial office properties, a chart ofwhich can be found in Appendix 1. It must be noted that growth in this area wasrelatively slow until 2007/2008. Interestingly, this increase coincides with the peakin prices of electricity produced using natural gas as well as with certain citiesintroducing legislation focused on Energy Star benchmarking of government proper-ties or LEED requirements for new buildings. However, it is important to note thatthe Energy Star numbers are not cumulative, as certification must occur on anannual basis and not all previously certified buildings retain certification, whereaswith the exception of LEED EB: O&M, the numbers for LEED are cumulative.
Despite the increased levels of awareness related to the perceived benefits ofeco-certification that have taken place in the last decade, the figures in Appendix 1highlight some of the challenges associated with this area of research. Unlike manyother capitalisation rate studies, the relative youth of these two eco-certificationschemes, the low number of eco-certified properties as compared to the totalcommercial office market and the low levels of certification prior to 2007 make atime-series analysis of capitalisation rates unfeasible at this point.
2.2. The economics of eco-certification
When looking at the prospect of building any property, including those propertiesthat seek to reduce their overall environmental impact, the decision may often bebased primarily upon financial considerations. Extra costs associated with buildingeco-certified properties, such as additional planning time or an additional level ofprofessional expertise in sustainable design, may be greater than that of conven-tional buildings. However, this has proven difficult to quantify. Indeed, although ithas been estimated that, on average, it costs roughly 2% more to build green (Kats,Alevantis, Berman, Mills, & Perlman, 2003), a more recent study of constructioncosts relating to LEED certification, which, arguably, requires the highest level ofgreen expertise, found that there was no significant difference in construction costsbetween LEED and conventional properties (Matthiessen & Morris, 2008). This isreflective of the heterogeneous nature of real estate as, even within a study of simi-lar buildings, there is a wide variation in building costs. Simply stated, there arelow-cost green buildings and high-cost conventional buildings. Generally, a compar-ison is made between the actual cost of building ‘green’ to what the original costwas anticipated to be. However, this assumes that the original costing was accurateand that no further changes were made to the original budget (Morris, 2007).Indeed, in the study by Matthiessen and Morris (2008), it was notable that very fewgreen properties came in under budget, and as there were no reported negative pre-miums for green, the average reported cost was typically higher for those propertiesthan for the average reported cost of a conventional building. This may account forthe 2% cost premium found by Kats et al. (2003). However, the perception thatbuilding in a manner that is aimed at reducing overall environmental impact is moreexpensive is pervasive. One study found that, given the competitiveness of thedevelopment market and the high cost of construction, developers consider that
348 K.M. McGrath
even the seemingly nominal sum of an additional 2% in increased costs would be abarrier to building green (Yudelson, 2007).
Attaining eco-certification involves costs beyond those in the initial constructionstage. Costs associated with Energy Star certification include the ongoing expenseof data collection and verification by a qualified engineer. The LEED certificationcommands an even higher cost in terms of fees and required verification by a thirdparty LEED certification specialist. Thus, there must be some perceived futurebenefit that would justify the increased expenditure.
These economic benefits may relate to risk mitigation regarding the anticipatedregulation of greenhouse gas emissions and any increases in future energy costs.One of the most direct benefits of building green can be found through energysavings. The US Energy Information Administration has projected that the totalcommercial energy demand in OECD countries will grow by roughly 1.1% per yearuntil 2030, and that electricity demand is expected to grow by 1.8% per year(Lovins, Franta, Deshmukh, Fluhrer, & Maurer, 2007) This growth alone, notwith-standing any potential future climate change legislation, is expected to contribute toincreasing energy prices. Indeed, it is stated that energy costs are the ‘largest andmost manageable operating expense for commercial properties’, averaging about30% of a building’s total operating costs (Wiley, Benefield, & Johnson, 2010, p. 3).
In relation to eco-certified properties, Energy Star maintains that its buildings con-sistently use an average of 35% less energy and have 35% less carbon dioxide emis-sions as compared to their non-certified counterparts (EnergyStar, 2009). In a study byNewsham, Mancini, and Birt (2009), LEED-certified commercial properties have beenfound to have energy use intensity figures that range from 18 to 39% lower than thenational average. However, when using the same criteria as Energy Star certification,source energy, LEED-certified properties showed the same energy use as their non-certified counterparts (Scofield, 2009). In a study of ‘green’ buildings, Kats et al.(2003) found that green buildings used 30% less energy than conventional buildings.Overall, examining a building’s physical expenses, such as operations and manage-ment, energy, water and emissions, he identified the average total 20-year net financialbenefit of LEED properties to be $11–13/sq ft. A follow-up study by Kats et al.(2008) examined 146 green buildings and found that when he compared the percent-age of grid energy use against conventional properties, over 15% used 41–50% lessgrid energy, nearly 35% of the properties used 31–40% less grid energy and over 30%used 21–30% less grid energy. Though it did not compare like properties, a study of22 post-occupancy US General Services Association LEED and/or Energy Star build-ings located in seven different regions found that the building’s energy use intensitywas, on average, 25% better than the Commercial Building Energy Consumption Sur-vey baseline, and that aggregate operations costs were 19% less than the industry aver-age (Fowler, Rauch, Henderson, & Kora, 2010).
Additional economic benefit to eco-certified properties could be reflected in theform of increased asset prices due to an increase in gross income, an increase in netoperating income (NOI) growth, a decrease in operating costs, a decrease invacancy rates, or a decrease in risk due to longer tenancies, shorter lease-up peri-ods, as well as more stable cash flows, increased employee productivity and animproved corporate image for the lessor. This additional value may be reflected inrental premiums and price premiums. The tangible effects of such benefits havebeen studied in the recent spate of research, showing that eco-certified buildingsexhibit both rent and price premiums.
Journal of Property Research 349

2.3. Eco-certification and real estate prices
There have been a number of studies that examine the economic benefits ofeco-certification, ‘green’ or responsible building of commercial real estate on rentand/or sales prices both in the USA (see Das, Tidwell, & Ziobrowski, 2011;Dermisi, 2009; Eichholtz, Kok, & Quigley, 2010a; Fuerst & McAllister, 2011a,2011b; Harrison & Seiler, 2011; Miller, Spivey, & Florance, 2008; Pivo & Fisher,2010; Wiley et al., 2010) and internationally (see Bowman & Wills, 2008; Fuerst& McAllister, 2011c; Lorenz & Lützkendorf, 2008; Newell, McFalane, & Kok,2011). Additionally, there are a number of working papers and reports in thisarea, covering both USA (see Jaffee, Stanton, & Wallace, 2010; Pivo, 2009) andinternational commercial property (see Chegut, Eichholtz, Kok, & Quigley, 2010;Eichholtz, Kok, & Quigley, 2010b; Sayce, Sundberg, & Clements, 2010). Giventhe extent of the research, this paper will focus on those works that most closelyreflect that of this study; the effect of LEED and Energy Star certification oncommercial properties.
The first of the studies to examine the effect of eco-certification on rents andasset prices, by Wiley et al. (2010), examined the effects of LEED and Energy Starlabelling on rent, occupancy rate and sales price for Class A office buildings usinghedonic regression analysis. In their examination of rents and occupancy rate, theirsample included a total of 7308 properties across 46 US markets. The transformedvariables used in these leasing models included age, average rent, maximum contig-uous square feet, occupancy, LEED, Energy Star, market controls and controls forthe 11 different lease types identified. Maximum contiguous space was used as aproxy for larger, heterogeneous tenants, but no variable for the actual size of theproperty was used. The authors used both ordinary least squares (OLS) andtwo-stage least squares and found rental premiums of 7.3–8.6% for the Energy Starproperties and rental premiums of 15.2–17.3% for the LEED properties, both ascompared to the control properties. They also found higher occupancy rates for theEnergy Star and LEED properties with occupancy premiums of 10.2–11% and16.2–17.9%, respectively. When the authors looked at selling price, their sampleconsisted of 1151 properties across 25 separate markets. Variables included age,property size, year built, date of sale, LEED, Energy Star and market controls.Additionally, the authors estimated the OLS price per square foot for each marketby multiplying market indicators by building square feet. Noting that this was adeviation from the more conventional method of estimating market size, the authorsstate that this resulted in an intercept line to the line of predicted values, thus effect-ing a model with a better fit. Indeed, their results showed sales premiums of $29.71per square foot for Energy Star properties and sale premiums of $129 per squarefoot for LEED properties, both relative to their non-certified comparable properties.It is to be noted, however, that the authors used market as opposed to the more spe-cific submarket as their location control. Given that many green buildings arelocated in the most desirable areas within a given market, some of these premiumscould be as a result of location bias rather than as a result of eco-certification.
Fuerst and McAllister (2011b) provide both a theoretical and empirical analysisof the effect of LEED and Energy Star certification relative to rental and salesvalues for office properties. They first outline a theoretical basis for pricingdifferentials between certified and non-certified properties by presenting both themarginal price effect of eco-certification and aggregate market outcomes in a partial
350 K.M. McGrath

equilibrium framework; the results of which suggest a short-term rental and salesprice premium for certified properties. Their empirical analysis used log-linear hedo-nic rent and transaction price models. Their sample consisted of a total of 24,479office properties, 626 of which were LEED-certified and 1282 of which wereEnergy Star, in 853 separate submarkets within 81 metropolitan areas. The salesprice model consisted of 9806 observations for the years between 1999 and 2008,and the rental model consisted of 18,519 asking rent observations for Q4, 2008.The variables used controlled for such differences as age, submarket, size, numberof floors, lease type, and building class. The results showed an estimated rental pre-mium of about 4% for Energy Star properties and 5% for LEED properties, withLEED-Certified, Silver, Gold and Platinum properties exhibiting premiums of 9, 4,3 and 16%, respectively. Sales price premiums shown were about 26% for EnergyStar properties and 25% for LEED properties, with LEED-Certified, Silver, Goldand Platinum properties having 12, 33, 26 and 67 premiums, respectively. However,it is unknown if the rental figures used were direct rents, a combination of directand sublet rents, or sublet rents only. This, gives that CoStar can be inconsistent inits reporting of values for any given property’s total average weighted rent (AWR).Indeed, there are instances whereby the reported value for AWR may or may notincorporate sublet rents (if applicable) along with values for direct rents, or wherethe reported AWR consists solely of a stated sublet rental value without consider-ation for direct rental values.
Eichholtz et al. (2010a) further sought not only to quantify rental and pricepremiums, but also to estimate the direct effect of energy efficiency. They did so byapplying hedonic regression analysis in order to analyse LEED- and Energy Star-certified office properties for the period between 2004 and 2007. In addition to con-trolling for variables such as size and class, they were able to control for locationby using geographical information science techniques to identify other propertieswithin a 0.25 mile radius of each labelled building. In this way, they were able tocreate individual clusters of 0.2 square miles apiece, each containing one certifiedbuilding and at least one comparable non-certified building. The resultant 900 clus-ters contained, on average, about 12 buildings. In this, they found that the relativepremium for certified buildings is greater in geographic areas where the economicpremium for location is lesser. Additionally, they found rental premiums of 3.3%and sales premiums of 19% for Energy Star buildings. However, as with Fuerst andMcAllister (2011b), the actual rental values used from the CoStar data areunknown.
With regard to the sample of Energy Star-certified properties, they also utiliseddata from the US EPA on the energy usage for each individually certified property.This data encompasses not only source energy usage, but the site energy use of abuilding as well. The authors also sought to explain incremental variations in effec-tive rent and value for Energy Star properties. Site energy usage is the amount ofheat and energy usage that would be reflected in an energy bill, whereas sourceenergy is a gross measure, reflecting things such as transmission, delivery and pro-duction losses. Indeed, including controls for temperatures in each market, theyfound that a 10% reduction in site energy use resulted in an increased market salesvalue of roughly 2% and a 50 basis point increase in effective rent. Additionally,every $1 in source energy savings produced a $20.73 increase in market value.These figures are in addition to the label premium of 16% for sales and 6% forrental noted for Energy Star-certified buildings.
Journal of Property Research 351

2.4. Eco-certification and real estate capitalisation rates
With regards to eco-certification, the latter part of the research undertaken byEichholtz et al. (2010a) highlights the most immediate, and most easily measured,economic benefit: decreased operating costs due to increased energy costs. Ceterisparibus, these savings have a direct effect on NOI, and if a premium is held toinsure against future energy price increases, cap rates. However, prior to this study,capitalisation rates as they relate to eco-certification is limited to one knownpublished study, by Miller et al. (2008). There have been concerns regarding theresults of this study (Muldavin, 2008), where the authors used hedonic regressionto analyse a sample of over 2000 Class A properties that all met the following crite-rion: greater than 200,000 square feet in size, a minimum of five stories, built after1970, and multi-tenanted, finding an average sales premium of 9.94% for LEEDproperties and an average sales premium of 5.76% for Energy Star-certified proper-ties, relative to the sample. However, with regards to the paper’s capitalisation rateanalysis, the authors state that they only had a modest sample of properties wherecapitalisation rates were known, and they do not disclose either the number of theoverall sample, or the number of Energy Star or LEED properties within thesample. Additionally, they did not provide a model identified as specific to theircapitalisation rates analysis. However, the authors state that they found capitalisa-tion rates of eco-certified properties to be lower by 55 basis points. No breakdownof LEED or Energy Star properties was provided.
The US literature addressing capitalisation rates, as they relate to this paper,specifically in an investment only context or the differences between property typesand regions, addressing transactions only rather than the use of capitalisation ratesin property appraisal, has focused primarily on two areas and have not addressedeco-certification. The first area has concentrated on the effects of capital marketfactors on capitalisation rates over time (see Ambrose & Nourse, 1993; Evans,1990; Froland, 1987; Jud & Winkler, 1995; McDonald & Dermisi, 2009). Evans(1990) finds a strong association between capitalisation rates and the stock market,though the relationship reflects a lag of one quarter for the property market, whichreflects the relatively inefficient nature of the property market and accounts for thetime between the sales contract date and the closing date. This association high-lights the fact that real estate investment yields must relate to capital market ratesgiven that investors can substitute across investment types in order to achieve thedesired rate of return.
The second area of study focuses on cross-sectional variation in capitalisationrates across different property asset classes or varied metropolitan areas (seeAmbrose & Nourse, 1993; Chichernea, Miller, Fisher, Sklarz, & White, 2008;McDonald & Dermisi, 2008, 2009; Sivitanidou & Sivitanides, 1996, 1999). Muchof this research is an analysis of capitalisation rates in relation to time-series in aspecific market. Unfortunately, for this paper, due to the relatively recent advent ofLEED and Energy Star certifications and the low number of eco-certified propertiesrelative to the overall commercial property market, such panel data are currentlyunavailable at any significant level. Additionally, of the above, only two of the capi-talisation rate-specific studies incorporated building-specific features as variables intheir models. These variables were limited to size, age at the time of sale anddegree of outdoor space (Chichernea et al., 2008) and building class, age, if theproperty had been renovated, and parking status (McDonald & Dermisi, 2008).
352 K.M. McGrath

Further, only one study, McDonald and Dermisi (2009) actually sought to examinethe capitalisation rates of individual office properties. Their sample consisted of 132commercial office properties, all located in downtown Chicago. However, they onlyused three building-specific variables: class, age and a dummy variable to denotewhether or not the property had been renovated; all other variables were market-specific.
In contrast to the majority of capitalisation rate studies, this paper seeks to iden-tify a property-specific attribute, eco-certification, which may reflect the investor’sassumptions for future return growth, or reduced risk, to be reflected through thecapitalisation rate. Thus, many of the variables typically associated with capitalisa-tion rate analysis, such as time-invariant local office market traits like existing stock,time-variant local office market features such as employment growth and nationalcapital market time-variant effects such as inflation, are not included in this model.
3. Data and methodology
3.1. Data
The sample for this study was the US commercial office properties. Arms-lengthsales data1 for commercial office properties, including capitalisation rates when dis-closed, were obtained from the CoStar Group’s CoStar COMPS2 in October 2010for the period between January 2002 and October 2010. The individual submarketsused in this study are standard as defined by the CoStar Group. Initially, submarketswith either LEED-certified or Energy Star-labelled properties were identified. Allcommercial properties within those submarkets, both certified and non-certifiedcomparable properties, comprised the preliminary sample whereby every submarketcontains at least one eco-certified property and one non-certified comparable prop-erty. Though this study does not account for local market-specific variables shownto affect capitalisation rates, such as expected growth rates and liquidity (seeChichernea et al., 2008), submarkets were used to account for locational biaseswithin the regional markets. Each of the properties within the sample of identifiedsubmarkets were then manually matched to properties identified per databasesprovided by Energy Star and LEED using criteria such as street address, buildingname and owner. The LEED-registered projects have the option of choosing not topublicly disclose any information regarding the project. Thus, where a property wasidentified in CoStar as being a LEED property but no match was found in theLEED database, the CoStar information was deemed accurate and it was assumedthat the property in question had been registered as ‘confidential’.
In the few instances where the capitalisation rate was not specifically disclosedby CoStar, but values for net income and sales price existed, a capitalisation ratewas derived using the basic capitalisation rate formula:
Capitalisation rate ¼ Net operating income
Price
Additionally, given that those properties with abnormally high or lowcapitalisation rates do not, typically, represent normal sales conditions,3 the fewproperties with capitalisation rates that exceeded the highest average quarterlycapitalisation rate for all relevant markets within the given time period were
Journal of Property Research 353

eliminated, as were all capitalisation rates that were more than 1% lower than thelowest average quarterly capitalisation rate for all relevant markets during the giventime period; both of which were determined using data provided by Real CapitalAnalytics. Thus, the remaining properties all had reported capitalisation rates ofbetween 3.5 and 10.5%. However, given that it is expected that real estate equityyields are related to other macro-economic factors and rates in the capital markets(see Evans, 1990; Froland, 1987) and that there were marked fluctuations in theyield curve over our sample period, the capitalisation rates used in our analysiswere excess capitalisation rates, or the capitalisation rate in excess of the risk-freerate. In this case, the proxy for the risk-free rate used was the threemonth T-bill forthe quarter in which the sale of a property occurred.
Due to the fact that transaction costs were not available for all properties, thisinformation was not included in the derived capitalisation rate formula. Addition-ally, only one region (Houston) had property tax incentives during the time per-iod allotted and our sample did contain two relevant transactions. The first was aproperty that was labelled Energy Star only and had a capitalisation rate that washigher than the mean for Energy Star-only properties by 0.86. The second prop-erty was a dual-certified property that had a capitalisation rate that was lowerthan the mean dual-certified capitalisation rate by 0.32. Thus, while it is not pos-sible to ascertain whether either of these properties actually incorporated thispotential benefit into their capitalisation rate calculations, we acknowledge thatthere is the possibility that these two properties may slightly affect our resultsdespite the fact that the former would not seem to skew it in favour of ourhypothesis and, as discussed in the results section, the result for the latter groupwas not significant.
Although each of the properties in the remaining sample was listed by CoStaras being an arm’s length transaction and not as a part of a portfolio sale, andalthough there was a general vetting of the individual transaction notes for eachproperty, such properties may have been included in the sample due to underlyinginconsistencies in the reporting of information in CoStar. This is noted becauseapproximately 12% of the sample consists of properties that have references withinthe transaction notes that relate to 10314 or sale-leaseback transactions despite thefact that CoStar has attributed these properties to be arm’s length transactions.Additionally, properties that are 100% owner-occupied properties often provideextraneous benefits that can be markedly different from those surrounding a straightinvestment decision. Thus, given the fact that this study seeks to examine excesscapitalisation rates from the vantage point of pure investment, all single tenantproperties considered to be 100% owner-occupied were also removed from oursample.
Finally, the sample was further refined to account for the percentage of actualoffice space, removing all properties that were identified as having less than 75%office use. The sale age was determined by using either the building’s actual age atthe time of sale, or by taking the age of the property since its latest renovation,whichever was most recent. In all, this resulted in a sample of 388 properties in 79individual submarkets. Of these, 105 properties were identified as having eitherLEED or Energy Star credentials, 15 properties possessing both the Energy Starand LEED credential, 81 properties having only an Energy Star label and nineproperties having only the LEED credential.
354 K.M. McGrath

3.2. Hedonic models for capitalisation rates
Hedonic regression analysis is used in this study in order to identify the effect ofeco-certification on a given property’s excess capitalisation rates. Though hedonicregression is the accepted methodology utilised in the examination of value determi-nants in real estate research, it should be noted that this form of analysis is subjectto omitted variable bias. Thus, it is possible that eco-certification may be correlatedwith property-specific, unquantified variables, such as construction quality orbuilding services quality, which would result in an under or overestimation of thevariables employed in our model.
The dependent variable is the excess capitalisation rate, or reportedcapitalisation rate less the risk-free rate for the quarter in which the transaction wasrecorded. The independent variables reflect individual building characteristics aswell as controls for location and time variant effects.
3.2.1. Model 1
EXCR ¼ b0 þ b1ln SAi þ b2lnCLi þ b3lnFNi þ b4ln SYi þ b5ln SMi þ b6lnLAi
þ b7lnECi þ �i
In the above equation, SAi represents the age of the property at the time of sale,as measured from the more recent of either the year built or the year of the mostrecent stated major renovation, and is used to control for functional obsolescence,CLi is the control for the standard ‘A’, ‘B’ and ‘C’ rating of building class, FNi
represents the number of floors and reflects building size, SYi is a dummy variablethat represents the year in which the property was sold in order to control for thechanges in the quantities of the characteristics and provide measures of propertychange between the time periods, SMi controls for the 79 CoStar identified submar-kets which contained an eco-certified property with capitalisation rates as well as atleast one non-certified property, LAi represents the land area of the property and ɛirepresents the error term. Additionally, ECi represents the dummy variable used toidentify those properties that hold any eco-certification. Additionally, independentvariable numeric values were transformed to log values in order to reduce non-normality within the original sample and to reduce heteroskedasticity.
So that we might examine the effects of different types of eco-certification,Model 2 exchanges the ECi variable with separate terms representing properties thathold both a LEED certification and are Energy Star-labelled, properties that are onlyEnergy Star-labelled, and those properties that hold only LEED certification.
Further, Model 3 then replaces the ECi variable with unique terms to representEnergy Star certification at sale and post-sale as well as LEED certification at saleand post-sale. This is in order to explore the values associated with purchasing aproperty that has already achieved eco-certification, as well as with those propertiesfor which the investor perceives benefit in the future attainment of eco-certification.
Finally, Model 4 replaces the ECi variable with unique terms to represent theLEED certification levels as investors may place varying values on the differinglevels of certification within the LEED-specific eco-certification scheme.
Journal of Property Research 355
4. Results
4.1. Descriptive statistics
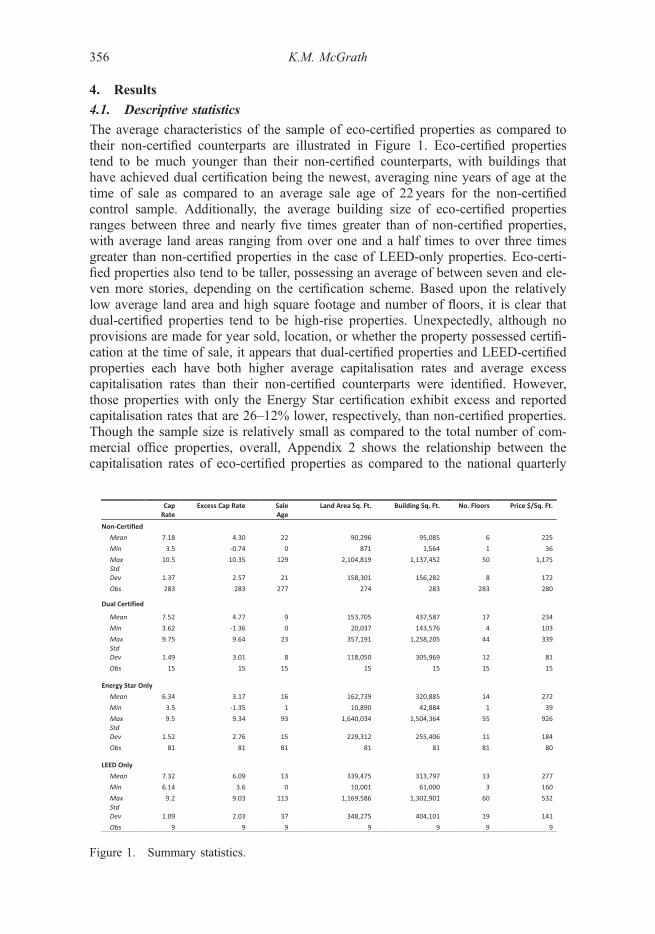
The average characteristics of the sample of eco-certified properties as compared totheir non-certified counterparts are illustrated in Figure 1. Eco-certified propertiestend to be much younger than their non-certified counterparts, with buildings thathave achieved dual certification being the newest, averaging nine years of age at thetime of sale as compared to an average sale age of 22 years for the non-certifiedcontrol sample. Additionally, the average building size of eco-certified propertiesranges between three and nearly five times greater than of non-certified properties,with average land areas ranging from over one and a half times to over three timesgreater than non-certified properties in the case of LEED-only properties. Eco-certi-fied properties also tend to be taller, possessing an average of between seven and ele-ven more stories, depending on the certification scheme. Based upon the relativelylow average land area and high square footage and number of floors, it is clear thatdual-certified properties tend to be high-rise properties. Unexpectedly, although noprovisions are made for year sold, location, or whether the property possessed certifi-cation at the time of sale, it appears that dual-certified properties and LEED-certifiedproperties each have both higher average capitalisation rates and average excesscapitalisation rates than their non-certified counterparts were identified. However,those properties with only the Energy Star certification exhibit excess and reportedcapitalisation rates that are 26–12% lower, respectively, than non-certified properties.Though the sample size is relatively small as compared to the total number of com-mercial office properties, overall, Appendix 2 shows the relationship between thecapitalisation rates of eco-certified properties as compared to the national quarterly
Figure 1. Summary statistics.
356 K.M. McGrath
average capitalisation rate. Non-certified properties had the lowest sales price persquare foot at $225. The average sales price per square foot for dual-certified proper-ties was only 4% higher than non-certified properties despite the fact that like pricesfor Energy Star-only properties and LEED-only properties were 21 and 23% higher,respectively. Overall, the quality of the eco-certified properties was higher withnearly 80% of the sample being rated as Class A vs. just 17% of the non-certifiedproperties. Class B and C properties accounted for 60 and 23% of the non-certifiedsample, respectively, and none of the eco-certified properties were rated Class C. Itis interesting to note that though eco-certified properties, specifically dual-certifiedproperties, tend to be newer, higher specification properties, in some cases, theaverage reported and excess capitalisation rates, are greater than their non-certifiedcounterparts. While this initially seems contrary to our hypothesis that eco-certifiedproperties would have lower capitalisation rates due to perceived future benefits, itdoes address concerns regarding the high correlation between high-specificationproperties and eco-certification. Namely, are the benefits associated with newer,higher specification properties being attributed to eco-certification simply becauseeco-certified properties tend to have these characteristics? The summary statisticswould indicate that this is not the case.
4.2. Hedonic regression results
In examining the effects that eco-certification might have on commercial officeproperties, with the general hypothesis being that eco-certified properties wouldcommand lower overall capitalisation rates as compared to their non-certified coun-terparts, hedonic regressions were performed using models 1 and 2 outlined above.A summary of results can be found in Figure 2. Both regressions, based upon atotal of 375 observed buildings, have a high degree of explanatory power, account-ing for approximately 81% of the variation in excess capitalisation rates. The con-trol variables, with the exception of class in some iterations of the model,5 whichwere not statistically significant, all exhibit the expected signs. As compared to saleyear 2008, the positive coefficients for sale years 2002–2005, 2009 and 2010 accu-rately reflect higher capitalisation rates for those years (see Appendix 2), as do thenegative coefficients for sale years 2006 and 2007. As noted in Appendix 1,although the number of eco-certified properties is increasing, this is still an extre-mely small percentage of the overall stock and most of that growth took place after2007. Thus, it is not anticipated that any lower excess capitalisation rates exhibitedby eco-certified properties would have a significant impact on the overall excesscapitalisation rates recorded during this period. As expected, location seemed tohave significance in explaining the differences in capitalisation rates with 46% ofthe submarkets included being significant at the 1% level, 22% of the submarketsincluded being significant at the 5% level and 5% at the 10% level.
In relation to eco-certification in model 1, the results show a coefficient of�0.364, significant at the 6.4% level, indicating that eco-certified properties overalldo exhibit lower excess capitalisation rates than do their non-certified counterparts.However, the regression results outlined in Model 2, which uses separate variablesfor dual certification, Energy Star labelled-only, and LEED certified-only propertiesare surprising, with only Energy Star-labelled properties having a negativecoefficient of �0.629, significant at the 1% level. This reflects the hypothesis thatthere is some expected future increase in NOI, be it through increased rent
Journal of Property Research 357

potential, decreasing relative utilities expenses, reputational benefits, or risk reduc-tion. Indeed, it would appear that the risk mitigation related to energy consider-ations is important to property investors. Unexpectedly, LEED-only propertiesexhibited positive coefficients at 0.4446, though it is important to note that thisresult is not statistically significant. One possible reason for this outcome could bethat this is simply a reflection of the relatively small sample size. However, it couldalso be a reflection of the perceived values of those individual differences orschemes within each LEED-certified property by which LEED certification wasachieved, or it could be a possible reflection on the overall long-term value ofLEED certification as seen by investors. It is possible that investors do not see thelonger term benefits associated with a static designation achieved by varying means.Additionally, the positive value of 0.495 for dual-certified properties, althoughagain, not statistically significant, is an additional unanticipated result, though it isin keeping with the values outlined in Figure 1.
Figure 2. Results of Hedonic model estimation for Models 1 and 2.
358 K.M. McGrath
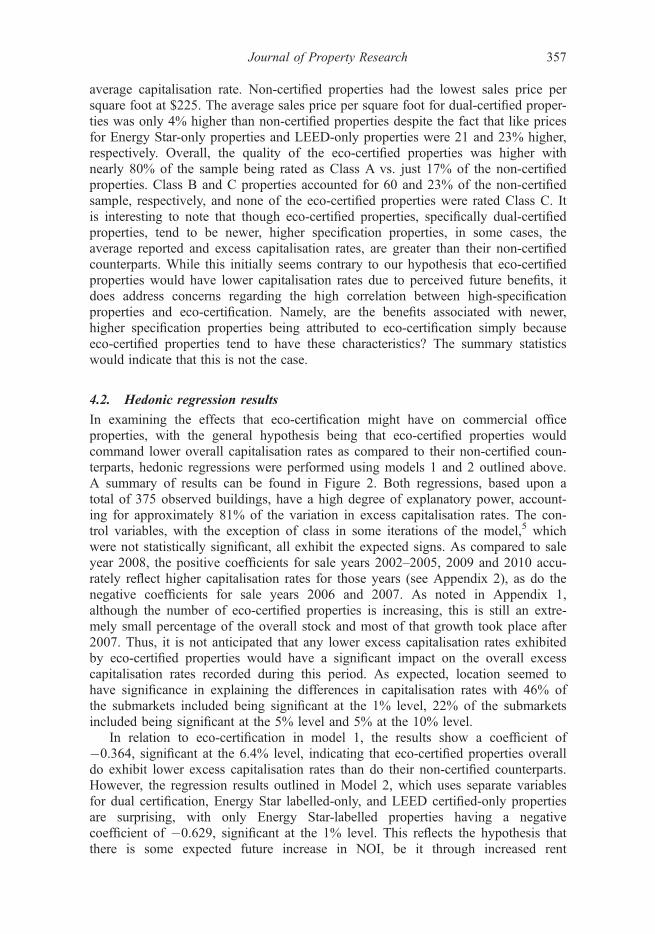
Model 3 in Figure 3 looks at the excess capitalisation rates of properties,distinguishing between those properties that had eco-certification in place at thetime of sale, and those properties who achieved eco-certification after they weresold. With an explanatory power level of over 81%, the results show that thoseproperties that achieved LEED certification after they were purchased have a coeffi-cient of 1.054, significant at the 1% level. Regarding the dual-certified properties,only 13% were LEED-certified prior to the sale, whereas 80% of dual-certifiedproperties possessed an Energy Star certification at the time of sale. The coefficientfor those properties is �0.455, significant at the 10% level, with post-sale Energy
Figure 3. Results of Hedonic model estimation for Model 3.
Journal of Property Research 359

Star properties having a coefficient of �0.853. Thus, given the composition of thedual-certified sample, the dual-certified results outlined in Model 2 appear to bemore reasonable. However, future research is needed to confirm the result and,indeed, to corroborate the results for LEED properties, which, though not statisti-cally significant, exhibited the expected sign with a coefficient of �0.384, when alarger sample becomes available.
Looking at the significance and the coefficient of LEED properties that achievedcertification after they were sold, it is interesting to note that roughly 70% of thoseachieving certification post-sale did so under the LEED EB: O&M scheme. Thiscould be significant because not only are there expenses associated with achievingcertification, be they construction or fees, for any LEED certification, but this spe-cific scheme will also require an additional added annual expense. This may alsoreflect a lack of currently quantifiable future benefits related to the relative newnessof the scheme and further investigation as to the longer term benefits of LEED EB:O&M should be investigated when such data is available.
Though the coefficients for properties purchased with the Energy Star certificationand for those that achieved certification after purchase are significantly lower thantheir non-certified counterparts, it is interesting to note that the coefficient for thoseproperties that achieved Energy Star certification after they were purchased is nearlytwice the coefficient for those purchased with the Energy Star label in place. The latterindicates a premium for the Energy Star label, with anticipated future benefits such asthose identified in prior research. However, the former indicates that there are addi-tional perceived incentives associated with choosing to obtain Energy Star certificationafter purchase. These could be related to numerous predicted future gains and risk mit-igation achieved through acquiring the Energy Star label that would more than offsetthe cost of certification. Such potential benefits include the anticipation of financialincentives offered to new and existing property owners for improvements specific toenergy efficiency, or in anticipation of increases in energy prices or ahead of greaterlevels of legislation, the likes of which was passed in Washington, DC in 2009. TheDC legislation, which began in 2010 for commercial office properties and will bephased in over four years and did not affect our sample, does not mandate that proper-ties achieve the Energy Star label, but it does benchmark properties using the EnergyStar benchmarking tool. Thus, all properties must bear the cost of monitoring energyperformance regardless of their desire to actually achieve certification.
Figure 4 illustrates the hedonic regression results for Model 4, examining theexcess capitalisation rates of LEED-certified properties by certification type. In this,we see that the only significant result is for LEED-certified properties, showing excesscapitalisation rates that are significantly higher than non-certified properties. It mustbe noted, however, that 100% of the properties at the LEED certification levelsachieved this certification after the property was purchased, and all achieved certifica-tion through the LEED EB or the newer LEED EB: O&M scheme. Thus, these higherexcess capitalisation rates may again reflect an anticipation of additional costs incurredthrough achieving certification, they may be a reflection of the potential difficulty inquantifying the future benefits of the new LEED rating scheme despite its similarity tothe Energy Star label, or they may represent some negative value associated withLEED certification, despite the latter being contrary to previous findings.
Though the results for LEED Silver, LEED Gold and LEED Platinum were notstatistically significant, most likely due to issues with the relatively small sample size,LEED Silver and LEED Gold properties all failed to exhibit the expected sign, with
360 K.M. McGrath

coefficients of 0.408 and 0.496, respectively. Again, looking at the composition ofthe sample, LEED Silver and LEED Gold had just 25 and 33% of properties certifiedat the time of sale. However, both groups were much more varied in their certificationschemes, with all major LEED schemes represented. Again, though it did not achievestatistical significance, LEED Platinum did exhibit the expected sign, with acoefficient of �1.316, with 100% of the sample being certified at the time of sale.
5. Conclusion
Despite its growing popularity and level of awareness in the USA, the eco-certifiedmarket segment overall remains a small portion of the commercial office sector.Given the apparent increase in attention given to the ecological impacts of buildings,be it through increased regulation, energy costs and usage, or changes in consumerdemand, and the growth rates surrounding levels of certification, this study explores
Figure 4. Results of Hedonic model estimation for Model 4.
Journal of Property Research 361

whether such future benefits would be quantified in the excess capitalisation rates ofeco-certified commercial office properties. Indeed, the research indicates that, at leastin the case of Energy Star properties, there is a quantifiable perceived future eco-nomic benefit beyond that of greater current rents and capital values and that this isreflected in the overall lower capitalisation rates of eco-certified buildings. Indeed, itis hypothesised that those properties that anticipate future benefits associated withthe criteria surrounding eco-certification, or through eco-certification itself, wouldhave lower capitalisation rates than their peers who do not possess those attributes.
As noted above, the results of this study generally support that hypothesis, witheco-certified properties exhibiting excess capitalisation rates that are lower thannon-certified properties by a coefficient of 0.364. When examining the different certi-fication schemes, dual-certified, Energy Star certified-only and LEED certified-only,the results signalled an increased perceived benefit directly related to current andfuture energy costs or legislation as Energy Star properties reflected excess capitalisa-tion rates that were 0.629 lower than those non-certified properties. However, theresults for dual-certified and LEED-certified are much less conclusive with resultsthat reflect higher than average excess capitalisation rates, though these results werenot, overall, statistically significant and seemed to be related to the number ofproperties that had achieved LEED certification post-sale. Thus, more research shouldbe done as more data becomes available to explore whether these results indicate adifference in perceived value between Energy Star-labelling and the more staticLEED certification overall, what the relationship between perceived future value isrelative to the new LEED EB: O&M scheme, and whether there will be differencesin perceptions of value related to LEED EB: O&M and Energy Star certifications.
Indeed, identifying the relationship between eco-certification and the determi-nants of capitalisation rates is important as it can help us to quantify the benefitsassociated with eco-certification. Though it should be noted that there were substan-tial changes in the external environment, specifically related to energy, energy pricesand other environmental considerations during the period examined, the results ofthis study indicate that energy efficiency is a key factor in determining excesscapitalisation rates. Investors value the Energy Star label beyond the reflection ofdecreased NOI and increased property value. Indeed, investors seem to havedetermined that the greatest future value is in attaining the Energy Star label afterpurchase, given the coefficient of �0.853 as compared to a coefficient of �0.455 forproperties sold with the Energy Star label. These results indicate that some of thevalue of this label is already priced into the property that is sold holding the EnergyStar label, though the investor still anticipates future value. However, the results forLEED-certified properties are not so definitive. This may have been due in large partto the small sample size associated with LEED properties in this study. However,these results may also reflect the static nature of most LEED certification schemesand the variety of means that may have been used to achieve similar levels of certifi-cation amongst different properties. Additionally, there is the factor of the relativenewness of the LEED EB: O&M scheme, with the relative unknowns regardingexpenses in achieving certification as well as actual benefits that may be associatedwith it. Thus, as the number of properties sold with LEED certification increases,and as the costs and benefits associated with the LEED EB: O&M scheme becomemore evident, it may be possible to better explain both the relationship betweenLEED certification and excess capitalisation rates as well as directly comparing thebenefits LEED vs. the known, and clearly valued Energy Star certification.
362 K.M. McGrath

Notes on contributorKaren M. McGrath is currently a lecturer in finance at Coventry University and is workingtoward her doctoral degree at the University of Reading, Henley Business School. She holdsan MS in Finance/Real Estate from New York University, and a BA from BucknellUniversity. Prior to joining the University of Reading, Ms. McGrath worked in investmentmanagement, spending over 15 years as a head equities trader and also serving as a directorof Environmental, Social and Governance (ESG) research.
Notes1. As classified by CoStar.2. CoStar Group is the world’s largest provider of information regarding commercial real
estate in the USA and the UK (CoStar Group, 2012).3. The number of properties that fell outside of the used 3.5–10.5% capitalisation rate
range was nominal in relation to the overall sample. Additionally, the majority of theseproperties reported issues that would affect the capitalisation rate outside of the normalexpected parameters including, but not limited to, change of use, below market rents,the capitalisation rate including offsets for loan defeasance, pre-forclosure, forclosure,sale set up as an annuity investment and non-credit tenants.
4. 1031 refers to section 1031 of the US Internal Revenue Code which allows owners ofcertain kinds of assets, held for business or investment purposes only, to defer capitalgains taxes on any exchange of like-kind properties.
5. Five properties were identified in the sample as having been sold with capitalisationrates that were incongruous with their class. Based on transaction notes from CoStar,these properties were specifically identified as refurbishment projects, properties withbelow market rents, or properties sold under extreme legal duress. Analysis of thesample with these properties removed resulted in the expected sign for class, and theoverall results were consistent with those found using the complete sample.
References
Ambrose, B. W., & Nourse, H. O. (1993). Factors influencing capitalization rates. Journal ofReal Estate Research, 8, 221.
Bowman, R., & Wills, J. (2008). Valuing green how green buildings affect property valuesand getting the valuation method right. Sydney: Green Building Council of Australia.
Chegut, A., Eichholtz, P., Kok, N., & Quigley, J. M. (2010). The value of green buildings.New evidence from the United Kingdom. Paper presented at the International AREUEAMeeting, Rotterdam, The Netherlands.
Chichernea, D., Miller, N., Fisher, J., Sklarz, M., & White, B. (2008). A cross-sectionalanalysis of cap rates by MSA. Journal of Real Estate Research, 30, 249–292.
CoStar Group. (2012). About us. Retrieved from http://www.costar.co.uk/en/About-Us/Das, P., Tidwell, A., & Ziobrowski, A. (2011). Dynamics of green rentals over market
cycles: Evidence from commercial office properties in San Francisco and WashingtonDC. The Journal of Sustainable Real Estate, 3, 1–22.
Dermisi, S. (2009). Effect of LEED ratings and levels on office property assessed andmarket values. The Journal of Sustainable Real Estate, 1, 23–47.
Eichholtz, P., Kok, N., & Quigley, J. M. (2010a). American economic review. [Doing wellby doing good? Green office buildings].
Eichholtz, P., Kok, N., & Quigley, J. M. (2010b). The economics of green building. Berkeleyprogram on housing and urban policy. UC Berkeley, CA: Institute of Business andEconomic Research.
EnergyStar. (2009). Celebrating a decade of energy star buildings (1999–2009): The USEnvironmental Protection Agency The US Department of Energy.
Evans, R. D. (1990). A transfer function analysis of real estate capitalization rates. Journalof Real Estate Research, 5, 371–379.
Fowler, K. M., Rauch, E. M., Henderson, J. W., & Kora, A. R. (2010). Re-assessing greenbuilding performance: A post occupancy evaluation of 22 GSA buildings. Richland, WA:Pacific Northwest National Laboratory (PNNL).
Journal of Property Research 363

Froland, C. (1987). What determines cap rates on real estate? The Journal of PortfolioManagement, 13, 77–82.
Fuerst, F., & McAllister, P. (2011a). Eco-labeling in commercial office markets: Do LEED andEnergy Star offices obtain multiple premiums? Ecological Economics, 70, 1220–1230.
Fuerst, F., & McAllister, P. (2011b). Green noise or green value? Measuring the effects ofenvironmental certification on office values. Real Estate Economics, 39, 45–69.
Fuerst, F., & McAllister, P. (2011c). The impact of energy performance certificates on therental and capital values of commercial property assets. Energy Policy, 39, 6608–6614.
Harrison, D., & Seiler, M. (2011). The political economy of green office buildings. Journalof Property Investment & Finance, 29, 551–565.
Jaffee, D. M., Stanton, R., & Wallace, N. E. (2010). Energy factors, leasing structure andthe market price of office buildings in the US. UC Berkeley, CA: Fisher Center for RealEstate and Urban Economics.
Jud, D. G., & Winkler, D. T. (1995). The capitalization rate of commercial properties andmarket returns. Journal of Real Estate Research, 10, 509–518.
Kats, G., Alevantis, L., Berman, A., Mills, E., & Perlman, J. (2003). The costs and financialbenefits of green buildings. A Report to California’s sustainable building task force.
Kats, G., James, M., Apfelbaum, S., Darden, T., Farr, D., Fox, R., … Braman, J. (2008).Greening buildings and communities: Costs and benefits. Zug: Good Energies.
Lorenz, D., & Lützkendorf, T. (2008). Sustainability in property valuation: Theory andpractice. Journal of Property Investment & Finance, 26, 482–521.
Lovins, A., Franta, G., Deshmukh, A., Fluhrer, C., & Maurer, E. (2007). The energy chal-lenge: A new agenda for corporate real estate. Rocky mountain institute corenet global.Retrieved from http://www.rmi.org/Knowledge-Center/Library/2007-14_CorenetEnergy-Challenge.
Matthiessen, L. F., & Morris, P. (2008). The cost of green revisited: Reexamining the feasi-bility and cost impact of sustainable design in the light of increased market adoption.London: Davis Langdon.
McDonald, J. F., & Dermisi, S. (2008). Capitalization rates, discount rates, and net operatingincome: The case of downtown Chicago office buildings. Journal of Real EstatePortfolio Management, 14, 363–374.
McDonald, J. F., & Dermisi, S. (2009). Office building capitalization rates: The case ofdowntown Chicago. Journal of Real Estate Finance and Economics, 39, 472–485.
Miller, N., Spivey, J., & Florance, A. (2008). Does green pay off? Journal of Real EstatePortfolio Management, 14, 385–400.
Morris, P. (2007). What does green really cost? PREA Quarterly, Summer, 55–60.Muldavin, S. (2008). Quantifying “green” value: Assessing the applicability of the CoStar
studies. San Rafael, CA: Green Buildings Finance Consortium.Nelson, A. J. (2007). The greening of US investment real estate – market fundamentals,
prospects and opportunities: RREEF Research (p. 57).Newell, G., McFalane, J., & Kok, N. (2011). Building better returns: A study of the financial
performance of green office buildings in Australia. Deakin: Australian Property Institute.Newsham, G. R., Mancini, S., & Birt, B. J. (2009). Do LEED-certified buildings save
energy? Yes, but … Energy and Buildings, 41, 897–905.Pivo, G. (2009). Social and environmental metrics for US real estate portfolios: Sources of
data and aggregation methods. Journal of Property Investment & Finance, 27, 481–510.Pivo, G., & Fisher, J. D. (2010). Income, value and returns in socially responsible office
properties. Journal of Real Estate Research, 32, 243–270.Sayce, S., Sundberg, A., & Clements, B. (2010). Is sustainability reflected in commercial
property prices: An analysis of the evidence base. In T. R. I. o. C. Surveyers (Ed.), (Vol.January). London: The Royal Institution of Chartered Surveyers.
Scofield, J. H. (2009). Do LEED-certified buildings save energy? Not really Energy andBuildings, 41, 1386–1390.
Sivitanidou, R. C., & Sivitanides, P. S. (1996). Office capitalization rates: Why do they varyacross metropolitan markets? Real Estate Issues, 21, 34–39.
Sivitanidou, R., & Sivitanides, P. (1999). Office capitalization rates: Real estate and capitalmarket influences. Journal of Real Estate Finance and Economics, 18, 297–322.
364 K.M. McGrath

USDoE. (2011, October 18). Buildings energy data book chapter 3: Commercial Sector.Retrieved from http://buildingsdatabook.eren.doe.gov/ChapterIntro3.aspx
Wiley, J. A., Benefield, J. D., & Johnson, K. H. (2010). Green design and the market forcommercial office space. Journal of Real Estate Finance and Economics, 41, 228–243.doi: 10.1007/s11146-008-9142-2.
Yudelson, J. (2007). Green building incentives that work: A closer look at how local govern-ments are incentivizing green development. NAIOP Research Foundation.
1. Appendix 1
2. Appendix 2
Journal of Property Research 365

Copyright of Journal of Property Research is the property of Routledge and its content maynot be copied or emailed to multiple sites or posted to a listserv without the copyright holder'sexpress written permission. However, users may print, download, or email articles forindividual use.