cantit - cslds.org
TRANSCRIPT

Speech Perception and Oral Language Development of Deaf Children in Mainstream schools
Emily Lam, Tammy Lau, Wilson Yu Jockey Club Sign Bilingualism and Co-
enrolment in Deaf Education Programme 20th June, 2014
1

Acknowledgement

The impact of hearing impairment
“deaf-mute” ??
聾-啞 ??
HI has a negative impact on speech perception and oral language development!
3

The role of hearing technology
• Blamey (2003)
• Leigh (2008)
• Moog (2002)
• Geers and colleagues (2003)
High-gain HA
Multichannel CI
access to speech
information
develop oral
language
4

The oral language ability of deaf children
• reports on the benefit of CI and neonatal hearing screening (Yoshinaga-Itano et al., 1998; Moog, 2002; Blamey &
Sarant, 2002; Nikolopoulos et al., 2004; Svirsky et al., 2004; Hayes et al., 2009; Niparko et al., 2010; Meinzen-Derr et al., 2011)
• Oral language abilities of deaf children are still diverse and with large individual differences (Blamey,
1998; Svirsky et al., 2000; Geers, 2006; Fitzpatrick, 2011)
• The language growth rate of deaf children over the time is also questionable (Delage & Tuller, 2007; Geers et
al., 2008; Hayes, 2009)
5

Contributing factors
• Demographic factors – Residual hearing prior to CI (Geers, 2006; Niparko, 2010)
– Parent-child interactions (Niparko, 2010)
– Socioeconomic status (Niparko, 2010)
– Degree of HL (Sininger et al., 2010; Fitzpatrick, 2011)
– Parent education (Fitzpatrick, 2011)
– Age of receiving amplification / CI (Geers, 2006; Nicholas & Geers, 2007; Sininger et al., 2010)
– Cochlear implant use (Sininger et al., 2010)
– Rehabilitation focus (Geers, 2006)
• Outcome measurement
– Speech perception (Blamey, 1998; Blamey et al., 2001; Pisoni, 2004; DesJardin, 2009)
6

Speech perception
Degree of Hearing Loss vs
Speech Perception Ability
• a process by which the speech is heard, interpreted and understood
• critical for early linguistic development
Mild (25-40 dB)
Moderate (41-55 dB)
MS (56-70 dB)
Severe (71-90 dB)
Profound (>90 dB)
7

Assessing the speech perception ability
• Contemporary speech perception measures – Speech feature perception test (DesJardin, 2009)
– Closed-set / open-set word perception test (Blamey, 1998; Lee
& van Hasselt, 2004)
– Sentence speech perception test (Bench et al., 1979)
– Tone perception test (Lee et al., 2002)
• Beware of the tester’s lexical knowledge and speech production ability
8

The speech perception ability of deaf children
• Speech perception abilities of deaf children are delayed relative to normal hearing children (Lee et al., 2002)
• A high correlation of speech perception ability & language development (Blamey et al., 1998; Blamey et al., 2001;
Pisoni, 2004) than any demographic variable (Blamey et al., 2001)
• Better speech perception ability better receptive language development better expressive language development? (DesJardin et al., 2009)
9

Research Questions
1. What is the speech perception and oral language abilities of deaf children in HK?
2. What factor(s) may better predict oral language outcome in deaf children?
3. What is the development of oral language ability of deaf children over the time?
10

Methodology
11
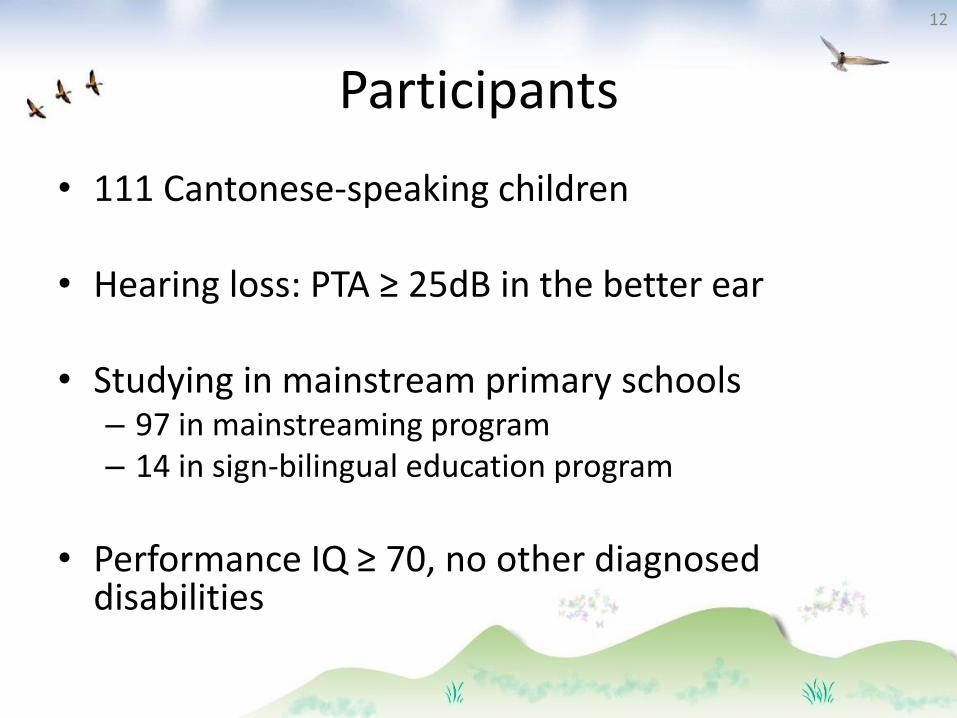
Participants
• 111 Cantonese-speaking children
• Hearing loss: PTA ≥ 25dB in the better ear
• Studying in mainstream primary schools – 97 in mainstreaming program – 14 in sign-bilingual education program
• Performance IQ ≥ 70, no other diagnosed
disabilities
12

Number of participants by groups
School Grade
Hearing Loss P1 P2 P3 P4 P5 P6 Total
mild 2 5 1 3 4 5 20
moderate 4 4 4 3 2 3 20
Mod-sev 3 5 2 2 2 5 19
severe 5 6 2 3 0 3 19
profound 13 4 5 5 1 5 33
Total 27 24 14 16 9 21 111
13

Demographics (time point 1)
14
N Age
of Diagnosis Mode of
amplification Deaf
parents program
nil HA CI sign
bilingual main-
streaming
mild 20 3;02 3 17 1 19
moderate 20 2;08 20 20
ms 19 2;09 19 1 18
severe 19 2;00 18 1 3 3 16
profound 33 1;01 9 24 3 9 24
Total 111 3 83 25 6 14 97

Measurements
1. Cantonese Lexical Neighborhood Test (CLNT) Yuen, K. C. P., Ng, I. H. Y., Luk, B. P. K., Chan, S. K. W., Chan, S. C. S., Kwok, I. C.
L. et al., (2008)
2. Cantonese tone identification test (CANTIT) Lee, K. Y. S. (2012)
3. Hong Kong Cantonese Oral Language Assessment Scale (HKCOLAS)
T’sou, B., Lee, T.H.-T., Tung, P., Man, Y., Chan, A., To, C.K.S. et al. (2006)
15

Measurements
1. Cantonese Lexical Neighborhood Test (CLNT) (Yuen, K. C. P., Ng, I. H. Y., Luk, B. P. K., Chan, S. K. W., Chan, S. C. S.,
Kwok, I. C. L. et al., 2008)
- 25 disyllabic words
- Live voice presentation
- correct recognition >>
16

Measurements
2. Cantonese tone identification test (CANTIT) (Lee, K. Y. S., 2012)
- Research version
- 75 monosyllabic words
- Stimuli were presented through computer speaker
- Scores from aided condition
17

Measurements
3. Hong Kong Cantonese Oral Language Assessment Scale (HKCOLAS)
(T’sou, B., Lee, T.H.-T., Tung, P., Man, Y., Chan, A., To, C.K.S. et al., 2006)
- Cantonese Grammar (CG)
- Textual Comprehension (TC)
- Word Definition (WD)
- Lexical-Semantic Relationship (LS)
- Story Retell (SR)
- Expressive Nominal Vocabulary (EV)
18

HKCOLAS testing procedure
• Changing the presentation mode
Audio >> Visual (to simulate the daily circumstance)
• Test instructions and test items are the same as in the original format
19
Adapted by Centre for Sign Linguistics and Deaf Studies (CSLDS)
Results
20
What is the speech perception and oral language ability of deaf children in HK?
Research Question 1
21

Presentation of scores in HKCOLAS
• Norm-referenced test
• Standard score was used
22
0

Performance in each subtest
CG
(Can. Grammar)
TC (Textual Comp.)
WD (Word Definition)
LS (Lexical-
semantic)
SR (Story Retell)
EV (Exp. Vocab.)
mild -0.59 0.03 0.02 -0.65 -1.04 0.02
moderate -0.98 -0.61 -0.36 -0.83 -0.82 -1.21
ms -1.94 -0.99 -0.31 -1.54 -1.47 -2.05
severe -2.45 -1.70 -1.21 -1.85 -2.16 -2.28
profound -2.90 -2.24 -1.30 -2.10 -2.96 -2.29
average -1.90 -1.23 -0.71 -1.47 -1.84 -1.64
*The mean is displayed in standard scores
23

Performance in each subtest CG
(Can. Grammar)
TC (Textual Comp.)
WD (Word Definition)
LS (Lexical-semantic)
SR (Story Retell)
EV (Exp. Vocab.)
mild -0.59 0.03 0.02 -0.65 -1.04 0.02
moderate -0.98 -0.61 -0.36 -0.83 -0.82 -1.21
ms -1.94 -0.99 -0.31 -1.54 -1.47 -2.05
severe -2.45 -1.70 -1.21 -1.85 -2.16 -2.28
profound -2.90 -2.24 -1.30 -2.10 -2.96 -2.29
average -1.90 -1.23 -0.71 -1.47 -1.84 -1.64
*The mean is displayed in standard scores
24

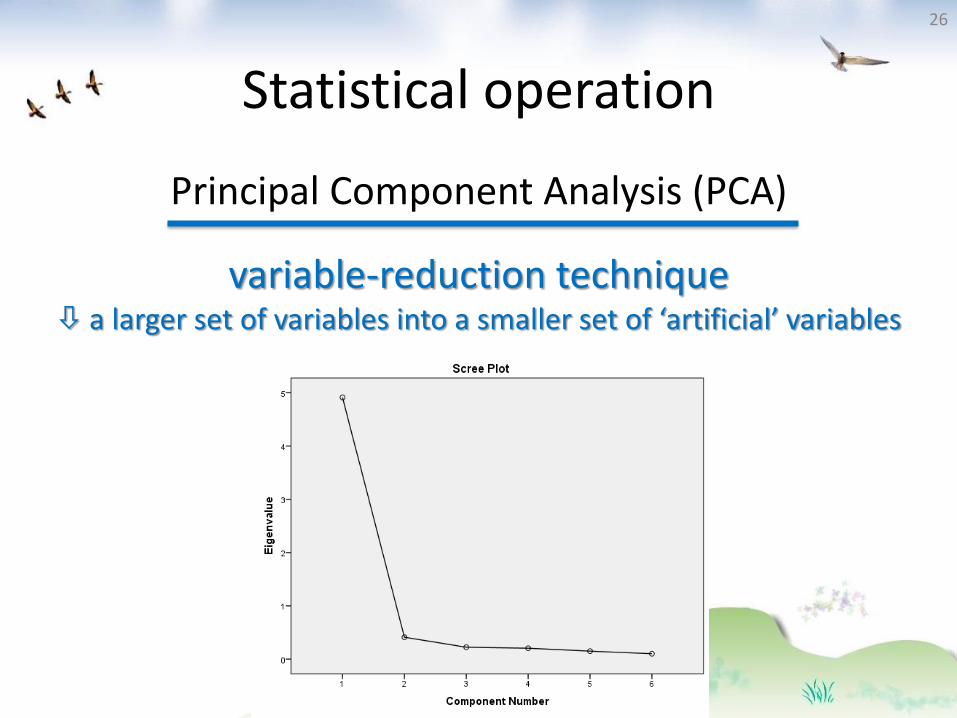
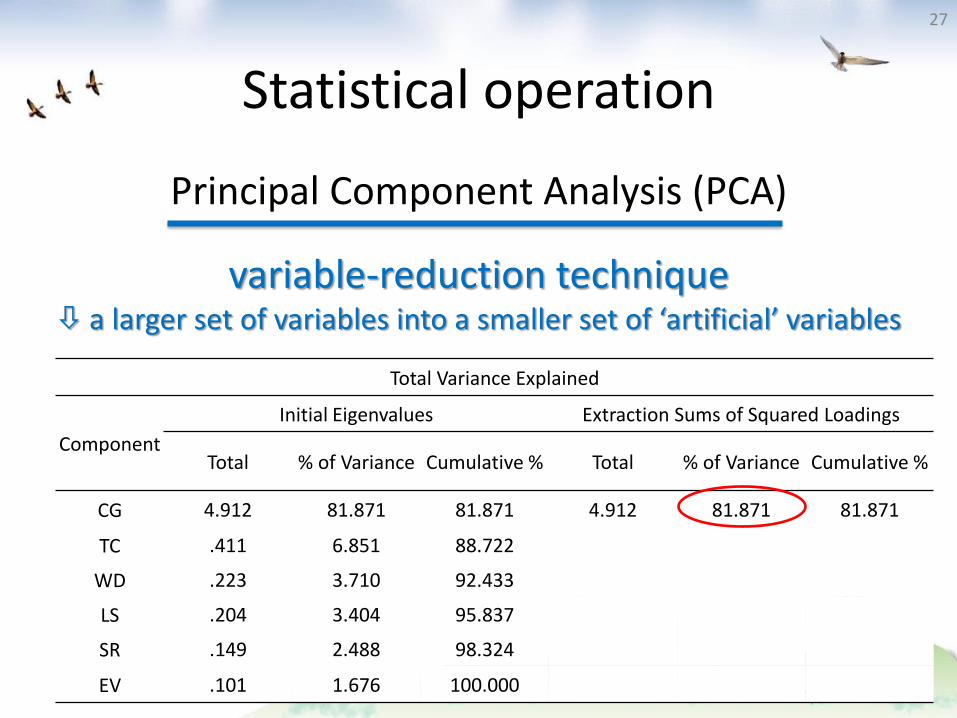
Statistical operation
Principal Component Analysis (PCA)
25
variable-reduction technique a larger set of variables into a smaller set of ‘artificial’ variables
Statistical operation
Principal Component Analysis (PCA)
26
variable-reduction technique a larger set of variables into a smaller set of ‘artificial’ variables
Statistical operation
Principal Component Analysis (PCA)
27
variable-reduction technique a larger set of variables into a smaller set of ‘artificial’ variables
Total Variance Explained
Component
Initial Eigenvalues Extraction Sums of Squared Loadings
Total % of Variance Cumulative % Total % of Variance Cumulative %
CG 4.912 81.871 81.871 4.912 81.871 81.871
TC .411 6.851 88.722
WD .223 3.710 92.433
LS .204 3.404 95.837
SR .149 2.488 98.324
EV .101 1.676 100.000

Statistical operation - PCA
28
Component
1
CG .947
TC .910
WD .805
LS .920
SR .920
EV .920

Defining Language Ability
1. Standard diagnostic criterion of HKCOLAS
29
age appropriate
39 (35%) language
delay 72 (65%)
standard score less than -1.25 in two or more subtests

Defining Language Ability
2. Cluster analysis
Two step cluster using Schwarz’s Bayesian Criterion (BIC) and Euclidean estimation
30

31
Defining Language Ability
2. Cluster Analysis
language delay
72 (65%)
age appropriate
39 (35%)
Higher language ability group
Lower language ability group

32
Language delay & low ability
52 (47%)
age appropriate & high ability
39 (35%)
Language delay but high ability
20 (18%)
Defining Language Ability
2. Cluster Analysis

OL performance in 3 Language Ability Groups
33
-4
-3
-2
-1
0
1
CG
TC
WD
LS
SR
EV
Age appropriate Mild-moderate LD Severe LD

Speech perception performance in 3 language ability groups
34
97 92
76
91
79
62
0
20
40
60
80
100
Age appropriate Mild-moderate LD Severe LD
CLNT
CANTIT

What factor(s) may better predict oral language outcome in deaf children?
Research Question 2
35

Correlation
• Dependent variable – composite score
• Independent variable – Degree of HL – With or without deaf parents – Type of hearing devices – Program type – Month of hearing diagnosis – CLNT scores – CANTIT scores
36

Correlation
• Spearman rank-order correlation
• Dependent variable: composite score
37
a dummy variable indicating which hearing aid method the deaf child was using (none, HA, CI) b measured on 5 levels of hearing loss (mild, moderate, MS, severe and profound) * p< 0.05 ** p< 0.01
Degree of
HL
Deaf parents
Type of aid (HA)a
Type of aid (CI) a
Program type
Month of HL dx CLNT CANTIT
Correlation Coefficient
-.470** -.087 .273** -.335** .307** .131 .571** .735**
Sig. (2-tailed) .000 .364 .004 .000 .001 .171 .000 .000

Multiple Regression Analysis
Variables B Std. Error b R2 change F(6,104) Collinearity
statistics (VIF)
Program -.051 .221 -.018 .486*** 16.421*** 1.278
HL -.051 .066 -.082 2.262
HAa
-.090 .415 -.042 7.723
CIa
-.034 .481 -.015 9.604
CANTIT .046 .008 .688*** 2.946
CLNT -.007 .019 -.036 2.099
38
Note. Effect was measured by VIF = variance inflation factors (VIF with values less than 10 showed that the model did not suffer from multicollinearity problems) a dummy variable indicating which hearing aid method the deaf child was using (none, HA, CI) *** p< 0.001

What is the development of oral language ability of deaf children over the time?
Research Question 3
39

Still studying in primary school
(TP2) N=55
Around 3 years later –
re-assessed N=83
Initial Ax
(TP1) N=111
Participants in time point 2
40
25% dropout

Demographics (55 participants)
41
N Age
of dx Mode of
amplification Deaf
parents program
nil HA CI sign
bilingual Main-
streaming
mild 20 8 3;02 3;03 3 17 8 1 1 19 7
moderate 20 9 2;08 2;04 20 9 20 9
ms 19 7 2;09 3;01 19 7 1 1 18 6
severe 19 11 2;00 1;03 18 11 1 3 2 3 3 16 8
profound 33 20 1;01 1;01 9 4 24 16 3 1 9 9 24 11

3 Language Ability Groups
• With reference to their composite scores at TP2, participants were categorized into respective language ability groups
42
Time Point 1 (N=55)
Time Point 2 (N=55)
Age appropriate 17 22
Mild-moderate LD 11 13
Severe LD 27 20

3 Language Ability Groups
• Individual change across language ability groups
43
Time Point 1 (N=55)
Regress (5%)
keep up (71%)
Progress (24%)
Age Appropriate (17)
1 16
Mild-moderate LD (11)
2 5 4
Severe LD (27)
18 9

Change of scores from TP1 to TP2 (Repeated Measure ANOVA)
44
CG
(Cantonese Grammar)
TC (Textual Comp.)
WD (Word
Definition)
LS (Lexical-
semantic)
SR (Story Retell)
EV (Expressive
Vocab.)
Age Appropriate (17)
TP1 0.03 0.23 0.31 -0.49 -0.10 0.12
TP2 0.21 0.44 0.37 0.15 0.05 0.24
Mild-moderate LD (11)
TP1 -1.59 -1.06 -0.44 -1.24 -1.47 -1.01
TP2 -1.21 -0.10 0.06 -1.32 -1.35 -0.50
Severe LD (27)
TP1 -3.62 -2.68 -1.77 -2.48 -3.63 -3.10
TP2 -3.02 -1.93 -1.42 -2.26 -3.45 -3.01

Change of scores from TP1 to TP2 (Repeated Measure ANOVA)
45
CG *
(Cantonese Grammar)
TC ** (Textual Comp.)
WD (Word
Definition)
LS (Lexical-
semantic)
SR (Story Retell)
EV (Expressive
Vocab.)
Age Appropriate (17)
TP1 0.03 0.23 0.31 -0.49 -0.10 0.12
TP2 0.21 0.44 0.37 0.15 0.05 0.24
Mild-moderate LD (11)
TP1 -1.59 -1.06 -0.44 -1.24 -1.47 -1.01
TP2 -1.21 -0.10 0.06 -1.32 -1.35 -0.50
Severe LD (27)
TP1 -3.62 -2.68 -1.77 -2.48 -3.63 -3.10
TP2 -3.02 -1.93 -1.42 -2.26 -3.45 -3.01
* p< 0.05 ** p< 0.01

46

Conclusions
• Align with some previous findings, the performance of deaf children is behind the level of children with normal hearing in general (Blamey et al., 1998; Wake et al., 2004;
Fitzpatric et al., 2011)
• Performed poorer in:
– CG > SR > EV > LS > TC > WD
• Three language groups:
– Age appropriate: 35%
– Mild-moderate LD: 18%
– Severe LD: 47%
47
65%

Conclusions
• Among the various predictors, tone perception was significantly correlated with oral language outcome (48.6% of variance)
– Degree of HL
– With or without deaf parents
– Type of hearing devices
– Program type
– Month of hearing diagnosis
– CLNT scores
– CANTIT scores
48

Conclusions
• Oral Language performance after 3 years time:
– Age appropriate (40%)
– Mild-moderate language delay (24%)
– Severe language delay (36%)
• Significant improvement was seen in Cantonese Grammar and Textual Comprehension.
• What factors contribute to the improvement is left to be answered.
49
60%

References • Bench, J., Doyle, J. & Greenwood, K.M. 1987. A standardization of the BKB/A Sentence Test for children in comparison with the NALCID
Sentence Test and CAL-PBM Word Test. Australian Journal of Audiology, 9, 39-48.
• Blamey P., Sarant J., Serry T., Wales R., James C. & Barry J. (1998). Speech Perception and Spoken Language in Children with Impaired Hearing. ICSLP, 98, 2615-2618.
• Blamey P.J., Sarant, J.Z., Paatsch, L.E., Barry, J.G., Bow, C.P., Wales, R.J. (2001). Relationships Among Speech Perception, Production, Language, Hearing Loss, and Age in Children with Impaired Hearing. Journal of Speech, Language, and Hearing Research, 44, 264-285.
• Blamey P. & Sarant J. (2002). Speech Perception and Language Criteria for Paediatric Cochlear Implant Candidature. Audiology & Neurotology, 7, 2, 114-121.
• Blamey, P. J. (2003). Development of spoken language by deaf children. In M. Marschark, & P. E. Spencer (Ed.), Oxford handbook of deaf studies, language, and education (pp. 232-246). New York: Oxford University Press
• Delage, H., & Tuller, L. (2007). Language development and mild-to-moderate hearing loss: Does language normalize with age? Journal of Speech, Language, and Hearing Research, 50, 1300-1313.
• DesJardin J.L., Ambrose, S.E. Martinez A.S., & Eisenberg L.S. (2009). Relationships between Speech Perception Abilities and Spoken Language Skills in Young Children with Hearing Loss. International Journal of Audiology, 48, 248-259.
• Fitzpatrick E.M., Crawford L. Ni A. & Durieux-Smith A. (2011). A Descriptive Analysis of Language and Speech Skills in 4- to 6-Yr-Old Children with Hearing Loss. Ear & Hearing, 32, 605-616.
• Geers, A. E., Nicholas, J. G., & Sedey, A. L. (2003). Language skills of children with early cochlear implantation. Ear & Hearing, 24(1S), 46S-58S
• Geers (2006) Factors Influencing Spoken Language Outcomes in Children following Early Cochlear Implantation. Adv Otorhinolaryngol, 64, 50-65.
• Geers, A., Tobey, E., Moog, J., & Brenner, C. (2008). Long-term outcomes of cochlear implantation in the preschool years: From elementary grades to high school. International Journal of Audiology, 47(Suppl. 2), S21-S30.
• Hayes, H., Geers, A. E., Treiman, R., & Moog, J. S. (2009). Receptive vocabulary development in deaf children with cochlear implants: Achievement in an intensive auditory-oral educational setting. Ear & Hearing, 30(1), 128-135.
• Lee, K.Y.S., Sung, N.C. & van Hasselt, C.A. (2002). Tone Perception Ability of Cantonese-Speaking Children. Language and Speech, 45, 387-406.
• Lee & van Hasselt (2004) Long-term outcome on Spoken Word Recognition Ability of Young Children with Cochlear Implants. International Congress Series, 1273, 300-303.
• Lee, K. Y. S. (2012). Cantonese Tone Identification Test
50

References • Leigh, G. (2008). Changing parameters in deafness and deaf education. In M. Marschark, & P. C. Hauser (Eds.), Deaf
cognition: Foundations and Outcome (pp. 24-51). New York: Oxford University Press, Inc. • Meinzen-Derr, J., Wiley, S., & Choo, D. I. (2011). Impact of early intervention on expressive and receptive language
development among young children with permanent hearing loss. American Annals of the Deaf, 155(5), 580-591. • Moog, J. S., & St Louis, M. (2002). Changing expectations for children with cochlear implants. The Annals of Otology,
Rhinology and Laryngology, 111(5), 138-142. • Nicholas, J. G., & Geers, A. E. (2007). Will they catch up? The role of age at cochlear implantation in the spoken language
development of children with severe to profound hearing loss. Journal of Speech, Language, and Hearing Research, 50, 1048-1062.
• Nikolopoulos, T. P., Dyar, D., Archbold, S., & O'Donoghue, G. M. (2004). Development of spoken language grammar following cochlear implantation in prelingually deaf children. Archives of Otolaryngology- Head & Neck Surgery, 130, 629-633.
• Niparko, J. K., Tobey, E. A., Thal, D. J., Eisenberg, L. S., Wang, N., Quittner, A. L., & Fink, N. E. (2010). Spoken language development in children following cochlear implantation. JAMA: Journal of American Medical Association, 303(15), 1498-1506.
• Pisoni (2004) Speech Perception in Deaf Children with Cochlear Implants. From Sound to Sense, June 11-June 13, B133-B147. • Sininger (2010) Auditory Development in Early Amplified Children: Factors Influencing Auditory-Based Communication
Outcomes in Children with Hearing Loss. Ear & Hearing, 31, 2, 166-185. • Svirsky, M. A., Robbins, A. M., Kirk, K. I., Pisoni, D. B., & Miyamoto, R. T. (2000). Language development in profoundly deaf
children with cochlear implants. Psychological Science, 11(2), 153-158. • Svirsky, M. A., Teoh, S., & Neuburger, H. (2004). Development of language and speech perception in congenitally, profoundly
deaf children as a function of age at cochlear implantation. Audiology & Neuro-Otology, 9, 224-233. • T’sou, B., Lee, T.H.-T., Tung, P., Man, Y., Chan, A., To, C.K.S. et al. (2006). Hong Kong Cantonese Oral Language Assessment
Scale • Wake, M., Hughes, E.K., Poulakis, Z., Collins, C. & Rickards, F.W. (2004). Outcomes of Children with Mild-Profound Congenital
hearing Loss at 7 to 8 years: A Population Study. Ear & Hearing, 25, 1-8. • Yoshinaga-Itano et al. (1998) Language of Early- and Later-identified Children with Hearing Loss. Pediatrics, 102, 5, 1161-
1171. • Yuen, K. C. P., Ng, I. H. Y., Luk, B. P. K., Chan, S. K. W., Chan, S. C. S., Kwok, I. C. L. et al., (2008). Cantonese Lexical
Neighborhood Test.
51

Thank You!
52
Centre for Sign Linguistics and Deaf Studies (CSLDS) http://www.cuhk.edu.hk/cslds/jcslco/
Tel: 3943 1135 Fax: 3943 1136