can’t get there from here
TRANSCRIPT

The Declining Independent Mobilityof California’s Children and Youth
A Joint Project of:
Surface Transportation Policy Project,
Transportation and Land Use Coalition
and Latino Issues Forum
SEPTEMBER 2003
Can’t Get There From Here
The Surface Transportation Policy Project (STPP) is a national coalition of more than 200 organ-izations working to promote transportation policies that protect neighborhoods, provide bettertravel choices and promote social equity. STPP has offices in San Francisco, Sacramento,Albuquerque, NM, Pittsburgh, PA, and Washington, D.C. For more information about STPP, pleasevisit http://www.transact.org/ca/.
The Transportation and Land Use Coalition (TALC) is a partnership of over 90 Bay Area groupsworking to promote transportation choices, affordable housing and healthy, walkable communities.We work together to analyze policies and spending priorities, develop alternative proposals, andspearhead grassroots campaigns. For more information on TALC please visit http://www.transcoali-tion.org.
Latino Issues Forum (LIF) is a non-profit public policy and advocacy institute dedicated toadvancing new and innovative public policy solutions for a better, more equitable and prosperoussociety. LIF addresses public policy issues from the perspective of how they will affect the socialand economic future of the Latino community. LIF also serves as a clearinghouse to assist and pro-vide the news media with accurate information and sources in the Latino community for fair andeffective coverage of issues. For more information about LIF, please visit http://www.lif.org.
Copyright 2003 by the Surface Transportation Policy Project
Readers may quote from, copy and distribute this work for educational purposes as long as thecopyright holder and the Surface Transportation Policy Project are properly acknowledged and theoriginal work is not altered. Any reproduction or transmittal of any part of this publication forother purposes in any form or by any means, electronic or mechanical, including photocopy,recording, or any information storage and retrieval systems, requires the written permission of theSurface Transportation Policy Project.
Report designed by Cissy Russell (910) 397-9333
Cover and intro page photo courtesy of Los Angeles Times
Chapter header photos courtesy of www.pedbikeimages.org/Dan Burden, except page 6 courtesy of Los Angeles Times.
Acknowledgements .................................................................................................v
Foreword ..............................................................................................................vi
Executive Summary ............................................................................................viii
How California’s Children Get Around ................................................................2
Today’s Kids Depend Heavily on Cars.........................................................................2
Who Walks and Who Drives .......................................................................................4
Factors Behind Children’s Growing Dependence on Driving ............................6
Sprawling Neighborhoods Make Walking Difficult ....................................................6
Pedestrian Safety Neglected.........................................................................................7
School Sprawl Limits Kids’ Ability to Walk or Bike to Class ......................................7
Low-Density Neighborhood Design Makes Transit Inconvenient ...........................10
School Bus Service Cuts Boost Car-Dependence.......................................................12
Additional Factors That Discourage Walking and Biking.........................................15
The Costs of Car-Dependence ...................................................................................15
These Streets Weren’t Made For Walking...........................................................19
Child Pedestrians Face Heightened Risk from Traffic Dangers.................................19
The Cost of Pedestrian Accidents..............................................................................24
Stranger Danger Limits Walking and Biking.............................................................26
California’s Lack of Transportation Options
Harms the Health of Children ............................................................................30
Less Physical Activity, More Overweight Kids ..........................................................30
Asthma and Air Pollution on the Rise ......................................................................34
Lack of Travel Options Slows Cognitive Development ............................................37
Policy Recommendations .....................................................................................39
Definition of Terms Used in this Report ............................................................44
Endnotes.................................................................................................................46
Methodology ..........................................................................................................61
Appendices .............................................................................................................64
References .............................................................................................................75
T A B L E O F C O N T E N T S
CAN’T GET THERE FROM HERE The Declining Independent Mobility of California’s Children and Youth
iii
T A B L E S A N D F I G U R E S
REPORT:
Table 1: How Children Get Around in California (Ages 0-17) ..............................................................3Table 2: How Children of Different Racial & Ethnic Groups Get Around in
California (Ages 0-17)......................................................................................................................4Table 3: Barriers to Walking & Biking to School (1999 HealthStyles Survey) .......................................7Table 4A: California Children’s Transit Usage by Race & Ethnicity (Ages 0-17).................................11Table 4B: California Children’s Transit Usage by Household Income (Ages 0-17) .............................11Table 5: U.S. Deaths & Injuries Sustained During School Commute Trips (1991-1999) ....................15Table 6: Expenditures on Children (Ages 0-17) by Families in the Urban West (2001) .....................17Table 7: Top 10 Causes of Accidental Death and Injury Among Children Aged 0-17 in
California (1995-2000) ..................................................................................................................20Table 8: California Counties with the Highest Percentage of Traffic Accidents
Involving Child Pedestrians (2001) ..............................................................................................22Table 9: Deaths & Injuries Among Child Pedestrians in California
by Race/Ethnicity (1995-2000)......................................................................................................23Table 10A: Total Cost of Non-Fatal Injuries Sustained in Collisions by Persons Aged 0-17
in California (2001).......................................................................................................................25Table 10B: Total Cost of Fatal Injuries Sustained in Collisions by Persons Aged 0-17
in California (2001).......................................................................................................................25Table 11: Reported Missing, Abducted & Runaway Children in California (1995-2001) ...................27Table 12: Motor Vehicle Accidents vs. Witnessed Stranger Abductions
in California (1995-2000)..............................................................................................................29Table 13: Overweight and At Risk Teenagers by Race/Ethnicity in California (2000) ........................32Table 14: Lifetime Asthma Prevalence Among Children Aged 0-17 by Race/Ethnicity
in California (2001).......................................................................................................................35Table 15: Ozone and PM-10 Pollution in California Air Basins (2000-2001)......................................38
Figure 1: U.S. and California School Bus Ridership (1985-2001) ........................................................13Figure 2: How American Families Spend Each Dollar (2001) ..............................................................16Figure 3: Transportation Expenditures by Families..............................................................................16Figure 4: Reasons U.S. Children Do Not Walk to School (2002 Survey Results).................................26
APPENDICES:
Table 16: Children’s Demographics in California (2000) ....................................................................64Table 17: California Children Aged 0-17 by Race/Ethnicity (2002) ....................................................65Table 18: Poverty Among California Children Aged 0-17 (1999)........................................................65Table 19: Percentage of California Children Under Age 18 with a Driver’s License (2003) ...............66Table 20: Percentage of Public K-12 Students Who Ride School Buses by State
(1997-1998 School Year) ...............................................................................................................67Table 21: Child Pedestrian-Vehicle Collisions by County (2001) .......................................................68Table 22: Motor Vehicle Accidents vs. Abductions in California (1995-2000) ...................................69Table 23: Prevalence of Overweight Among California Teens Aged 12-17 by County (2001) ...........71Table 24: Results of the 2002 California Physical Fitness Test by County..........................................72Table 25: Percentage of California Children Aged 0-17 Diagnosed with Asthma (2001)...................74
Population maps ..................................................................................................................................79
iv
Can’t Get There From Here: The Declining
Independent Mobility of California’s Children
and Youth is a joint project of the Surface
Transportation Policy Project, the Transportation
and Land Use Coalition and Latino Issues Forum.
It was written and developed by John Doxey, Tam
Tran, Kristi Kimball, James Corless and Miles
Mercer of STPP’s San Francisco office, with editori-
al, analytical and research assistance from Luis
Arteaga, Stuart Cohen, Matthew Davis, Liz Garcia,
Michelle Ernst and Cynthia Powell.
For their valuable insights, information, data
analysis and thoughtful comments, the authors
would like to thank: Bob Austin of the California
Department of Education’s Office of School
Transportation, Mike Buhler of the National Trust
for Historic Preservation, Jim Bush of the
California Department of Education’s School
Facilities Planning Division, Francisco Estrada of
the Mexican American Legal Defense and
Educational Fund, Shirley Goins of the National
Center for Missing and Exploited Children, Ellen
Greenberg of the Congress for the New Urbanism,
Sandra Hamm of the Centers for Disease Control
& Prevention, Dr. Kenneth Lee Jones of the
University of California at San Diego and
Children’s Hospital of San Diego, Tom Jones and
Julie Spezia of California Futures Network, Ron
Kinney of Laidlaw Education Services, Chris N.
Morfas of the California Bicycle Coalition, Mary
Nystrom of the California Air Resources Board,
Renne Robin of the Children’s Environmental
Health Network, Anne Seeley of the California
Department of Health Services and the University
of California at San Francisco, Catherine Staunton
of the Centers for Disease Control & Prevention,
Gail Woodward-Lopez of the Center for Weight
and Health at the University of California at
Berkeley and Paul Zykofsky of the Local
Government Commission.
In addition, the authors would like to recog-
nize the California Department of Transportation,
which performed, upon request from the Surface
Transportation Policy Project, a special run of the
2000-2001 California Statewide Household Travel
Survey data that provided unique and invaluable
information about children’s travel patterns in
California. Statewide data compiled by Caltrans
and pertaining specifically to trips made by chil-
dren has never been reported or published until
now. Several members of Caltrans’ Statewide
Travel Analysis Branch, including Ayalew Adamu,
Azita Fatemi, Greg A. Miyata, Martha Tate Glass
and David Saia, deserve extra thanks for the time
and effort they spent analyzing data and answer-
ing the authors’ numerous questions.
The authors would also like to thank Monique
A. Sheppard and Dexter Maurice Taylor of the
Pacific Institute for Research & Evaluation’s
Children’s Safety Network: Economics and Data
Analysis Resource Center for their analysis of the
costs associated with accidents involving child
pedestrians in California. Mark Lino of the U.S.
Department of Agriculture also deserves special
recognition for his analysis of families’ expendi-
tures on children in the American West.
A C K N O W L E D G E M E N T S
v
It’s every teen’s fantasy to drive past a friend’s
house honking the car horn, waving and grin-
ning, celebrating a new-found “freedom” —
the driver’s license. Teens talk about it, dream
about it, and count the days until they sit alone
behind the wheel. It’s true, I know, because I was
one of them. Annoyed at the hassle of riding a
bicycle home from school and arranging my own
carpool rides, I was ten going on sixteen.
In junior high and the early years of high
school, I rode my bike home from school every
day because my parents’ work schedule made it
impossible for them to pick me up. Although I
lived only two miles from campus, the journey
home was always challenging. Many roads in
Orangevale are not built for bikers and pedestri-
ans, and a number lack any real sidewalk or
shoulder. I often struggled to stay in the designat-
ed “bike lane,” a strip of asphalt barely wider
than my handlebars. Trash day was often the
most traumatic day of the week, as I took a risk
each time I was forced into the road to avoid hit-
ting a can.
Because the roads were so unsafe, I was one of
the few students at my school who commuted by
bike. The majority of students stood in front of
the school at the end of the day, waiting for par-
ents to make their way through the traffic jam in
the school parking lot. While about a thousand
cars moved in and out of the parking lot daily, the
bike racks and school buses were nearly empty.
Every time I rode my bike to school I was
wishing I could drive instead. At the end of my
junior year, a few months after I turned 16 and
got my driver’s license, my parents gave me a car
as a gift. I drove home from school the day I got
it, and my biking days were temporarily over. I
drove my car to and from work that summer, and
I was able to make shopping trips on my own. I
felt so liberated.
But now that I’ve had a license for almost two
years, my perspective on driving is entirely differ-
ent. Gas is increasingly expensive, traffic is never
fun and accidents are always waiting to happen.
Driving has come to seem anything but liberating.
I first started to realize this during that first
summer after I got my car. I spent a lot of time
in traffic jams on the way to work, and I was
spending a lot of money on gas. Although I still
felt liberated, I learned quickly that driving is not
much fun.
I’ve also become more aware of the negative
effects driving is having on the health and atti-
tudes of children and teens. In my job as a camp
A State of Mind
F O R E W O R D
vi
counselor last summer, I worked every day with
kids who would rather perfect their Nintendo
skills than practice a new sport, and I began to
realize that our society’s focus on car travel is
contributing to an epidemic of laziness and
dependence among children.
Many kids I know would rather sit around and
wait for a ride than to expend the energy to walk.
This lack of physical activity, combined with the
poor nutrition many kids get, is causing more
and more children to be overweight and out of
shape.
Children would be better off if they traveled
by car less and could walk or bike to more of
their destinations. But before this happens, our
society will have to change its car-focused state of
mind. Kids will continue to rely on cars to get
around until traffic engineers make pedestrian
safety a higher priority and streets become safer
to travel by foot or bike. And kids will remain
reluctant to walk until communities start control-
ling the sprawl which often makes trip distances
too long to walk.
If streets and communities are designed with
pedestrians and bicyclists in mind, many more
kids will choose to walk and bike - in part because
they want to. If that happens, teens could do
something more meaningful and productive than
fantasize about becoming a licensed driver.
BY AMANDA JOHNSON
Eighteen-year-old Amanda Johnson grew up and
attended school in Orangevale, a Sacramento suburb.
She graduated from high school in June 2002 and
now attends Stanford University.
vii
CAN’T GET THERE FROM HERE The Declining Independent Mobility of California’s Children and Youth
Ask any old-time Californian about his or
her childhood, and you’ll most likely hear
stories about walking to school, running
to a corner grocery store or bicycling over to a
friend’s house. Walking and biking were a part of
everyday life, he or she will tell you, and kids
were able to get around on their own most of the
time.
How times have changed. Unlike the children
of earlier generations, who as recently as the
1960s still traveled to school by foot or bike in
majority numbers, today’s kids depend on rides
from mom or dad to get almost everywhere they
need or want to go. Survey data from the
California Department of Transportation — pub-
lished for the first time in this report — show
that California children now make about three-
quarters of all their trips in automobiles, while
walking and bicycling now account for just 16
percent of children’s trips. National surveys con-
firm that driving has become the dominant mode
of travel for children, even when trip distances
are short.
Sprawl Reduces Children’s MobilityMuch of the decline in walking and biking
can be attributed to changes in land use and
community design. Many of California’s children
now live in sprawling, automobile-oriented
neighborhoods, built in recent decades, where it
is neither safe nor convenient to travel by foot or
bicycle. Not only does the housing-only zoning
so often found in these places separate children’s
homes from schools and commercial areas, but
the cul-de-sacs and curvy streets that characterize
many suburban and exurban communities stretch
the distances of many trips beyond easy walking
range.
The low-density layout of many newer com-
munities also limits the efficiency and appeal of
public transit, one of the few sources of inde-
pendent mobility available to children other than
walking and riding a bike.
Moreover, the landscape of subdivisions, park-
ing lots, strip malls and wide streets that typifies
California’s newer communities often contains
few of the amenities — such as sidewalks, cross-
walks and bike lanes — that make it safer and eas-
ier to walk or ride a bike. Indeed, this design bet-
ter suits the type of high-speed vehicular traffic
that is most lethal for pedestrians and bicyclists.
Statistics collected by the California Highway
Patrol show that, in areas characterized by rapid,
sprawling growth, a disproportionately high
number of child pedestrians are killed and injured
in traffic accidents.
Traffic Hazards Curtail Walking andBiking
Although children are taught to “look both
ways” before crossing the street almost as soon as
they can walk, that instruction fails to protect
E X E C U T I V E S U M M A R Y
viii
them from the dangers posed by fast-moving traf-
fic, busy streets and aggressive drivers. This report
finds that California’s children are disproportion-
ately represented as victims of pedestrian-vehicle
crashes, largely because they still rely more heavi-
ly than adults on walking and biking to get
around and are therefore exposed more frequent-
ly to the dangers of the street.
In 2001, children were involved in more
than one-third of all pedestrian-vehicle colli-
sions in California, though they accounted for
just over one-quarter of the state’s total popula-
tion. As a result, pedestrian collisions now rank
among the leading causes of death and hospital-
ized injury for children. Particularly vulnerable
are minority children and children from low-
income households, who make a higher per-
centage of their trips on foot and are more like-
ly than other children to be hurt in pedestrian-
vehicle accidents.
Faced with these numbers, many of today’s
parents feel compelled to chauffeur their kids to
almost all their activities, even when distances are
short. Indeed, so many parents now drive their
kids to school that home-to-school trips account
for as much as 21 percent of all trips during the
morning peak commute period in some
California communities.
However, this increase in child shuttling has
boosted traffic levels around schools, making it
even more perilous for kids to travel to class by
foot or bike. In many cases, the children who still
walk or bike to school come from low-income
households and do not have access to car rides.
Fear of Abduction and Other BarriersFurther limiting children’s independent mobil-
ity is the fear of violent crime, which has been
heightened in recent years by a series of highly
publicized child abductions. As a result, many
parents would rather play chauffeur than permit
their children to travel around by themselves and
risk the possibility that they could be abducted by
strangers. But this response has its own safety
drawbacks: while a total of 364 children are
known to have been abducted by strangers in
California between 1995 and 2000, more than
17,000 California children were killed or badly
injured while riding in automobiles.
At the same time, children’s reliance on cars
has been intensified by cutbacks in school bus
service. Facing chronic budget shortages, school
districts throughout the state have been trimming
routes and raising or imposing fees for bus serv-
ice. These moves help explain why California
now has the nation’s lowest school bus ridership
rate.
When school bus service is unavailable, some
parents are left with no alternative but to drive
their kids to school, particularly when schools are
located far from children’s homes. And this is
increasingly the case. Due largely to school siting
guidelines adopted by the California Department
of Education and state funding policies that dis-
courage construction or rehabilitation of schools
in existing neighborhoods, new schools are
increasingly being built on undeveloped lands far
from the neighborhoods where students live.
All this child-shuttling places a heavy financial
burden on families, especially low-income house-
holds whose average wages have not kept up in
real terms with rises in transportation expenses.
In metropolitan regions of the American West,
two-parent families now spend more than twice
as much on children’s transportation as they do
on children’s health care. Moreover, the rise of
the taxi-parent has coincided with a diminished
quality of life for many families, as parents and
children both spend more time in cars and less
time at more rewarding activities.
ix
CAN’T GET THERE FROM HERE The Declining Independent Mobility of California’s Children and Youth
Lack of Transportation Options HarmsChildren’s Health
Although traveling on foot can be deadly, not
walking contributes to another type of health
hazard for children. The percentage of children
who are overweight and out-of-shape has reached
epidemic levels in recent decades, as the amount
of walking and other physical activity children
engage in has tailed off. Recent surveys have
found that between one-quarter and one-third of
California’s children are either overweight or at
risk of becoming so. At the same time, the preva-
lence of type 2 diabetes, high blood pressure and
other debilitating weight- and fitness-related dis-
eases is soaring among the state’s children.
The decline in transportation alternatives has
also contributed to a dramatic rise in childhood
asthma, a disease aggravated by air pollutants
such as ozone and particulate matter that are
largely generated by motor vehicle emissions. The
number of children diagnosed with asthma has
jumped 160 percent in California since 1980, and
asthma attacks are now the number one cause of
children’s emergency hospital visits.
Policy RecommendationsPresented with this evidence, it is apparent
that, as currently designed, California’s trans-
portation network is failing the state’s youngest
and most dependent residents. Exacerbated by
recent trends in land use and neighborhood
design, the dwindling availability of transporta-
tion choices has not only robbed children of the
independence and mobility that previous genera-
tions enjoyed, but has also contributed to an epi-
demic of life-threatening health problems.
Making matters worse, transportation planners
and elected officials have largely overlooked the
needs of children, as evidenced by the fact that
there is little available data from state officials,
transit agencies and metropolitan planning
organizations regarding the travel patterns and
mobility needs of children.
In conclusion, this report suggests new poli-
cies and investments that can make California’s
cities, towns and suburbs safer and more conven-
ient for walking, bicycling and transit — changes
that would benefit both the health and mobility
of children. The report’s recommendations, which
are covered in more detail in Chapter Five,
include:
• Prioritizing Safe Walking and Bicycling
Routes for Kids
• Promoting and Funding Safe Routes to
Schools Programs
• Building Child-Friendly Neighborhoods
• Removing Regulatory Barriers that
Discourage Neighborhood Schools
• Making School Bus Service a Higher Priority
• Prioritizing Funding for Transportation
Projects that Improve Air Quality
• Collecting Better Data on Children’s Travel
Patterns
• Involving Youth in Transportation Decision-
Making
• Providing Free and Discounted Public Transit
Passes For Children
x
CAN’T GET THERE FROM HERE The Declining Independent Mobility of California’s Children and Youth
CAN’T GET THERE FROM HERE The Declining Independent Mobility of California’s Children and Youth
The Declining Independent Mobilityof California’s Children and Youth
Can’t Get ThereFrom Here
Like many children growing up in California
today, 15-year-old Scott feels trapped and
isolated when his parents aren’t available,
or aren’t willing, to drive him places. “I feel
enclosed in my own neighborhood. It’s very frus-
trating,” says Scott, who lives in the rural out-
skirts of Salinas. Most of the places Scott likes to
go during his free time are too far apart or too far
from his home to get there on foot or by riding a
bicycle, and he seldom uses public buses to get
around because service is limited and inconven-
ient in his low-density neighborhood. “I have to
get my parents to give me a ride,” he says. “I
can’t wait until I’m old enough to drive because
then I’ll be able to go wherever I want.”
Daniel, a 15-year-old from Fresno, also equates
freedom with having a driver’s license. “I’m sick
of having to wait for my mom to give me a ride
and waiting to get picked up after school,” he
says. Ever since his parents divorced and his
mother moved with him to a new subdivision
that forms part of the city’s northward sprawl,
Daniel has relied on his mother to drive him
almost everywhere — to school, afterschool activ-
ities and weekend destinations. “Walking is really
difficult around here because things are so spread
out,” he says. “Plus my mother doesn’t really
want me walking around much because the
streets are full of traffic.”
Today’s Kids Depend Heavily on CarsYou can hear similar stories almost everywhere
you go in California. Unlike the children of earli-
er generations who regularly commuted to
school, ran errands or visited friends’ homes by
foot or bicycle, today’s children rely on other
people to drive them almost everywhere they
need or want to go. According to a recent survey
by the California Department of Transportation
(Caltrans),* children under the age of 18 now
make almost three-quarters (74 percent) of all
their trips in private vehicles, either as passengers
or drivers.1
Caltrans survey data also show that walking
How California’s Children Get Around
C H A P T E R 1
2
* The California Department of Transportation’s 2000-2001 California Statewide Household Travel Survey was conductedbetween October 2000 and December 2001. The survey reflects responses from 17,040 households with a total of 8,582children under the age of 18. Households and children from each of the state’s 58 counties participated in the survey. AllCaltrans children’s data included in this report refers to “unlinked” trips. The 2000-2001 California Statewide HouseholdTravel Survey is available online at http://www.dot.ca.gov/hq/tsip/TSIPPDF/2000_Household_Survey.pdf. For more informa-tion on the Caltrans survey data used in this report, please see this report’s methodology section.
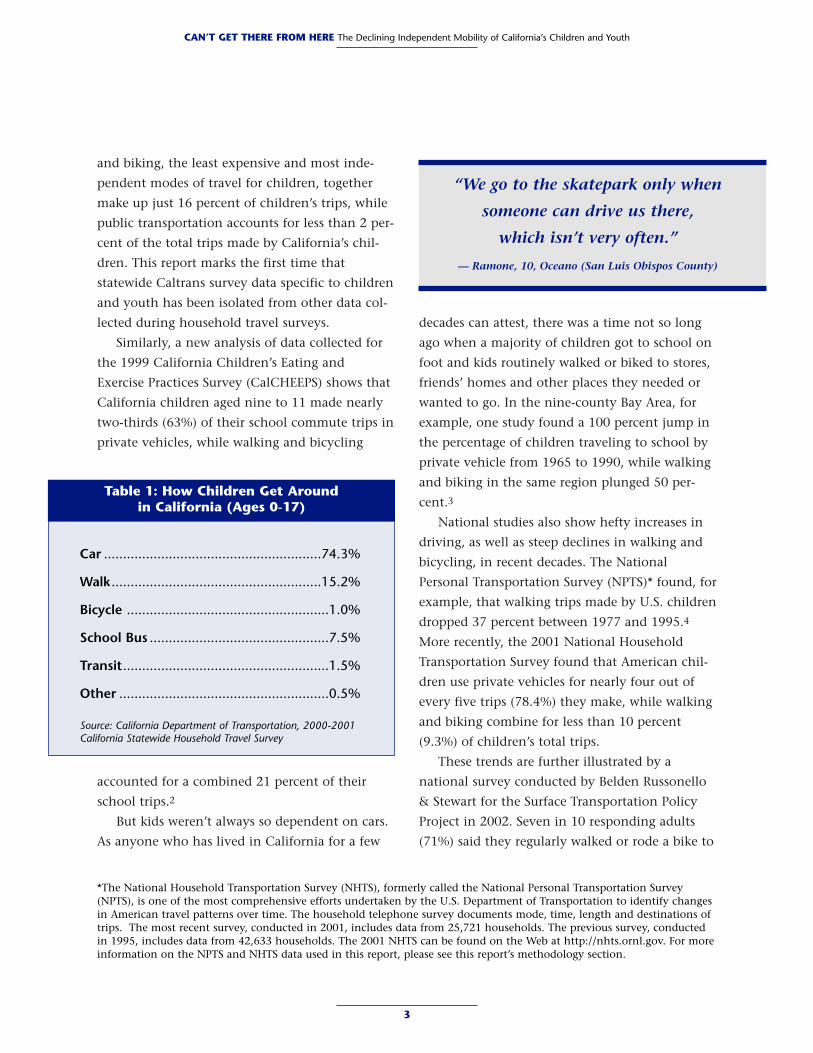
and biking, the least expensive and most inde-
pendent modes of travel for children, together
make up just 16 percent of children’s trips, while
public transportation accounts for less than 2 per-
cent of the total trips made by California’s chil-
dren. This report marks the first time that
statewide Caltrans survey data specific to children
and youth has been isolated from other data col-
lected during household travel surveys.
Similarly, a new analysis of data collected for
the 1999 California Children’s Eating and
Exercise Practices Survey (CalCHEEPS) shows that
California children aged nine to 11 made nearly
two-thirds (63%) of their school commute trips in
private vehicles, while walking and bicycling
accounted for a combined 21 percent of their
school trips.2
But kids weren’t always so dependent on cars.
As anyone who has lived in California for a few
decades can attest, there was a time not so long
ago when a majority of children got to school on
foot and kids routinely walked or biked to stores,
friends’ homes and other places they needed or
wanted to go. In the nine-county Bay Area, for
example, one study found a 100 percent jump in
the percentage of children traveling to school by
private vehicle from 1965 to 1990, while walking
and biking in the same region plunged 50 per-
cent.3
National studies also show hefty increases in
driving, as well as steep declines in walking and
bicycling, in recent decades. The National
Personal Transportation Survey (NPTS)* found, for
example, that walking trips made by U.S. children
dropped 37 percent between 1977 and 1995.4
More recently, the 2001 National Household
Transportation Survey found that American chil-
dren use private vehicles for nearly four out of
every five trips (78.4%) they make, while walking
and biking combine for less than 10 percent
(9.3%) of children’s total trips.
These trends are further illustrated by a
national survey conducted by Belden Russonello
& Stewart for the Surface Transportation Policy
Project in 2002. Seven in 10 responding adults
(71%) said they regularly walked or rode a bike to
3
CAN’T GET THERE FROM HERE The Declining Independent Mobility of California’s Children and Youth
Table 1: How Children Get Around in California (Ages 0-17)
Car .........................................................74.3%
Walk .......................................................15.2%
Bicycle .....................................................1.0%
School Bus ...............................................7.5%
Transit......................................................1.5%
Other .......................................................0.5%
Source: California Department of Transportation, 2000-2001California Statewide Household Travel Survey
“We go to the skatepark only when
someone can drive us there,
which isn’t very often.”
— Ramone, 10, Oceano (San Luis Obispos County)
*The National Household Transportation Survey (NHTS), formerly called the National Personal Transportation Survey(NPTS), is one of the most comprehensive efforts undertaken by the U.S. Department of Transportation to identify changesin American travel patterns over time. The household telephone survey documents mode, time, length and destinations oftrips. The most recent survey, conducted in 2001, includes data from 25,721 households. The previous survey, conductedin 1995, includes data from 42,633 households. The 2001 NHTS can be found on the Web at http://nhts.ornl.gov. For moreinformation on the NPTS and NHTS data used in this report, please see this report’s methodology section.
school when they were children, but just 22 per-
cent of the poll’s respondents said their children
walk or bike to class even occasionally.5
Indeed, so many parents now shuttle their
children to school that traffic jams have become
a common sight around schools, and in many
regions the home-to-school commute accounts
for a sizeable share of morning rush-hour traffic.
In the San Francisco Bay Area, one study found
the school commute is now responsible for about
10 percent of all vehicle trips on weekday morn-
ings.6 Even more striking, the Marin County
Congestion Management District recently report-
ed that “school trips account for 21 percent of all
trips in the morning commute, creating much of
the peak period congestion” in Marin County.7
All this driving has, in fact, contributed to the
declines in walking and bicycling. As more and
more parents chauffeur their children to school,
the volume of traffic near schools has risen dra-
matically and school environments have become
increasingly dangerous for the dwindling number
of children who still walk or bike to class.8 In
Santa Ana, a low-income community in Orange
County where many children have no choice but
to walk or bike to school, a recent study found
that two-thirds of all local traffic accidents
involving pedestrians occur within a quarter-mile
of schools, and half of all the victims are chil-
dren.9
Who Walks and Who DrivesChildren from low-income families are more
likely to walk or ride a bicycle than children from
more affluent families. In California, Caltrans
data show that walking and biking combine for
nearly one-third (29.5 percent) of the trips made
by children from households with annual
incomes under $25,000, while 53 percent of their
trips are made in private vehicles.10 In compari-
son, children from households with annual
incomes above $75,000 walk or bike for about 10
percent of their trips, and drive or are driven
more than 85 percent of the time. Children from
lower income families also use public transit in
greater numbers.
4
CAN’T GET THERE FROM HERE The Declining Independent Mobility of California’s Children and Youth
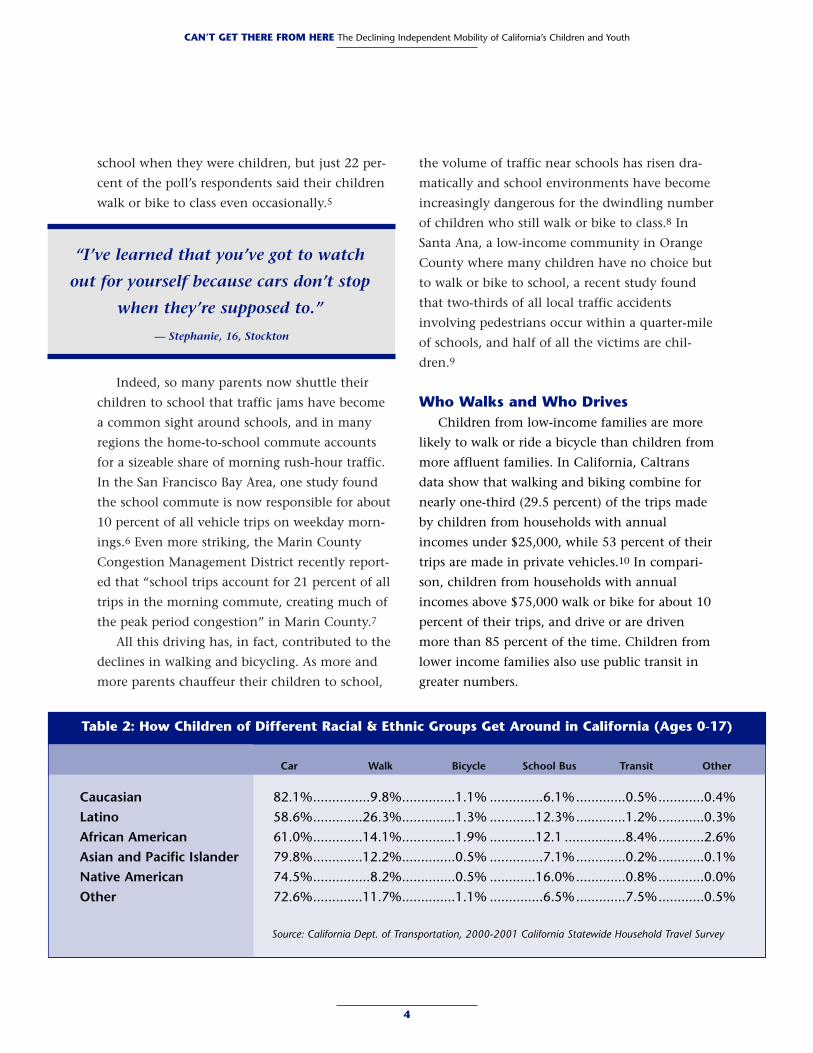
Table 2: How Children of Different Racial & Ethnic Groups Get Around in California (Ages 0-17)
“I’ve learned that you’ve got to watch
out for yourself because cars don’t stop
when they’re supposed to.”
— Stephanie, 16, Stockton
Car Walk Bicycle School Bus Transit Other
Caucasian 82.1%...............9.8%..............1.1% ..............6.1%.............0.5%............0.4%Latino 58.6%.............26.3%..............1.3% ............12.3%.............1.2%............0.3%African American 61.0%.............14.1%..............1.9% ............12.1 ................8.4%............2.6%Asian and Pacific Islander 79.8%.............12.2%..............0.5% ..............7.1%.............0.2%............0.1%Native American 74.5%...............8.2%..............0.5% ............16.0%.............0.8%............0.0%Other 72.6%.............11.7%..............1.1% ..............6.5%.............7.5%............0.5%
Source: California Dept. of Transportation, 2000-2001 California Statewide Household Travel Survey
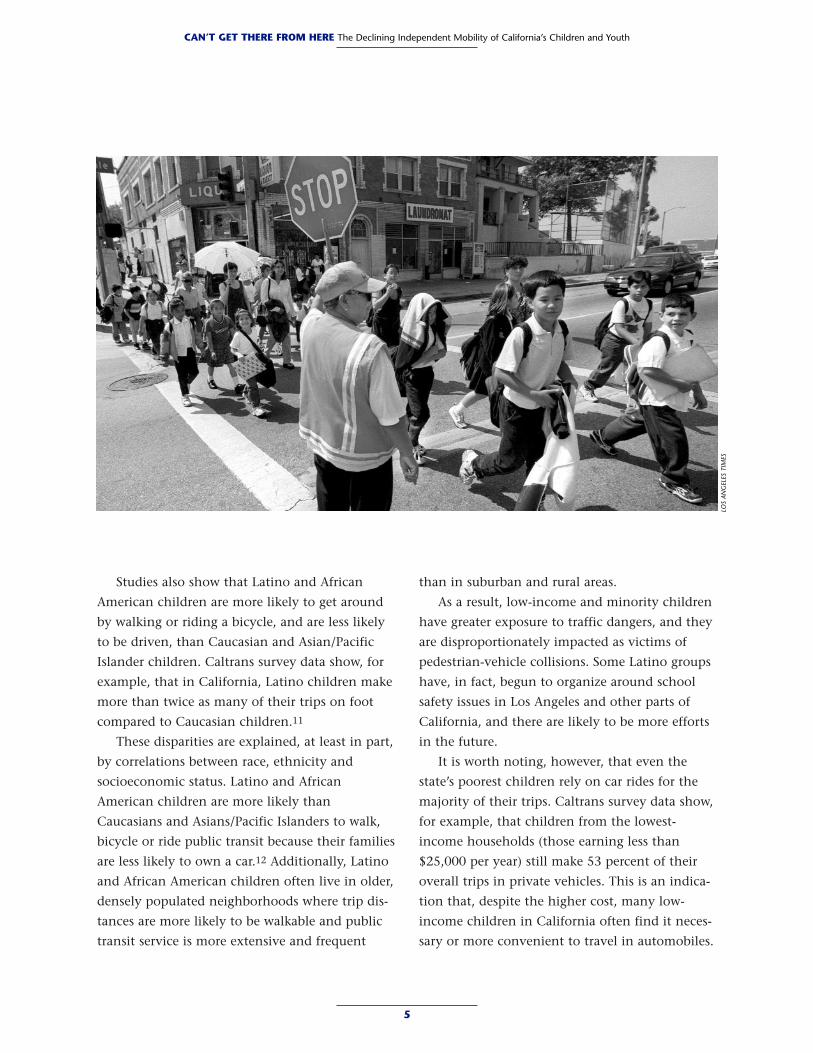
Studies also show that Latino and African
American children are more likely to get around
by walking or riding a bicycle, and are less likely
to be driven, than Caucasian and Asian/Pacific
Islander children. Caltrans survey data show, for
example, that in California, Latino children make
more than twice as many of their trips on foot
compared to Caucasian children.11
These disparities are explained, at least in part,
by correlations between race, ethnicity and
socioeconomic status. Latino and African
American children are more likely than
Caucasians and Asians/Pacific Islanders to walk,
bicycle or ride public transit because their families
are less likely to own a car.12 Additionally, Latino
and African American children often live in older,
densely populated neighborhoods where trip dis-
tances are more likely to be walkable and public
transit service is more extensive and frequent
than in suburban and rural areas.
As a result, low-income and minority children
have greater exposure to traffic dangers, and they
are disproportionately impacted as victims of
pedestrian-vehicle collisions. Some Latino groups
have, in fact, begun to organize around school
safety issues in Los Angeles and other parts of
California, and there are likely to be more efforts
in the future.
It is worth noting, however, that even the
state’s poorest children rely on car rides for the
majority of their trips. Caltrans survey data show,
for example, that children from the lowest-
income households (those earning less than
$25,000 per year) still make 53 percent of their
overall trips in private vehicles. This is an indica-
tion that, despite the higher cost, many low-
income children in California often find it neces-
sary or more convenient to travel in automobiles.
5
CAN’T GET THERE FROM HERE The Declining Independent Mobility of California’s Children and Youth
LOS
ANG
ELES
TIM
ES
Why are today’s children so dependent
on driving? The answer lies, to a large
extent, in the physical design of
many suburban neighborhoods and communities
built since World War II, where many of
California’s children now live.13
Sprawling Neighborhoods MakeWalking Difficult
The scattered, automobile-tailored develop-
ment and shortage of pedestrian infrastructure
that characterize many of the state’s modern
neighborhoods — in booming suburban and
exurban communities as well as in newer sections
of Los Angeles, San Diego, Sacramento and other
cities — deter walking and bicycling, limit the
efficiency of public transit and thereby hinder
children’s ability to get around on their own.
In many newer communities, restrictive zon-
ing codes and ordinances separate residential
neighborhoods from schools and commercial
areas, making trip distances too long to travel on
foot. Zoning codes that require businesses to be
fronted by enormous parking lots further length-
en travel distances and impede walking by forcing
pedestrians to thread their way through a maze of
parked cars to reach their destination. Moreover,
the cul-de-sacs, T-intersections and curvilinear
street layouts that typify newer communities
minimize “connectivity” and often stretch dis-
tances between trip origins and destinations
beyond the quarter- to half-mile radius that is
most convenient for foot travel.14
Numerous studies have shown that average
trip distances are longer in recently developed
places than in traditional urban settings, where
grid-like street networks tend to support a mix of
homes and businesses. A recent study comparing
travel distances in two Sacramento subdivisions
found, for example, that people living in an
“infill” subdivision traveled substantially shorter
distances to supermarkets, parks, schools and
other destinations than residents of a “greenfield”
subdivision built on undeveloped land.15
Although relationships between community
design, trip length and travel behavior are not
fully understood and are not consistent across all
regions, many studies do suggest that people are
more likely to walk, bike or ride public transit in
traditional urban neighborhoods than in neigh-
borhoods with low-density suburban design char-
acteristics. One Bay Area study found that pedes-
trian activity was 50 percent higher in compact
communities with grid-like street networks than
Factors Behind Children’s GrowingDependence on Driving
C H A P T E R 2
6
in suburban ones.16 As California’s nonpartisan
State Legislative Analyst’s Office put it in 1998,
low-density development “makes pedestrian,
bicycle and transit impractical” and “increases
trip length and vehicle miles traveled.”17
One indication that community design affects
children’s travel patterns is provided by studies
that show teenagers living in suburban and rural
areas are more likely to have a driver’s license
than those living in urban areas — where trip dis-
tances tend to be shorter and more transportation
alternatives exist. In rural Alpine and Placer coun-
ties, for example, more than 60 percent of youths
aged 16 and 17 are licensed to drive; in compari-
son, less than 16 percent of San Francisco’s 16-
and 17-year-olds hold a driver’s license.18 (See
Table 19 in Appendices).
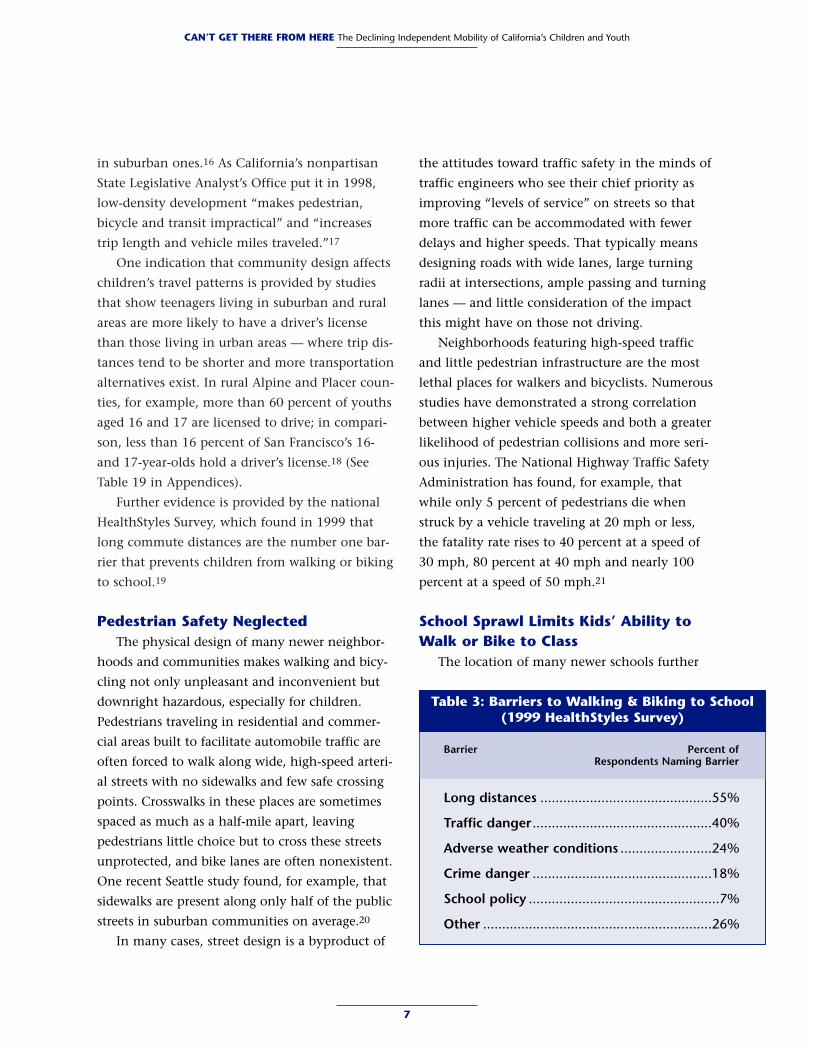
Further evidence is provided by the national
HealthStyles Survey, which found in 1999 that
long commute distances are the number one bar-
rier that prevents children from walking or biking
to school.19
Pedestrian Safety NeglectedThe physical design of many newer neighbor-
hoods and communities makes walking and bicy-
cling not only unpleasant and inconvenient but
downright hazardous, especially for children.
Pedestrians traveling in residential and commer-
cial areas built to facilitate automobile traffic are
often forced to walk along wide, high-speed arteri-
al streets with no sidewalks and few safe crossing
points. Crosswalks in these places are sometimes
spaced as much as a half-mile apart, leaving
pedestrians little choice but to cross these streets
unprotected, and bike lanes are often nonexistent.
One recent Seattle study found, for example, that
sidewalks are present along only half of the public
streets in suburban communities on average.20
In many cases, street design is a byproduct of
the attitudes toward traffic safety in the minds of
traffic engineers who see their chief priority as
improving “levels of service” on streets so that
more traffic can be accommodated with fewer
delays and higher speeds. That typically means
designing roads with wide lanes, large turning
radii at intersections, ample passing and turning
lanes — and little consideration of the impact
this might have on those not driving.
Neighborhoods featuring high-speed traffic
and little pedestrian infrastructure are the most
lethal places for walkers and bicyclists. Numerous
studies have demonstrated a strong correlation
between higher vehicle speeds and both a greater
likelihood of pedestrian collisions and more seri-
ous injuries. The National Highway Traffic Safety
Administration has found, for example, that
while only 5 percent of pedestrians die when
struck by a vehicle traveling at 20 mph or less,
the fatality rate rises to 40 percent at a speed of
30 mph, 80 percent at 40 mph and nearly 100
percent at a speed of 50 mph.21
School Sprawl Limits Kids’ Ability toWalk or Bike to Class
The location of many newer schools further
7
CAN’T GET THERE FROM HERE The Declining Independent Mobility of California’s Children and Youth
Barrier Percent of Respondents Naming Barrier
Long distances .............................................55%
Traffic danger...............................................40%
Adverse weather conditions ........................24%
Crime danger ...............................................18%
School policy ..................................................7%
Other ............................................................26%
Table 3: Barriers to Walking & Biking to School(1999 HealthStyles Survey)
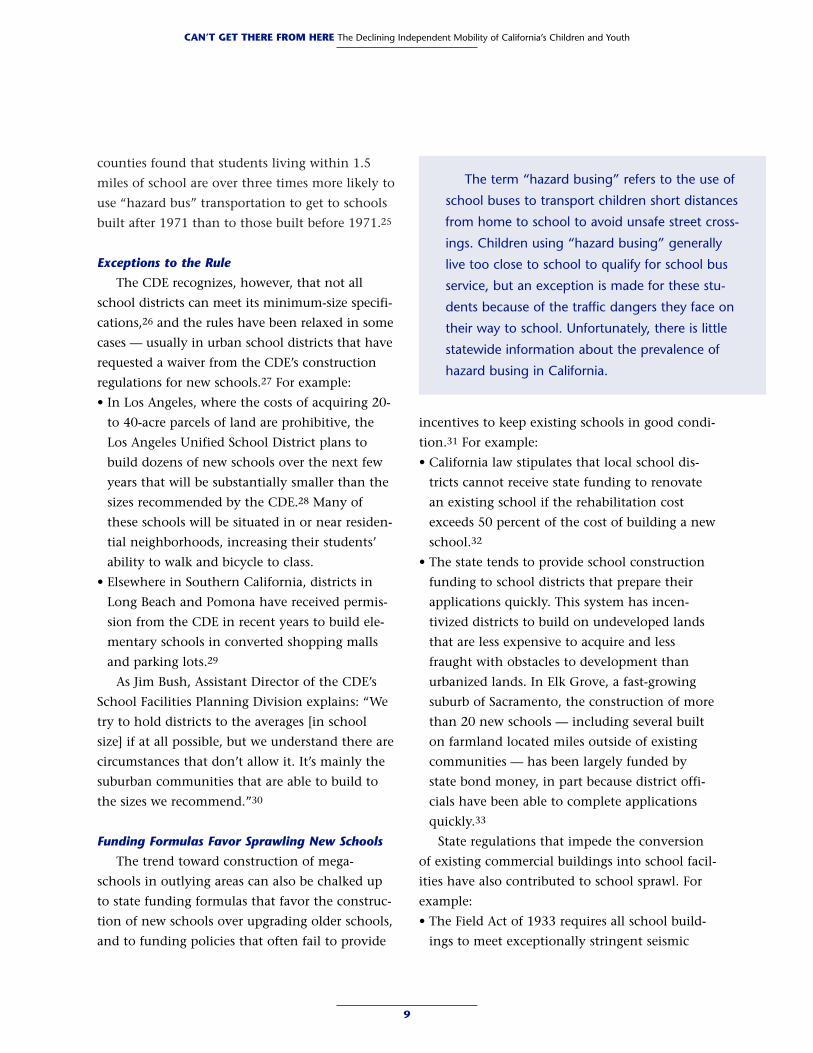
reduces children’s ability to get around without a
car. Schools in California are being constructed
with increasing regularity on undeveloped or
underutilized lands far from the residential neigh-
borhoods where students live. This trend is large-
ly the result of school size and design guidelines,
developed by the Council of Educational Facilities
Planners International (CEFPI), which recom-
mend that new school campuses have at least one
acre for every 100 students plus 10 acres for an
elementary school, 20 acres for a middle school
and 30 acres for a high school.
Like its counterparts in many other states, the
California Department of Education (CDE) has
made these guidelines the regulating standard for
all new schools. Because the minimum acreage
guidelines call for campuses the size of shopping
malls22 — a 2,000-student high school built
according to the CEFPI’s formula requires at least
50 acres — school districts are often obliged to
build new schools on undeveloped lands at the
edge of communities, as existing neighborhoods
in California rarely have enough land available.
The construction of new schools on communi-
ty fringes — a trend in many other states as well
— is one reason the average distance between
home and school now exceeds four miles nation-
wide.23 In comparison, more than half of all
American schoolchildren lived within two miles
of school as recently as the late 1960s.24
When schools are situated beyond a conven-
ient walking or biking distance from residential
neighborhoods, students have no choice but to
use motor vehicles — automobiles, school buses
or public transit — to get to class. Even when
newer schools are located closer to children’s
homes, they are frequently separated from resi-
dential neighborhoods by wide, busy streets, mak-
ing it dangerous for students to reach them on
foot. A recent study of South Carolina’s coastal
8
CAN’T GET THERE FROM HERE The Declining Independent Mobility of California’s Children and Youth
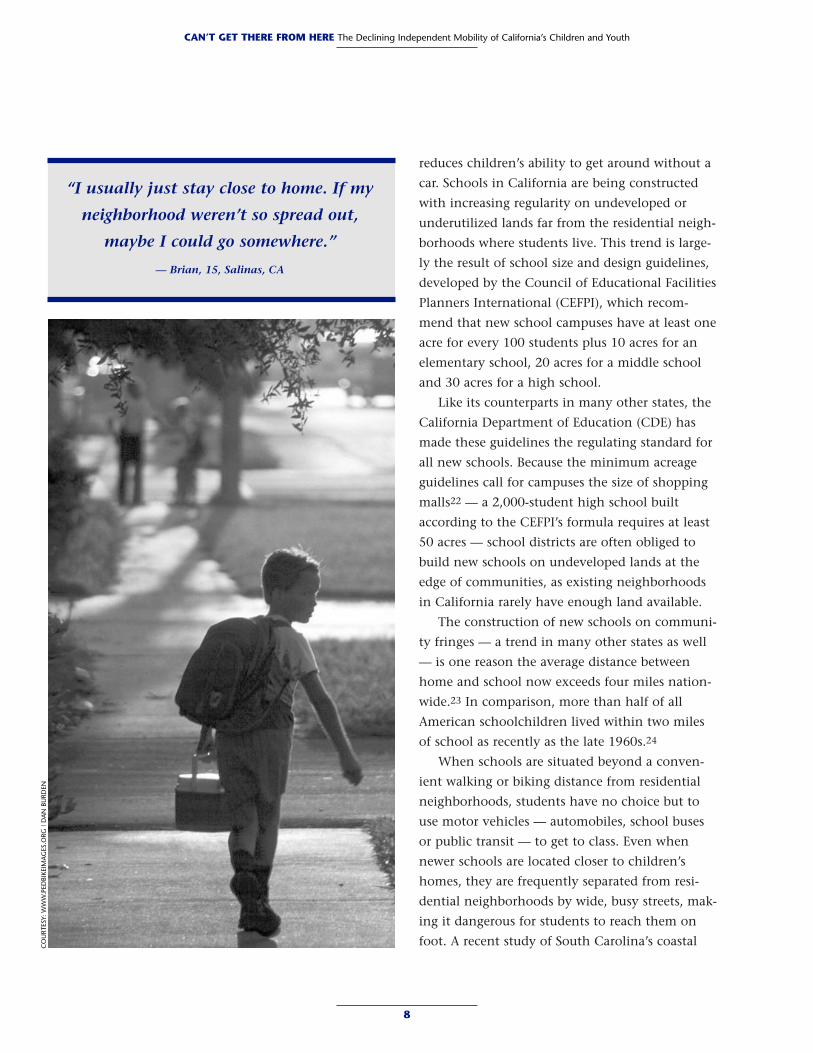
“I usually just stay close to home. If my
neighborhood weren’t so spread out,
maybe I could go somewhere.”
— Brian, 15, Salinas, CA
CO
URT
ESY:
WW
W.P
EDBI
KEIM
AG
ES.O
RG |
DA
N B
URD
EN
counties found that students living within 1.5
miles of school are over three times more likely to
use “hazard bus” transportation to get to schools
built after 1971 than to those built before 1971.25
Exceptions to the Rule
The CDE recognizes, however, that not all
school districts can meet its minimum-size specifi-
cations,26 and the rules have been relaxed in some
cases — usually in urban school districts that have
requested a waiver from the CDE’s construction
regulations for new schools.27 For example:
• In Los Angeles, where the costs of acquiring 20-
to 40-acre parcels of land are prohibitive, the
Los Angeles Unified School District plans to
build dozens of new schools over the next few
years that will be substantially smaller than the
sizes recommended by the CDE.28 Many of
these schools will be situated in or near residen-
tial neighborhoods, increasing their students’
ability to walk and bicycle to class.
• Elsewhere in Southern California, districts in
Long Beach and Pomona have received permis-
sion from the CDE in recent years to build ele-
mentary schools in converted shopping malls
and parking lots.29
As Jim Bush, Assistant Director of the CDE’s
School Facilities Planning Division explains: “We
try to hold districts to the averages [in school
size] if at all possible, but we understand there are
circumstances that don’t allow it. It’s mainly the
suburban communities that are able to build to
the sizes we recommend.”30
Funding Formulas Favor Sprawling New Schools
The trend toward construction of mega-
schools in outlying areas can also be chalked up
to state funding formulas that favor the construc-
tion of new schools over upgrading older schools,
and to funding policies that often fail to provide
incentives to keep existing schools in good condi-
tion.31 For example:
• California law stipulates that local school dis-
tricts cannot receive state funding to renovate
an existing school if the rehabilitation cost
exceeds 50 percent of the cost of building a new
school.32
• The state tends to provide school construction
funding to school districts that prepare their
applications quickly. This system has incen-
tivized districts to build on undeveloped lands
that are less expensive to acquire and less
fraught with obstacles to development than
urbanized lands. In Elk Grove, a fast-growing
suburb of Sacramento, the construction of more
than 20 new schools — including several built
on farmland located miles outside of existing
communities — has been largely funded by
state bond money, in part because district offi-
cials have been able to complete applications
quickly.33
State regulations that impede the conversion
of existing commercial buildings into school facil-
ities have also contributed to school sprawl. For
example:
• The Field Act of 1933 requires all school build-
ings to meet exceptionally stringent seismic
9
CAN’T GET THERE FROM HERE The Declining Independent Mobility of California’s Children and Youth
The term “hazard busing” refers to the use of
school buses to transport children short distances
from home to school to avoid unsafe street cross-
ings. Children using “hazard busing” generally
live too close to school to qualify for school bus
service, but an exception is made for these stu-
dents because of the traffic dangers they face on
their way to school. Unfortunately, there is little
statewide information about the prevalence of
hazard busing in California.
safety specifications, and upgrading commercial
buildings to meet these requirements is often
cost-prohibitive for school districts.
• State law now prohibits schools that are 25
years or older from applying more than once for
modernization grants. In an effort to encourage
the renovation of older neighborhood schools,
and strike a blow against school sprawl, mem-
bers of California’s Legislature introduced a bill
(AB 1244) in 2003 that would allow school dis-
tricts to apply for modernization grants every
25 years for existing schools.35
Meanwhile, class size reduction efforts and
minimum classroom size requirements have also
contributed to the increasing size of California’s
schools. Additionally, California school districts,
like those in many other states, are considered a
“state agency” function and therefore are techni-
cally exempt from local zoning and planning reg-
ulations, meaning they can ignore city or county
growth policies and build mega-schools in outly-
ing areas.36
Low-Density Neighborhood DesignMakes Transit Inconvenient
California’s children make less than 2 percent
of their overall trips (1.5%) on public transporta-
tion, according to Caltrans survey.37 This number
— which is astonishingly low, given that bus and
rail systems provide one of the only ways for chil-
dren under the legal driving age to get around by
themselves — is explained, at least in part, by the
fact that transit is difficult and inconvenient to
use in many California neighborhoods.
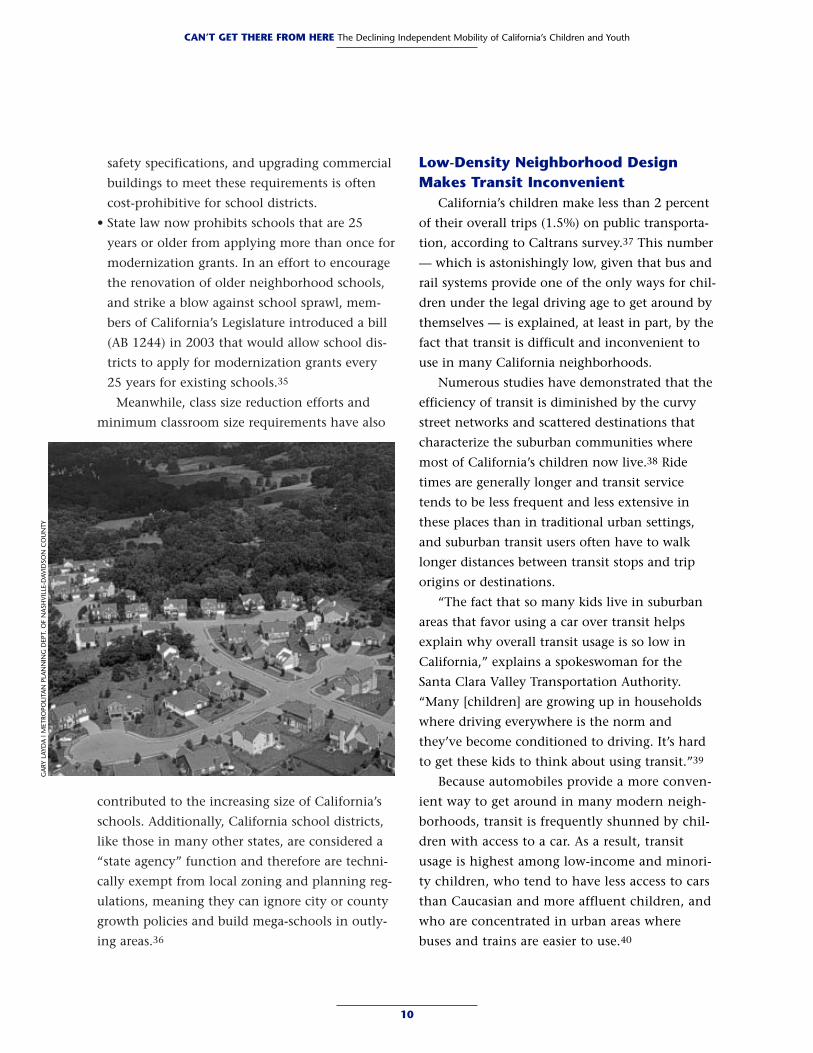
Numerous studies have demonstrated that the
efficiency of transit is diminished by the curvy
street networks and scattered destinations that
characterize the suburban communities where
most of California’s children now live.38 Ride
times are generally longer and transit service
tends to be less frequent and less extensive in
these places than in traditional urban settings,
and suburban transit users often have to walk
longer distances between transit stops and trip
origins or destinations.
“The fact that so many kids live in suburban
areas that favor using a car over transit helps
explain why overall transit usage is so low in
California,” explains a spokeswoman for the
Santa Clara Valley Transportation Authority.
“Many [children] are growing up in households
where driving everywhere is the norm and
they’ve become conditioned to driving. It’s hard
to get these kids to think about using transit.”39
Because automobiles provide a more conven-
ient way to get around in many modern neigh-
borhoods, transit is frequently shunned by chil-
dren with access to a car. As a result, transit
usage is highest among low-income and minori-
ty children, who tend to have less access to cars
than Caucasian and more affluent children, and
who are concentrated in urban areas where
buses and trains are easier to use.40
10
CAN’T GET THERE FROM HERE The Declining Independent Mobility of California’s Children and YouthG
ARY
LAY
DA
| M
ETRO
POLI
TAN
PLA
NN
ING
DEP
T. O
F N
ASH
VILL
E-D
AVID
SON
CO
UN
TY
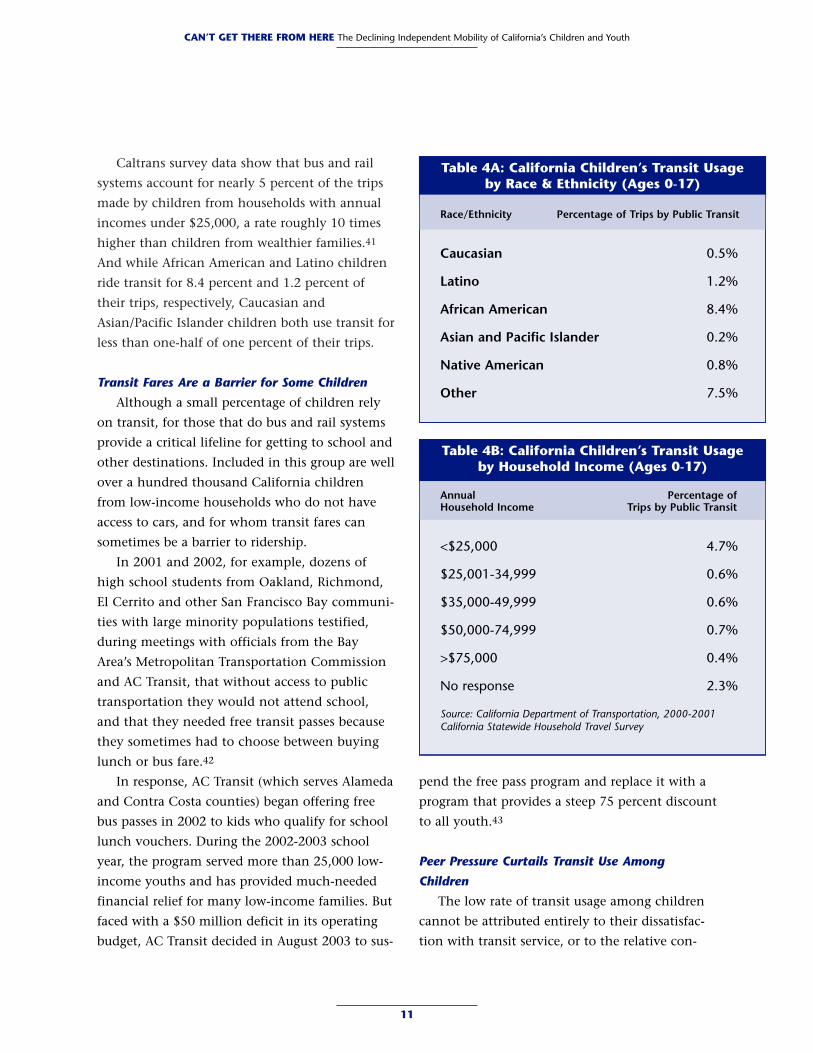
Caltrans survey data show that bus and rail
systems account for nearly 5 percent of the trips
made by children from households with annual
incomes under $25,000, a rate roughly 10 times
higher than children from wealthier families.41
And while African American and Latino children
ride transit for 8.4 percent and 1.2 percent of
their trips, respectively, Caucasian and
Asian/Pacific Islander children both use transit for
less than one-half of one percent of their trips.
Transit Fares Are a Barrier for Some Children
Although a small percentage of children rely
on transit, for those that do bus and rail systems
provide a critical lifeline for getting to school and
other destinations. Included in this group are well
over a hundred thousand California children
from low-income households who do not have
access to cars, and for whom transit fares can
sometimes be a barrier to ridership.
In 2001 and 2002, for example, dozens of
high school students from Oakland, Richmond,
El Cerrito and other San Francisco Bay communi-
ties with large minority populations testified,
during meetings with officials from the Bay
Area’s Metropolitan Transportation Commission
and AC Transit, that without access to public
transportation they would not attend school,
and that they needed free transit passes because
they sometimes had to choose between buying
lunch or bus fare.42
In response, AC Transit (which serves Alameda
and Contra Costa counties) began offering free
bus passes in 2002 to kids who qualify for school
lunch vouchers. During the 2002-2003 school
year, the program served more than 25,000 low-
income youths and has provided much-needed
financial relief for many low-income families. But
faced with a $50 million deficit in its operating
budget, AC Transit decided in August 2003 to sus-
pend the free pass program and replace it with a
program that provides a steep 75 percent discount
to all youth.43
Peer Pressure Curtails Transit Use Among
Children
The low rate of transit usage among children
cannot be attributed entirely to their dissatisfac-
tion with transit service, or to the relative con-
11
CAN’T GET THERE FROM HERE The Declining Independent Mobility of California’s Children and Youth
Table 4A: California Children’s Transit Usage by Race & Ethnicity (Ages 0-17)
Table 4B: California Children’s Transit Usage by Household Income (Ages 0-17)
Race/Ethnicity Percentage of Trips by Public Transit
Caucasian 0.5%
Latino 1.2%
African American 8.4%
Asian and Pacific Islander 0.2%
Native American 0.8%
Other 7.5%
Annual Percentage ofHousehold Income Trips by Public Transit
<$25,000 4.7%
$25,001-34,999 0.6%
$35,000-49,999 0.6%
$50,000-74,999 0.7%
>$75,000 0.4%
No response 2.3%
Source: California Department of Transportation, 2000-2001California Statewide Household Travel Survey
venience of automobile travel. The fact that tran-
sit accounts for less than 5 percent of total trips
even the state’s poorest kids suggests that other
barriers are also causing children to keep away
from transit.44
Indeed, youths aged 13 to 26 who participated
in a recent national survey by the Federal Transit
Administration45 named the following as reasons
they avoid using transit:
• Peer pressure — transit isn’t “cool” and there’s
a social stigma associated with using transit.
• Car culture — automobiles have a positive
image and persuasive marketing.
• System condition — buses are unreliable, dirty
and unsafe (from crime).
• Parental concern — Their parents won’t allow
them to use transit, due to concerns about safe-
ty and security.
• Incentives to drive — for example, their
schools provide free parking.
• They don’t have to — they have a car or their
parents drive them.
In other words, youth ridership is curtailed, to
at least some extent, by obstacles beyond the con-
trol of transit agencies.46
School Bus Service Cuts Boost Car-Dependence
Children’s dependence on automobiles has
been exacerbated by the fact that many public
school districts in California have scaled back
their school bus programs. The result is that a
growing number of students simply don’t have
the option of riding a school bus — and when
school bus service isn’t available, and routes to
school are too long or too hazardous to travel by
foot or bicycle, parents have little choice but to
chauffeur their kids to school.
Although few California school districts have
entirely eliminated bus programs, many have
reduced the scope of their programs in recent
years, and many districts have raised or begun
charging fees for school bus service. Districts have
cut back on service by running fewer buses, trim-
ming routes and by extending the minimum
walking distance children must travel between
home and school to qualify for bus service.47
“Most districts have been forced to make at
least some service cuts” in recent years, says Bob
Austin, coordinator of the California Department
of Education’s Office of School Transportation.48
Examples include:
• The William S. Hart Unified School District in
Los Angeles County
• The Encinitas Union School District and San
Dieguito Union High School District in San
Diego County.
• In Riverside County, the Romoland School
District eliminated bus service in the mid-1990s
for all except special needs students
• The Capistrano Unified School District in
Orange County has proposed eliminating bus-
ing in 2003 because of budget problems.
12
CAN’T GET THERE FROM HERE The Declining Independent Mobility of California’s Children and Youth
“I can’t do anything unless someone
drives me there so I don’t feel like I have
many options. I’d like to be able to go
to the movies easily on weekends, but
I’d have to ask my parents and they
don’t like going out after work.
They’re too tired. My friends all live
really far away from my house.”
— Andrew, 16, rural Monterey County
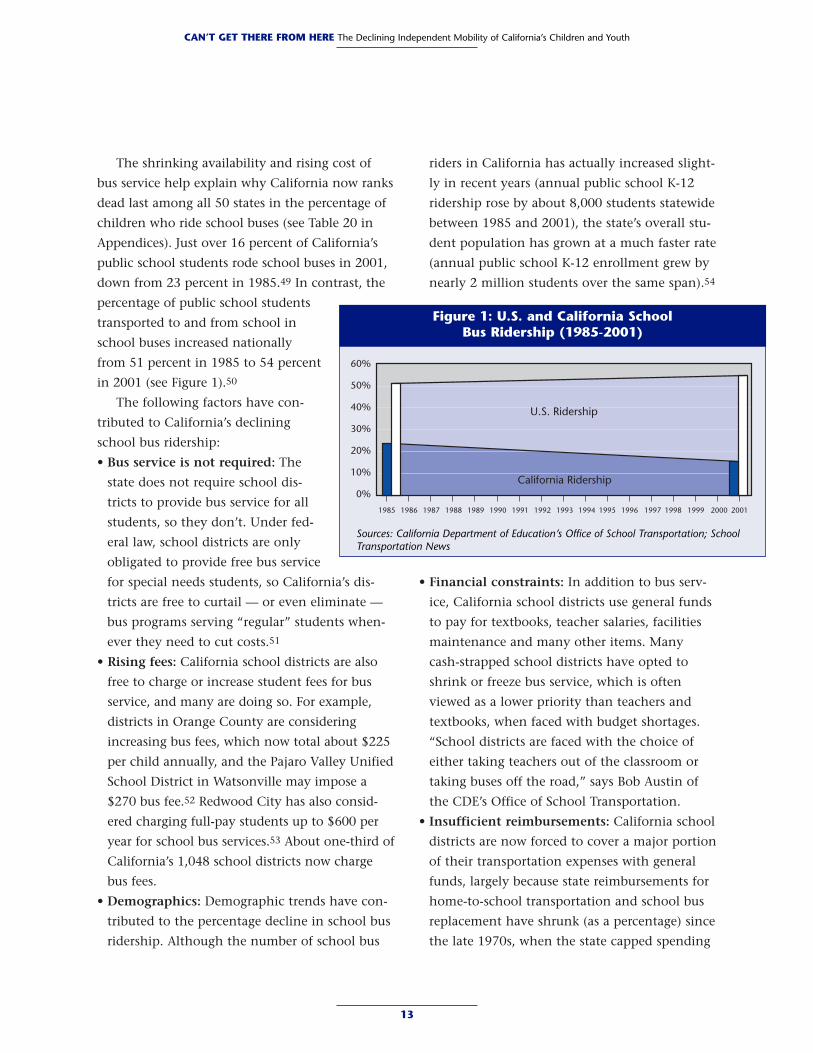
The shrinking availability and rising cost of
bus service help explain why California now ranks
dead last among all 50 states in the percentage of
children who ride school buses (see Table 20 in
Appendices). Just over 16 percent of California’s
public school students rode school buses in 2001,
down from 23 percent in 1985.49 In contrast, the
percentage of public school students
transported to and from school in
school buses increased nationally
from 51 percent in 1985 to 54 percent
in 2001 (see Figure 1).50
The following factors have con-
tributed to California’s declining
school bus ridership:
• Bus service is not required: The
state does not require school dis-
tricts to provide bus service for all
students, so they don’t. Under fed-
eral law, school districts are only
obligated to provide free bus service
for special needs students, so California’s dis-
tricts are free to curtail — or even eliminate —
bus programs serving “regular” students when-
ever they need to cut costs.51
• Rising fees: California school districts are also
free to charge or increase student fees for bus
service, and many are doing so. For example,
districts in Orange County are considering
increasing bus fees, which now total about $225
per child annually, and the Pajaro Valley Unified
School District in Watsonville may impose a
$270 bus fee.52 Redwood City has also consid-
ered charging full-pay students up to $600 per
year for school bus services.53 About one-third of
California’s 1,048 school districts now charge
bus fees.
• Demographics: Demographic trends have con-
tributed to the percentage decline in school bus
ridership. Although the number of school bus
riders in California has actually increased slight-
ly in recent years (annual public school K-12
ridership rose by about 8,000 students statewide
between 1985 and 2001), the state’s overall stu-
dent population has grown at a much faster rate
(annual public school K-12 enrollment grew by
nearly 2 million students over the same span).54
• Financial constraints: In addition to bus serv-
ice, California school districts use general funds
to pay for textbooks, teacher salaries, facilities
maintenance and many other items. Many
cash-strapped school districts have opted to
shrink or freeze bus service, which is often
viewed as a lower priority than teachers and
textbooks, when faced with budget shortages.
“School districts are faced with the choice of
either taking teachers out of the classroom or
taking buses off the road,” says Bob Austin of
the CDE’s Office of School Transportation.
• Insufficient reimbursements: California school
districts are now forced to cover a major portion
of their transportation expenses with general
funds, largely because state reimbursements for
home-to-school transportation and school bus
replacement have shrunk (as a percentage) since
the late 1970s, when the state capped spending
13
CAN’T GET THERE FROM HERE The Declining Independent Mobility of California’s Children and Youth
Figure 1: U.S. and California School Bus Ridership (1985-2001)
60%
50%
40%
30%
20%
10%
0%
1985 1986 1987 1988 1989 1990 1991 1992 1993 1994 1995 1996 1997 1998 1999 2000 2001
U.S. Ridership
California Ridership
Sources: California Department of Education’s Office of School Transportation; SchoolTransportation News
on school transportation programs following
the passage of Proposition 13. The state now
reimburses most school districts for less than
half of their home-to-school transportation
costs — districts are reimbursed for 40 to 50 per-
cent of their transportation costs, on average,
but many districts receive an even smaller sub-
sidy.55 Several legislative efforts to require the
state to review its current school transportation
funding formula have failed in recent years.56
In contrast to California, most states either
require or tacitly mandate that school districts
provide school bus service for all students, and
most states reimburse school districts for a much
larger percentage of their transportation costs.
“No one even questions the necessity of provid-
ing school bus service in other states...and
because most states make universal bus service a
priority, they are willing to subsidize it at a higher
level” than California, explains Ron Kinney,
Director of Business and Government Relations in
California for Laidlaw Education Services, the
largest private contractor of student transporta-
tion in North America.57
As a result, California ranks last amongst all 50
states in school bus ridership (see Table 20 in
Appendices). In New York, for example, where
spending on school transportation accounts for
nearly 5 percent of the state’s overall K-12 educa-
tion budget, 69 percent of all K-12 public school
students ride school buses — a rate four times
higher than in California, where about 3 percent
of the state’s overall K-12 education expenditures
go to school transportation.58 New York also has
more than twice as many school buses in opera-
tion than California, despite the fact that
California’s K-12 student population is twice the
size of New York’s.
The inadequate funding for school bus pro-
grams in California also helps explain why the
state has the oldest and dirtiest bus fleet in the
nation. The average age of California school buses
is more than 14 years, and about 10 percent of the
state’s school buses — the highest number in the
country — were purchased before 1977 and do
not meet federal safety standards.59 Additionally,
about 30 percent of California’s school buses fail
to meet diesel school bus pollution standards set
by the state’s Air Resources Board.60
School Buses Are The Safest Way To Travel To
School
The low ridership rates in California are unfor-
tunate from a safety standpoint, as statistics show
school buses are by far the safest travel mode for
children. A recent study by the Transportation
Research Board (TRB) shows that while school buses
accounted for 25 percent of all trips made by U.S.
children during normal school commute hours
between 1991 and 1999, they accounted for just 2
percent of the deaths and 4 percent of the injuries
sustained by children traveling to school.61 In com-
parison, roughly 74 percent of the accidental
deaths and 84 percent of the injuries suffered by
students on commuting to school occurred in pas-
senger vehicles. In California, no school bus riders
died or suffered incapacitating injuries in 2000,
while 21 students were killed and 17 suffered inca-
pacitating injuries while riding to or from school in
passenger vehicles.62
Ironically, a new state law intended to increase
the safety of school buses could further strain dis-
tricts’ transportation budgets and further reduce
the capacity of school bus programs — meaning
fewer children will have access to what is already
the safest travel mode.63 The law, which takes
effect in January 2004, will require all new school
buses to be equipped with lap/shoulder belts,
which means new buses will likely seat fewer chil-
dren. This requirement — which couldn’t come at
14
CAN’T GET THERE FROM HERE The Declining Independent Mobility of California’s Children and Youth

a worse time for school districts given the state’s
enormous budget deficit and the cuts in educa-
tion funding that will likely result — could lead
school districts to delay new bus purchases and to
augment bus fleets with older buses.
Additional Factors That DiscourageWalking and Biking
Pedestrian-unfriendly community design and
the inconvenience of public transportation are
not the only reasons children have become so
reliant on automobiles. Other factors limiting the
ability of today’s kids to get around on their own
include:
• Busy parents: Increased time pressures have left
parents with less time to walk their children to
school and other destinations, and many par-
ents don’t want their children walking around
unaccompanied by an adult.64 One study found
that the average middle-income, two-parent
American family now works 660 more hours per
year than in 1979.65
• Fear of abduction and other crime: Concerns
that their children will be abducted or otherwise
harmed by strangers while walking or biking
prompts many parents to drive their children
around, even when trip distances are short. This
barrier to children’s independent mobility is dis-
cussed in greater depth in the next chapter.
The Costs of Car-DependenceChildren’s growing reliance on car rides has
added substantially to families’ transportation
expenses, which have risen by more than 10 per-
cent on average since 1990. In 2001, transporta-
tion costs accounted for nearly one-fifth (19.3%)
of every dollar spent by the average American
household,66 and transportation is now the sec-
ond biggest expense category after housing in
most families’ budgets.
Moreover, motor vehicle-related costs make up
the lion’s share of families’ transportation spend-
ing. According to a survey by the U.S. Bureau of
Labor Statistics, the purchase, fueling, insurance
15
CAN’T GET THERE FROM HERE The Declining Independent Mobility of California’s Children and Youth
Table 5: U.S. Deaths & Injuries Sustained During School Commute Trips (1991-1999)
Travel Mode Percent of Total Trips(1) Fatalities (% of Total)(2) Non-Fatal Injuries (% of Total)(2)
School Bus 25% .......................................2% .......................................4%All other buses* 2% .....................................<1% .....................................<1%Passenger vehicles** 45% .....................................20% .....................................33%with drivers age 19 and olderPassenger vehicles** 14% .....................................54% .....................................51%with drivers below age 19Bicycles 2% .......................................6% .......................................5%Walking*** 12% .....................................16% .......................................6%
(1) 1995 National Personal Transportation Survey; (2) Fatality Analysis Reporting System (FARS), General Estimates System (GES)*Includes transit, paratransit and motorcoach service**Includes all motor vehicles except school buses and other buses with drivers at least 19 years old***Includes scooters, skateboarding and rollerblading(Source: Transportation Research Board, "The Relative Risks of School Travel: A National Perspective and Guidance for Local Community RiskAssessment," 2002. Data pertains to children aged 5-18.)
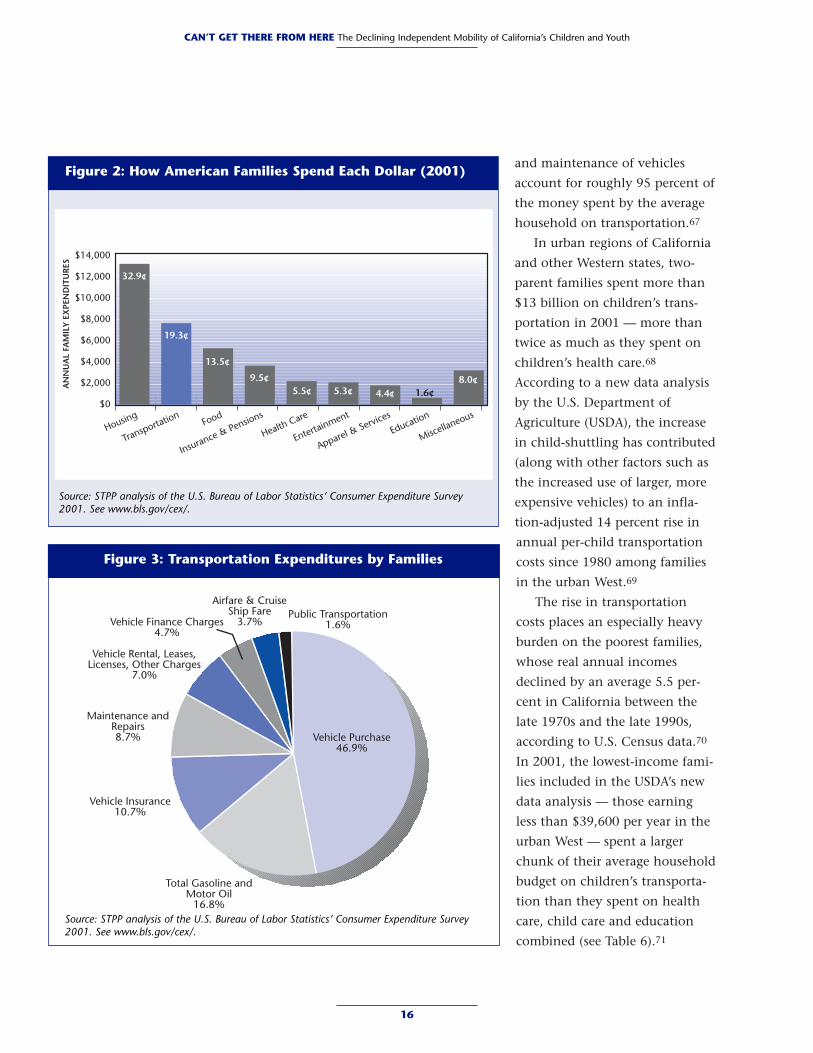
and maintenance of vehicles
account for roughly 95 percent of
the money spent by the average
household on transportation.67
In urban regions of California
and other Western states, two-
parent families spent more than
$13 billion on children’s trans-
portation in 2001 — more than
twice as much as they spent on
children’s health care.68
According to a new data analysis
by the U.S. Department of
Agriculture (USDA), the increase
in child-shuttling has contributed
(along with other factors such as
the increased use of larger, more
expensive vehicles) to an infla-
tion-adjusted 14 percent rise in
annual per-child transportation
costs since 1980 among families
in the urban West.69
The rise in transportation
costs places an especially heavy
burden on the poorest families,
whose real annual incomes
declined by an average 5.5 per-
cent in California between the
late 1970s and the late 1990s,
according to U.S. Census data.70
In 2001, the lowest-income fami-
lies included in the USDA’s new
data analysis — those earning
less than $39,600 per year in the
urban West — spent a larger
chunk of their average household
budget on children’s transporta-
tion than they spent on health
care, child care and education
combined (see Table 6).71
16
CAN’T GET THERE FROM HERE The Declining Independent Mobility of California’s Children and Youth
Figure 2: How American Families Spend Each Dollar (2001)
Figure 3: Transportation Expenditures by Families
$14,000
$12,000
$10,000
$8,000
$6,000
$4,000
$2,000
$0
32.9¢
19.3¢
13.5¢
9.5¢5.5¢ 5.3¢ 4.4¢ 1.6¢
8.0¢
Housing
TransportationFood
Insurance & Pensions
Health Care
Entertainment
Apparel & Services
Education
Miscellaneous
AN
NU
AL
FAM
ILY
EX
PEN
DIT
UR
ES
Public Transportation1.6%
Airfare & CruiseShip Fare
3.7%Vehicle Finance Charges4.7%
Vehicle Rental, Leases,Licenses, Other Charges
7.0%
Maintenance andRepairs8.7%
Vehicle Insurance10.7%
Total Gasoline andMotor Oil
16.8%
Vehicle Purchase46.9%
Source: STPP analysis of the U.S. Bureau of Labor Statistics’ Consumer Expenditure Survey2001. See www.bls.gov/cex/.
Source: STPP analysis of the U.S. Bureau of Labor Statistics’ Consumer Expenditure Survey2001. See www.bls.gov/cex/.
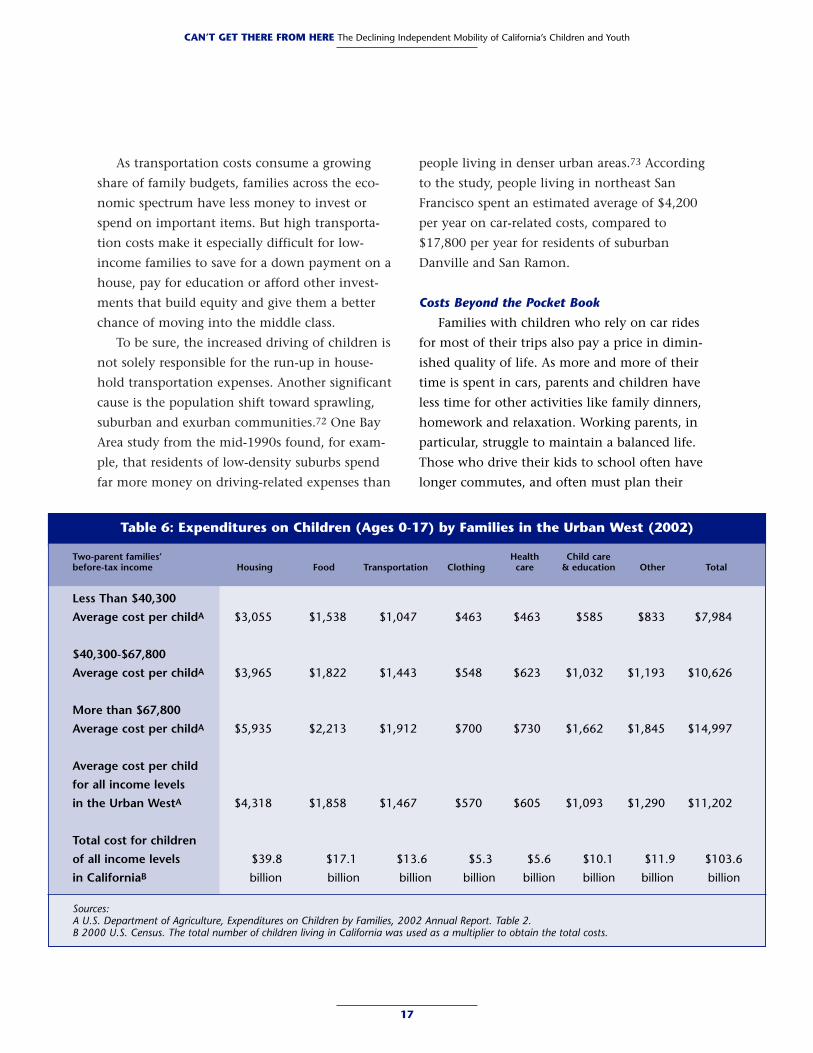
As transportation costs consume a growing
share of family budgets, families across the eco-
nomic spectrum have less money to invest or
spend on important items. But high transporta-
tion costs make it especially difficult for low-
income families to save for a down payment on a
house, pay for education or afford other invest-
ments that build equity and give them a better
chance of moving into the middle class.
To be sure, the increased driving of children is
not solely responsible for the run-up in house-
hold transportation expenses. Another significant
cause is the population shift toward sprawling,
suburban and exurban communities.72 One Bay
Area study from the mid-1990s found, for exam-
ple, that residents of low-density suburbs spend
far more money on driving-related expenses than
people living in denser urban areas.73 According
to the study, people living in northeast San
Francisco spent an estimated average of $4,200
per year on car-related costs, compared to
$17,800 per year for residents of suburban
Danville and San Ramon.
Costs Beyond the Pocket Book
Families with children who rely on car rides
for most of their trips also pay a price in dimin-
ished quality of life. As more and more of their
time is spent in cars, parents and children have
less time for other activities like family dinners,
homework and relaxation. Working parents, in
particular, struggle to maintain a balanced life.
Those who drive their kids to school often have
longer commutes, and often must plan their
17
CAN’T GET THERE FROM HERE The Declining Independent Mobility of California’s Children and Youth
Table 6: Expenditures on Children (Ages 0-17) by Families in the Urban West (2002)
Two-parent families’ Health Child carebefore-tax income Housing Food Transportation Clothing care & education Other Total
Less Than $40,300
Average cost per childA $3,055 $1,538 $1,047 $463 $463 $585 $833 $7,984
$40,300-$67,800
Average cost per childA $3,965 $1,822 $1,443 $548 $623 $1,032 $1,193 $10,626
More than $67,800
Average cost per childA $5,935 $2,213 $1,912 $700 $730 $1,662 $1,845 $14,997
Average cost per child
for all income levels
in the Urban WestA $4,318 $1,858 $1,467 $570 $605 $1,093 $1,290 $11,202
Total cost for children
of all income levels $39.8 $17.1 $13.6 $5.3 $5.6 $10.1 $11.9 $103.6
in CaliforniaB billion billion billion billion billion billion billion billion
Sources: A U.S. Department of Agriculture, Expenditures on Children by Families, 2002 Annual Report. Table 2.B 2000 U.S. Census. The total number of children living in California was used as a multiplier to obtain the total costs.
weekday schedules around their children’s school
schedules and extracurricular activities. Many of
today’s parents also spend a substantial share of
their weekends ferrying children to birthday par-
ties, soccer games, friends’ houses and other
activities. As one San Francisco mother with an
eight-year-old daughter puts it, “Some of the
other mothers I know spend four hours in their
car per day. They have no time for themselves
after that.”74
Indeed, mothers with school-aged children,
who make more car trips per day than any other
population group, spend so much time shuttling
kids to and from school and other activities that
the term “soccer mom” was coined to describe
the phenomenon. In California, married mothers
with school-aged children now average more
than 87 minutes each day behind the wheel,
while single mothers with school-aged children
average even more time (94 minutes) driving, an
amount that is slightly higher than the national
average.75 Additionally, national research by the
Surface Transportation Policy Project has found
that mothers with school-aged children drive 20
percent more than other women.76
All this driving also takes a toll on kids.
Nationwide, children under the age of 18 spend
an average of more than 45 minutes a day in
cars.77 Even young children are spending large
chunks of time in cars, as “mobile child care” has
become a way of life for working parents who
bring their children along in the car because
other child-care options are expensive or unavail-
able.78 In an effort to distract children from their
long commutes, some parents have turned their
vehicles into rolling entertainment centers. A
recent Wall Street Journal article reports that sales
of in-car DVD players and VCRs are running 50
percent higher in 2003 than a year earlier.79
Furthermore, while automobiles provide many
children with access to afterschool and weekend
activities, and to destinations they otherwise
might not be able to reach, dependence on car
rides is also a source of stress for many children
— especially teenagers who want to be able to get
around on their own. Many of the teenagers
interviewed for this report said their inability to
go places without assistance from their parents
made them feel frustrated and isolated.80
18
CAN’T GET THERE FROM HERE The Declining Independent Mobility of California’s Children and Youth
One of the major reasons California’s chil-
dren are walking and riding bicycles less
often than in the past is that today’s
children are often not allowed to roam around on
their own. Concerned about crime and motor
vehicle traffic, many parents would rather drive
their kids to school and other destinations than
expose them to the dangers of the street.
Child Pedestrians Face Heightened Riskfrom Traffic Dangers
From the windows of her home in Santa
Barbara, 16-year-old Meehan can see part of her
high school campus. Unlike many of her class-
mates, she lives just a few blocks from school and
walks to class almost every day. But Meehan’s
windows also look out on the busy, six-lane street
she must cross to get to school. “There is so much
traffic in the mornings that it looks like an L.A.
freeway,” she says. “And people are in such a
hurry to get to work they don’t even want to slow
down when people are in the crosswalk.”
Her worst fears about this street were realized
one day in 2001, while she was walking home for
lunch with two friends. The driver of an
approaching car didn’t see the three girls as they
entered the crosswalk, and narrowly missed col-
liding with Meehan. But the speeding vehicle did
hit one of her friends in the leg, sending her to
the hospital with serious injuries. “It was a trau-
matizing experience,” Meehan recalls. “It’s really
scary to see a car coming at you and then to see
one of your best friends lying in the street.”
Frightening as it sounds, Meehan’s experience
isn’t unusual in California. Fast-moving traffic,
aggressive drivers and high traffic volumes have
turned many streets and crosswalks into danger
zones for child pedestrians and bicyclists.
Nearly 5,000 children are reported injured
each year in California while walking on public
roads.81 And that’s probably an understatement,
as it’s been estimated that pedestrian injuries are
underreported by as much as 56 percent.82 Police
often do not report collisions that result in emer-
gency room treatment but not hospitalization,
and don’t report collisions that occur on private
property or in alleys or driveways, locations
where many accidents involving the youngest
children occur.
Throughout the state, statistics show children
are disproportionately represented as victims of
pedestrian-vehicle accidents, in part because they
depend on walking and bicycling to get around
more than any other segment of the population
These Streets Weren’t Made for Walking
C H A P T E R 3
19
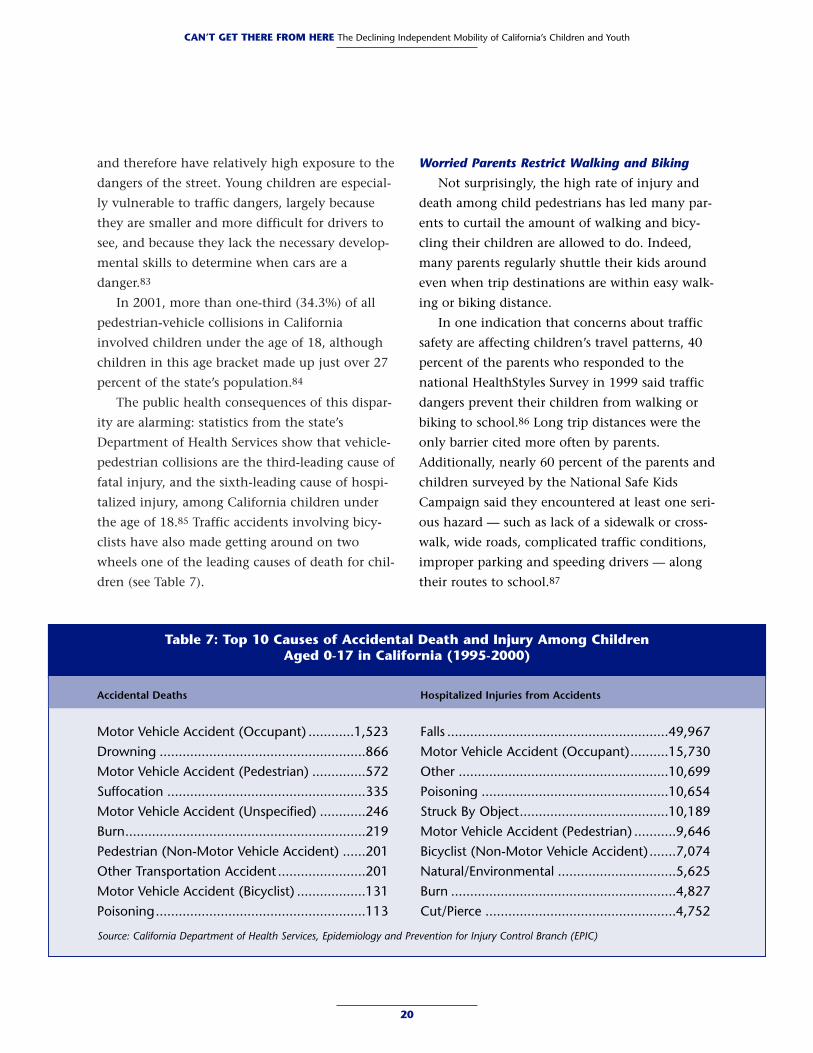
and therefore have relatively high exposure to the
dangers of the street. Young children are especial-
ly vulnerable to traffic dangers, largely because
they are smaller and more difficult for drivers to
see, and because they lack the necessary develop-
mental skills to determine when cars are a
danger.83
In 2001, more than one-third (34.3%) of all
pedestrian-vehicle collisions in California
involved children under the age of 18, although
children in this age bracket made up just over 27
percent of the state’s population.84
The public health consequences of this dispar-
ity are alarming: statistics from the state’s
Department of Health Services show that vehicle-
pedestrian collisions are the third-leading cause of
fatal injury, and the sixth-leading cause of hospi-
talized injury, among California children under
the age of 18.85 Traffic accidents involving bicy-
clists have also made getting around on two
wheels one of the leading causes of death for chil-
dren (see Table 7).
Worried Parents Restrict Walking and Biking
Not surprisingly, the high rate of injury and
death among child pedestrians has led many par-
ents to curtail the amount of walking and bicy-
cling their children are allowed to do. Indeed,
many parents regularly shuttle their kids around
even when trip destinations are within easy walk-
ing or biking distance.
In one indication that concerns about traffic
safety are affecting children’s travel patterns, 40
percent of the parents who responded to the
national HealthStyles Survey in 1999 said traffic
dangers prevent their children from walking or
biking to school.86 Long trip distances were the
only barrier cited more often by parents.
Additionally, nearly 60 percent of the parents and
children surveyed by the National Safe Kids
Campaign said they encountered at least one seri-
ous hazard — such as lack of a sidewalk or cross-
walk, wide roads, complicated traffic conditions,
improper parking and speeding drivers — along
their routes to school.87
20
CAN’T GET THERE FROM HERE The Declining Independent Mobility of California’s Children and Youth
Table 7: Top 10 Causes of Accidental Death and Injury Among Children Aged 0-17 in California (1995-2000)
Accidental Deaths Hospitalized Injuries from Accidents
Motor Vehicle Accident (Occupant) ............1,523 Falls ..........................................................49,967Drowning ......................................................866 Motor Vehicle Accident (Occupant)..........15,730Motor Vehicle Accident (Pedestrian) ..............572 Other .......................................................10,699Suffocation ....................................................335 Poisoning .................................................10,654Motor Vehicle Accident (Unspecified) ............246 Struck By Object.......................................10,189Burn...............................................................219 Motor Vehicle Accident (Pedestrian) ...........9,646Pedestrian (Non-Motor Vehicle Accident) ......201 Bicyclist (Non-Motor Vehicle Accident) .......7,074Other Transportation Accident .......................201 Natural/Environmental ...............................5,625Motor Vehicle Accident (Bicyclist) ..................131 Burn ...........................................................4,827Poisoning.......................................................113 Cut/Pierce ..................................................4,752
Source: California Department of Health Services, Epidemiology and Prevention for Injury Control Branch (EPIC)
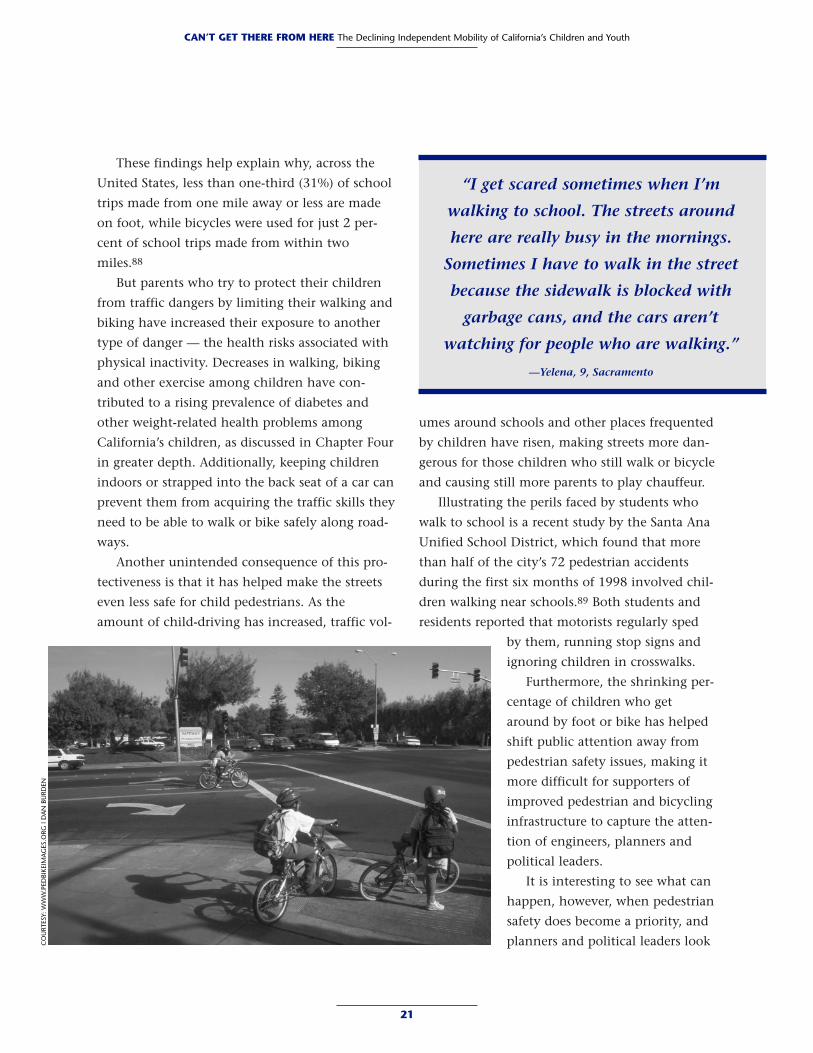
These findings help explain why, across the
United States, less than one-third (31%) of school
trips made from one mile away or less are made
on foot, while bicycles were used for just 2 per-
cent of school trips made from within two
miles.88
But parents who try to protect their children
from traffic dangers by limiting their walking and
biking have increased their exposure to another
type of danger — the health risks associated with
physical inactivity. Decreases in walking, biking
and other exercise among children have con-
tributed to a rising prevalence of diabetes and
other weight-related health problems among
California’s children, as discussed in Chapter Four
in greater depth. Additionally, keeping children
indoors or strapped into the back seat of a car can
prevent them from acquiring the traffic skills they
need to be able to walk or bike safely along road-
ways.
Another unintended consequence of this pro-
tectiveness is that it has helped make the streets
even less safe for child pedestrians. As the
amount of child-driving has increased, traffic vol-
umes around schools and other places frequented
by children have risen, making streets more dan-
gerous for those children who still walk or bicycle
and causing still more parents to play chauffeur.
Illustrating the perils faced by students who
walk to school is a recent study by the Santa Ana
Unified School District, which found that more
than half of the city’s 72 pedestrian accidents
during the first six months of 1998 involved chil-
dren walking near schools.89 Both students and
residents reported that motorists regularly sped
by them, running stop signs and
ignoring children in crosswalks.
Furthermore, the shrinking per-
centage of children who get
around by foot or bike has helped
shift public attention away from
pedestrian safety issues, making it
more difficult for supporters of
improved pedestrian and bicycling
infrastructure to capture the atten-
tion of engineers, planners and
political leaders.
It is interesting to see what can
happen, however, when pedestrian
safety does become a priority, and
planners and political leaders look
21
CAN’T GET THERE FROM HERE The Declining Independent Mobility of California’s Children and Youth
“I get scared sometimes when I’m
walking to school. The streets around
here are really busy in the mornings.
Sometimes I have to walk in the street
because the sidewalk is blocked with
garbage cans, and the cars aren’t
watching for people who are walking.”
—Yelena, 9, Sacramento
CO
URT
ESY:
WW
W.P
EDBI
KEIM
AG
ES.O
RG |
DA
N B
URD
EN
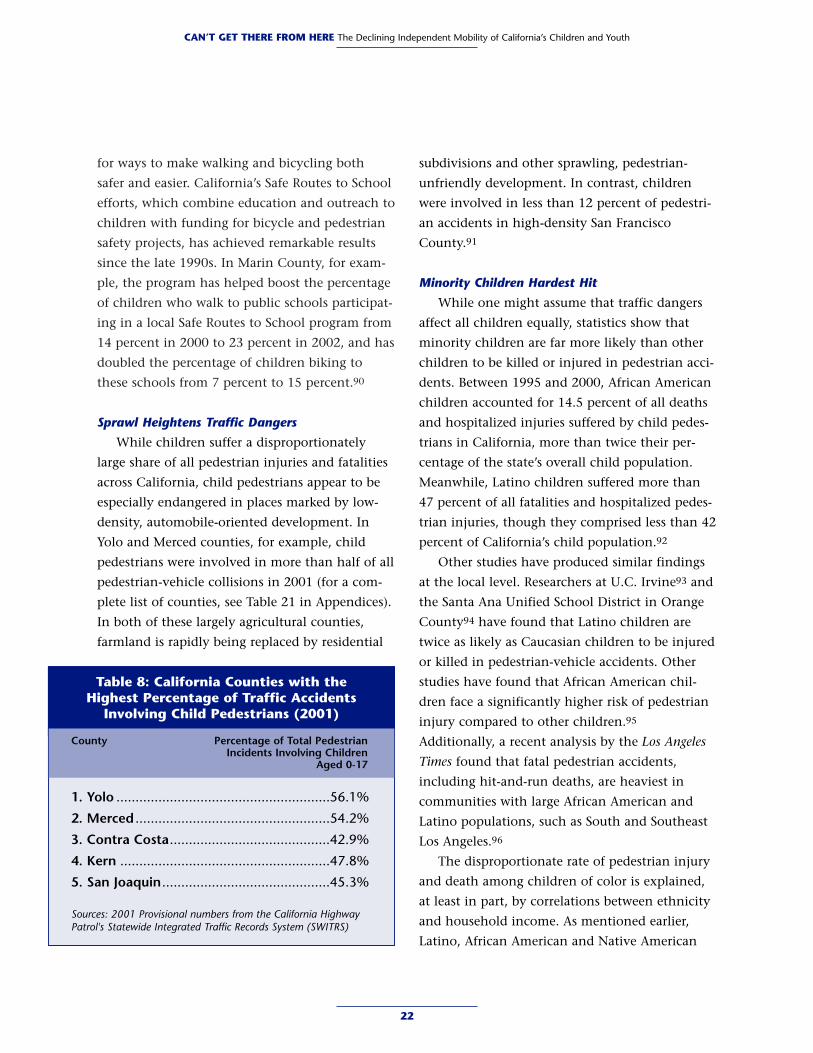
for ways to make walking and bicycling both
safer and easier. California’s Safe Routes to School
efforts, which combine education and outreach to
children with funding for bicycle and pedestrian
safety projects, has achieved remarkable results
since the late 1990s. In Marin County, for exam-
ple, the program has helped boost the percentage
of children who walk to public schools participat-
ing in a local Safe Routes to School program from
14 percent in 2000 to 23 percent in 2002, and has
doubled the percentage of children biking to
these schools from 7 percent to 15 percent.90
Sprawl Heightens Traffic Dangers
While children suffer a disproportionately
large share of all pedestrian injuries and fatalities
across California, child pedestrians appear to be
especially endangered in places marked by low-
density, automobile-oriented development. In
Yolo and Merced counties, for example, child
pedestrians were involved in more than half of all
pedestrian-vehicle collisions in 2001 (for a com-
plete list of counties, see Table 21 in Appendices).
In both of these largely agricultural counties,
farmland is rapidly being replaced by residential
subdivisions and other sprawling, pedestrian-
unfriendly development. In contrast, children
were involved in less than 12 percent of pedestri-
an accidents in high-density San Francisco
County.91
Minority Children Hardest Hit
While one might assume that traffic dangers
affect all children equally, statistics show that
minority children are far more likely than other
children to be killed or injured in pedestrian acci-
dents. Between 1995 and 2000, African American
children accounted for 14.5 percent of all deaths
and hospitalized injuries suffered by child pedes-
trians in California, more than twice their per-
centage of the state’s overall child population.
Meanwhile, Latino children suffered more than
47 percent of all fatalities and hospitalized pedes-
trian injuries, though they comprised less than 42
percent of California’s child population.92
Other studies have produced similar findings
at the local level. Researchers at U.C. Irvine93 and
the Santa Ana Unified School District in Orange
County94 have found that Latino children are
twice as likely as Caucasian children to be injured
or killed in pedestrian-vehicle accidents. Other
studies have found that African American chil-
dren face a significantly higher risk of pedestrian
injury compared to other children.95
Additionally, a recent analysis by the Los Angeles
Times found that fatal pedestrian accidents,
including hit-and-run deaths, are heaviest in
communities with large African American and
Latino populations, such as South and Southeast
Los Angeles.96
The disproportionate rate of pedestrian injury
and death among children of color is explained,
at least in part, by correlations between ethnicity
and household income. As mentioned earlier,
Latino, African American and Native American
22
CAN’T GET THERE FROM HERE The Declining Independent Mobility of California’s Children and Youth
Table 8: California Counties with the Highest Percentage of Traffic Accidents
Involving Child Pedestrians (2001)
County Percentage of Total PedestrianIncidents Involving Children
Aged 0-17
1. Yolo ........................................................56.1%
2. Merced ...................................................54.2%
3. Contra Costa..........................................42.9%
4. Kern .......................................................47.8%
5. San Joaquin............................................45.3%
Sources: 2001 Provisional numbers from the California HighwayPatrol's Statewide Integrated Traffic Records System (SWITRS)
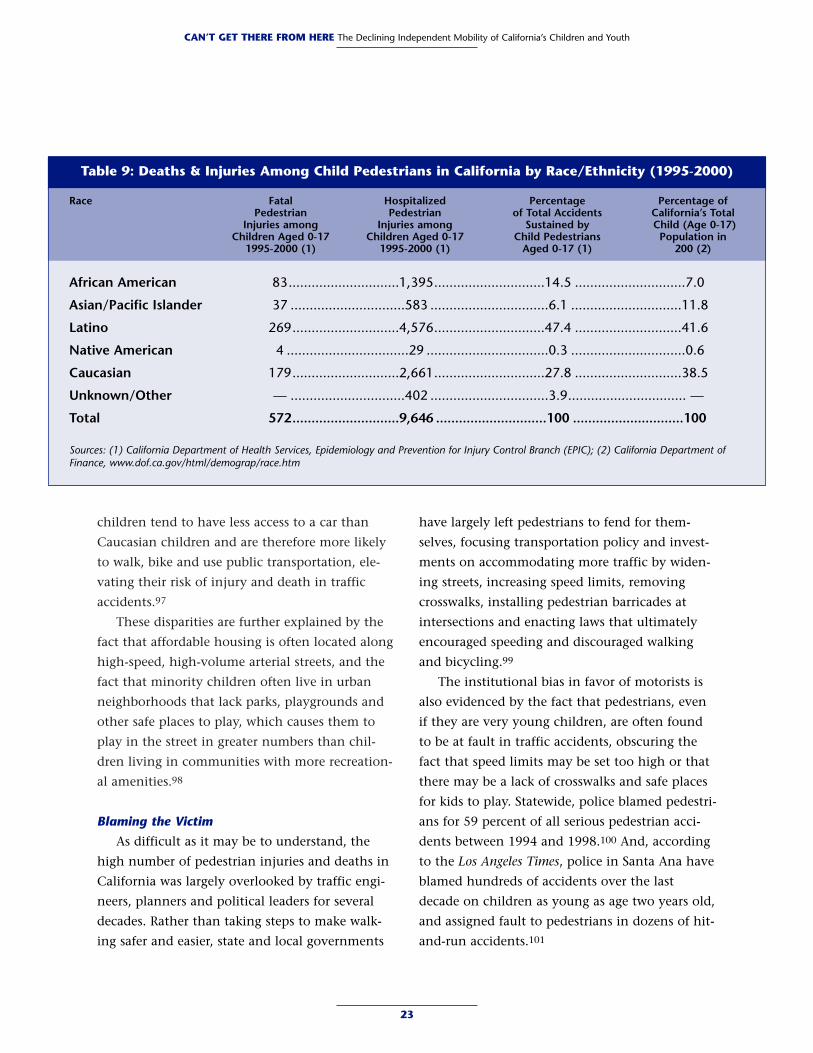
children tend to have less access to a car than
Caucasian children and are therefore more likely
to walk, bike and use public transportation, ele-
vating their risk of injury and death in traffic
accidents.97
These disparities are further explained by the
fact that affordable housing is often located along
high-speed, high-volume arterial streets, and the
fact that minority children often live in urban
neighborhoods that lack parks, playgrounds and
other safe places to play, which causes them to
play in the street in greater numbers than chil-
dren living in communities with more recreation-
al amenities.98
Blaming the Victim
As difficult as it may be to understand, the
high number of pedestrian injuries and deaths in
California was largely overlooked by traffic engi-
neers, planners and political leaders for several
decades. Rather than taking steps to make walk-
ing safer and easier, state and local governments
have largely left pedestrians to fend for them-
selves, focusing transportation policy and invest-
ments on accommodating more traffic by widen-
ing streets, increasing speed limits, removing
crosswalks, installing pedestrian barricades at
intersections and enacting laws that ultimately
encouraged speeding and discouraged walking
and bicycling.99
The institutional bias in favor of motorists is
also evidenced by the fact that pedestrians, even
if they are very young children, are often found
to be at fault in traffic accidents, obscuring the
fact that speed limits may be set too high or that
there may be a lack of crosswalks and safe places
for kids to play. Statewide, police blamed pedestri-
ans for 59 percent of all serious pedestrian acci-
dents between 1994 and 1998.100 And, according
to the Los Angeles Times, police in Santa Ana have
blamed hundreds of accidents over the last
decade on children as young as age two years old,
and assigned fault to pedestrians in dozens of hit-
and-run accidents.101
23
CAN’T GET THERE FROM HERE The Declining Independent Mobility of California’s Children and Youth
Table 9: Deaths & Injuries Among Child Pedestrians in California by Race/Ethnicity (1995-2000)
Race Fatal Hospitalized Percentage Percentage ofPedestrian Pedestrian of Total Accidents California’s Total
Injuries among Injuries among Sustained by Child (Age 0-17)Children Aged 0-17 Children Aged 0-17 Child Pedestrians Population in
1995-2000 (1) 1995-2000 (1) Aged 0-17 (1) 200 (2)
African American 83.............................1,395.............................14.5 .............................7.0
Asian/Pacific Islander 37 ..............................583 ...............................6.1 .............................11.8
Latino 269............................4,576.............................47.4 ............................41.6
Native American 4 ................................29 ................................0.3 ..............................0.6
Caucasian 179............................2,661.............................27.8 ............................38.5
Unknown/Other — ..............................402 ...............................3.9............................... —
Total 572............................9,646 .............................100 .............................100
Sources: (1) California Department of Health Services, Epidemiology and Prevention for Injury Control Branch (EPIC); (2) California Department ofFinance, www.dof.ca.gov/html/demograp/race.htm
Furthermore, police reports are often designed
to describe pedestrian-vehicle collisions in terms
of what the pedestrian did wrong,102 and seldom
note the actions of the driver or the speed of the
vehicle — despite the fact that drivers are often at
fault in pedestrian-vehicle collisions. A 2003
analysis by the San Francisco Chronicle found, for
example, that nearly 8 percent of all fatal crashes
in California involved hit-and-run drivers in
2001, a higher rate than any other state.104 And
UCLA researchers found in 1997 that 25 percent
of all pediatric pedestrian injuries involved hit-
and-run drivers.104
Speeding is a particular problem around
schools. One national survey found that two-thirds
of drivers in school zones exceeded the posted
speed limit during the before- and after-school
hours, despite the fact that 85 percent of these
zones had one or more safety measures, such as
crosswalks, flashing lights or a crossing guard in
place.105 The survey also found that one-third of
drivers in school zones were traveling at speeds of
30 mph or more, an issue of concern given that
pedestrians are eight times more likely to die if
struck by a vehicle moving at 30 mph than they
are if the vehicle is traveling at 20 mph or less.106
The Cost of Pedestrian AccidentsAlthough spending on pedestrian safety proj-
ects remains a low priority in most local, regional
and state transportation funding programs,
health providers, private companies and families
are spending billions of dollars as a result of
pedestrian injuries and deaths. In California, hos-
pital and physician charges, drug prescriptions,
physical rehabilitation and other medical expens-
es for injuries and fatalities sustained in motor
vehicle accidents by child pedestrians and bicy-
clists under the age of 18 topped $138 million in
2001 — a cost only partially covered by health
insurance providers (see Tables 10A and 10B).107
Yet these initial costs do not factor in property
damage, missed school, lost work wages or such
“quality of life” costs as pain and suffering. When
these costs are factored in, motor vehicle accidents
involving child pedestrians and bicyclists cost
California more than $1.2 billion in 2001, accord-
ing to estimates by the Pacific Institute for
Research & Evaluation’s Children’s Safety Network:
Economics and Data Analysis Resource Center.108
The burden of paying any out of pocket
expenses not covered by insurance carriers falls
heaviest on low-income and minority families —
those who, in many instances, can least afford it
— as their children are disproportionately repre-
sented as victims of pedestrian-vehicle collisions.
More Kids Injured in Cars Than by Cars
Even more astounding than the cost of acci-
dents involving child pedestrians and bicyclists,
however, is the amount of money lost as a result
of injuries and deaths sustained by children rid-
ing inside private vehicles. Although statistics
show that walking and biking are the most dan-
gerous ways for children to get around on a per-
mile-traveled basis, far more children are injured
or killed as passengers in motor vehicles.109 One
national study found, for example, that walking
and bicycling together accounted for 11 percent
of the injuries sustained by children commuting
24
CAN’T GET THERE FROM HERE The Declining Independent Mobility of California’s Children and Youth
“We live less than a mile from Patrick’s
school, but we choose to drive rather walk
to school. It’s a narrow sidewalk, and
there’s a busy street we have to cross.”
— Mother of 7-year-old Patrick, San Diego County
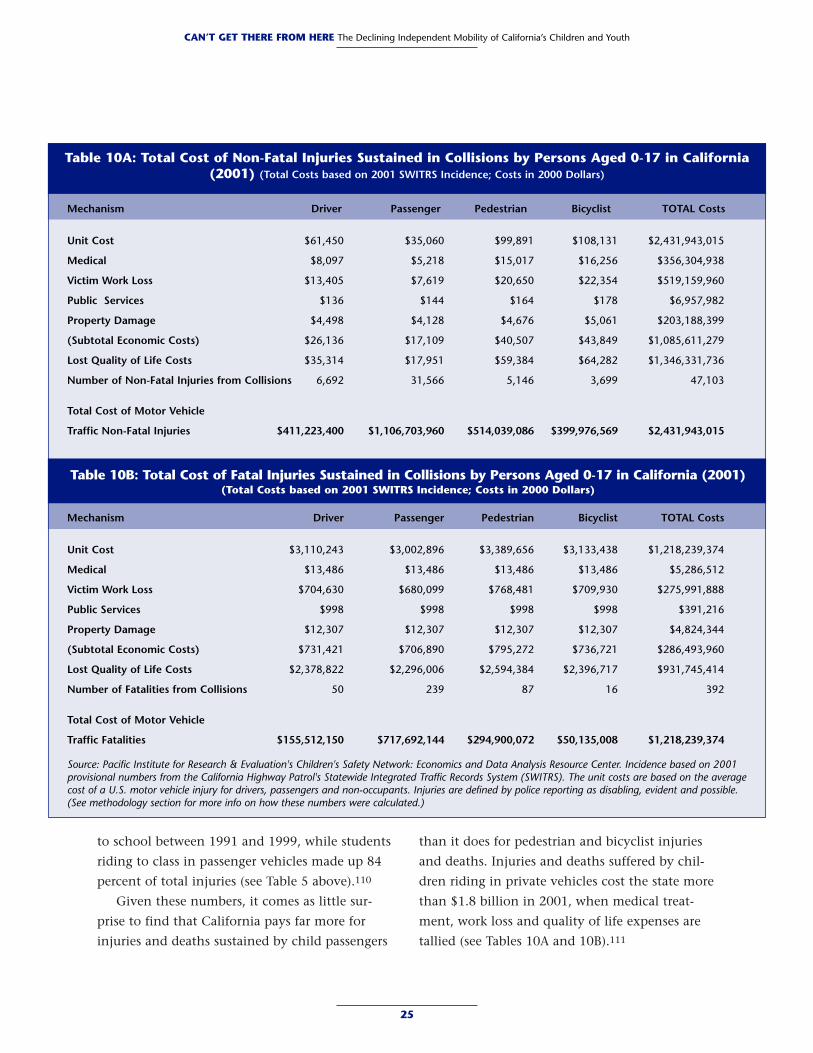
to school between 1991 and 1999, while students
riding to class in passenger vehicles made up 84
percent of total injuries (see Table 5 above).110
Given these numbers, it comes as little sur-
prise to find that California pays far more for
injuries and deaths sustained by child passengers
than it does for pedestrian and bicyclist injuries
and deaths. Injuries and deaths suffered by chil-
dren riding in private vehicles cost the state more
than $1.8 billion in 2001, when medical treat-
ment, work loss and quality of life expenses are
tallied (see Tables 10A and 10B).111
25
CAN’T GET THERE FROM HERE The Declining Independent Mobility of California’s Children and Youth
Table 10A: Total Cost of Non-Fatal Injuries Sustained in Collisions by Persons Aged 0-17 in California(2001) (Total Costs based on 2001 SWITRS Incidence; Costs in 2000 Dollars)
Mechanism Driver Passenger Pedestrian Bicyclist TOTAL Costs
Unit Cost $61,450 $35,060 $99,891 $108,131 $2,431,943,015
Medical $8,097 $5,218 $15,017 $16,256 $356,304,938
Victim Work Loss $13,405 $7,619 $20,650 $22,354 $519,159,960
Public Services $136 $144 $164 $178 $6,957,982
Property Damage $4,498 $4,128 $4,676 $5,061 $203,188,399
(Subtotal Economic Costs) $26,136 $17,109 $40,507 $43,849 $1,085,611,279
Lost Quality of Life Costs $35,314 $17,951 $59,384 $64,282 $1,346,331,736
Number of Non-Fatal Injuries from Collisions 6,692 31,566 5,146 3,699 47,103
Total Cost of Motor Vehicle
Traffic Non-Fatal Injuries $411,223,400 $1,106,703,960 $514,039,086 $399,976,569 $2,431,943,015
Table 10B: Total Cost of Fatal Injuries Sustained in Collisions by Persons Aged 0-17 in California (2001)(Total Costs based on 2001 SWITRS Incidence; Costs in 2000 Dollars)
Mechanism Driver Passenger Pedestrian Bicyclist TOTAL Costs
Unit Cost $3,110,243 $3,002,896 $3,389,656 $3,133,438 $1,218,239,374
Medical $13,486 $13,486 $13,486 $13,486 $5,286,512
Victim Work Loss $704,630 $680,099 $768,481 $709,930 $275,991,888
Public Services $998 $998 $998 $998 $391,216
Property Damage $12,307 $12,307 $12,307 $12,307 $4,824,344
(Subtotal Economic Costs) $731,421 $706,890 $795,272 $736,721 $286,493,960
Lost Quality of Life Costs $2,378,822 $2,296,006 $2,594,384 $2,396,717 $931,745,414
Number of Fatalities from Collisions 50 239 87 16 392
Total Cost of Motor Vehicle
Traffic Fatalities $155,512,150 $717,692,144 $294,900,072 $50,135,008 $1,218,239,374
Source: Pacific Institute for Research & Evaluation's Children's Safety Network: Economics and Data Analysis Resource Center. Incidence based on 2001provisional numbers from the California Highway Patrol's Statewide Integrated Traffic Records System (SWITRS). The unit costs are based on the averagecost of a U.S. motor vehicle injury for drivers, passengers and non-occupants. Injuries are defined by police reporting as disabling, evident and possible.(See methodology section for more info on how these numbers were calculated.)
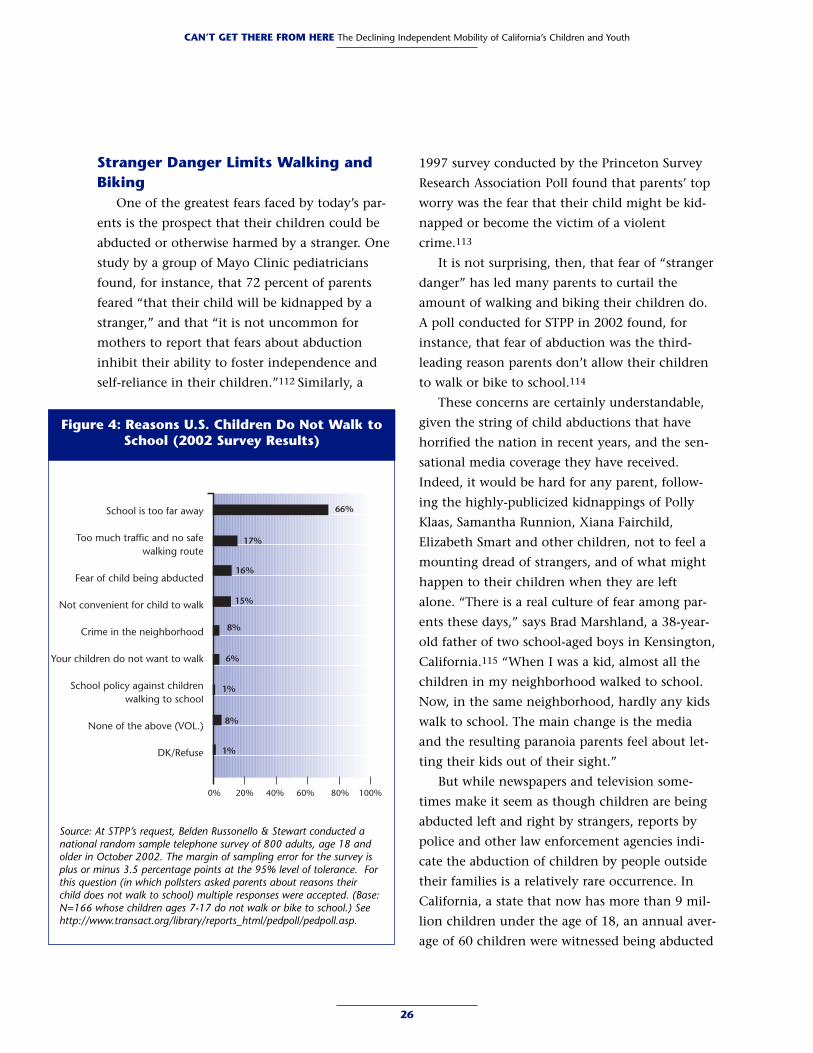
Stranger Danger Limits Walking andBiking
One of the greatest fears faced by today’s par-
ents is the prospect that their children could be
abducted or otherwise harmed by a stranger. One
study by a group of Mayo Clinic pediatricians
found, for instance, that 72 percent of parents
feared “that their child will be kidnapped by a
stranger,” and that “it is not uncommon for
mothers to report that fears about abduction
inhibit their ability to foster independence and
self-reliance in their children.”112 Similarly, a
1997 survey conducted by the Princeton Survey
Research Association Poll found that parents’ top
worry was the fear that their child might be kid-
napped or become the victim of a violent
crime.113
It is not surprising, then, that fear of “stranger
danger” has led many parents to curtail the
amount of walking and biking their children do.
A poll conducted for STPP in 2002 found, for
instance, that fear of abduction was the third-
leading reason parents don’t allow their children
to walk or bike to school.114
These concerns are certainly understandable,
given the string of child abductions that have
horrified the nation in recent years, and the sen-
sational media coverage they have received.
Indeed, it would be hard for any parent, follow-
ing the highly-publicized kidnappings of Polly
Klaas, Samantha Runnion, Xiana Fairchild,
Elizabeth Smart and other children, not to feel a
mounting dread of strangers, and of what might
happen to their children when they are left
alone. “There is a real culture of fear among par-
ents these days,” says Brad Marshland, a 38-year-
old father of two school-aged boys in Kensington,
California.115 “When I was a kid, almost all the
children in my neighborhood walked to school.
Now, in the same neighborhood, hardly any kids
walk to school. The main change is the media
and the resulting paranoia parents feel about let-
ting their kids out of their sight.”
But while newspapers and television some-
times make it seem as though children are being
abducted left and right by strangers, reports by
police and other law enforcement agencies indi-
cate the abduction of children by people outside
their families is a relatively rare occurrence. In
California, a state that now has more than 9 mil-
lion children under the age of 18, an annual aver-
age of 60 children were witnessed being abducted
26
CAN’T GET THERE FROM HERE The Declining Independent Mobility of California’s Children and Youth
Figure 4: Reasons U.S. Children Do Not Walk toSchool (2002 Survey Results)
School is too far away
Too much traffic and no safewalking route
Fear of child being abducted
Not convenient for child to walk
Crime in the neighborhood
Your children do not want to walk
School policy against childrenwalking to school
None of the above (VOL.)
DK/Refuse
0% 20% 40% 60% 80% 100%
66%
17%
16%
15%
8%
6%
1%
8%
1%
Source: At STPP’s request, Belden Russonello & Stewart conducted anational random sample telephone survey of 800 adults, age 18 andolder in October 2002. The margin of sampling error for the survey isplus or minus 3.5 percentage points at the 95% level of tolerance. Forthis question (in which pollsters asked parents about reasons theirchild does not walk to school) multiple responses were accepted. (Base:N=166 whose children ages 7-17 do not walk or bike to school.) Seehttp://www.transact.org/library/reports_html/pedpoll/pedpoll.asp.
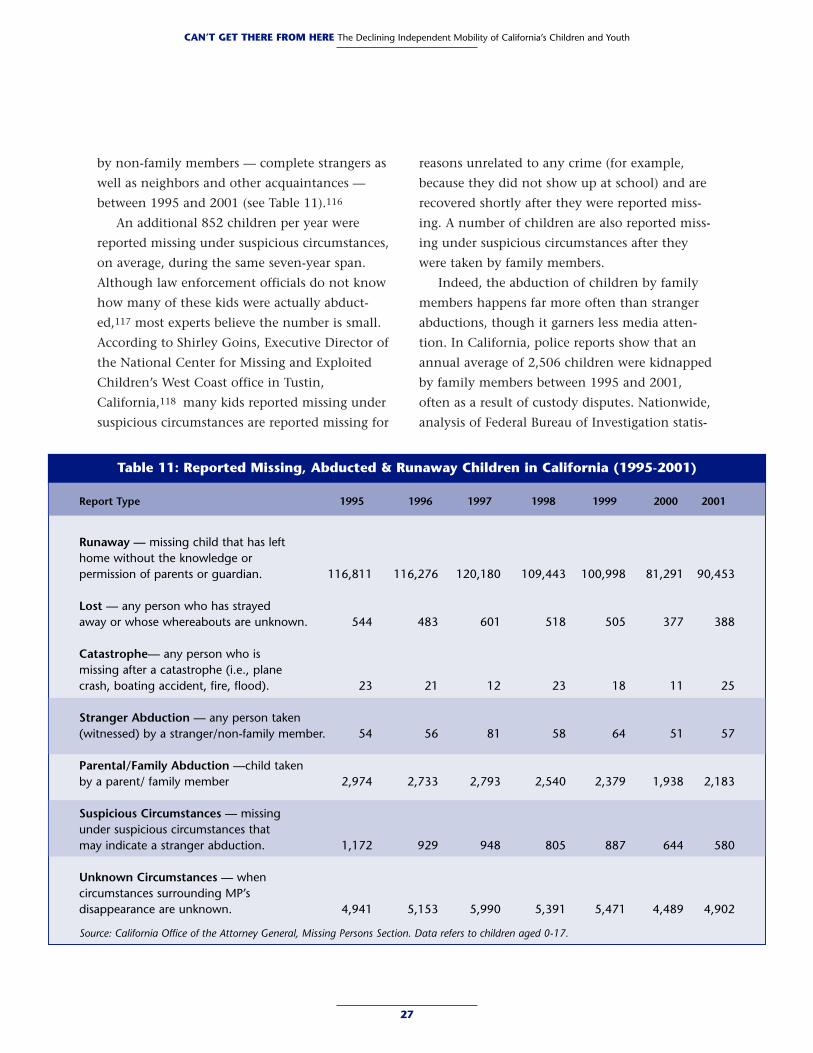
by non-family members — complete strangers as
well as neighbors and other acquaintances —
between 1995 and 2001 (see Table 11).116
An additional 852 children per year were
reported missing under suspicious circumstances,
on average, during the same seven-year span.
Although law enforcement officials do not know
how many of these kids were actually abduct-
ed,117 most experts believe the number is small.
According to Shirley Goins, Executive Director of
the National Center for Missing and Exploited
Children’s West Coast office in Tustin,
California,118 many kids reported missing under
suspicious circumstances are reported missing for
reasons unrelated to any crime (for example,
because they did not show up at school) and are
recovered shortly after they were reported miss-
ing. A number of children are also reported miss-
ing under suspicious circumstances after they
were taken by family members.
Indeed, the abduction of children by family
members happens far more often than stranger
abductions, though it garners less media atten-
tion. In California, police reports show that an
annual average of 2,506 children were kidnapped
by family members between 1995 and 2001,
often as a result of custody disputes. Nationwide,
analysis of Federal Bureau of Investigation statis-
27
CAN’T GET THERE FROM HERE The Declining Independent Mobility of California’s Children and Youth
Table 11: Reported Missing, Abducted & Runaway Children in California (1995-2001)
Report Type 1995 1996 1997 1998 1999 2000 2001
Runaway — missing child that has left home without the knowledge or permission of parents or guardian. 116,811 116,276 120,180 109,443 100,998 81,291 90,453
Lost — any person who has strayed away or whose whereabouts are unknown. 544 483 601 518 505 377 388
Catastrophe— any person who is missing after a catastrophe (i.e., plane crash, boating accident, fire, flood). 23 21 12 23 18 11 25
Stranger Abduction — any person taken (witnessed) by a stranger/non-family member. 54 56 81 58 64 51 57
Parental/Family Abduction —child taken by a parent/ family member 2,974 2,733 2,793 2,540 2,379 1,938 2,183
Suspicious Circumstances — missing under suspicious circumstances that may indicate a stranger abduction. 1,172 929 948 805 887 644 580
Unknown Circumstances — when circumstances surrounding MP’s disappearance are unknown. 4,941 5,153 5,990 5,391 5,471 4,489 4,902
Source: California Office of the Attorney General, Missing Persons Section. Data refers to children aged 0-17.
tics shows that kidnapping by a stranger accounts
for less than one-quarter (24%) of total child
abductions.119 National data also suggest that kid-
nappings of all types — by strangers as well as
family members — account for just 1.5 percent of
all violent crimes against juveniles.120
This is not to downplay parents’ fear of
stranger abductions, or to say parents should be
more concerned that their kids could be snatched
by other family members. For starters, stranger
abductions, though less prevalent, are more dan-
gerous than those committed by relatives.
Furthermore, the very nature of these crimes —
the violation of their children by an unknown
person — is enough to panic parents, no matter
how slim the chance that it will happen to their
child.
“The bottom line is that fear of abductions
will remain a very real barrier [to walking and
biking by children] so long as there is even one of
these cases per year. Protecting the personal safety
of children is part of parents’ programming,” says
Shirley Goins of the National Center for Missing
and Exploited Children.121
Driving Children Doesn’t Necessarily Protect
Them
Although discouraging children from walking
around or playing outdoors, and opting instead
to drive them everywhere they need or want to
go, may reduce the likelihood of stranger abduc-
tion, it does little to improve children’s overall
safety. Statistics show, for example, that children
are far more likely to be harmed while traveling
in a motor vehicle than they are to be abducted
by a stranger. While a total of 364 children under
the age of 18 were witnessed being abducted by
strangers in California between 1995 and 2000,
more than 17,000 were killed or injured badly
enough to require hospitalization while riding in
private vehicles (see Table 12).122
Moreover, preventing children from getting
around by foot or bicycle is not a surefire way to
protect them from abductions because these crimes
don’t happen only when children are on the street
journeying from point A to point B. Many stranger
abductions have occurred in homes, malls, video
arcades and other seemingly safe destinations.
Polly Klaas, for example, was kidnapped from her
bedroom in Petaluma in 1993, and nine-year-old
Jeanette Tamayo was taken from the garage of her
San Jose home in June 2003.
Additionally, increases in child-chauffeuring
may actually heighten the risk of abduction for
other children by reducing the overall number of
people on streets, trails, parks, playgrounds and
other public places. When streets and neighbor-
hoods have high levels of pedestrian activity,
28
CAN’T GET THERE FROM HERE The Declining Independent Mobility of California’s Children and YouthFA
TIM
A A
NG
ELES
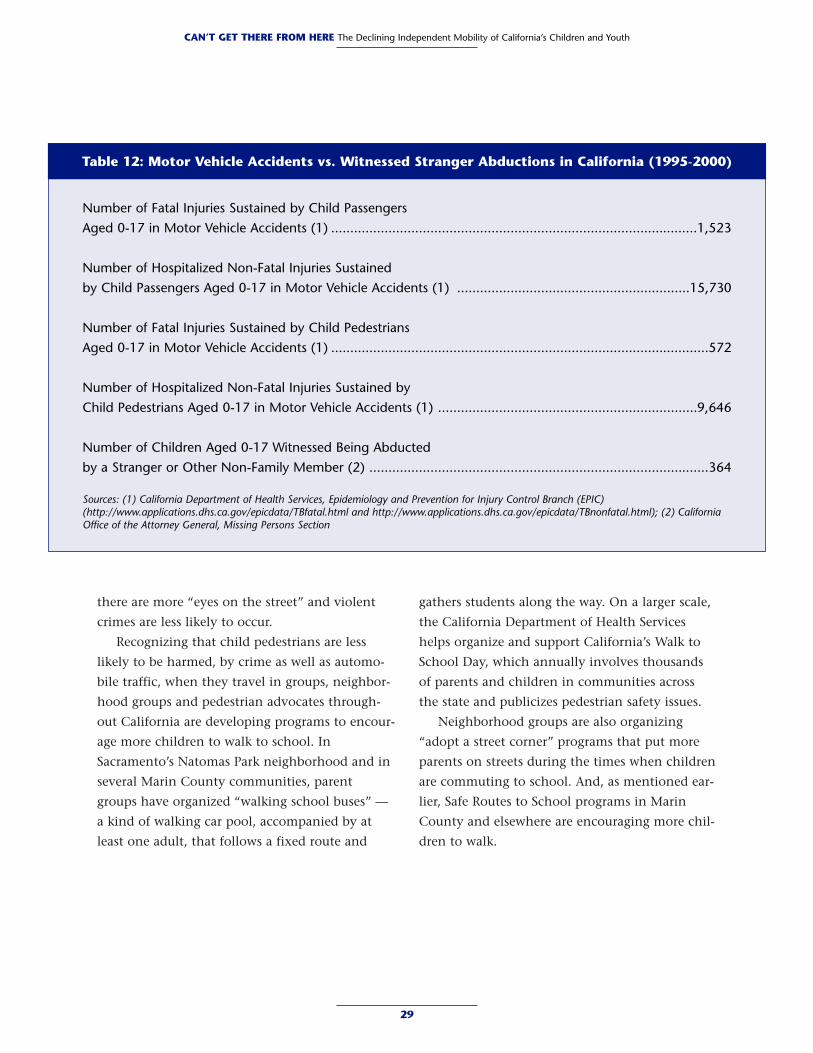
there are more “eyes on the street” and violent
crimes are less likely to occur.
Recognizing that child pedestrians are less
likely to be harmed, by crime as well as automo-
bile traffic, when they travel in groups, neighbor-
hood groups and pedestrian advocates through-
out California are developing programs to encour-
age more children to walk to school. In
Sacramento’s Natomas Park neighborhood and in
several Marin County communities, parent
groups have organized “walking school buses” —
a kind of walking car pool, accompanied by at
least one adult, that follows a fixed route and
gathers students along the way. On a larger scale,
the California Department of Health Services
helps organize and support California’s Walk to
School Day, which annually involves thousands
of parents and children in communities across
the state and publicizes pedestrian safety issues.
Neighborhood groups are also organizing
“adopt a street corner” programs that put more
parents on streets during the times when children
are commuting to school. And, as mentioned ear-
lier, Safe Routes to School programs in Marin
County and elsewhere are encouraging more chil-
dren to walk.
29
CAN’T GET THERE FROM HERE The Declining Independent Mobility of California’s Children and Youth
Table 12: Motor Vehicle Accidents vs. Witnessed Stranger Abductions in California (1995-2000)
Number of Fatal Injuries Sustained by Child Passengers Aged 0-17 in Motor Vehicle Accidents (1) ................................................................................................1,523
Number of Hospitalized Non-Fatal Injuries Sustained by Child Passengers Aged 0-17 in Motor Vehicle Accidents (1) .............................................................15,730
Number of Fatal Injuries Sustained by Child Pedestrians Aged 0-17 in Motor Vehicle Accidents (1) ...................................................................................................572
Number of Hospitalized Non-Fatal Injuries Sustained by Child Pedestrians Aged 0-17 in Motor Vehicle Accidents (1) ....................................................................9,646
Number of Children Aged 0-17 Witnessed Being Abducted by a Stranger or Other Non-Family Member (2) .........................................................................................364
Sources: (1) California Department of Health Services, Epidemiology and Prevention for Injury Control Branch (EPIC)(http://www.applications.dhs.ca.gov/epicdata/TBfatal.html and http://www.applications.dhs.ca.gov/epicdata/TBnonfatal.html); (2) CaliforniaOffice of the Attorney General, Missing Persons Section
The lack of transportation options is taking
a physical toll on California’s children, not
only by raising their exposure to traffic
dangers but also by contributing to a rising preva-
lence of asthma and weight-related health prob-
lems among children.
Less Physical Activity, More OverweightKids
Declines in physical activity among children
have been linked to rising prevalence of child-
hood overweight and related health problems
since at least the 1950s. “There is deep concern in
high places over the fitness of American youth,”
began one U.S. News & World Report article from
1957. “Parents are being warned that their chil-
dren — taken to school in buses, chauffeured to
activities, freed from muscle-building chores and
entertained in front of TV sets — are getting soft
and flabby.”123
Five decades later, these trends have become
cause for even greater concern. While the amount
of exercise children get has continued to wane
and their dependence on automobiles has intensi-
fied, the number of fat and out-of-shape children
has reached epidemic proportions. Nationwide,
the percentage of overweight* children between
the ages of six and 17 has more than tripled from
about 5 percent in the 1960s to more than 15
percent today.124 An additional 14 percent are at
risk of becoming overweight,125 meaning that
more than one in four American children are
now overweight or at risk.
California is no exception. Recent surveys
have found that more than one in five (21%) of
the state’s teenagers,126 and more than one-third
(34%) of children aged nine to 11,127 are either at
risk or overweight. Another study, which calculat-
ed children’s weight categories based on height,
weight, gender and age, found that more than
one-quarter of California’s fifth-, seventh- and
ninth-grade schoolchildren (26.5%) are over-
weight.128 “The numbers vary from study to
study, but it’s clear that California’s kids are get-
ting bigger,” says Gail Woodward-Lopez, Associate
Director of U.C. Berkeley’s Center for Weight and
Health.129
A large number of California’s children are also
California’s Lack of Transportation Options Harms
the Health of Children
C H A P T E R 4
30
* Children with a Body Mass Index (BMI) above the gender- and age-specific 95th percentile, based on the CDC’s GrowthCharts for the United States, are defined as “overweight.” Children with a BMI between the 85th and 95th percentile areconsidered “at risk” of becoming overweight.
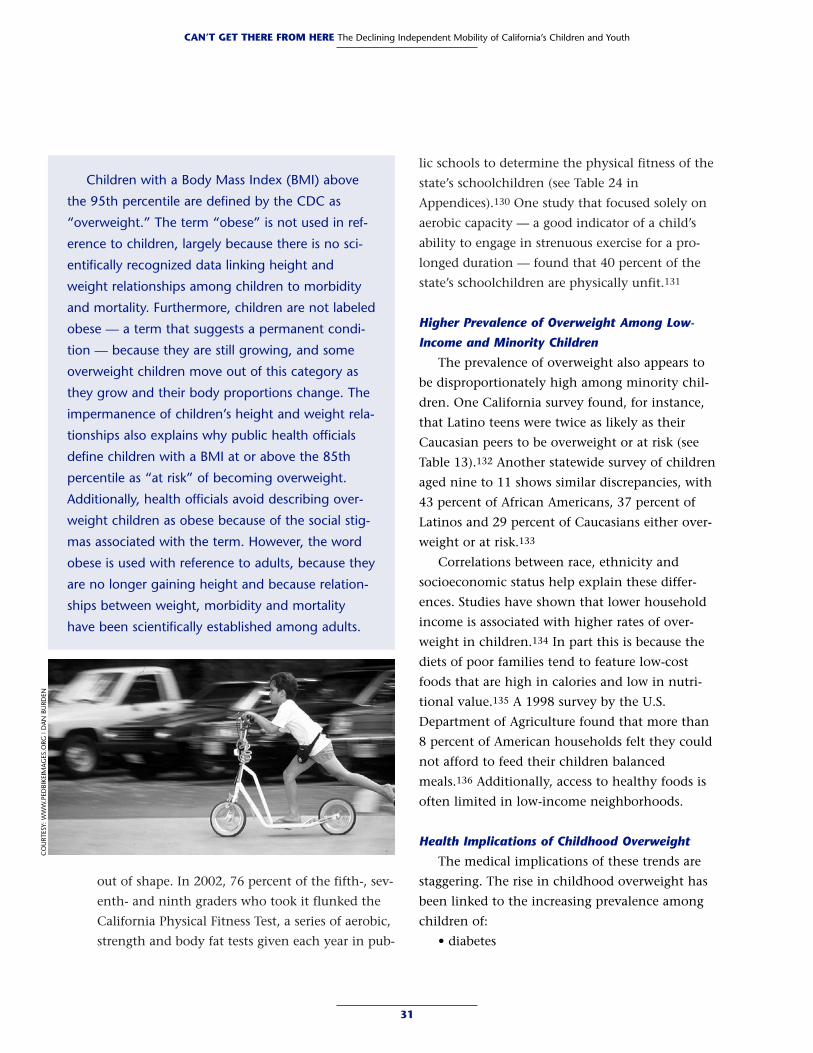
out of shape. In 2002, 76 percent of the fifth-, sev-
enth- and ninth graders who took it flunked the
California Physical Fitness Test, a series of aerobic,
strength and body fat tests given each year in pub-
lic schools to determine the physical fitness of the
state’s schoolchildren (see Table 24 in
Appendices).130 One study that focused solely on
aerobic capacity — a good indicator of a child’s
ability to engage in strenuous exercise for a pro-
longed duration — found that 40 percent of the
state’s schoolchildren are physically unfit.131
Higher Prevalence of Overweight Among Low-
Income and Minority Children
The prevalence of overweight also appears to
be disproportionately high among minority chil-
dren. One California survey found, for instance,
that Latino teens were twice as likely as their
Caucasian peers to be overweight or at risk (see
Table 13).132 Another statewide survey of children
aged nine to 11 shows similar discrepancies, with
43 percent of African Americans, 37 percent of
Latinos and 29 percent of Caucasians either over-
weight or at risk.133
Correlations between race, ethnicity and
socioeconomic status help explain these differ-
ences. Studies have shown that lower household
income is associated with higher rates of over-
weight in children.134 In part this is because the
diets of poor families tend to feature low-cost
foods that are high in calories and low in nutri-
tional value.135 A 1998 survey by the U.S.
Department of Agriculture found that more than
8 percent of American households felt they could
not afford to feed their children balanced
meals.136 Additionally, access to healthy foods is
often limited in low-income neighborhoods.
Health Implications of Childhood Overweight
The medical implications of these trends are
staggering. The rise in childhood overweight has
been linked to the increasing prevalence among
children of:
• diabetes
31
CAN’T GET THERE FROM HERE The Declining Independent Mobility of California’s Children and Youth
Children with a Body Mass Index (BMI) above
the 95th percentile are defined by the CDC as
“overweight.” The term “obese” is not used in ref-
erence to children, largely because there is no sci-
entifically recognized data linking height and
weight relationships among children to morbidity
and mortality. Furthermore, children are not labeled
obese — a term that suggests a permanent condi-
tion — because they are still growing, and some
overweight children move out of this category as
they grow and their body proportions change. The
impermanence of children’s height and weight rela-
tionships also explains why public health officials
define children with a BMI at or above the 85th
percentile as “at risk” of becoming overweight.
Additionally, health officials avoid describing over-
weight children as obese because of the social stig-
mas associated with the term. However, the word
obese is used with reference to adults, because they
are no longer gaining height and because relation-
ships between weight, morbidity and mortality
have been scientifically established among adults.
CO
URT
ESY:
WW
W.P
EDBI
KEIM
AG
ES.O
RG |
DA
N B
URD
EN
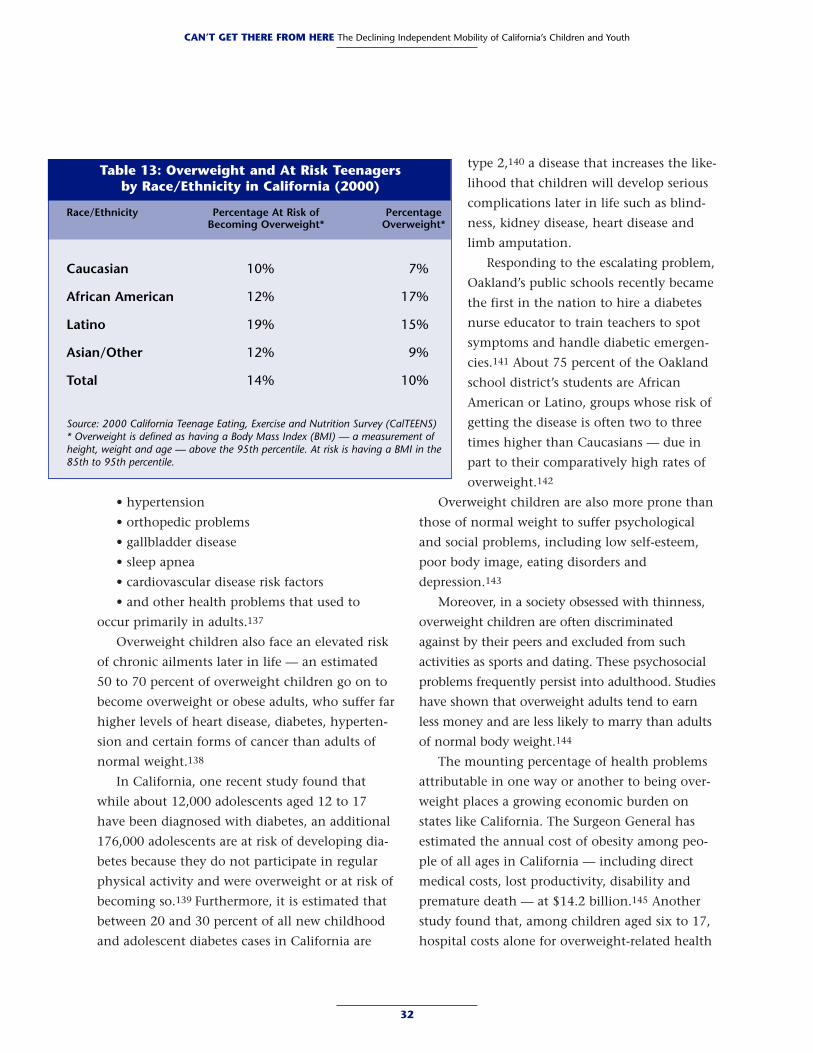
• hypertension
• orthopedic problems
• gallbladder disease
• sleep apnea
• cardiovascular disease risk factors
• and other health problems that used to
occur primarily in adults.137
Overweight children also face an elevated risk
of chronic ailments later in life — an estimated
50 to 70 percent of overweight children go on to
become overweight or obese adults, who suffer far
higher levels of heart disease, diabetes, hyperten-
sion and certain forms of cancer than adults of
normal weight.138
In California, one recent study found that
while about 12,000 adolescents aged 12 to 17
have been diagnosed with diabetes, an additional
176,000 adolescents are at risk of developing dia-
betes because they do not participate in regular
physical activity and were overweight or at risk of
becoming so.139 Furthermore, it is estimated that
between 20 and 30 percent of all new childhood
and adolescent diabetes cases in California are
type 2,140 a disease that increases the like-
lihood that children will develop serious
complications later in life such as blind-
ness, kidney disease, heart disease and
limb amputation.
Responding to the escalating problem,
Oakland’s public schools recently became
the first in the nation to hire a diabetes
nurse educator to train teachers to spot
symptoms and handle diabetic emergen-
cies.141 About 75 percent of the Oakland
school district’s students are African
American or Latino, groups whose risk of
getting the disease is often two to three
times higher than Caucasians — due in
part to their comparatively high rates of
overweight.142
Overweight children are also more prone than
those of normal weight to suffer psychological
and social problems, including low self-esteem,
poor body image, eating disorders and
depression.143
Moreover, in a society obsessed with thinness,
overweight children are often discriminated
against by their peers and excluded from such
activities as sports and dating. These psychosocial
problems frequently persist into adulthood. Studies
have shown that overweight adults tend to earn
less money and are less likely to marry than adults
of normal body weight.144
The mounting percentage of health problems
attributable in one way or another to being over-
weight places a growing economic burden on
states like California. The Surgeon General has
estimated the annual cost of obesity among peo-
ple of all ages in California — including direct
medical costs, lost productivity, disability and
premature death — at $14.2 billion.145 Another
study found that, among children aged six to 17,
hospital costs alone for overweight-related health
32
CAN’T GET THERE FROM HERE The Declining Independent Mobility of California’s Children and Youth
Table 13: Overweight and At Risk Teenagers by Race/Ethnicity in California (2000)
Race/Ethnicity Percentage At Risk of Percentage Becoming Overweight* Overweight*
Caucasian 10% 7%
African American 12% 17%
Latino 19% 15%
Asian/Other 12% 9%
Total 14% 10%
Source: 2000 California Teenage Eating, Exercise and Nutrition Survey (CalTEENS)* Overweight is defined as having a Body Mass Index (BMI) — a measurement ofheight, weight and age — above the 95th percentile. At risk is having a BMI in the85th to 95th percentile.
problems more than tripled nationwide between
1979 and 1999, from $35 million to $127
million.146 And these numbers are probably an
understatement, as doctors often don’t record
weight problems on hospital discharge records
because insurance companies don’t pay to treat it
until a child is diagnosed with a formal illness.
Why Is This Happening?
Numerous factors have contributed to the
alarming increase in childhood overweight. The
problem is largely related to:
• Children’s increasing consumption of foods that
are high in fat and sugar, such as fast food and
soft drinks, and the trend toward “super-size”
portions.147
• Fewer activities that could burn off all these
calories. Although it is recommended that chil-
dren and adolescents perform at least 60 min-
utes of vigorous physical activity per day, only
three of 10 teens in California meet this stan-
dard.148 Moreover, the 1997 Youth Risk
Behavior Study (YRBS) showed that just 51 per-
cent of California high school students had par-
ticipated in at least 20 minutes of vigorous
activity on at least four of the previous seven
days.149
Part of the problem is the fact that children
are getting less exercise at school. One recent sur-
vey found that 17 percent of nine- to 11-year-olds
in California don’t receive any physical education
(PE) or gym classes at school,150 while another
survey shows that nearly half (44%) of the state’s
high school students do not participate in PE
classes.151 Children are also increasingly seden-
tary when at home. One survey found that
California teens now spend twice as much time
watching television or playing video games than
they do at sports or other physical activities.152
But the marked decline in such everyday
sources of exercise as walking and bike riding has
also contributed substantially to weight- and fit-
ness-related health problems among children.
Although such moderate forms of exercise
were once considered irrelevant to good health, a
number of recent studies have shown that walk-
ing or doing other moderate exercise for at least
30 minutes per day offers substantial health bene-
fits. Researchers at the University of Pittsburgh
School of Medicine have found, for example, that
“lifestyle” exercise such as walking to school have
an even greater impact on weight loss among
children than aerobic exercise.153
In a similar vein, researchers at the Harvard
School of Public Health have found that people
can reduce their risk of type 2 diabetes by as
much as 50 percent simply by accumulating one
hour per day of brisk walking or other moderate
exercise.154 “The activity can come from a variety
of sources throughout the day: walking to the bus
stop in the morning, taking the stairs at work or
running errands,” states the study’s lead author.
“It doesn’t have to mean going to the gym and
exercising furiously.”155
Research by the Surface Transportation Policy
Project also indicates strong relationships
between the amount of walking people do and
33
CAN’T GET THERE FROM HERE The Declining Independent Mobility of California’s Children and Youth
“Regular physical activity is probably as
close to a magic bullet as we will come
in modern medicine...If everyone in the
U.S. were to walk briskly 30 minutes a
day, we could cut the incidence of many
chronic diseases 30% to 40%.”
— Dr. JoAnn Manson, Chief of Preventive Medicine at
Harvard’s Brigham and Women’s Hospital
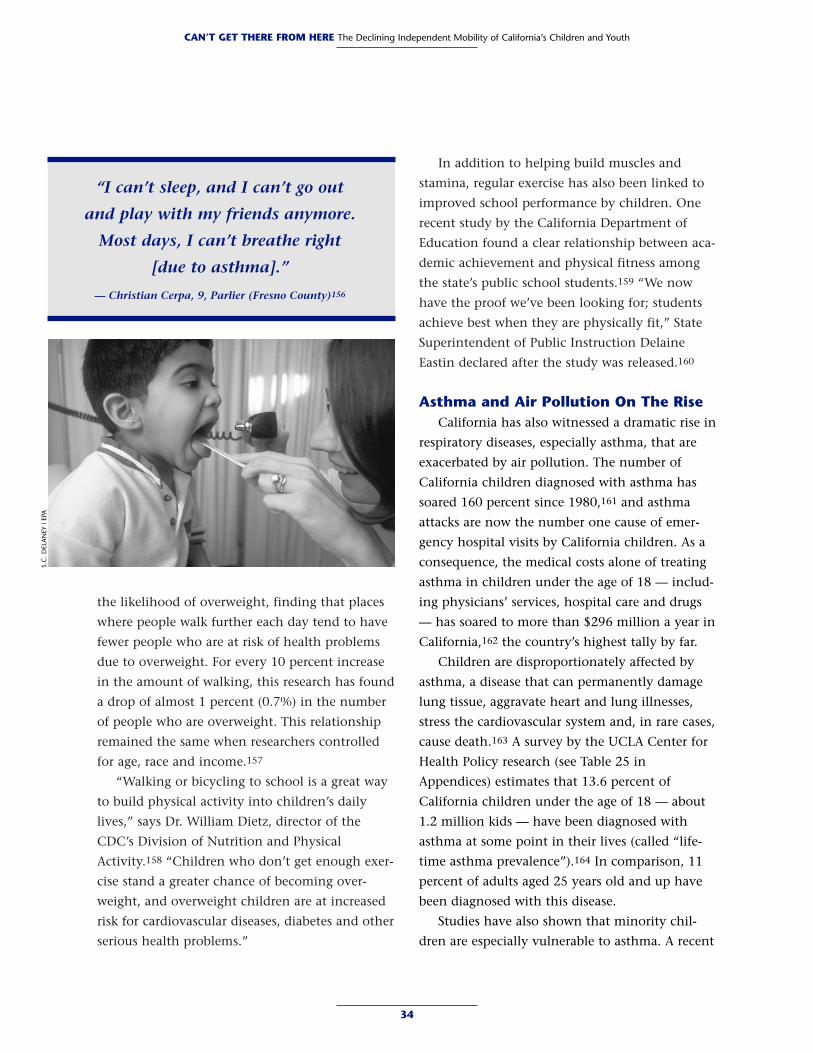
the likelihood of overweight, finding that places
where people walk further each day tend to have
fewer people who are at risk of health problems
due to overweight. For every 10 percent increase
in the amount of walking, this research has found
a drop of almost 1 percent (0.7%) in the number
of people who are overweight. This relationship
remained the same when researchers controlled
for age, race and income.157
“Walking or bicycling to school is a great way
to build physical activity into children’s daily
lives,” says Dr. William Dietz, director of the
CDC’s Division of Nutrition and Physical
Activity.158 “Children who don’t get enough exer-
cise stand a greater chance of becoming over-
weight, and overweight children are at increased
risk for cardiovascular diseases, diabetes and other
serious health problems.”
In addition to helping build muscles and
stamina, regular exercise has also been linked to
improved school performance by children. One
recent study by the California Department of
Education found a clear relationship between aca-
demic achievement and physical fitness among
the state’s public school students.159 “We now
have the proof we’ve been looking for; students
achieve best when they are physically fit,” State
Superintendent of Public Instruction Delaine
Eastin declared after the study was released.160
Asthma and Air Pollution On The Rise California has also witnessed a dramatic rise in
respiratory diseases, especially asthma, that are
exacerbated by air pollution. The number of
California children diagnosed with asthma has
soared 160 percent since 1980,161 and asthma
attacks are now the number one cause of emer-
gency hospital visits by California children. As a
consequence, the medical costs alone of treating
asthma in children under the age of 18 — includ-
ing physicians’ services, hospital care and drugs
— has soared to more than $296 million a year in
California,162 the country’s highest tally by far.
Children are disproportionately affected by
asthma, a disease that can permanently damage
lung tissue, aggravate heart and lung illnesses,
stress the cardiovascular system and, in rare cases,
cause death.163 A survey by the UCLA Center for
Health Policy research (see Table 25 in
Appendices) estimates that 13.6 percent of
California children under the age of 18 — about
1.2 million kids — have been diagnosed with
asthma at some point in their lives (called “life-
time asthma prevalence”).164 In comparison, 11
percent of adults aged 25 years old and up have
been diagnosed with this disease.
Studies have also shown that minority chil-
dren are especially vulnerable to asthma. A recent
34
CAN’T GET THERE FROM HERE The Declining Independent Mobility of California’s Children and Youth
“I can’t sleep, and I can’t go out
and play with my friends anymore.
Most days, I can’t breathe right
[due to asthma].”
— Christian Cerpa, 9, Parlier (Fresno County)156
S.C
. DEL
AN
EY |
EPA
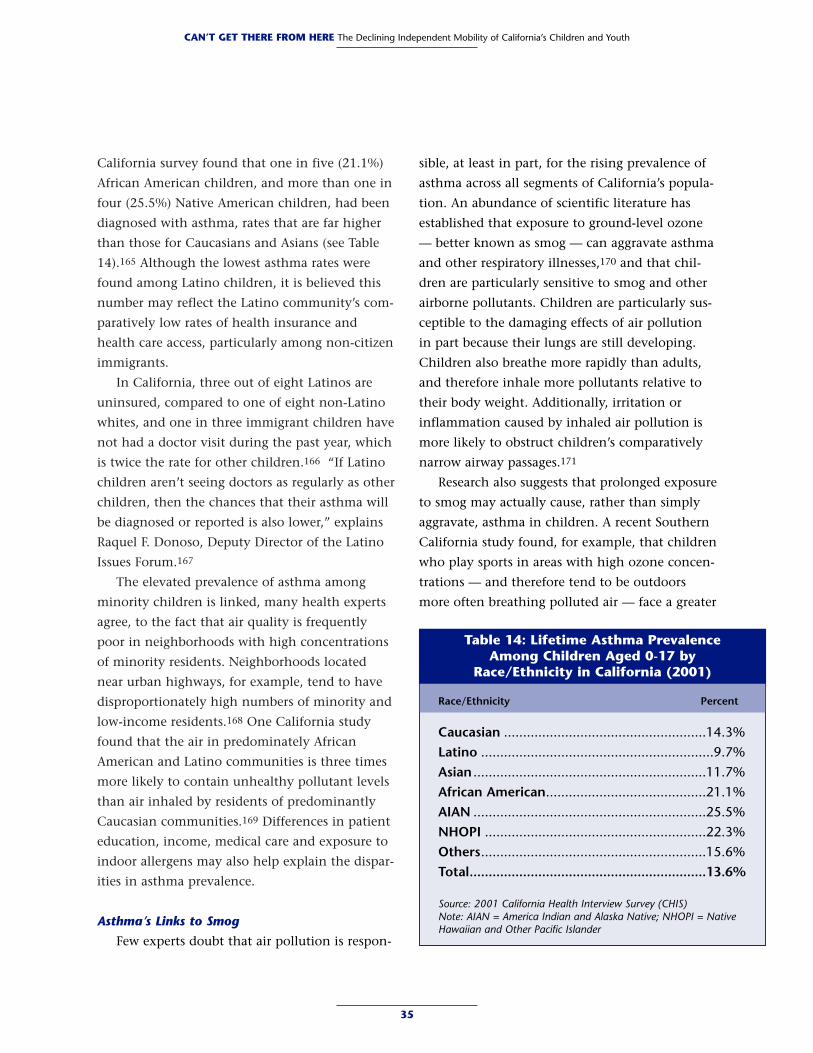
California survey found that one in five (21.1%)
African American children, and more than one in
four (25.5%) Native American children, had been
diagnosed with asthma, rates that are far higher
than those for Caucasians and Asians (see Table
14).165 Although the lowest asthma rates were
found among Latino children, it is believed this
number may reflect the Latino community’s com-
paratively low rates of health insurance and
health care access, particularly among non-citizen
immigrants.
In California, three out of eight Latinos are
uninsured, compared to one of eight non-Latino
whites, and one in three immigrant children have
not had a doctor visit during the past year, which
is twice the rate for other children.166 “If Latino
children aren’t seeing doctors as regularly as other
children, then the chances that their asthma will
be diagnosed or reported is also lower,” explains
Raquel F. Donoso, Deputy Director of the Latino
Issues Forum.167
The elevated prevalence of asthma among
minority children is linked, many health experts
agree, to the fact that air quality is frequently
poor in neighborhoods with high concentrations
of minority residents. Neighborhoods located
near urban highways, for example, tend to have
disproportionately high numbers of minority and
low-income residents.168 One California study
found that the air in predominately African
American and Latino communities is three times
more likely to contain unhealthy pollutant levels
than air inhaled by residents of predominantly
Caucasian communities.169 Differences in patient
education, income, medical care and exposure to
indoor allergens may also help explain the dispar-
ities in asthma prevalence.
Asthma’s Links to Smog
Few experts doubt that air pollution is respon-
sible, at least in part, for the rising prevalence of
asthma across all segments of California’s popula-
tion. An abundance of scientific literature has
established that exposure to ground-level ozone
— better known as smog — can aggravate asthma
and other respiratory illnesses,170 and that chil-
dren are particularly sensitive to smog and other
airborne pollutants. Children are particularly sus-
ceptible to the damaging effects of air pollution
in part because their lungs are still developing.
Children also breathe more rapidly than adults,
and therefore inhale more pollutants relative to
their body weight. Additionally, irritation or
inflammation caused by inhaled air pollution is
more likely to obstruct children’s comparatively
narrow airway passages.171
Research also suggests that prolonged exposure
to smog may actually cause, rather than simply
aggravate, asthma in children. A recent Southern
California study found, for example, that children
who play sports in areas with high ozone concen-
trations — and therefore tend to be outdoors
more often breathing polluted air — face a greater
35
CAN’T GET THERE FROM HERE The Declining Independent Mobility of California’s Children and Youth
Table 14: Lifetime Asthma Prevalence Among Children Aged 0-17 by
Race/Ethnicity in California (2001)
Race/Ethnicity Percent
Caucasian .....................................................14.3%Latino .............................................................9.7%Asian .............................................................11.7%African American..........................................21.1%AIAN .............................................................25.5%NHOPI ..........................................................22.3%Others...........................................................15.6%Total..............................................................13.6%
Source: 2001 California Health Interview Survey (CHIS) Note: AIAN = America Indian and Alaska Native; NHOPI = NativeHawaiian and Other Pacific Islander
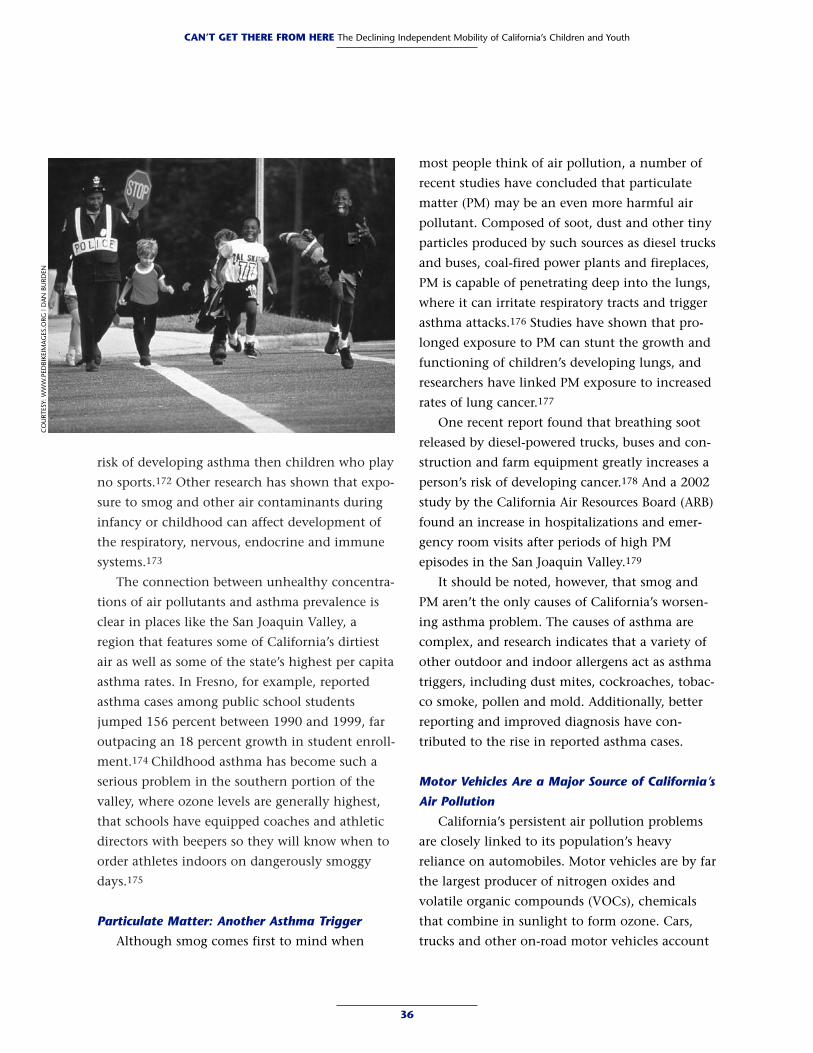
risk of developing asthma then children who play
no sports.172 Other research has shown that expo-
sure to smog and other air contaminants during
infancy or childhood can affect development of
the respiratory, nervous, endocrine and immune
systems.173
The connection between unhealthy concentra-
tions of air pollutants and asthma prevalence is
clear in places like the San Joaquin Valley, a
region that features some of California’s dirtiest
air as well as some of the state’s highest per capita
asthma rates. In Fresno, for example, reported
asthma cases among public school students
jumped 156 percent between 1990 and 1999, far
outpacing an 18 percent growth in student enroll-
ment.174 Childhood asthma has become such a
serious problem in the southern portion of the
valley, where ozone levels are generally highest,
that schools have equipped coaches and athletic
directors with beepers so they will know when to
order athletes indoors on dangerously smoggy
days.175
Particulate Matter: Another Asthma Trigger
Although smog comes first to mind when
most people think of air pollution, a number of
recent studies have concluded that particulate
matter (PM) may be an even more harmful air
pollutant. Composed of soot, dust and other tiny
particles produced by such sources as diesel trucks
and buses, coal-fired power plants and fireplaces,
PM is capable of penetrating deep into the lungs,
where it can irritate respiratory tracts and trigger
asthma attacks.176 Studies have shown that pro-
longed exposure to PM can stunt the growth and
functioning of children’s developing lungs, and
researchers have linked PM exposure to increased
rates of lung cancer.177
One recent report found that breathing soot
released by diesel-powered trucks, buses and con-
struction and farm equipment greatly increases a
person’s risk of developing cancer.178 And a 2002
study by the California Air Resources Board (ARB)
found an increase in hospitalizations and emer-
gency room visits after periods of high PM
episodes in the San Joaquin Valley.179
It should be noted, however, that smog and
PM aren’t the only causes of California’s worsen-
ing asthma problem. The causes of asthma are
complex, and research indicates that a variety of
other outdoor and indoor allergens act as asthma
triggers, including dust mites, cockroaches, tobac-
co smoke, pollen and mold. Additionally, better
reporting and improved diagnosis have con-
tributed to the rise in reported asthma cases.
Motor Vehicles Are a Major Source of California’s
Air Pollution
California’s persistent air pollution problems
are closely linked to its population’s heavy
reliance on automobiles. Motor vehicles are by far
the largest producer of nitrogen oxides and
volatile organic compounds (VOCs), chemicals
that combine in sunlight to form ozone. Cars,
trucks and other on-road motor vehicles account
36
CAN’T GET THERE FROM HERE The Declining Independent Mobility of California’s Children and YouthC
OU
RTES
Y: W
WW
.PED
BIKE
IMA
GES
.ORG
| D
AN
BU
RDEN
for more than half (52%) of all nitrogen oxides
and 40 percent of all VOCs spewed each day into
California’s air, according to the California Air
Resources Board.180
Although strict emissions standards, routine
vehicle inspections and clean technologies have
succeeded in cutting motor vehicle emissions per
mile driven, these measures have been largely off-
set by huge increases in driving and trip-making.
While California’s population grew 28 percent
between 1981 and 2000, annual motor vehicle
registrations increased by more than one third181
and the average number of vehicle miles traveled
daily in the state climbed 48 percent.182
The Nation’s Dirtiest Air
Whatever the causes, the result is that the
Golden State now has what is arguably America’s
worst air pollution. Nine of the nation’s 10 most
ozone-polluted counties — San Bernardino,
Fresno, Kern, Tulare, Riverside, Los Angeles, El
Dorado, Merced and Kings — are located in
California, according to a 2003 report by the
American Lung Association.183
California also leads the nation in ozone alert
days. A study by the U.S. Public Interest Research
Group (PIRG) found that the federal 8-hour
ozone standard was exceeded in at least one
California location on 130 days in 2001.184 This
is almost twice as many “smog days” as the next
closest state, Texas, which registered 72 “smog
days.” Just seven of California’s 15 air basins have
managed to attain federal ozone standards, and
just 10 of the state’s air basins have attained fed-
eral health-based standards for PM-10.185
Moreover, air pollution appears to be worsen-
ing in some of parts of the state. In the San
Joaquin Valley, for example, the air is now dirtier
than in Los Angeles, which for decades has been
the nation’s air pollution poster child. The val-
ley’s air basin exceeded the national 8-hour ozone
standard a combined 220 days in 2000 and 2001,
while the Los Angeles area’s South Coast Air Basin
violated the standard on 186 days.186
As a result of this deterioration, the valley’s air
quality management district is considering asking
the EPA to “bump up” the region’s ozone classifi-
cation from “severe” to “extreme” so that it will
have more time to figure out how to address the
problem before federal sanctions kick in. The
South Coast Air Basin is currently the only region
in the country now classified as “extreme.”
Emissions of PM-10 are also increasing in the San
Joaquin Valley,187 one of just eight U.S. air basins
classified as “serious” by the U.S. Environmental
Protection Agency (EPA).
Lack of Travel Options Slows CognitiveDevelopment
In addition to helping control weight, reduce
fat and build muscle, regular exercise has been
shown to reduce feelings of depression, stress and
anxiety, in people of all ages. Available data also
suggest that physical activity improves the ability
to sleep, boosts self-esteem and increases atten-
tiveness and energy levels,188 which means exer-
37
CAN’T GET THERE FROM HERE The Declining Independent Mobility of California’s Children and Youth
“There is a connection...between the
fact that the urban sprawl we live
with daily makes no room for
sidewalks or bike paths and the fact
that we are an overweight, heart
disease-ridden society.”
— Dr. Richard J. Jackson, Director of the U.S. Centers for
Disease Control and Prevention’s National Center for
Environmental Health
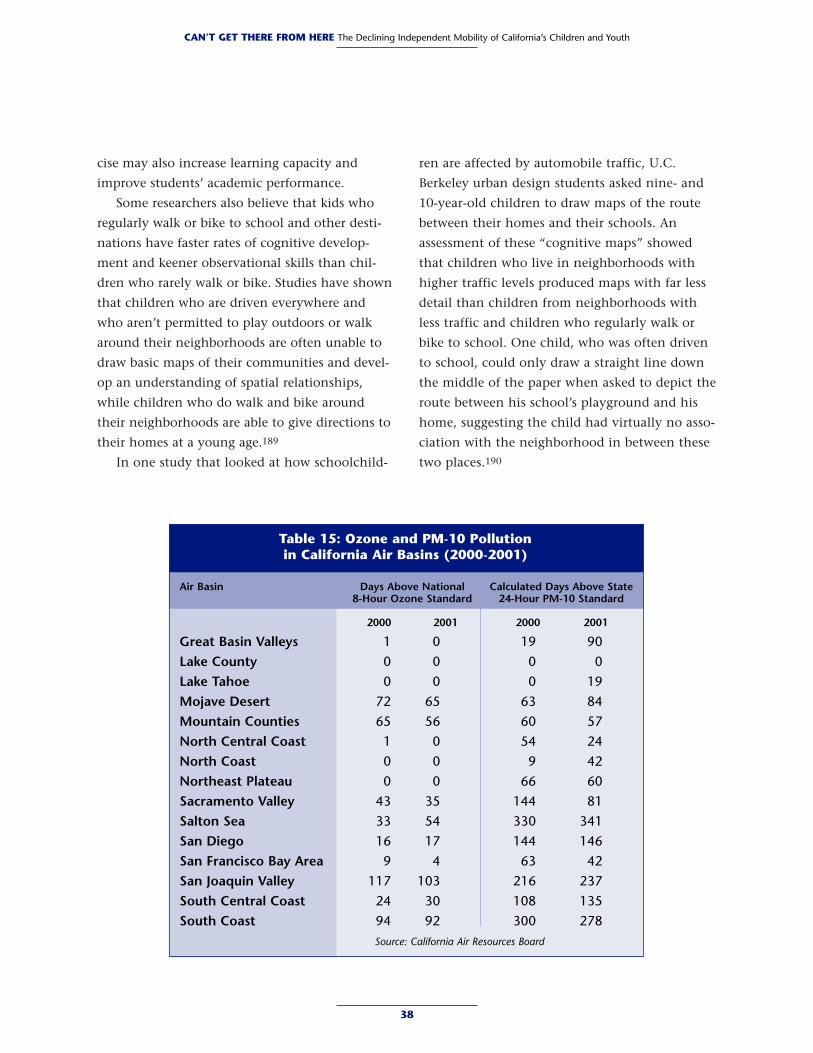
cise may also increase learning capacity and
improve students’ academic performance.
Some researchers also believe that kids who
regularly walk or bike to school and other desti-
nations have faster rates of cognitive develop-
ment and keener observational skills than chil-
dren who rarely walk or bike. Studies have shown
that children who are driven everywhere and
who aren’t permitted to play outdoors or walk
around their neighborhoods are often unable to
draw basic maps of their communities and devel-
op an understanding of spatial relationships,
while children who do walk and bike around
their neighborhoods are able to give directions to
their homes at a young age.189
In one study that looked at how schoolchild-
ren are affected by automobile traffic, U.C.
Berkeley urban design students asked nine- and
10-year-old children to draw maps of the route
between their homes and their schools. An
assessment of these “cognitive maps” showed
that children who live in neighborhoods with
higher traffic levels produced maps with far less
detail than children from neighborhoods with
less traffic and children who regularly walk or
bike to school. One child, who was often driven
to school, could only draw a straight line down
the middle of the paper when asked to depict the
route between his school’s playground and his
home, suggesting the child had virtually no asso-
ciation with the neighborhood in between these
two places.190
38
CAN’T GET THERE FROM HERE The Declining Independent Mobility of California’s Children and Youth
Table 15: Ozone and PM-10 Pollution in California Air Basins (2000-2001)
Air Basin Days Above National Calculated Days Above State8-Hour Ozone Standard 24-Hour PM-10 Standard
2000 2001 2000 2001
Great Basin Valleys 1 0 19 90Lake County 0 0 0 0Lake Tahoe 0 0 0 19Mojave Desert 72 65 63 84Mountain Counties 65 56 60 57North Central Coast 1 0 54 24North Coast 0 0 9 42Northeast Plateau 0 0 66 60Sacramento Valley 43 35 144 81Salton Sea 33 54 330 341San Diego 16 17 144 146San Francisco Bay Area 9 4 63 42San Joaquin Valley 117 103 216 237South Central Coast 24 30 108 135South Coast 94 92 300 278
Source: California Air Resources Board
If California is to become a place where chil-
dren can get around on their own more of the
time — by walking, bicycling or riding public
transit — then we must take bold steps to make
streets less hazardous for pedestrians and bikers,
and to alter current community and school
design patterns that have contributed greatly to
the state’s lack of transportation options. The fol-
lowing recommendations, if implemented, could
go a long way toward improving the health, safe-
ty and independent mobility of California’s
youngest residents:
(1) Prioritize Safe Walking and Bicycling
Routes for Kids: Walking and bicycling ought to
be a safe, convenient and reliable transportation
mode for children and youth. Yet the dangers
from traffic and the lack of design and funding
for bicyclists and pedestrians in modern streets
and residential developments has made it far
more difficult and dangerous for a new genera-
tion of children to walk or bike. New design poli-
cy guidelines issued by the Federal Highway
Administration and adopted by the California
Department of Transportation (Caltrans) recom-
mend that state and local planners and road
builders design all street and transportation facili-
ties from the start with pedestrians and bicyclists
in mind (see: Deputy Directive #64 on
Accommodating Non-Motorized Travel,
http://www.dot.ca.gov/hq/oppd/non-motor-trav-
el.pdf). Local cities and counties across California
should adopt similar design guidelines.
Traffic speeds must also be reduced in new
communities by designing narrower, slower, safer
streets that accommodate pedestrians, bicyclists
and motor vehicles. In existing neighborhoods
with overly wide streets that encourage speeding
and discourage pedestrian use, “traffic calming”
techniques can be used to moderate vehicle
speeds and improve conditions for pedestrians.
The difference between a child pedestrian being
hit at 20 mph and 40 mph is literally a matter of
Policy Recommendations
C H A P T E R 5
39
CO
URT
ESY:
WW
W.P
EDBI
KEIM
AG
ES.O
RG |
DA
N B
URD
EN
life and death. Communities throughout
California should adopt street design guidelines
for new development that balance the needs of
all users, and they should promote more flexible
street designs that use traffic circles, raised cross-
walks, sidewalk “bulb outs” and other traffic
calming measures to slow traffic speeds and
improve safety for both drivers and pedestrians.*
(2) Promote and Fund Safe Routes to Schools
Programs: While the commute to school is by no
means the only trip made by children and youth,
it is nevertheless one of the most visible and pre-
dictable. Therefore, the trip to school has consis-
tently been the target of grassroots campaigns
around the world to get children back on their
feet and their bikes by educating parents and stu-
dents, improving safety by reducing risks associat-
ed with both crime and speeding traffic, and
building mile after mile of sidewalks, bike lanes
and trails.
The California Department of Health Services
helped launch the Safe Routes to School effort in
this state by sponsoring a 2-year demonstration
project. This initiative helps mobilize community
members locally through California’s annual Walk
to School Day events, and through ongoing com-
munity education, engineering improvements, law
enforcement and community involvement efforts.
The project’s final report, published in 2002, docu-
ments best practices for achieving no- or low-cost
improvements immediately and for funding larger
construction projects over time.
Every community and county in California
should follow the example of Marin County,
which has prioritized local efforts around Safe
Routes to Schools, mobilized community mem-
bers through a variety of outreach, education and
enforcement efforts, and set aside enough trans-
portation funding to make it happen. Caltrans
should make the state-level Safe Routes to School
funding program permanent, triple the size of the
program to $75 million a year, and allow addi-
tional education and outreach efforts to be fund-
ed through the program.
The same is true for the state’s Bicycle
Transportation Account (BTA), a grant program
administered by Caltrans, which helps local gov-
ernments improve street and trail systems for bicy-
cling. Many BTA-funded projects have improved
access to schools and other key destinations for
children. Although recent legislative efforts have
increased the BTA’s annual allocation to $7.2 mil-
lion, cities and counties have consistently submit-
ted funding requests totaling three to six times this
40
CAN’T GET THERE FROM HERE The Declining Independent Mobility of California’s Children and Youth
*The national Institute of Transportation Engineers (ITE) has begun to incorporate pedestrian-friendly concepts into itsguidelines, but local transportation engineers have not all embraced this new way of thinking. For more information ontraffic calming and pedestrian-friendly street design, see Dan Burden, et al., “Street Design Guidelines for HealthyNeighborhoods,” Local Government Commission’s Center for Livable Communities, January 1999; Local GovernmentCommission’s Center for Livable Communities, “Why People Don’t Walk and What City Planners Can Do About It” avail-able at www.lgc.org; Metro Regional Services, “Creating Livable Streets: Design Guidelines for 2040,” Portland, Oregon,November 1997.
CO
URT
ESY:
WW
W.P
EDBI
KEIM
AG
ES.O
RG |
RIC
HA
RD N
ASS
I
amount. Caltrans should increase BTA funding
from $7.2 million to $20 million per year.
(3) Build Child-Friendly Neighborhoods:
Distance is often cited as one of the biggest obsta-
cles to children walking and bicycling more
often. Over the past 50 years, urban and subur-
ban development patterns in California have
increasingly segregated different uses and spread
them out over greater distances. New neighbor-
hoods in California should be built so that all res-
idents — in particular children, youth, seniors
and the disabled — are within a reasonable walk-
ing distance of shops, offices, schools, libraries
and transit stops. This means changing local zon-
ing codes to allow more “mixed-use” develop-
ment in place of the “single-use” zoning that is
now common in many communities.
To achieve this goal, the State of California
should issue standards for such “mixed-use” zon-
ing and use state funding as incentives for their
adoption. An example of how the state should act
is provided by a 2002 bill (SB 1521) that would
have required the state’s Office of Planning and
Research to develop a statewide plan for land use
and growth. The bill, which failed to win
approval in the state Legislature, aimed to pro-
vide financial incentives for cities and counties
that preserve open space and encourage mixed-
use development around existing infrastructure
and public transit lines.
It is important to remember that changing the
design of our neighborhoods may be the best way
to promote physical activity — as well as the use
of public transit — among children and youth.
Changes that improve the safety and convenience
of walking and bicycling will not only decrease
the number of deaths and injuries from accidents,
but will also help reduce the prevalence of
weight-related diseases and put more “eyes on the
street” to help alleviate parents’ concerns about
stranger danger.
(4) Remove Regulatory Barriers that Discourage
Neighborhood Schools: One of the main reasons
more children walked and bicycled to school in
the past is that schools were located much closer
to the neighborhoods where students lived.
Unfortunately, new schools in California are
often located far from where anyone lives due to
school siting guidelines, funding policies and
other regulations that discourage the renovation
of older neighborhood schools and instead favor
the construction of large new schools, which are
often built on undeveloped land.
California should overhaul these guidelines
and policies so that the renovation of existing
neighborhood schools, or the construction of
smaller, community-based schools, becomes an
attractive alternative to sprawling, new “green-
field” campuses. Existing schools are often sited
close to or within residential neighborhoods, and
could be retrofitted or modernized at a fraction of
the cost of building new schools.
When new schools are needed, they should be
constructed in or near residential neighborhoods,
where they will have an opportunity to serve as
centers of community activity. Siting schools clos-
er to existing neighborhoods would not only
encourage students to walk and bike to school
41
CAN’T GET THERE FROM HERE The Declining Independent Mobility of California’s Children and Youth
* A series of bills that would go a long way toward removing barriers to the modernization and rehabilitation of existingneighborhood schools, clearing the path for joint- and mixed-use projects, and streamlining the school constructionapproval process have been introduced in the California Legislature in 2003. These bills include AB 225, AB 545, AB 560,AB 1244, AB 1382 and AB 1550, all of which were sponsored by the Mexican American Legal Defense and EducationalFund (MALDEF). For more information, contact Francisco Estrada, senior policy analyst for MALDEF.
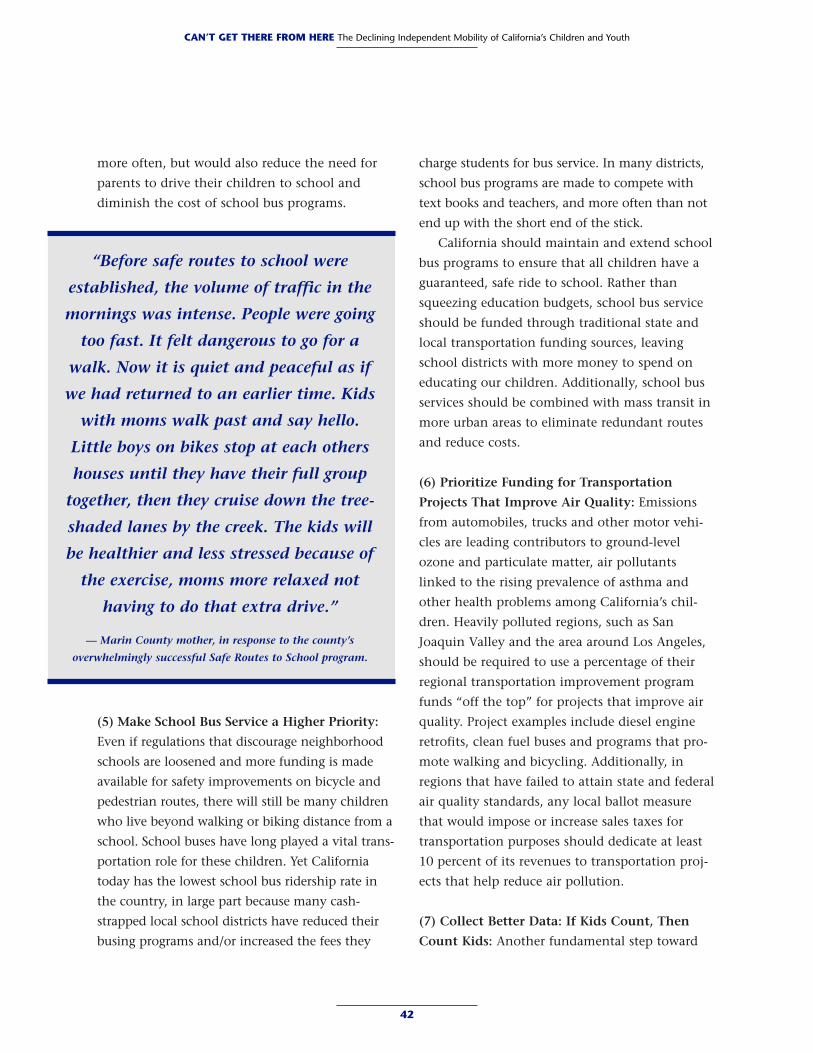
more often, but would also reduce the need for
parents to drive their children to school and
diminish the cost of school bus programs.
(5) Make School Bus Service a Higher Priority:
Even if regulations that discourage neighborhood
schools are loosened and more funding is made
available for safety improvements on bicycle and
pedestrian routes, there will still be many children
who live beyond walking or biking distance from a
school. School buses have long played a vital trans-
portation role for these children. Yet California
today has the lowest school bus ridership rate in
the country, in large part because many cash-
strapped local school districts have reduced their
busing programs and/or increased the fees they
charge students for bus service. In many districts,
school bus programs are made to compete with
text books and teachers, and more often than not
end up with the short end of the stick.
California should maintain and extend school
bus programs to ensure that all children have a
guaranteed, safe ride to school. Rather than
squeezing education budgets, school bus service
should be funded through traditional state and
local transportation funding sources, leaving
school districts with more money to spend on
educating our children. Additionally, school bus
services should be combined with mass transit in
more urban areas to eliminate redundant routes
and reduce costs.
(6) Prioritize Funding for Transportation
Projects That Improve Air Quality: Emissions
from automobiles, trucks and other motor vehi-
cles are leading contributors to ground-level
ozone and particulate matter, air pollutants
linked to the rising prevalence of asthma and
other health problems among California’s chil-
dren. Heavily polluted regions, such as San
Joaquin Valley and the area around Los Angeles,
should be required to use a percentage of their
regional transportation improvement program
funds “off the top” for projects that improve air
quality. Project examples include diesel engine
retrofits, clean fuel buses and programs that pro-
mote walking and bicycling. Additionally, in
regions that have failed to attain state and federal
air quality standards, any local ballot measure
that would impose or increase sales taxes for
transportation purposes should dedicate at least
10 percent of its revenues to transportation proj-
ects that help reduce air pollution.
(7) Collect Better Data: If Kids Count, Then
Count Kids: Another fundamental step toward
42
CAN’T GET THERE FROM HERE The Declining Independent Mobility of California’s Children and Youth
“Before safe routes to school were
established, the volume of traffic in the
mornings was intense. People were going
too fast. It felt dangerous to go for a
walk. Now it is quiet and peaceful as if
we had returned to an earlier time. Kids
with moms walk past and say hello.
Little boys on bikes stop at each others
houses until they have their full group
together, then they cruise down the tree-
shaded lanes by the creek. The kids will
be healthier and less stressed because of
the exercise, moms more relaxed not
having to do that extra drive.”
— Marin County mother, in response to the county’s
overwhelmingly successful Safe Routes to School program.
improving California’s transportation systems and
planning, so that they better meet children’s
needs, is to collect more information about how,
when, why and where kids travel. Most govern-
ment agencies only collect data about motor
vehicles, a fact that tends to focus discussions
among engineers, planners and politicians around
levels of service for traffic. As one transportation
official put it, “What gets counted counts.”
Currently, very few agencies collect data on
whether or not they are meeting the health,
mobility and safety goals of children and other
Californians who depend on walking, biking or
public transit for independent mobility. For
example, Caltrans does not routinely report
statewide household travel survey data for chil-
dren and youth. The Caltrans data cited in this
report was only made available after the Surface
Transportation Policy Project requested a special
data run. These data have never before been pub-
lished. Additionally, one reason for the low usage
of public transportation among children and
youth is that transit service providers often do
not track their ridership, and children are fre-
quently omitted from general surveys of transit
passengers.
In the future, Caltrans should report this data
according to age group, and treat children and
youth as specific subgroups. Additionally, regional
transportation agencies should collect and report
data regarding the travel patterns of children and
youth, acknowledging their place in the region’s
transportation system. Using these data, agencies
should begin developing strategies that will
improve the mobility options available to kids.
(8) Involve Youth in Transportation Decision-
Making: For some time now it has been noted
that younger Americans are increasingly disen-
gaged from and disenchanted with civic issues
and politics in general. As this report demon-
strates, transportation decisions — which have a
profound impact on the health, independence
and safety of children and youth — are rarely
made in consultation with them. Indeed, some
transportation agencies don’t even consider peo-
ple under 18 years of age to be part of their cus-
tomer base, and routinely leave them out of cus-
tomer surveys.
Instead of being ignored, children — youth in
particular — should be involved in the design of
projects that have an impact on their well-being.
This will be especially important in coming years
as the number of Californians under the age of 18
is projected to grow 37 percent by 2025. Safe
Routes to School projects and programs should
involve the children they are intended to help.
Citizen seats on local and regional transportation
agencies — though they rarely have voting powers
— should be opened up for youth delegates inter-
ested in having a say in the design and funding of
local transportation systems. Additionally, trans-
portation curricula should be taught in schools
throughout California, particularly in high school
civics classes.
(9) Provide Free and Discounted Public Transit
Passes For Children: Local transit agencies
should work with the state to develop innovative
funding approaches that will enable transit agen-
cies, even those facing budget deficits, to provide
deeply discounted or free bus passes for children,
particularly those from poor families. Addition-
ally, local and regional transportation tax meas-
ures in California should consider setting aside a
portion of tax revenues for the purpose of provid-
ing free transit passes for kids.
43
CAN’T GET THERE FROM HERE The Declining Independent Mobility of California’s Children and Youth
Automobile: In this report, the term “automo-
bile,” is used interchangeably with “car,” “motor
vehicle” and all other types of privately owned
motorized passenger vehicles.
Children: In this report, the term “children”
refers to people aged 18 and younger, unless oth-
erwise specified. Although this age category
includes some people old enough to drive (i.e.,
those aged 16 and older), it enables the authors
to analyze the travel patterns of children through
high school, a time when many children leave
the family home and assume a more independent
lifestyle. The term “children” is used interchange-
ably with “kids,” while “youth” and “teenagers”
are used to describe people between the ages of
12 and 18.
Exurban: Exurban development refers to develop-
ment that occurs outside the central urbanized
area of a metropolitan region (even outside the
suburbs of central cities) but is still within com-
muting distance of the central urbanized area.
Greenfield: Farmland and other undeveloped
land where there has been no previous industrial,
commercial or residential development.
Household: Although households generally
describe all the occupants of a housing unit
(including people who are unrelated), the term is
used primarily to describe families in this report.
Infill: Development of vacant or underdeveloped
land within neighborhoods or communities that
are otherwise substantially developed, as opposed
to building on undeveloped land.
Latino: The term “Latino” refers to people of any
race, heritage, nationality group, lineage or coun-
try of birth who classified themselves in one of
the specific Spanish, Hispanic or Latino categories
listed on the U.S. Census Bureau’s 2000 Census of
Population questionnaire. These categories
include “Mexican, Mexican American, Chicano,”
“Puerto Rican,” “Cuban” and “other
Spanish/Hispanic/Latino.”
Mixed-Use Zoning: The term “mixed-use zoning”
is used to describe neighborhoods that contain a
mixture of homes, shops and businesses. In con-
trast, “single-use zoning” refers to neighborhoods
that are zoned for only one type of use. In many
new suburbs and exurbs, some neighborhoods are
zoned solely for homes, while in other neighbor-
hoods only shops and other commercial uses are
permitted.
Social Equity: Equal opportunity and access for
all members of society to such things as nutri-
tious food and transportation access to jobs.
Traffic Calming: Traffic calming efforts are aimed
at reducing the speed of motor vehicles along
neighborhood streets and intersections to make
them more pedestrian- and bicyclist-friendly, and
to improve quality of life in these neighborhoods.
Traffic calming efforts generally focus on physical
Definition of Terms Used in This Report
44
design changes, such as adding traffic circles,
speed bumps, street trees and textured pavement.
For more information about traffic calming in
California, contact the Local Government
Commission at http://www.lgc.org.
Transit: Public transit systems convey people
from one place to another in multi-passenger
vehicles along fixed routes on a fixed schedule. In
this report, “transit” includes buses, trolleys,
light-rail, subways, trains and other forms of city-,
regional- or state-managed ground transportation.
Trip: The term “trip” is used to describe purposeful
or utilitarian travel between one place and anoth-
er, such as between home and school. Unpurposed
travel, such as “just walking around,” walking for
exercise or walking around inside one’s home, is
not counted as a “trip” in this report.
Unlinked vs. Linked Trips: A “linked” trip refers
only to the dominant travel mode used for a trip.
For example, if a child walks 100 yards from his
or her home to a bus stop, then rides a bus two
miles to school, the child is said to have used
public transit for this trip. An “unlinked” trip can
be any mode segment of a trip. In the example
above, both the walk from home to bus stop and
the bus ride are counted as “trips.” The Caltrans
2000-2001 California Statewide Household Travel
Survey data included in this report measures
unlinked trips.
Urban Sprawl: Low-density, dispersed develop-
ment outside of compact urban centers.
Sprawling metro areas tend to segregate housing,
workplaces and stores from one another in single-
use districts. Trip distances in sprawling areas are
often too long for walking or bicycling to be con-
venient travel modes.
Walking Trips: The term “walking” includes trips
made by skateboard, rollerblade, scooter and
other non-motorized, non-pedicycle travel
modes.
Zoning: Zoning is a system of development that
divides communities by land use. Zoning deter-
mines the type of land use, lot size and restric-
tions for each piece of property or neighborhood.
For example, areas can be zoned for residential,
industrial, commercial or mixed uses.
45
CAN’T GET THERE FROM HERE The Declining Independent Mobility of California’s Children and Youth
Chapter One:1 California Department of Transportation, “2000-2001California Statewide Household Travel Survey,” special datarun requested by Surface Transportation Policy Project.
2 California Children’s Eating and Exercise Practices Survey(CalCHEEPS). Conducted in 1999 by Fleishman-HilliardResearch and the Public Health Institute, CalCHEEPS sur-veyed via mailings 814 children aged 9-11. The mailingwas sent to a demographically balanced sample ofCalifornia market research panel members from through-out the state who have a 9- to 11-year old child. The sur-vey had a sampling error of 4-5 percentage points at the 95percent confidence level. This unpublished analysis wasprovided to the Surface Transportation Policy Project bythe California Department of Health Services’ ChronicDisease and Injury Control/Cancer Prevention andNutrition Section in July 2003.
3 C.L. Purvis, “Changes in Regional Travel Characteristicsand Travel Time Expenditures in the San Francisco BayArea: 1960 to 1990,” Paper submitted to the TransportationResearch Board for the 1994 Annual Meeting. Seehttp://www.mtc.ca.gov/datamart/survey/changes.htm
4 National Personal Transportation Surveys of 1995 and1977, U.S. Department of Transportation. The 37% declinein walking among children aged 5 to 15, and a related 9%increase in car usage, between 1977 and 1995 was con-firmed by CDC researcher Sandra Hamm. Additionally:National surveys show similar declines in walking amongadults as well as children. NPTS data show a 42% drop inthe number of trips taken on foot among people of all agesbetween 1977 and 1995, while U.S. Census data shows thatthe number of Americans who walk to work has droppedfrom 10% in 1960 to less than 3% in 2000.
5 National randomized survey conducted in October 2002by Belden Russonello & Stewart at the request of theSurface Transportation Policy Project. The survey foundadditionally that most school-aged children are either driv-en by a parent (53%) or a school bus (38%). Additionally(1): An estimate widely cited in the media and attributed toresearchers at the U.S. Centers for Disease Control andPrevention (CDC) states that the percentage of Americanchildren who walk or bike to school has plummeted fromnearly two-thirds in the 1950s to less than 10 percenttoday. Additionally (2): The number of children aged sevento 15 who ride bicycles to school has fallen more than 60percent since the 1970s, according to the CDC’s RichardKillingsworth. (See: “No Work for a Bicycle Thief: ChildrenPedal Around Less,” New York Times, June 7, 1999.)
6 Metropolitan Transportation Commission, “San FranciscoBay Area Regional Travel Characteristics: Working PaperNo. 4, “ 1990. Page 14 states that school trips account for9.9% of all regional weekday morning trips.
7 Marin County Congestion Management District, “TheFacts May Be Surprising,” 2000. Additionally: It is interest-ing to note than, in an effort to reduce morning commute-time traffic congestion, Marin County supervisorsapproved a free transit pass for schoolchildren in early
2003. (See: Mark Prado, “Bus Rides for Students TargetTraffic,” Marin Independent Journal, March 24, 2003.)
8 For example, Bernadette Kowey, coordinator of a walkingschool bus program in British Columbia, has said “moreparents chose to drive [to school] because other parentswere driving, and they didn’t want their kids walkingthrough that congestion.” (See: School Bus Fleet, June/July2000.)
9 Jason Kandel and Richard Marosi, “Walk to SchoolHazardous for Santa Ana Kids,” Los Angeles Times (OrangeCounty Edition), May 27, 1999. The article cites data from a1999 study by the Santa Ana Unified School District.Additionally: A study by the Washington State Departmentof Transportation found that 50% of children who are hitby cars near schools are hit by cars driven by parents ofother students.
10 California Department of Transportation, “2000-2001California Statewide Household Travel Survey,” special datarun requested by Surface Transportation Policy Project.Additionally: A new analysis of data collected by theCalifornia Children’s Eating and Exercise Practices Survey(CalCHEEPS) in 1999 finds that California’s lowest-income9- to 11-year-olds (those from families with an annualincome under $20,000) were three times more likely towalk to school than children from families with annualincomes at or above $50,000. (See: California Children’sEating and Exercise Practices Survey (CalCHEEPS).Conducted in 1999 by Fleishman-Hilliard Research and thePublic Health Institute, CalCHEEPS surveyed via mailings814 children aged 9-11. The mailing was sent to a demo-graphically balanced sample of California market researchpanel members from throughout the state who have a 9- to11-year old child. The survey had a sampling error of 4-5percentage points at the 95 percent confidence level. Thisunpublished analysis was provided to the SurfaceTransportation Policy Project by the California Departmentof Health Services’ Chronic Disease and InjuryControl/Cancer Prevention and Nutrition Section in July2003.)
11 California Department of Transportation, “2000-2001California Statewide Household Travel Survey,” special datarun requested by Surface Transportation Policy Project.
12 Numerous surveys have shown that Caucasians aremore likely than minorities to own cars. The U.S. CensusBureau has reported that while 24% of African Americanhouseholds and 17% of Latino households own no cars,just 7% of Caucasian households own no cars.Additionally: Studies in the United Kingdom have shownthat access to a car is closely linked to household income,and that people from the poorest 20% of households makeabout twice as many journeys on foot and three times asmany journeys by bus than those from the richest 20% ofhouseholds. (See: Child Accident Prevention Trust,“Summer Safety Campaign Aims to Strike Healthy BalanceFor Kids At Play,” 2001 press release,http://www.capt.org.uk/.)
E N D N O T E S
46
Chapter Two:13 A series of maps prepared for the University ofCalifornia Transportation Center’s California Trends Projectshow the state’s highest concentrations of youths underthe age of 18 are in suburban areas. (See: Elizabeth Deakin,et al. “Twelve Trends for Consideration in California’sTransportation Plan,” May 2001,http://www.uctc.net/trends/.) These maps appear in thisreport’s Appendices, beginning on page 79.
14 For a discussion of interconnected street networks, see:Ellen Greenberg and Fred Dock, “Design Guidance forGreat Streets: Addressing Context Sensitivity for MajorUrban Streets,” 2003.
15 Study comparing an infill subdivision in Sacramentoand a “greenfield” counterpart by the Natural ResourcesDefense Council and the U.S. Environmental ProtectionAgency , 2000. Additionally: A study in Seattle found thatpeople in older neighborhoods travel less than four milesfrom their home on average to reach a park or other recre-ation area, whereas people in the region’s newest commu-nities had to travel more than eight miles to get to theseareas. (See: “Suburbia’s Road to Weight Gain; Land-UseDesigns Discourage Pounding the Pavement, Some Say,”Washington Post, January 21, 2001, which quotes LawrenceD. Frank of the Georgia Institute of Technology who ledthe study.)
16 Bruce Friedman, Stephen P. Gordon and John B. Peers,“Effect of Neotraditional Neighborhood Design on TravelCharacteristics,” Transportation Research Record 1466, pp.63-70. Additionally (1): A study of 27 neighborhoods inNorthern and Southern California found that doubling res-idential density reduced automobile ownership and result-ed in 20 percent to 30 percent fewer annual vehicle milestraveled. (See: John Holtzclaw, “Using Residential patternsand Transit to Decrease Auto Dependence and Costs,”Natural Resources Defense Council and California HomeEnergy Efficiency Rating Systems, 1994.) Additionally (2): Astudy in Portland, Oregon, found that residents of pedestri-an-friendly, mixed-use neighborhoods made three timesthe number of walking trips daily, on average, than resi-dents of typical suburban developments in the area. (See:Peter Calthorpe, “The Next American Metropolis,” PrincetonArchitectural Press 1993, p. 48.) Additionally (3): A nationalstudy found that people living in compact, pedestrian-friendly neighborhoods make twice as many walking tripsas people in sprawling neighborhoods. (See: Brian E.Saelens, et al., Annals of Behavioral Medicine, April 2003.)Additionally (4): A 2002 report by Smart Growth Americafound that 50 percent fewer commuters walk to work insprawling areas than in more traditional communities withgrid-like street networks and more pedestrian infrastruc-ture. (See: Reid Ewing, Rolf Pendall and Don Chen,“Measuring Sprawl and Its Impact,” Smart GrowthAmerica, October 2002,http://www.smartgrowthamerica.com/sprawlindex/sprawlindex.html.) Additionally (5): A national poll conducted forthe Surface Transportation Policy Project offers further evi-dence that people are less prone to walk when they per-ceive distances to be long: 61 percent of the survey’s
respondents said they do not walk more because “thingsare too far to get to and it is not convenient to walk.”(See: National randomized survey conducted in October2002 by Belden Russonello & Stewart at the request of theSurface Transportation Policy Project, available online athttp://www.transact.org.) Additionally (6): The 2001National Household Transportation Survey (NHTS) foundthe highest rates of walking and biking in urban areas. Thesurvey found that people in urban metropolitan statisticalareas (MSAs) made just over 12% of all utilitarian trips bywalking or bicycle, while less than 8% of all trips in subur-ban MSAs and just over 6% of all trips in exurban MSAswere made on foot or bicycle. (See:http://nhts.ornl.gov/2001/index.shtml.)
17 State Legislative Analyst’s Office, “1998 Report onTransportation.”
18 California Department of Motor Vehicles and 2000 U.S.Census data. Additionally: A nationwide study found thatabout one-third (33.4 percent) of age-eligible teenagers liv-ing in urban areas have a license compared to about three-fourths of teenagers living elsewhere (Kelly J. Clifton ofUniversity of Iowa’s Graduate Program in Urban &Regional Planning, “Independent Mobility AmongTeenagers: An Exploration of Travel to After-SchoolActivities,” presented at the Associate of Collegiate Schoolsof Planning 2001 Annual Conference).
19 Additionally: A poll conducted for STPP in 2002 foundthat long distances were the leading reason that childrendon’t walk or bike to school. Sixty-six percent of respond-ing parents said their children’s schools were “too faraway” from home to permit walking or biking. (See:National randomized survey conducted in October 2002 byBelden Russonello & Stewart at the request of the SurfaceTransportation Policy Project, available online athttp://www.transact.org.)
20 Anne Vernez Moudon, et al., “Effects of Site Design onPedestrian Travel in Mixed-Use, Medium-DensityEnvironments,” Washington State Transportation Center(TRAC), May 1997.
21 W.A. Leaf and D.F. Preusser, “Literature Review onVehicle Travel Speeds and Pedestrian Injuries,” NationalHighway Traffic Safety Administration, 1999. Additionally(1): In 2000 and 2001, 59 percent of the pedestrian fatali-ties nationwide for which location information was record-ed occurred in places where no crosswalk was available,while less than 10 percent of pedestrian deaths in 2000and 2001 occurred inside a crosswalk (SurfaceTransportation Policy Project’s analysis of NationalHighway Traffic Safety Administration’s Fatality AnalysisReporting System (FARS) database for 2000 and 2001).Additionally (2): A recent study in Colorado highlights theheightened dangers that wide, busy streets pose for pedes-trians and bicyclists, and the ways in which narrowerstreets can slow vehicle speeds and improve safety. “Asstreet width widens, accidents per mile per year increasesexponentially,” the study concludes. (See: New Urbanism:Comprehensive Report & Best Practices Guide, SecondEdition (2001), New Urban Publications, Ithaca, NY, pp. 8-
47
CAN’T GET THERE FROM HERE The Declining Independent Mobility of California’s Children and Youth
15, http://www.newurbannews.com/.
22 Unlike traditional neighborhood schools that wereoften located in multi-story buildings, newer schools thatcomply with state and federal guidelines are almost alwaysset in single-story buildings and are often surrounded byathletic fields and other campus structures. According toCalifornia Department of Education data, California’slargest-enrollment high schools are now 13 percent biggeron average than similar-enrollment high schools built inthe mid-1960s, while the largest elementary schools are 11percent bigger. (See: California Department of Education’sSchool Facilities Division, “Guide to School Site Analysisand Development,” 2000 edition,http://www.cde.ca.gov/facilities/field/sitereview.htm.)
23 CDC researcher Sandra Hamm, calculations from the1995 NPTS, unpublished data.
24 U.S. Department of Transportation, “TransportationCharacteristics of School Children, 1969 National PersonalTransportation Study” (1972). Seehttp://www.fhwa.dot.gov/ohim/1969/1969page.htm.
25 South Carolina Coastal Conservation League, “Wait forthe Bus: How Lowcountry School Site Selection and DesignDeter Walking to School,” Charleston, S.C., 1999, see:http://www.scccl.org. This study also found that studentsare four times more likely to walk to schools built before1983 than to those built after 1983, largely because olderschools tend to be located closer to children’s homes.
26 California Department of Education, “Small School SitePolicy,” February 28, 2001. See http://www.cde.ca.gov/facil-ities/field/smschste.htm.
27 California school districts may request a waiver to theCDE’s regulations for new school construction. However,districts requesting a waiver must demonstrate that pro-posed smaller, neighborhood schools can meet minimumclassroom size requirements and other regulations.
28 Conversations with Jim Bush, Assistant Director of theCDE’s School Facilities Planning Division, on November 5,2002, and with Grant Langan, LAUSD’s Chief BoundaryCoordinator, on April 17, 2003.
29 In Long Beach, the Gonzalo and Felicitas MendezFundamental Intermediate School was constructed on topof a parking garage in 2000, under a state pilot program for“space saver” schools. (This program is intended to encour-age multi-story construction, below-ground constructionand joint use by schools of shopping centers, office com-plexes and other facilities in high-density urban areas, seehttp://www.documents.dgs.ca.gov/OPSC/sab-policies/123b.pdf.) For more information, see: Doug Smithand Jessica Garrison, “Schools That Aren’t Built by theBook,” Los Angeles Times, September 24, 2000.
30 Conversation with Jim Bush, Assistant Director of theCDE’s School Facilities Planning Division, on November 5,2002.
31 Constance E. Beaumont and Elizabeth G. Pianca,“Historic Neighborhood Schools in the Age of Sprawl: Why
Johnny Can’t Walk to School,” National Trust for HistoricPreservation, November 2000. See http://www.national-trust.org/news/docs/20001116_johnny_cantwalk.html.Additionally: Funding formulas that favor new school con-struction are discussed in S. Passmore, “Education andSmart Growth: Reversing School Sprawl for Better Schoolsand Communities,” Funders’ Network for Smart Growth &Livable Communities, Translation Paper Number 8, March2002.
32 This law contributed to the San Mateo Union HighSchool District’s decision in 2002 to demolish San MateoHigh School, following its closure for seismic-safety reasonsthe previous year. The district opted to build a new struc-ture on the same site rather than renovate the 76-year-oldlandmark school in part because the cost of seismic retro-fits exceeded 50 percent of the estimated $53 million pricetag for a new school.
33 California school districts must submit three “approv-able” sites for new schools they propose building, arequirement that favors suburban and exurban districts,which tend to have more land available for school devel-opment than urban districts. Additionally: Elk Grove hasalso been able to exploit a loophole that helps many rapid-ly growing communities qualify for state funding and com-pete for funding with large, urban districts: The state for-mula for counting “unhoused” students (i.e., those forwhich there is inadequate classroom space) counts studentswho don’t live in the district yet, but are expected to arrivebased on development plans.
34 Sections 39140, et seq. of the Education Code.Interestingly, a bill (AB 225) was introduced in theCalifornia Legislature in 2003 that would have establishednew guidelines for the seismic evaluation of commercialbuildings being considered for use as school facilities.However, the bill failed to clear the Legislature.
35 Also of interest: Another bill was introduced in theCalifornia Legislature in 2003 (AB 560) that would phaseout the use of the Concept 6 multi-track year-round educa-tional calendar. By reducing the school year from the tradi-tional 180 days to 163 days, Concept 6 enables school dis-tricts to increase student enrollment at existing schoolsand avoid having to build new schools, a situation thatresults in crammed classrooms and reduced learning oppor-tunities for students. The vast majority of students onConcept 6 are low-income Latinos that do not speakEnglish. For more information on state policies and fiscalincentives that have helped promote school sprawl, con-tact Mike Buhler of the National Trust for HistoricPreservation, Julie Spezia of California Futures Network orFrancisco Estrada of MALDEF.
36 Email correspondence with R. Thomas Jones, ExecutiveDirector of California Futures Network, in August 2002. Formore information, see Constance E. Beaumont andElizabeth G. Pianca, “Historic Neighborhood Schools in theAge of Sprawl: Why Johnny Can’t Walk to School,”National Trust for Historic Preservation, November 2000.
37 California Department of Transportation, “2000-2001
48
CAN’T GET THERE FROM HERE The Declining Independent Mobility of California’s Children and Youth
California Statewide Household Travel Survey,” special datarun requested by the Surface Transportation Policy Project.Note that because children’s travel survey data collected byCaltrans has never been disaggregated until now, it is notpossible to determine whether children’s statewide transitusage has increased or decreased over time. However, ananalysis of National Personal Transportation Survey datashows that children’s usage of public transit decreasednationwide by 58 percent between 1977 and 1995, from3.1% of overall children’s trips in 1977 to 1.3% of all tripsin 1995 (National Personal Transportation Surveys 1995and 1977, U.S. Department of Transportation. Data analysisby Surface Transportation Policy Project, confirmed byCDC researcher Sandra Hamm). It should also be notedthat children aren’t alone in using transit for a small per-centage of their trips. 2001 NHTS data shows that, for tripsof all lengths, Americans use public transit for just 2.9% oftheir overall trips.
38 Robert Cervero and Roger Gorman, “Commuting inTransit Versus Automobile Neighborhoods,” Journal of theAmerican Planning Association, Spring 1995.
39 Conversation with Anne-Catherine Vinickas, Director ofMarketing & Customer Service at Santa Clara ValleyTransportation Authority (VTA), on December 16, 2002.
40 This finding is further supported by research showingthat 76% of riders on Metropolitan TransportationAuthority (MTA) buses in Los Angeles County had noaccess to a car in the late 1990s. (See: APMG, Study of theRole of the State in Mass Transportation, January 1998.)
41 California Department of Transportation, “2000-2001California Statewide Household Travel Survey,” special datarun requested by the Surface Transportation Policy Project.
42 See Metropolitan Transportation Commission’s consid-eration in 2001 of a proposal to provide free bus passes forlow-income students to improve school attendance, andnumerous articles in 2001-2003 in the San FranciscoChronicle, Oakland Tribune and Contra Costa Times regardingAC Transit’s free transit pass program. For example, see:Sean Holstege, “AC Transit Offers Free Bus Passes to PoorChildren,” Oakland Tribune, August 28, 2002.
43 See: Contra Costa Times, June 18, 2003 and OaklandTribune, June 19, 2003. Additionally (1): Sacramento’sRegional Transit (RT) is another California system that nowprovides discounted transit passes for students, in responseto advocacy from student groups. High school students canpurchase a monthly pass for $15, a savings of $45 com-pared to a non-student adult monthly pass. The San MateoCounty Transit District (Samtrans) also sells $22 transitpasses for $16 to low-income students (i.e., those whoqualify for free lunches), and the San Francisco MunicipalRailway (MUNI) offers $8 monthly passes for all youths.Additionally (2): There are numerous other reportedinstances in which low-income students have made it clearthat transit fares sometimes prevent them from going toschool. In Providence, Rhode Island, an informal survey ofmore than 500 high school students found that a numberof students whose families weren’t able to afford bus passes
stayed home and missed school (see: DARE Seeds ofChange, 2003), and in Portland, Oregon, a survey of morethan 2,000 students found that 11% reported missingschool due to their inability to meet transportation costs(see: Girls Initiative Network, 2000).
44 California Department of Transportation, “2000-2001California Statewide Household Travel Survey,” special datarun requested by the Surface Transportation Policy Project.Additionally: The 1995 National Personal TransportationSurvey also shows low usage of public transit among chil-dren, even in cities that have extensive bus, subway andlight rail systems. In San Francisco, the 1995 NPTS showsthat transit accounted for 6.1% of trips made by kids agedfive to 15, while transit made up less than 2% of kids’ tripsin Chicago and Boston.
45 Federal Transit Administration, Challenger SessionProceedings, November 19, 2002.
46 Children’s use of transit is also limited by a federalstatute that prohibits transit agencies from establishing ormaintaining routes that run directly between residentialneighborhoods and school areas. “We’re not supposed tocompete with school buses,” a spokesman for theMetropolitan Transit Development Board (MTDB) in SanDiego told the Surface Transportation Policy project inearly 2003. “We’d carry more kids if we were allowed toprovide routes designed specifically to transport children toschool. But we have the understanding that this would vio-late the federal regulation.”
47This method of reducing school bus service wasexplained by Ron Kinney, Director of Business andGovernment Relations in California for Laidlaw EducationServices on October 23, 2002, and by Bob Austin of theCDE’s Office of School Transportation on May 21, 2003.When a district extends its minimum walking distancefrom, say, half a mile to one mile, “regular” students livingbetween half a mile and a mile from school lose their eligi-bility for school bus service. For more information onmethods California school districts are using to reduceschool bus service, see: Erika Chavez, “Free Bus ServiceFades as Districts Cut Costs,” Sacramento Bee, November22, 2001.
48 Conversation with Bob Austin of the CDE’s Office ofSchool Transportation on May 21, 2003.
49 California Department of Education statistics. Rankingof school bus ridership rates in all 50 states for the 1997-1998 school year is provided by School TransportationNews, see http://www.stnonline.com/stn/statesprovinces/unitedstates/index.htm.
50 School Transportation News, K-12 Student Enrollmentand Transportation Data, http://www.stnonline.com/stn/schoolbussafety/ridership/index.htm.
51 The absence of this requirement in California was con-firmed by Ron Kinney, Director of Business andGovernment Relations in California for Laidlaw EducationServices on October 23, 2002.
49
CAN’T GET THERE FROM HERE The Declining Independent Mobility of California’s Children and Youth
52 Associated Press, April 22, 2003.
53 Millicent Mayfield, “Redwood City Schools May Chargefor Bus Service,” San Mateo County Times, April 5, 2002.
54 California Department of Education statistics.Additionally: Some of the largest enrollment increases haveoccurred in urban school districts, which have made someof the state’s steepest bus service reductions.
55 Confirmed by Ron Kinney, Director of Business andGovernment Relations in California for Laidlaw EducationServices on October 23, 2002, and by Bob Austin of theCDE’s Office of School Transportation on May 21, 2003.
56 Assembly Bill 2803 was vetoed by Gov. Gray Davis onSeptember 12, 2002.
57 Conversation with Ron Kinney, Director of Business andGovernment Relations in California for Laidlaw EducationServices on October 23, 2002.
58 School Transportation News, seehttp://www.stnonline.com/stn/statesprovinces/united-states/index.htm.
59 Data based on the California Department of Education’sJune 2000 school bus inventory.
60 Stephen Rhoades & David Randall, “New School BusesFinally in Sight,” CASBO Journal, January/February 2002.
61 Transportation Research Board, Committee on SchoolTransportation Safety, “The Relative Risks of School Travel:A National Perspective and Guidance for Local CommunityRisk Assessment,” Special Report 269, 2002. See:http://www.nap.edu/html/SR269/SR269.pdf . The studyfocuses on deaths and injuries that occurred between 6a.m. and 8:59 a.m. and 2 p.m. to 4:59 p.m. on weekdaysbetween September 1 and June 30. For more informationon this study, see Paul S. Fischbeck & Beverly M. Huey,“The Relative Risks of School Travel,” TR News 224,January-February 2003, pp. 39ff.
62 Cal LeMon, “2000 Report Card on School Bus Safety inthe U.S.,” School Bus Information Council, 2000.http://www.schoolbusinfo.org/intro.htm#overview.Additionally: Data from the California Highway Patrol’sStatewide Integrated Traffic Reporting System (SWITRS)shows that just five school bus passengers were killed inCalifornia between 1981 and 2000.
63 Senate Bill 568 was signed by Gov. Gray Davis inOctober 2001. The California Statute is Vehicle Section27316 Stats, of 2002, Chapter 360.
64 For example, CDC researcher Catherine Staunton hassaid that “increased time pressures on families [is] leavingless time to walk kids to school,” November 5, 2002 emailcorrespondence.
65 L. Mishell, J. Bernstein and J. Schmitt, “The State ofWorking America 2002-2003,” The Economic PolicyInstitute, Washington, D.C.
66 Surface Transportation Policy Project’s analysis of the
Bureau of Labor Statistics’ Consumer Expenditure Survey2001, see www.bls.gov/cex/. For more information on thistopic, see “Transportation and the American Dream,” a2003 decoder by the Surface Transportation Policy Project,available online at www.transact.org.
67 Bureau of Labor Statistics’ Consumer ExpenditureSurvey of 2001. Additionally: An April 2003 study by theAmerican Automobile Association found that the averagecost of driving a new car is 3 percent higher in 2003 thanin 2002, due largely to higher fuel and insurance costs.According to the study, a motorist driving 15,000 miles in2003 will spend about $7,754 in auto-related expenses, up$221 from 2002.
68 U.S. Department of Agriculture (USDA), “Expenditureson Children by Families, 2001 Annual Report,” Table 2.The total number of children living in California (basedupon the 2000 U.S. Census) was used as a multiplier toobtain the total expenditures on children in California.
69 U.S. Department of Agriculture (USDA), “Expenditureson Children by Families, 2001 Annual Report,” Table 2.The total number of children living in California (basedupon the 2000 U.S. Census) was used as a multiplier toobtain the total expenditures on children in California.
70 David Carroll and Jean Ross, “Boom, Bust and Beyond:The State of Working California,” California BudgetProject, January 2003. Additionally: A report by the PublicPolicy Institute of California (“The Distribution of Incomein California,” July 1996) found that the real adjustedincome for households in the 20th income percentiledeclined by 22% in California between 1976 and 1994. See:http://www.ppic.org/content/pubs/R_796DRR.pdf.
71 U.S. Department of Agriculture (USDA), “Expenditureson Children by Families, 2001 Annual Report,” Table 2.The total number of children living in California (basedupon the 2000 U.S. Census) was used as a multiplier toobtain the total expenditures on children in California.
72 Suburban and exurban areas gained 18 percent moreresidents across the United States during the 1990s, accord-ing to the 2000 Census.
73 John Holtzclaw, “Using Residential Patterns and Transitto Decrease Auto Dependence and Costs,” NaturalResources Defense Council, June 1994. Additionally:Research by the Surface Transportation Policy Project hasfound that households in the one-third of U.S. metro areasthat are the most sprawling devote about 20 percent moreof their expenditures to transportation than do householdsin the one-third of U.S. metro areas that are the least-sprawling. (See: Surface Transportation Policy Project,“Driven to Spend,” 2000, available online at http://trans-act.org.)
74 Conversation with the mother of eight-year-old Gracein San Francisco in June 2001.
75 2001 National Household Transportation Survey(NHTS), U.S. Department of Transportation.
76 Surface Transportation Policy Project, “High Mileage
50
CAN’T GET THERE FROM HERE The Declining Independent Mobility of California’s Children and Youth
Moms,” May 1999, available online at http://www.trans-act.org.
77 Analysis of 2001 National Household Travel Survey(NHTS) by Patricia Hu, Director of the Center forTransportation Analysis at Oak Ridge National Laboratory.
78 Katherine Shaver, “The Road Too Much Traveled,”Washington Post, January 27, 2003.
79 Sue Shellenbargar, “Work & Family,” Wall Street Journal,January 30, 2003. Statistics cited in this article were provid-ed by the Mobile Enhancement Retailers Association inIndianapolis.
80 The Surface Transportation Policy Project interviewedmore than 30 California children and adolescents in 2001regarding their transportation experiences and preferences.
Chapter Three:81 Surface Transportation Policy Project, “Caught in theCrosswalk,” September 1999. Report available online athttp://www.transact.org/ca/.
82 J.C. Stutts and W.W. Hunter, “Police Reporting ofPedestrians and Bicyclists Treated in Hospital EmergencyRooms,” Transportation Research Record 1635, pp.88-92.
83 James Thomson and Andrea Gielen, “The Role ofElementary and Adult Education in Childhood PedestrianInjuries,” Paper presented to the CDC’s Proceedings toPrevent Pedestrian Injuries, Atlanta, September 1998.Additionally (1): A study by researchers in Orange Countyfound that while children as young as nine can learn theskills required to cross the street, they are unlikely to usethem because of developmental limitations in their cogni-tive, perceptual and behavioral abilities, especially if theyare engrossed in play. The study also finds that becausechildren are small and have a narrower field of vision theyare less visible to drivers and les able to see approachingvehicles. (See: Peter Jacobsen, et al., “Child PedestrianInjuries on Residential Streets: Implications for TrafficEngineering,” Institute of Traffic Engineers Journal, February2000. Additionally (2): According to Richard Blomberg,President of Dunlap & Associates, a Stamford, CT, researchorganization that specializes in pedestrian safety research,young child pedestrians are especially vulnerable to trafficdangers because “their ability to localize sound isn’t fullydeveloped. Their judgment isn’t fully developed. Theirvision isn’t fully developed.” (See: “Streets in America areUnsafe and Unforgiving for Kids,” article by Emily Smith ofthe University of North Carolina’s Highway Safety ResearchCenter for Walkable America, http://www.tfhrc.gov/safe-ty/pedbike/articles/unsafe.htm.)
84 2001 provisional numbers from the California HighwayPatrol’s Statewide Integrated Traffic Records System(SWITRS) and Census 2000.
85 California Department of Health Services, Epidemiologyand Prevention for Injury Control Branch (EPIC), data for1995-2000.
86 1999 HealthStyles Survey, an annual mail survey ofhealth-related attitudes and behaviors. CDC provides tech-nical assistance to Porter/Novelli (Washington, D.C.) inconducting the HealthStyles Survey. In 1999, a total of2,636 households responded to the survey. The 749 house-holds with children aged 5-18 were asked whether theiryoungest child walked or biked to school at least once aweek during the preceding month, and whether any of sixspecified barriers (traffic danger, crime danger, long dis-tances, weather, opposing school policies or other reasons)made it difficult to do so.
87 National Safe Kids Campaign, “Report to the Nation onChild Pedestrian Safety,” October 2002. Additionally (1):More than 40 percent of parents responding to a recentBritish survey named traffic danger as the reason theyrestrict their younger children from coming home aloneafter school. This survey found that 63% of primaryschoolchildren in the UK were allowed to go out alone intheir leisure time in 1971, while by 1990 only 37% wereallowed to go out alone, primarily because of increasedtraffic safety concerns. (See: Mayer Hillman, John Adamsand John Whitelegg, “One False Move...A Study ofChildren’s Independent Mobility,” Policy Studies Institute(London), 1990). Additionally (2): A national survey by theFederal Highway Administration (FHWA) found that manypeople are concerned about the hazards traffic poses intheir communities for children. More than half (56%) ofthe respondents with children living in their householdrated their communities fair to poor in meeting the trans-portation needs of school children and young adults whodon’t drive (See: Federal Highway Administration, “MovingAhead: The American Public Speaks on Roadways andTransportation in Communities,” February 2001,http://www.fhwa.dot.gov/reports/movingahead.htm).
88 1995 National Personal Transportation Survey (NPTS),U.S. Department of Transportation. Additionally: It shouldbe noted that children aren’t the only segment of the U.S.population that rarely walks or bikes, even for short-dis-tance trips. The 2001 National Household TransportationSurvey (NHTS) shows that, for trips of between one-half ofa mile and one mile, Americans of all ages opt to drivemore than 81 percent of the time, and walk or ride a bikefor just 15 percent of these trips. For trips of all lengths,the 2001 NHTS shows that Americans use private vehicles88.6% of the time, while they walk or bike for 8.5% oftheir trips and ride public transit for 2.9% of their trips.
89 Jason Kandel and Richard Marosi, “Walk to SchoolHazardous for Santa Ana Kids,” Los Angeles Times (OrangeCounty Edition), May 27, 1999. The article cites data from a1999 study by the Santa Ana Unified School District.
90 Marin County Bicycle Coalition, 2002 report on theSafe Routes to School Program. See http://www.safer-outestoschools.org/article8_8_02.html. Additionally (1): Awalking school bus program in British Columbia calledWay to Go! reports that traffic congestion at schools partic-ipating in the program has dropped by 25% to 60% (See:School Bus Fleet, June/July 2000).
91 2001 provisional numbers from the California Highway
51
CAN’T GET THERE FROM HERE The Declining Independent Mobility of California’s Children and Youth
Patrol’s Statewide Integrated Traffic Records System(SWITRS). Additionally: A study comparing cities and sub-urbs in the Pacific Northwest found that suburban childrenface a greater risk from traffic accidents than urban chil-dren do from gun violence. (See: Alan Durning, “The Carand the City,” 1993).
92 California Department of Health Services, Epidemiologyand Prevention for Injury Control Branch (EPIC) andCalifornia Department of Finance,www.dof.ca.gov/html/demograp/race.htm.
93P.F. Agran, et al., “Pediatric Injury Hospitalization inHispanic Children and Non-Hispanic White Children inSouthern California,” Archives of Pediatrics and AdolescentMedicine, April 1996, pp. 400-406.
94 Scott Gold and Ana Cholo-Tipton, “Santa Ana’s GrimSafety Record Has Human Side,” Los Angeles Times, OrangeCounty Edition, December 27, 1999.
95 W.D. King and P.A. Palmisano, “Racial Differences inChildhood Hospitalized Pediatric Injuries,” PediatricEmergency Care 1992; 8 (4); pp. 221-224. Additionally (1): ANew Mexico study found that Native American childrenhad a death rate 2.5 times that of other ethnic and racialgroups. (See: L.M. Olson, et al., “Analysis of ChildhoodPediatric Deaths in New Mexico, 1986-1990,” AmericanEmergency Medicine 1993; 22: pp. 512-16.) Additionally(2): U.C. Irvine researchers concluded that “pedestrianinjury death rates for non-white children are consistentlyfound to be higher than the rates for white children,” afterreviewing nearly 100 studies on child pedestrian injuries.(See: P. Agran, et al., “Epidemiology of Pediatric PedestrianInjuries,” paper presented at the Panel to PreventPedestrian Injuries, convened by the CDC and U.S.Department of Transportation, 1998.)
96 Hugo Martin and Maloy Moore, “Inequities inPedestrian Deaths, Safety: Times Study Finds Latinos,Seniors at Highest Risk,” Los Angeles Times, August 19,2002. Additionally: Another survey conducted by The LosAngeles Times in Orange County found that while Latinosmade up 28% of the county’s population in 1999, theyaccounted for 40% of all pedestrian injuries and 43% of allpedestrian deaths. (See: Richard Marosi, “Pedestrian DeathsReveal O.C.’s Car Culture Clash,” Los Angeles Times, OrangeCounty Edition, November 28, 1999.)
97 Numerous studies have shown that lack of access to acar is associated with a much higher risk of injury as apedestrian. For example, a British study found that chil-dren in families without a car are twice as likely to beinjured in traffic accidents as those in car-owning families.(See: Ian Roberts, et al., “Effect of Environmental Factorson Risk of Injury of Child Pedestrians by Motor Vehicles: ACase-Control Study,” British Medical Journal 1995; 310; pp.91-94.).
98 For example, a Baltimore study found that childrenwhose parents own a car and home cross an average of 3.7streets a day, whereas children whose parents do not own acar and home cross an average of 5.4 streets a day, a differ-ence the researchers describe as “highly significant.” (See:
R. Rao, M. Hawkins and B. Guyer, “Children’s Exposure toTraffic and Risk of Pedestrian Injury in an Urban Setting,”Bulletin of the New York Academy of Medicine, Summer 1997;74 (1): pp. 65-80.) Additionally (1): Ian Roberts, who hasdone extensive research on the socioeconomic and racialdeterminants of pedestrian injury and death, has foundthat “The association between injury and poverty is partic-ularly strong for traffic accidents.” (See: British MedicalJournal 1995; 311; pp. 925-28.) Additionally (2): LuisArteaga, Associate Director of Latino Issues Forum, explainsthat many Latinos in California work swing shifts andtherefore must often walk around late at night in placesthat are not pedestrian-friendly and lack adequate publictransportation.
99 Despite the fact that pedestrians and bicyclists accountfor roughly 25 percent of all traffic-related deaths each yearin California, less than 1 percent (0.6%) of all federal trans-portation safety funds apportioned to Caltrans were spenton sidewalks, crosswalks and other pedestrian and bicyclesafety improvement projects in 2000 and 2001. AlthoughCaltrans does work to integrate such improvements intoevery major project they undertake, the only currentlyavailable way of measuring the scope of those improve-ments is via this aggregate percentage.
100 Richard Marosi and Ray F. Herndon, “PedestriansOften Blamed When Struck,” Los Angeles Times, OrangeCounty Edition, September 7, 1999.
101 Richard Marosi and Ray F. Herndon, “PedestriansOften Blamed When Struck,” Los Angeles Times, OrangeCounty Edition, September 7, 1999.
102 Roberts and Coggan, “Blaming Children for ChildPedestrian Injuries,” Social Science Medicine 38, no. 5 (1994):pp. 749-753.
103 Michael Cabanatuan and Erin McCormick,“California’s Hit-and-Run Crisis,” San Francisco Chronicle,July 27, 2003.
104 Lightstone, Peek-Asa and Krauss, “RelationshipBetween Driver’s Record and Automobile Versus ChildPedestrian Collisions,” Injury Prevention, Vol. 3, No. 4,December 1997. This study also found driver negligence tobe a factor in one-third to one-half of all child pedestriancollisions. Additionally (1): A study by the Los AngelesTimes found that nearly one-quarter of all pedestriandeaths in Los Angeles County are caused by hit-and-rundrivers. (See: Hugo Martin and Maloy Moore, “Inequities inPedestrian Deaths: Times Study Finds Latinos, Seniors atHighest Risk,” Los Angeles Times, August 19, 2002.)Additionally (2): A study of pedestrian fatalities in NewYork City found that drivers are largely or partly to blamein more than 70 percent of all incidents, while pedestrianswere at fault just 18 percent of the time. (See: “Killed byAutomobile,” Right of Way, New York, March 1999,http://www.rightofway.org.)
105 National SAFE KIDS Campaign, “Child Pedestrians atRisk in America: A National Survey of Speeding in SchoolZones,” 2000. Report available at www.safekids.org.
52
CAN’T GET THERE FROM HERE The Declining Independent Mobility of California’s Children and Youth
106 W.A. Leaf and D.F. Preusser, “Literature Review onVehicle Travel Speeds and Pedestrian Injuries,” NationalHighway Traffic Safety Administration, 1999.
107 Pacific Institute for Research & Evaluation’s Children’sSafety Network: Economics and Data Analysis ResourceCenter. Incidence based on 2001 California HighwayPatrol’s Statewide Integrated Traffic Records System(SWITRS) data. Unit costs are based on the average cost ofa U.S. motor vehicle injury for pedestrians.
108 Pacific Institute for Research & Evaluation’s Children’sSafety Network: Economics and Data Analysis ResourceCenter. Incidence based on 2001 California HighwayPatrol’s Statewide Integrated Traffic Records System(SWITRS) data. Unit costs are based on the average cost ofa U.S. motor vehicle injury for pedestrians.
109 1991-1999 Fatality Analysis Reporting System (FARS)and General Estimates System (GES) data, fromTransportation Research Board’s “The Relative Risks ofSchool Travel: A National Perspective and Guidance forLocal Community Risk Assessment,” 2002.
110 1991-1999 Fatality Analysis Reporting System (FARS)and General Estimates System (GES) data, fromTransportation Research Board’s “The Relative Risks ofSchool Travel: A National Perspective and Guidance forLocal Community Risk Assessment,” 2002. Note: There isno source of California-specific data. Additionally: Recentstudies in the U.S. and Holland suggest another reason thatdriving is often more harmful to human health than walk-ing or bicycling: The air people breathe inside a car is any-where from two to 10 times more polluted than the airoutside. Comparing the pollutant intake of drivers, bicy-clists and pedestrians, researchers in the Netherlands foundthat bicyclists inhale less carbon monoxide, benzene,toluene and xylenes than drivers, despite a faster breathingrate, and pedestrians walking along roadways inhaled thefewest gases, due to slower breathing and better air quality.(See: J.H. van Wijnen, et al., “The Exposure of Cyclists, CarDrivers and Pedestrians to Traffic-Related Air Pollutants,”International Archives of Occupational and EnvironmentalHealth 1995; 67, pp. 187-193.)
111 Pacific Institute for Research & Evaluation’s Children’sSafety Network: Economics and Data Analysis ResourceCenter. Incidence based on 2001 California HighwayPatrol’s Statewide Integrated Traffic Records System(SWITRS) data. Unit costs are based on the average cost ofa U.S. motor vehicle injury for pedestrians.
112 Gunnar B. Stickler, et al., “Parents’ Worry AboutChildren Compared to Actual Risks,” Clinical Pediatrics, Vol.30, No. 9, pp. 522-528 (1991).
113 Princeton Survey Research Association Poll conductedin 1997, reported in Newsweek and referenced in: DanielD. Broughton and Ernest E. Allen, “How to Keep YourChild Safe: A Message for Every Parent,” article available athttp://www.missingkids.org/. Additionally: A Roper pollreported in the Washington Post in 1987 found that 76% ofchildren “feared being kidnapped,” their number one con-cern.
114 National randomized survey conducted in October2002 by Belden Russonello & Stewart at the request of theSurface Transportation Policy Project, available online athttp://www.transact.org. Additionally: Parents respondingto the 1999 HealthStyles Survey also named fear of crimeas the third-leading reason they don’t allow their childrento walk or bicycle to school.
115 Conversation with Brad Marshland on March 1, 2003.Additionally: The recent introduction of America’s Missing:Broadcast Emergency Response Alert (AMBER Alert) pro-grams — a system of media broadcasts and electronic bill-boards that provide the public with information about kid-napped children — in California and other states hasadded to parents’ heightened the sense of danger, accord-ing to other parents interviewed for this report.
116 Data from California Office of the Attorney General,Missing Persons Section, see http://caag.state.ca.us/miss-ing/index.htm. This data pertains to children aged 0-17.
117 California Department of Justice’s Missing andUnidentified Persons Unit and the National Center forMissing and Exploited Children both confirmed that thetotal number of children abducted by strangers is nottracked, and that it is unknown how many children report-ed missing under suspicious circumstances were in factabducted.
118 Interview with Shirley Goins, Executive Director of theWest Coast office of the National Center for Missing andExploited Children on June 23, 2003.
119 David Finkelhor and Richard Ormrod, “Kidnapping ofJuveniles: Patterns from NIBRS,” Juvenile Justice Bulletin,June 2000. NIBRS is the National Incident-Based ReportingSystem.
120 David Finkelhor and Richard Ormrod, “Kidnapping ofJuveniles: Patterns from NIBRS,” Juvenile Justice Bulletin,June 2000. NIBRS is the National Incident-Based ReportingSystem.
121 Interview with Shirley Goins, Executive Director of theWest Coast office of the National Center for Missing andExploited Children on June 23, 2003.
122 California Department of Health Services, EPIC data.Additionally: A United Kingdom study found that for everychild murdered by a stranger, 50 are killed on the roads aspedestrians or bicyclists. (See: Townsend and Son (editors),“Inequalities in Health,” The Black Report, 1988.)
Chapter Four:123 U.S. News & World Report, August 2, 1957. A descriptionof this article appears in “Five Decades of Warnings Fail toGet Americans Moving,” The New York Times, September10, 2002.
124 C.L. Ogden, et al., “Prevalence and Trends inOverweight Among U.S. Children and Adolescents, 1999-2000,” JAMA 2002; 288:1728-32. This study is based on the1999-2000 National Health and Nutrition Examination
53
CAN’T GET THERE FROM HERE The Declining Independent Mobility of California’s Children and Youth
Survey (NHANES). Additionally: Numerous other scientificstudies have shown a dramatic increase among U.S. chil-dren in recent decades, including: a) S.L. Gortmaker, W.H.Dietz, A.M Sobol and C.A. Wehler, “Increasing PediatricObesity in the United States,” American Journal of Diseasesof Children 1987;141, pp.535-540; b) A.P. MacKay, et al.,“Adolescent Health Chartbook,” Health, United States,2000. Hyattsville, Maryland: National Center for HealthStatistics (2000); c) Z. Mei, et al., “Increasing Prevalence ofOverweight Among U.S. Low-Income Preschool Children,”CDC Pediatric Nutrition Surveillance, 1983 to 1995,Pediatrics 1998; 101,pp. 1-6; d) C.L. Ogden, R.P. Troiano, etal., “Prevalence of Overweight Among Preschool Childrenin the United States, 1971 to 1994,” Pediatrics 1997; 99, p.E1.
125 United States Department of Health and HumanServices, “Physical Activity and Good Nutrition: EssentialElements for Good Health,” 1999, Atlanta, GA: USDHHS,CDC, National Center for Chronic Disease Prevention andHealth Promotion. See also: a) R.C. Whitaker, et al.,“Predicting Obesity in Young Adulthood from Childhoodand Parental Obesity,” New England Journal of Medicine,1997; 337 (13), pp. 167-177; b) R.P. Troiano and K.M.Flegal, “Overweight Children and Adolescents: Description,Epidemiology, and Demographics,” Pediatrics 1998; 101(3),pp. 497-503.
126 2000 California Teenage Eating, Exercise and NutritionSurvey (CalTEENS). Conducted in 2000 by the PublicHealth Institute, CalTEENS surveyed via telephone approxi-mately 1,200 randomly selected teens aged 12-17, with amargin of error of plus/minus 3%. This data was providedby Sharon Sugerman of the California Department ofHealth Services and is expected to be published in the win-ter of 2003. Additionally: The 2001 California HealthInterview Survey (CHIS), which like CalTEENS andCalCHEEPS was based on self-reported heights and weights,found that 11.4% of California adolescents aged 12-17were overweight (see Table 23 in Appendices). The CHIS isconducted by the UCLA Center for Health Policy Research,in collaboration with the California Department of HealthServices (DHS) and the Public Health Institute (PHI).
127 California Children’s Eating and Exercise PracticesSurvey (CalCHEEPS). Conducted in 1999 by Fleishman-Hilliard Research and the Public Health Institute,CalCHEEPS surveyed via mailings 814 children aged 9-11.The mailing was sent to a demographically balanced sam-ple of California market research panel members fromthroughout the state who have a 9- to 11-year old child.The survey had a sampling error of 4-5 percentage pointsat the 95 percent confidence level.
128 California Center for Public Health Advocacy, “AnEpidemic: Overweight and Unfit Children in CaliforniaAssembly Districts,” 2002. See: http://www.publichealthad-vocacy.org/policy_briefs/overweight_and_unfit.html Thisstudy analyzed the California Department of Education’s2001 California Physical Fitness Test.
129 Conversation with Gail Woodward-Lopez, AssociateDirector of the Center for Weight and Health at U.C.
Berkeley, on May 27, 2003.
130 California Physical Fitness Test 2002, administered bythe California Board of Education. Seehttp://www.cde.ca.gov/statetests/pe/2002aboutstateresults.pdf andhttp://www.cde.ca.gov/statetests/pe/datatables.pdf. See also:A. Chilcott, “Are California’s Children Physically Fit?Eighty Percent Fail to Meet Minimum Standards,”Sacramento, CA: California Center for HealthImprovement, 2000, http://www.cchi.org/.
131 California Center for Public Health Advocacy, “AnEpidemic: Overweight and Unfit Children in CaliforniaAssembly Districts,” 2002. See: http://www.publichealthad-vocacy.org/policy_briefs/overweight_and_unfit.html. Thisstudy analyzed the California Department of Education’s2001 California Physical Fitness Test.
132 2000 California Teenage Eating, Exercise and NutritionSurvey (CalTEENS). Conducted in 2000 by the PublicHealth Institute, CalTEENS surveyed via telephone approxi-mately 1,200 randomly selected teens aged 12-17, with amargin of error of plus/minus 3%. This data was providedby Sharon Sugerman of the California Department ofHealth Services and is expected to be published in the win-ter of 2003. Additionally: Data from the CDC’s PediatricNutrition Surveillance System (PedNSS) show consistentlyhigher rates of overweight in California compared to thenational average for low-income children (aged 0-12) of allraces and ethnicities. (See: Lorrene Ritchie, et al., “PediatricOverweight: A Review of the Literature,” The Center forWeight and Health at U.C. Berkeley, June 2001,http://www.cnr.berkeley.edu/cwh/PDFs/Full_COPI_secure.pdf.)
133 California Children’s Eating and Exercise PracticesSurvey (CalCHEEPS). Conducted in 1999 by Fleishman-Hilliard Research and the Public Health Institute,CalCHEEPS surveyed via mailings 814 children aged 9-11.The mailing was sent to a demographically balanced sam-ple of California market research panel members fromthroughout the state who have a 9- to 11-year old child.The survey had a sampling error of 4-5 percentage pointsat the 95 percent confidence level. Additionally (1):According to the CDC’s Pediatric Nutrition SurveillanceSystem (PedNSS), the prevalence of overweight among low-income children aged 0-12 was 10.6% for Caucasians,12.4% for African Americans and 15.6% for Latinos in1999. (See: Lorrene Ritchie, et al., “Pediatric Overweight: AReview of the Literature,” The Center for Weight andHealth at U.C. Berkeley, June 2001, http://www.cnr.berke-ley.edu/cwh/PDFs/Full_COPI_secure.pdf.) Additionally (2):The disproportionate rate of overweight among minoritychildren is supported by numerous state and national stud-ies, including a) C. Ogden, et al., “Prevalence and Trends inOverweight Among U.S. Children and Adolescents, 1999-2000,” JAMA, Vol. 288, No. 14, Oct. 9, 2002, pp. 1728-1732; b) P.B.Crawford, et al., “Ethnic Issues in theEpidemiology of Childhood Obesity,” Ped Clin N Am 2001;48, pp. 855-878.
134 M.L. Patterson, et al., “Sociodemographic Factors andObesity in Preadolescent Black and White Girls: NHLBI’s
54
CAN’T GET THERE FROM HERE The Declining Independent Mobility of California’s Children and Youth
Growth and Health Study,” Journal of the National MedicalAssociation, 1997; 89, pp. 594-600. See also: R.P. Troianoand K.M. Flegal, “Overweight Children and Adolescents:Description, Epidemiology and Demographics,” Pediatrics,1998; 101(3), pp. 497-503.
135 E. Kennedy and J. Goldberg, “What are AmericanChildren Eating? Implications for Public Policy,” Nutr.Reviews 1995; 55, pp. 1111-126. See also: M. Nestle and S.Guttmacher, “Hunger in the United States: Rationale,Methods and Policy Implications of State Hunger Surveys,”J. New Eng. Med. 1992; 24, pp. 18-23S.
136 CDC, Pediatric Nutrition Surveillance, 1997, Fullreport, Atlanta, GA: U.S. Department of Health and HumanServices, Centers for Disease Control and Prevention, 1998.Additionally: Differences in physical activity levels mayalso help explain why children from certain racial and eth-nic groups are more likely to become fat. Despite the factthat African American and Latino children make more oftheir trips by foot or bicycle than Caucasian children, stud-ies have shown that minority and low-income childrenspend more of their overall time at sedentary activities likewatching television. The 1998 California Teen Eating,Exercise and Nutrition Survey (CalTEENS) found, for exam-ple, that rates of physical inactivity among African-American and Latino teens were twice as high as amongtheir Caucasian peers (14% and 12% vs. 7%, respectively).
137 Gail Woodward-Lopez, et al., Excerpt from “ImprovingChildren’s Academic Performance, Health and Quality ofLife: A Top Policy Commitment in Response to Children’sObesity and Health Crisis in California,” The Center forWeight and Health, University of California at Berkeley.See: http://www.cnr.berkeley.edu/cwh/PDFs/CewaerPaper_Research.pdf. Additionally:Numerous studies describe the relationship between pedi-atric overweight and increased health risks among chil-dren, including: a) G.A. Bray, “Complications of Obesity,”Ann. Int. Med. 1985; 103, pp. 1052-1062; b) R. Figueroa-Colon, et al., “Prevalence of Obesity with Increased BloodPressure in Elementary School-Aged Children,” South Med. J1997; 90, pp.806-813; c) D.S. Freedman, et al., “TheRelation of Overweight to Cardiovascular Risk FactorsAmong Children and Adolescents: The Bogalusa HeartStudy,” Pediatrics 1999; 103, pp. 1175-1182; d) O. Pinhas-Hamiel, et al., “Increased Incidence of Non-Insulin-Dependent Diabetes Mellitus Among Adolscents,” J Pediatr1996; 128, pp. 608-615; e) A.K.C. Leung and W.L.M.Robson, “Childhood Obesity,” Postgrad Med 1990; 87, pp.123 ff.; f) A.L. Rosenbloom, et al., “Emerging Epidemic ofType 2 Diabetes in Youth,” Diabetes Care 1999; 22(2), pp.345-354; g) American Diabetes Association, Type 2 Diabetesin Children and Adolescents,” Diabetes 2000; 23(3), pp.381-389; h) W.H. Dietz, “Health Consequences of Obesityin Youth: Childhood Predictors of Adult Disease,” Pediatrics1998; 101, pp. 518-525.
138 Numerous scientific studies describe the higher likeli-hood that overweight children will become obese adults,and the increased health problems experienced by obeseadults. These include: a) M.K. Serdula, et al., “Do Obese
Children Go On to become Obese Adults? A Review of theLiterature,” Prev. Med. 1993; 22, pp. 167-177; b) F.X. Pi-Sunyer, “Health Implications of Obesity,” Am. J. Clin. Nutr.1991; 53, pp. 15955-16035; c) A. Must, et al., “The DiseaseBurden Associated with Overweight and Obesity in theUnited States,” JAMA 1999; 282, pp. 1530-1529; d) “TheSurgeon General’s Call to Action to Prevent and DecreaseOverweight and Obesity 2001”; e) J. McCarthy, et al.,“Pediatric Obesity in the Clinical Setting: Epidemiology ofChildhood Obesity,” University of Florida, Dept. of Comm.Health & Fam. Med. See http://www.priory.com/childobesi-ty.htm ; f) J. Koplan. and W. Dietz, “Caloric Imbalance andPublic Health Policy,” JAMA, Vol. 282, No. 16, Oct. 27,1999, pp. 1579-1582; g) Warren Karp, “Childhood andAdolescent Obesity: A National Epidemic,” CDA JournalOctober 1998; h) Rebecca Moran, “Evaluation andTreatment of Childhood Obesity,” American FamilyPhysician, February 15, 1999.
139 Allison L. Diamant, et al., “Diabetes in California:Findings from the 2001 California Health InterviewSurvey,” April 2003, see http://www.chis.ucla.edu/main/DQ/default.asp. Additionally: In June 2003, Dr. K.M.Venkat Narayan,a CDC diabetes epidemiologist, warnedthat one in three U.S. children born in 2000 will becomediabetic unless more people start eating less and exercisingmore, and most of these cases will be type 2 diabetes. Dr.Narayan also warned that odds are particularly bad forAfrican American and Latino kids, who have roughly a50% chance of developing diabetes during their lifetime.(See: “One in Three Born in 2000 Are Likely to BecomeDiabetic,” Los Angeles Times, June 15, 2003.)
140 Interview with Dr. Kenneth Lee Jones, Professor andChair of the Department of Pediatrics at the University ofCalifornia at San Diego and Physician-in-Chief atChildren’s Hospital of San Diego, in June 2003. See also: a)N. Glasser and K.L. Jones, “Noninsulin-Dependent DiabetesMellitus in Children and Adolescents,” Adv Pediatr 1996;43, pp. 359-396; b) American Diabetes Association, “Type 2Diabetes in Children and Adolescents,” Diabetes, 23(3),March 2000, pp. 381-389; c) A.L. Rosenbloom, et al.,“Emerging Epidemic of Type 2 Diabetes in Youth,” DiabetesCare, 1999; 22(2): 345-354.
141 See: Dana Hull, “California School District First toTarget Obesity-Induced Diabetes,” San Jose Mercury News,September 19, 2002.
142 A.L. Rosenbloom, et al., “Emerging Epidemic of Type 2Diabetes in Youth,” Diabetes Care 1999; 22, pp. 345-354.
143 Numerous studies have examined the damagingimpact childhood overweight can have on psychosocialand emotional development, including: a) Jeffrey B.Schwimmer, et al., “Health-Related Quality of Life ofSeverely Obese Children and Adolescents,” JAMA; 289, pp.1813-1819, April 9, 2003; b) M.H. Falkner, et al., “Social,Educational and Psychological Correlates of Weight Statusin Adolescents,” Obes Res 2001; 9, pp. 32-42; c) A. Mustand R.S. Strauss, “Risks and Consequences of Childhoodand Adolescent Obesity,” Int J Obes Relat Metab Disord 1999;23, pp. S2-S11; d) R.S. Strauss, “Childhood Obesity and
55
CAN’T GET THERE FROM HERE The Declining Independent Mobility of California’s Children and Youth
Self-Esteem,” Pediatrics January 2000; e) Caroline Braet, etal., Psychological Aspects of Childhood Obesity,” Journal ofPediatric Psychology, January 1997.
144 S.L. Gortmaker, et al., “Social and EconomicConsequences of Overweight in Adolescence and YoungAdulthood,” New England Journal of Medicine 1993; 329(14), pp. 1008-1012. For more on the psychosocial impactsof obesity among adults, see: Gail Woodward-Lopez, et al.,“Improving Children’s Academic Performance, Health andQuality of Life: A Top Policy Commitment in Response toChildren’s Obesity and Health Crisis in California,” TheCenter for Weight and Health, University of California atBerkeley. See: http://www.cnr.berkeley.edu/cwh/PDFs/CewaerPaper_Research.pdf.
145 Surgeon General’s 2001 assessment of the annualnational cost of obesity. Additionally: Calculations by theCalifornia Department of Health Services show thatCalifornia residents spend $24.6 billion annually on healthcare related to physical inactivity and poor diet. For moreon the economic costs of obesity in the United States, see:A.M. Wolf and G.A. Colditz, “Current Estimates of theEconomic Costs of Obesity in the United States,” ObesityRes 1998; 6, pp. 97-106.
146 G. Wang and W. Dietz, “Economic Burden of Obesityin Youths Aged 6 to 17 Years: 1979-1999,” Pediatrics, Vol.109, No. 5, May 2002, p. 81. Data is in 2001 dollars.
147 Among other studies, see: a) S.B. Foerster, et al., “1998California Teen Eating, Exercise and Nutrition Survey: AlsoProfiling Body Weight and Tobacco Use — MediaHighlights,” Public Health Institute, Berkeley, CA, 2000; b)P.M. Guenther, “Beverages in the Diets of AmericanTeenagers,” J Am Diet Assoc 1986; 86(4), pp. 493-498; c)K.A. Munoz, et al., “Food Intakes of US Children andAdolescents Compared with Recommendations,” Pediatrics1997; 100, pp. 323-329; d) M.F. Jacobsen, “Liquid Candy —How Soft Drinks are Harming America’s Health,” Center forScience in the Public Interest, Washington, DC, 1999; e) P.Fabry, et al., “The Frequency of Meals: Its Relation toOverweight, Hypercholesterolaemia and Decreased GlucoseTolerance,” The Lancet 1964; 2, p. 614.; f) “The SurgeonGeneral’s Call to Action to Prevent and DecreaseOverweight and Obesity” (2001). Additionally: Much hasbeen written about how the consumption of junk food hasbeen made easier by schools that line their hallways withvending machines stocked with candy and soft drinks. Thecafeterias at many California high schools now resemblemall food courts, selling lunch from chains like Pizza Hut,Domino’s and Taco Bell.
148 S.B. Foerster, et al., “1998 California Teen Eating,Exercise and Nutrition Survey: Also Profiling Body Weightand Tobacco Use — Media Highlights,” Public HealthInstitute, Berkeley, CA, 2000.
149 California Department of Education, California YouthRisk Behavior Survey Results, 1997. This 1997 survey alsofound that one-third of California’s high school studentshad not walked or bicycled for at least 30 minutes at anytime during the previous week. Additionally (1): The 1996
Surgeon General’s report on Physical Activity and Healthrevealed that just 26 percent of U.S. youths aged 12 to 21walked or bicycled for 30 minutes a week in 1992, a figurethat dropped to 21 percent in 1995. Additionally (2): Arecent study by the Oregon Department of Transportation’sBicycle and Pedestrian Program showed a dramatic declinein the average number of youths cycling daily at a numberof monitored sites, from 61 in 1987 to 27 in 1997. (Source:Michael Ronkin at Oregon Department of Transportation’sBicycle and Pedestrian Program.)
150 California Children’s Eating and Exercise PracticesSurvey (CalCHEEPS). Conducted in 1999 by Fleishman-Hilliard Research and the Public Health Institute,CalCHEEPS surveyed via mailings 814 children aged 9-11.The mailing was sent to a demographically balanced sam-ple of California market research panel members fromthroughout the state who have a 9- to 11-year old child.The survey had a sampling error of 4-5 percentage pointsat the 95 percent confidence level. Additionally: It is wellknown that many California schools now provide theirstudents with even less PE than the state requires — 100minutes per week for first- through sixth-graders, and 200minutes per week for seventh- through tenth-graders.Children’s decreasing participation in PE programs is large-ly explained by the fact that California’s public schoolshave been relaxing PE requirements since the late 1970s,when state funding for education began tightening in theaftermath of Proposition 13. For more information, see:T.L. McKenzie, et al., “Effects of a Curriculum and InserviceProgram on the Quantity and Quality of ElementaryPhsyical Education Classes,” Research Quarterly for Exerciseand Sport 1993(64), pp. 178-187.
151 California Department of Education, California YouthRisk Behavior Survey Results, 1997. Additionally: TheCDC’s 2001 Youth Risk Behavior Survey (YRBS) found thatonly 52 percent of U.S. students were enrolled in a PE classin 2001.
152 California Teenage Eating, Exercise and NutritionSurvey (CalTEENS). Conducted in 1998 by the PublicHealth Institute, CalTEENS surveyed via telephone 1,213randomly selected teens aged 12-17. Additionally:Numerous studies have shown that TV viewing has becomean increasingly popular pastime among US children, andthat large amounts of time spent watching TV is oftenlinked to overweight in kids. These studies include: a) A1998 Nielsen Media Research report that found the averageAmerican child between the ages of eight and 18 spendsmore than three hours a day watching television andanother three or four hours with the Internet and videogames; b) D.F. Roberts, et al., “Kids and Media at the NewMillennium: A Comprehensive National Analysis ofChildren’s Media Use,” The Henry J. Kaiser FamilyFoundation Report, Menlo Park, CA, 1999; c) R.E.Anderson, et al., “Relationship of Physical Activity andTelevision Watching with Body Weight and Level ofFatness among Children: Results from the Third nationalHealth and Nutrition Examination Survey,” JAMA 1998;279, pp. 938-942; d) C.S. Berkey, et al., “Activity, DietaryIntake and Weight Changes in a Longitudinal Study of
56
CAN’T GET THERE FROM HERE The Declining Independent Mobility of California’s Children and Youth
Preadolescent and Adolescent Boys and Girls,” Pediatrics2000; 105, pp. E56. For more information, see LorreneRitchie, et al., “Prevention of Childhood Overweight: WhatShould be Done?” Position Paper, The Center for Weightand Health at U.C. Berkeley, 2001, see: http://www.cnr.berke-ley.edu/cwh/PDFs/Prev_Child_Oweight_10-28-02.pdf.
153 L.H. Epstein, et al., “Ten-Year Outcomes of BehavioralFamily-Based Treatment for Childhood Obesity,” HealthPsychol. 1994; 13(5), pp. 373-383. Other research by Dr.L.H. Epstein points to similar relationships between physi-cal activity and childhood overweight, including: L.H.Epstein, et al., “Decreasing Sedentary Behaviors in TreatingPediatric Obesity,” Arch Pediatr Adolesc Med. 2000 Mar;154(3), pp. 220-226 and L.H. Epstein, et al., “Exercise intreating obesity in children and adolescents,” Med Sci SportsExerc 1996 Apr; 28(4), pp. 428-435.
154 Frank Hu, et al., “Walking Compared with VigorousPhysical Activity and Risk of Type 2 Diabetes in Women,”JAMA, October 20, 1999.
155 Quoted in Harvard School of Public Health newsletter(Around the School), October 22, 1999.
156 Quoted in The San Francisco Chronicle, August 17,2002.
157 Surface Transportation Policy Project, Mean Streets2000, Washington, DC, 2000, p. 18. Report available onlineat http://www.transact.org. Additionally: Numerous scien-tific studies show a relationship between low levels ofphysical activity and increased overweight among children.These include: a) C.S. Berkey, et al., “Activity, DietaryIntake and Weight Changes in a Longitudinal Study ofPreadolescent and Adolescent Boys and Girls,” Pediatrics2000; 105, pp. E56; b) J.P. DeLany, et al., “EnergyExpenditure in Lean and Obese Prepubertal Children,”Obes Res 1995; 3 Suppl 1, pp. 67-72; c) M. Garaulet, et al.,“Differences in Dietary Intake and Activity Level BetweenNormal-Weight and Overweight or Obese Adolescents,” JPediatr Gastroenterol Nutr 2000; 30, pp. 253-258; d) D.W.Harsha, “The Benefits of Physical Activity in Childhood,”Am J Med Sci 1995; 310, pp. S109-113; e) C. Maffeis, et al.,“Relationship Between Physical Inactivity and Adiposity inPrepubertal Boys,” J Pediatr 1997; 131, pp. 288-292; f) O.T.Raitakari, et al., “Effects of Persistent Physical Activity andInactivity on Coronary Risk Factors in Children and YoungAdults: The Cardiovascular Risk in Young Finns Study,” AmJ Epidemiol 1994; 140, pp. 195-205.
158 Quote from Dr. William Dietz emailed by his office tothe Surface Transportation Policy Project on July 1, 2003.
159 The California Department of Education released astudy on December 10, 2002, showing a significant rela-tionship between academic achievement and the physicalfitness of California students. The study matched scoresfrom the spring 2001 administration of Stanford 9 Test(SAT-9) with results of the same 954,000 students’ perform-ance on the 2001 physical fitness test, and found that stu-dents’ academic achievement is related to their levels ofhealth related physical fitness. Additionally: Studies haveshown that exercise reduces depression and anxiety and
improves people’s moods. These include: U.S. Departmentof Health & Human Services, “Physical Activity andHealth: A Report of the Surgeon General,” Washington,DC, 1996.
160 See press release from the National Association forSport and Physical Education, December 10, 2002 athttp://www.ncaahperd.org/FitnessAcademicstudy.html.
161 R. Kreutzer, et al., “Asthma in California: Laying theFoundation for a Statewide Strategy.” California PolicySeminar, August 1998. Additionally; Nationwide, the per-centage of children diagnosed with asthma more than dou-bled between 1980 and 2001, from 3.6 percent to 8.7 per-cent. And among children under four years old, the preva-lence of asthma increased 160% nationwide between 1980and 1995, from 2.3 million children in 1980 to 5.5 millionin 1995. (See: U.S. Department of Health and HumanServices and National Heart, Lung and Blood Institute,Data Fact Sheet: Asthma Statistics, 1999, see:http://www.nhlbi.nih.gov/health/prof/lung/asthma/asth-stat.pdf.) Asthma is also the number one cause of hospital-ization among children under the age of 15 nationwide.(See: American Lung Association, Pediatric Asthma: AGrowing Threat, 2002, see: http://www.lungusa.org/asth-ma/merck_pediatric.html.)
162 Asthma and Allergy Foundation of America (AAFA),“The Costs of Asthma in the United States,”http://www.aafa.org/states/index.cfm. Additionally (1): The2001 National Health Interview Survey found that the per-centage of U.S. children with asthma more than doubledbetween 1980 and 2001, from 3.6 percent to 8.7 percent.Additionally (2): An estimated 10.1 million school days arelost to asthma each year among the nation’s children.
163 Centers for Disease Control and Prevention. “AsthmaPrevalence, Health Care Use and Mortality, 2000-2001”NCHS Health E-Stats, http://www.cdc.gov/nchs/products/pubs/pubd/hestats/asthma/asthma.htm.
164 E.R. Brown, et al., “Asthma in California in 2001: HighRates Affect Most Population Groups,” analysis of 2001California Health Interview Survey data, May 2002. Thisstudy also finds that asthma is a particularly serious prob-lem in California: Nearly 12 percent of the state’s overallpopulation has been diagnosed with asthma at some pointin their lives, compared to about 10 percent of the nationalpopulation.
165 E.R. Brown, et al., “Asthma in California in 2001: HighRates Affect Most Population Groups,” analysis of 2001California Health Interview Survey data, May 2002.Additionally: Another study found that African Americanchildren were four times as likely to be hospitalized, andseven times more likely to die, of asthma in Californiathan Caucasian children between 1995 and 1998. (See:California Department of Health Services, EnvironmentalHealth Investigations Branch, California County AsthmaHospitalizations Chart Book, Aug. 2000.) This study alsofound that, in San Francisco, Latino children were 50%more likely than Caucasian children to be hospitalized forasthma between 1995 and 1998. For more information
57
CAN’T GET THERE FROM HERE The Declining Independent Mobility of California’s Children and Youth
about the higher prevalence of asthma among minoritiesin the U.S., see: American Lung Association. Minority LungDisease Data 2000. http://www.lungusa.org/pub/minori-ty/mldd_00.html.
166 See: E. R. Brown, et al., “Noncitizen Children’s RisingUninsured Rates Threaten Access to Health Care,” UCLA:Center for Health Policy Research, 1999 and E. R. Brown, etal., “The State of Health Insurance in California: RecentTrends, Future Prospects,” UCLA: Center for Health PolicyResearch, 2001.
167 Conversation with Raquel F. Donoso, Deputy Directorof Latino Issues Forum, in June 2003.
168 M. Cone, “Hot Spots for Cancer Risk from Toxic AirIdentified,” Los Angeles Times, November 5, 1999.
169 Environmental Working Group, “People of Color inCalifornia Breathe the Most Heavily Polluted Air,” 1997.See:http://www.ewg.org/reports/caminority/caminority.html
170 American Lung Association. “Annotated Bibliographyof Recent Studies on the Health Effects of Air Pollution,”October 11, 2002. Additionally (1): Some of the most com-pelling evidence of how pollution from cars and trucks islinked to asthma comes from Atlanta, where during the1996 Summer Olympics the city made a concerted effort toreduce driving. These efforts were so successful that morn-ing traffic dropped by 22.5 percent, with a commensuratedecline in peak daily ozone levels of 28 percent and partic-ulate matter of 16 percent. Researchers found a large drop— 41.6 to 44.1 percent — in acute care visits for asthmaand an 11.1 percent reduction in pediatric hospital emer-gency room visits. (See: M.S. Friedman, et al., “Impact ofChanges in Transportation and Commuting BehaviorsDuring the 1996 Summer Olympic Games in Atlanta onAir Quality and Childhood Asthma.” JAMA 2001; Vol. 285,No. 7: pp. 897-905.) Additionally (2): Numerous studieshave linked ozone and other air pollutants emitted by carsand trucks not only to asthma, but also to such healthproblems as cancer, heart attacks, strokes, hypertensionand birth defects in both children and adults.
171 Environmental Protection Agency’s Office ofEnvironmental Assessment and the American LungAssociation, “Air Pollution and Children’s Health” (fact-sheet), http://www.californialung.org/downloads/diesel010501/ALA-OEHHA_children.pdf. For more informa-tion on why children are at special risk for asthma, seeAmerican Lung Association, “State of the Air: 2003,” pp.17-18.
172 R. McConnell, et al., “Asthma in Exercising ChildrenExposed to Ozone: A Cohort Study,” The Lancet, v. 359,Feb. 2, 2002, pp. 386-391. See also: a) University ofSouthern California and the California Air Resources Board,“Epidemiologic Investigation to Identify Chronic HealthEffects of Ambient Air Pollutants in Southern California(The Children’s Health Study),” 1991-2001,http://www.arb.ca.gov/newsrel/nr013102.htm; b) W.F.McDonnell, et al., “Long-Term Ambient OzoneConcentration and the Incidence of Asthma in
Nonsmoking Adults: The Ashmog Study,” EnvironmentalResearch 1999, Section A Vol. 80, pp. 110-121; c) M. Brauer,et al., “Air Pollution from Traffic and the Development ofRespiratory Infections and Asthmatic and AllergicSymptoms in Children,” American Journal of Respiratory andCritical Care Medicine 2002; Vol. 166, No. 8, pp. 1092-1098;d) Y.L. Guo, et al., “Climate, Traffic-Related Air Pollutants,and Asthma Prevalence in Middle-School Children inTaiwan,” Environmental Health Perspectives 1999; Vol. 107,No. 12, pp. 1001-1006.
173 See: a) N. Künzli, et al., “Association Between LifetimeAmbient Ozone Exposure and Pulmonary Function inCollege Freshman-Results of a Pilot Study.” EnvironmentalResearch 1997; Vol. 72, pp. 8-23; b) J.M. Peters, et al., “AStudy of Twelve Southern California Communities withDiffering Levels and Types of Air Pollution. II. Effects ofPulmonary Function,” American Journal of Respiratory andCritical Care Medicine 1999; Vol. 159, pp 768-775; c) A.Galizia and P.L. Kinney, “Long-Term Residence in Areas ofHigh Ozone: Associations with Respiratory Health in aNationwide Sample of Nonsmoking Young Adults,”Environmental Health Perspectives 1999; Vol. 107, No. 8, pp.675-679; d) E.L. Avol, et al., “Respiratory Effects ofRelocating to Areas of Differing Air Pollution Levels,”American Journal of Respiratory and Critical Care Medicine2001; Vol. 164, pp. 2067-2072; e) W.J. Gauderman, et al.,“Association between Air Pollution and Lung FunctionGrowth in Southern California Children: Results from aSecond Cohort,” American Journal of Respiratory and CriticalCare Medicine 2002; Vol. 166, pp. 76-84; f) F. Horak, Jr., etal., “Particulate Matter and Lung Function Growth inChildren: A 3-Year Follow-up Study in AustrianSchoolchildren,” European Respiratory Journal 2002; Vol. 19,pp. 838-845. Additionally: A study of Mexico City childrenwith no known symptoms of lung problems found thattwo-thirds of children with prolonged exposure to air pol-lution developed excessive inflation of both lungs. (See: Dr.Lynn Ansley Fordham of the University of North CarolinaSchool of Medicine, et al., study reported by The AssociatedPress, November 29, 2001.) Additionally: Several scientificstudies have demonstrated that children living near heavilytraveled roads, particularly those with significant truck traf-fic, are much more likely to be hospitalized for asthma.(See: a) S. Lin, et al., “Childhood Asthma Hospitalizationand Residential Exposure to State Route Traffic,”Environmental Research 2002; Vol. 88, No. 2, pp. 73-81; b) J.Edwards, et al., “Hospitalization Admissions for Asthma inPreschool Children: Relationship to Major Roads inBirmingham, United Kingdom,” Archive of EnvironmentalHealth 1994; Vol. 49, No. 4, pp. 223-227; c) R.L. Pearson,“Distance-Weighted Traffic Density in Proximity to a Homeis a Risk Factor for Leukemia and Other ChildhoodCancers,” Journal of Air Waste Manag Assoc; 50(3), pp. 175-180.)
174 S. Duesberg, “Asthma and School Nursing in FresnoUnified School District,” Fresno, CA: California StateUniversity, Fresno.
175 The Fresno Bee, Aug. 18, 2002. Additionally: A recentsurvey of Central Valley residents found that 41% of
58
CAN’T GET THERE FROM HERE The Declining Independent Mobility of California’s Children and Youth
households with children younger than 18 had at least onefamily member with a respiratory problem such as asthma.The poll was conducted by the Public Policy Institute ofCalifornia and the Great Valley Center in early 2003. (See:Eric Bailey, “Smog Fears High in Central Valley,” LosAngeles Times, April 30, 2003.)
176 Environmental Protection Agency’s Office ofEnvironmental Assessment and the American LungAssociation, “Air Pollution and Children’s Health” (fact-sheet), http://www.californialung.org/downloads/diesel010501/ALA-OEHHA_children.pdf .
177 C.A. Pope, et al., “Lung Cancer, CardiopulmonaryMortality, and Long-term Exposure to Fine Particulate AirPollution,” JAMA 2000; 287(9), pp.1132-1141.
178 U.S. Public Interest Research Group (PIRG), “Danger inthe Air: The 2001 Ozone Season,”http://uspirg.org/reports/dangerintheair2002.pdf.Additionally: A recent study in Los Angeles found that thetiniest airborne particles found in smog (particulate mattermeasuring 2.5 microns across) can penetrate and deformcells such as those in lung lining and kill the cells. Thestudy’s lead author has said that many of these particles“are derived from vehicle emissions.” (See: Andre Nel, JohnFroines, et al., “Ultrafine Particulate Pollutants InduceOxidative Stress and Mitochondrial Damage,”Environmental Health Perspectives, 2003; Vol. 111, No. 4,pp.455 ff. Dr. Nel. The lead author, is quoted by TheAssociated Press, April 7, 2003.)
179 California Air Resources Board, “Particulate AirPollution and Morbidity in the California Central Valley: AHigh Particulate Pollution Region,” Stephen K. Van DenEeden (principal investigator), Final Report, July 2002. Thestudy looked at hospital and emergency room admissionsof Kaiser Permanente patients in the San Joaquin Valleybetween 1996 and 2000. (See ftp://ftp.arb.ca.gov/carbis/research/apr/past/97-303.pdf.) For these reasons, Californiaenacted a new law in December 2002 prohibiting drivers ofdiesel school buses and trucks from leaving engines run-ning idle for long stretches within 100 feet of a school orplayground when schoolchildren are present.
180 California Air Resources Board, “2002 CaliforniaAlmanac of Emissions & Air Quality.” Additionally:Tailpipe emissions from motor vehicles also play a role inthe production of “secondary” particulate matter, whichforms when nitrogen oxides and VOCs react with ammo-nia in the atmosphere. Studies suggest that secondary par-ticulate matter accounts for a major portion of the PM-10levels in urban areas. Dust kicked up from roads that carsand trucks drive on also adds to particulate matter levels.(See: California Air Resources Board, “2002 CaliforniaAlmanac of Emissions & Air Quality.”)
181 Vehicle registration data provided by Bill Davidson ofthe California Department of Motor Vehicles’ ForecastingSection.
182 California Air Resources Board, “2002 CaliforniaAlmanac of Emissions & Air Quality.” Additionally:Californians aren’t just traveling farther, they’re also travel-
ing more often. Data from the Bay Area’s MetropolitanTransportation Commission shows, for example, that thenumber of trips made daily in personal vehicles within theBay Area grew nearly 17% between 1990 and 2000. Theincrease in trip making is especially bad news for air quali-ty, as 60% to 80% of pollutants are emitted during the firstfew minutes after a car or truck has been turned on, beforethe catalytic converter can start doing its job. (See:Metropolitan Planning Commission, “Travel Forecasts forthe San Francisco Bay Area 1990-2025: Auto Ownership,Trip Generation and Trip Distribution,” Data Summary,May 2001.)
183 American Lung Association, “State of the Air: 2003.”See http://www.lungchicago.org/programs/SOTA_03.pdf.
184 U.S. Public Interest Research Group (PIRG), “Dangerin the Air: The 2001 Ozone Season,”http://uspirg.org/reports/dangerintheair2002.pdf.
185 Conversation with Choe Owen, EnvironmentalScientist, Air Division, EPA Region IX, San Francisco, onSeptember 5, 2002.
186 California Air Resources Board (CARB). Data providedby CARB’s Mary Nystrom in June 2003. This data for 2000varies slightly from the 2000 data found in CARB’s “2002California Almanac of Emissions & Air Quality” and fromdata for 2000-2001 reported previously by some media (forexample: John Doxey, “A Lush Valley Struggles to Breathe,”Business Week, February 25, 2002.) Ms. Nystrom explainsthat CARB has revised some of the 2000 data published inthe “2002 California Almanac of Emissions & Air Quality.”)Additionally: It is also interesting to note that, afterdecades of improvement, ozone levels in the Los Angelesarea appear to be climbing, due largely to the region’sgrowing population and motor vehicle traffic. (See: GaryPolakovic, “Smog Woes Back on Horizon” and “SmogFighters Out of Weapons,” Los Angeles Times, July 15 andJuly 16, 2003 (respectively).)
187 California Air Resources Board, “The 2002 CaliforniaAlmanac of Emissions & Air Quality.”
188 Gail Woodward-Lopez, et al., Excerpt from “ImprovingChildren’s Academic Performance, Health and Quality ofLife: A Top Policy Commitment in Response to Children’sObesity and Health Crisis in California,” The Center forWeight and Health, University of California at Berkeley.See: http://www.cnr.berkeley.edu/cwh/PDFs/CewaerPaper_Research.pdf.
189 Dan Burden, Verbal Communication, WalkableCommunities, Inc. Additionally (1): “Independent play andmobility by school-aged children in their neighborhoodshave been found to contribute to their social and spatialdevelopment,” states a recent article by a team of U.C.Irvine researchers (See: Peter Jacobsen, et al., “ChildPedestrian Injuries on Residential Streets: Implications forTraffic Engineering,” Institute of Traffic Engineers Journal onthe Web, February 2000.) Additionally (2): “Residentialneighborhoods without a safe and healthy environment donot accommodate the developmental needs of children,”says Dr. Judy Young, Executive Director of the National
59
CAN’T GET THERE FROM HERE The Declining Independent Mobility of California’s Children and Youth
Association for Sport and Physical Education. Dr. Youngalso says that walking and other exercise benefits morethan children’s bones and muscles, and that “in veryyoung children, movement reinforces cognitive develop-ment” (Chicago Daily Herald, September 30, 2002).
190 Bruce Appleyard, Marcus Diederich and VijayJayachandran, “Effects of Traffic on Children’s Sense ofPlace: A Case Study in Environmental Research,” UrbanDesign Research Seminar Class Project, U.C. Berkeley, 1995.
Additionally: High traffic volumes and car-dependence notonly make children unfamiliar with their neighborhood,but they can also isolate children socially. Studies have alsoshown, for instance, that children and other residents ofstreets with low levels of traffic have more friends andacquaintances than residents of streets with higher trafficvolumes. (See: Natural Resources Defense Council, “UsingResidential Patterns and Transit to Decrease AutoDependence and Costs,” June 1994.)
60
CAN’T GET THERE FROM HERE The Declining Independent Mobility of California’s Children and Youth
TABLES 1, 2, 4A, 4B: The California
Department of Transportation’s 2000-2001
California Statewide Household Travel Survey was
conducted between October 2000 and December
2001. The survey reflects responses from 17,040
households with a total of 8,582 children under
the age of 18. Households and children from each
of the state’s 58 counties participated in the sur-
vey. It should be noted that all Caltrans children’s
data included in this report refers to “unlinked”
trips. The 2000-2001 California Statewide
Household Travel Survey is available online at
http://www.dot.ca.gov/hq/tsip/TSIPPDF/2000_Ho
usehold_Survey.pdf.
The children’s transportation data that appear in
this report were collected during the survey process,
but have never been reported or published until
now as a separate data set. Caltrans disaggregated
children’s survey data for the first time in 2002, fol-
lowing a request by the Surface Transportation
Policy Project, and this report marks the first time
that Caltrans survey data specific to children has
been broken out and published.
Because Caltrans has never disaggregated chil-
dren’s data collected during the agency’s previous
statewide travel surveys, the authors of this report
have not been able to use Caltrans data to com-
pare children’s travel patterns in California over
time. This has limited the authors’ ability to show
historical changes in the way California’s children
get around, as Caltrans’ surveys are the most
comprehensive source of statewide travel data.
National Personal Transportation Survey
and National Household Transportation
Survey: The National Household Transportation
Survey (NHTS), formerly called the National
Personal Transportation Survey (NPTS), is one of
the most comprehensive efforts undertaken by
the U.S. Department of Transportation to identify
changes in American travel patterns over time.
The household telephone survey documents
mode, time, length and destinations of trips. The
most recent survey, conducted in 2001, includes
data from 25,721 households. The previous sur-
vey, conducted in 1995, includes data from
42,633 households. The 2001 NHTS can be found
on the Web at http://nhts.ornl.gov.
Due to differences in survey questioning and
methodology, direct comparisons of modeshare
data from the various NHTS and NPTS surveys are
often difficult or impossible. For example, the
2001 NHTS reports data for children aged 0-15
while the 1995 NPTS reports data for children
aged 5-15. Also, the 2001 NHTS shows an artifi-
cially large increase in walk and bike trips vs. the
1995 NPTS, due to more questionnaire prompts.
However, differences in survey questioning and
methodology for the 1977 and 1995 NPTS surveys
are small enough to permit direct modeshare data
comparisons. The 1977 vs. 1995 comparisons
contained in this report have been previously
cited and approved by researchers from the U.S.
Centers for Disease Control & Prevention and
Oak Ridge National Laboratory.
TABLE 3: To analyze why the majority of
American children do not walk or bike to school,
the U.S. Centers for Disease Control & Prevention
(CDC) analyzed data from the national
HealthStyles Survey, an annual mail survey of
health related attitudes and behaviors. CDC pro-
vides technical assistance to Porter/Novelli
(Washington, D.C.) in conducting the
HealthStyles Survey. In 1999, a total of 2,636
households responded to the survey. The 749
households with children aged 5-18 were asked 1)
if their youngest child walked or biked to school
at least once a week during the preceding month,
and 2) whether any of six specified barriers made
M E T H O D O L O G Y
61
it difficult to do so: traffic danger, crime danger,
long distances, weather, opposing school policies
or other reasons. Multiple responses were accept-
ed. Respondents also had the option of stating
that their children had no barriers to walking or
biking to school. Of the 611 respondents, 16%
reported no barriers to their children walking or
biking to school and 25% reported children walk-
ing or biking to school at least once a week dur-
ing the preceding month. Of the 16% who
reported no barriers, 85% reported children walk-
ing or biking to school at least once a week dur-
ing the preceding month. Children with no barri-
ers were six times more likely to walk or bike to
school than their peers aged 5-18 with one or
more barriers. For more information about the
methodology of this survey, see the CDC’s
Morbidity and Mortality Weekly Report (MMWR),
Vol. 51, No. 32, August 16, 2000.
TABLE 6: Data used to estimate expenditures
on children are from the 1990-92 Consumer
Expenditure Survey-Interview portion (CE).
Administered by the Bureau of Labor Statistics
(BLS), U.S. Department of Labor, this survey is the
most comprehensive source of information on
household expenditures available at the national
level. The sample consists of 12,850 husband-wife
households and 3,395 single-parent households
and was weighted to reflect the U.S. population
of interest, using BLS weighting methods.
Multivariate analysis was used to estimate
household and child-specific expenditures, con-
trolling for income level, family size, and age of
the younger child so estimates could be made for
families with these varying characteristics (region-
al estimates were also derived by controlling for
region). Households with two children were
selected as the base since this was the average
number of children in two-parent families.
Estimated household and child-specific expen-
ditures were allocated among family members.
Since the estimated expenditures for clothing,
child care, and education only apply to children
(adult-related expenses for these items were exclud-
ed), allocations of these expenses were made by
dividing the estimates equally among the children.
TABLES 7, 9, 12: EPIC’s main data sets include
fatal and hospitalized nonfatal injuries. Fatal cases
are identified by searching the death certificates of
California residents for any record where the
underlying cause of death was an injury (defined
as cases where there was a nationally recognized
categorized external cause or “E-Code” listed as
the underlying cause of death). Similarly, nonfatal
injuries are identified by searching hospital dis-
charge data (HDD) for records where a California
resident was hospitalized for an injury (an E-Code
was present in the record). To ensure an injury
event is not recorded twice, cases that died in the
hospital are removed from the HDD data. Thus
fatal and nonfatal data sets should be mutually
exclusive. Injuries due to adverse effects of med-
ical encounters and drugs are also excluded.
TABLES 10A, 10B: As recommended by the
Panel on Cost-Effectiveness in Health and
Medicine, the Pacific Institute for Research &
Evaluation’s Children’s Safety Network:
Economics and Data Analysis Resource Center
reports the present value of future costs (comput-
ed at a 3% discount rate) and adopts a societal
perspective that includes all costs associated with
the injuries-costs to victims, families, govern-
ment, insurers, and taxpayers. Cost-of-injury esti-
mates were computed by multiplying the number
of victims from the 2001 CHP SWITRS incident
data times corresponding costs per victim (in
2000 dollars). Cost was estimated separately for
62
CAN’T GET THERE FROM HERE The Declining Independent Mobility of California’s Children and Youth

fatal and non-fatal injuries, and for medical, work
loss, public service, property damage and quality-
of-life (QOL) costs. Medical includes spending on
hospital and professional services, rehabilitation,
prescriptions, home health care, medical equip-
ment, and funeral expenses (if necessary adjusted
by the health care index). Victim Work Loss
includes wages, fringe benefits and household
work for adults. It is the present value of a life-
time’s worth of wage and household work that
children will be unable to do as adults if they are
killed or permanently disabled, these earnings
include fringe benefits (if necessary adjusted by
the wage index). Public Services includes police,
fire, ambulance, and helicopter services. Property
Damage is the cost to repair or replace damaged
vehicles or property. Quality of Life places a dol-
lar value on the pain, suffering, and lost quality
of life that children and their families experience
due to death ands injury.
2001 provisional numbers from the
California Highway Patrol’s Statewide
Integrated Traffic Records System (SWITRS)
(Tables 8, 10A, 10B): The Statewide Integrated
Traffic Records System (SWITRS) processes all
reported fatal and injury collisions which
occurred on California’s state highways and all
other roadways, excluding private property.
Figure 4: At STPP’s request, Belden Russonello
& Stewart conducted a national random sample
telephone survey of 800 adults, age 18 and older
in October 2002. The margin of sampling error
for the survey is plus or minus 3.5 percentage
points at the 95% level of confidence. For this
question (in which pollsters asked parents about
reasons their child do not walk to school) multi-
ple responses were accepted. (Base: N=166 whose
children ages 7-17 do not walk or bike to school.)
See http://www.transact.org/library/reports_
html/pedpoll/pedpoll.asp.
California Teenage Eating, Exercise and
Nutrition Survey (CalTEENS): Conducted in
1998 and 2000 by the Public Health Institute,
CalTEENS 2000 surveyed by telephone approxi-
mately 1,200 randomly selected teens aged 12-17,
with a margin of error of plus/minus 3%. This
unpublished data was provided to the Surface
Transportation Policy Project by Sharon
Sugerman of the California Department of Health
Services and is expected to be published in the
winter of 2003.
California Children’s Eating and Exercise
Practices Survey (CalCHEEPS): Conducted in
1999 by Fleishman-Hilliard Research and the
Public Health Institute, CalCHEEPS surveyed via
mailings 814 children aged 9-11. The mailing was
sent to a demographically balanced sample of
California market research panel members from
throughout the state who have a 9- to 11-year old
child. The survey had a sampling error of 4-5 per-
centage points at the 95 percent confidence level.
California Health Interview Survey (CHIS):
The California Health Interview Survey (CHIS) is
conducted by the UCLA Center for Health Policy
Research, in collaboration with the California
Department of Health Services (DHS) and the
Public Health Institute (PHI). CHIS is the largest
state health survey in the United States. It is a
telephone survey conducted every two years on
public health topics and access to health care.
63
CAN’T GET THERE FROM HERE The Declining Independent Mobility of California’s Children and Youth
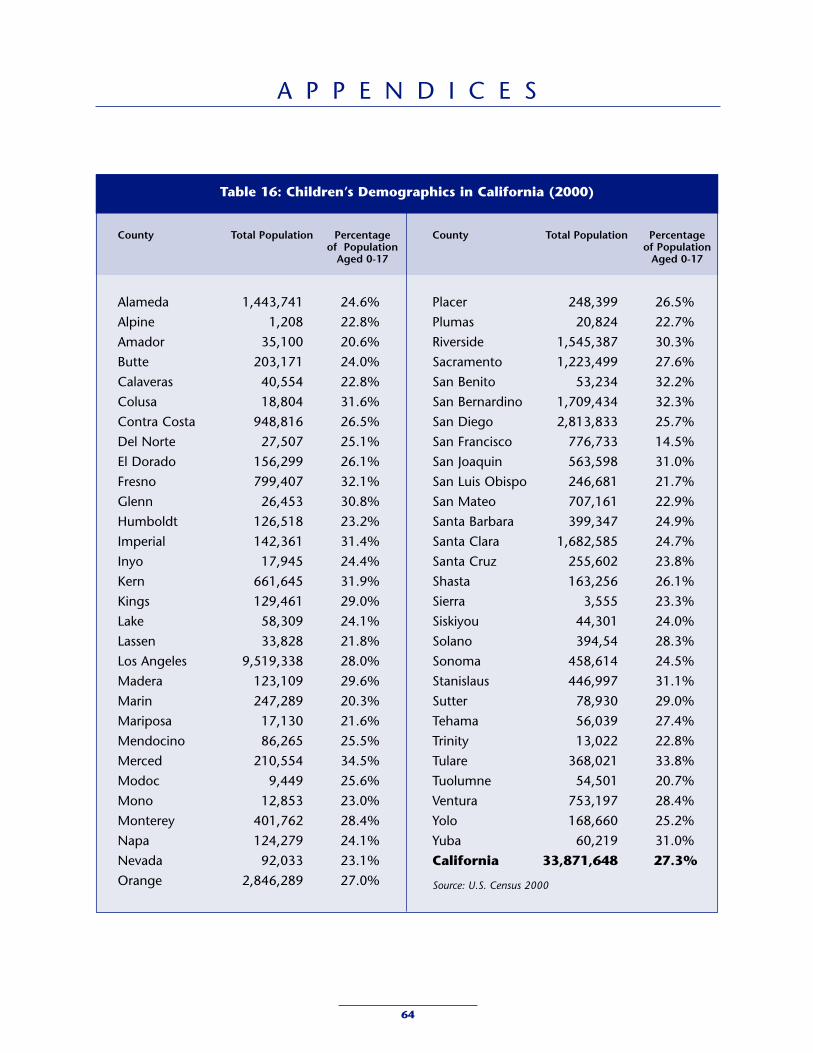
A P P E N D I C E S
64
County Total Population Percentageof Population
Aged 0-17
Alameda 1,443,741 24.6%Alpine 1,208 22.8%Amador 35,100 20.6%Butte 203,171 24.0%Calaveras 40,554 22.8%Colusa 18,804 31.6%Contra Costa 948,816 26.5%Del Norte 27,507 25.1%El Dorado 156,299 26.1%Fresno 799,407 32.1%Glenn 26,453 30.8%Humboldt 126,518 23.2%Imperial 142,361 31.4%Inyo 17,945 24.4%Kern 661,645 31.9%Kings 129,461 29.0%Lake 58,309 24.1%Lassen 33,828 21.8%Los Angeles 9,519,338 28.0%Madera 123,109 29.6%Marin 247,289 20.3%Mariposa 17,130 21.6%Mendocino 86,265 25.5%Merced 210,554 34.5%Modoc 9,449 25.6%Mono 12,853 23.0%Monterey 401,762 28.4%Napa 124,279 24.1%Nevada 92,033 23.1%Orange 2,846,289 27.0%
County Total Population Percentageof Population
Aged 0-17
Placer 248,399 26.5%Plumas 20,824 22.7%Riverside 1,545,387 30.3%Sacramento 1,223,499 27.6%San Benito 53,234 32.2%San Bernardino 1,709,434 32.3%San Diego 2,813,833 25.7%San Francisco 776,733 14.5%San Joaquin 563,598 31.0%San Luis Obispo 246,681 21.7%San Mateo 707,161 22.9%Santa Barbara 399,347 24.9%Santa Clara 1,682,585 24.7%Santa Cruz 255,602 23.8%Shasta 163,256 26.1%Sierra 3,555 23.3%Siskiyou 44,301 24.0%Solano 394,54 28.3%Sonoma 458,614 24.5%Stanislaus 446,997 31.1%Sutter 78,930 29.0%Tehama 56,039 27.4%Trinity 13,022 22.8%Tulare 368,021 33.8%Tuolumne 54,501 20.7%Ventura 753,197 28.4%Yolo 168,660 25.2%Yuba 60,219 31.0%California 33,871,648 27.3%
Source: U.S. Census 2000
Table 16: Children’s Demographics in California (2000)
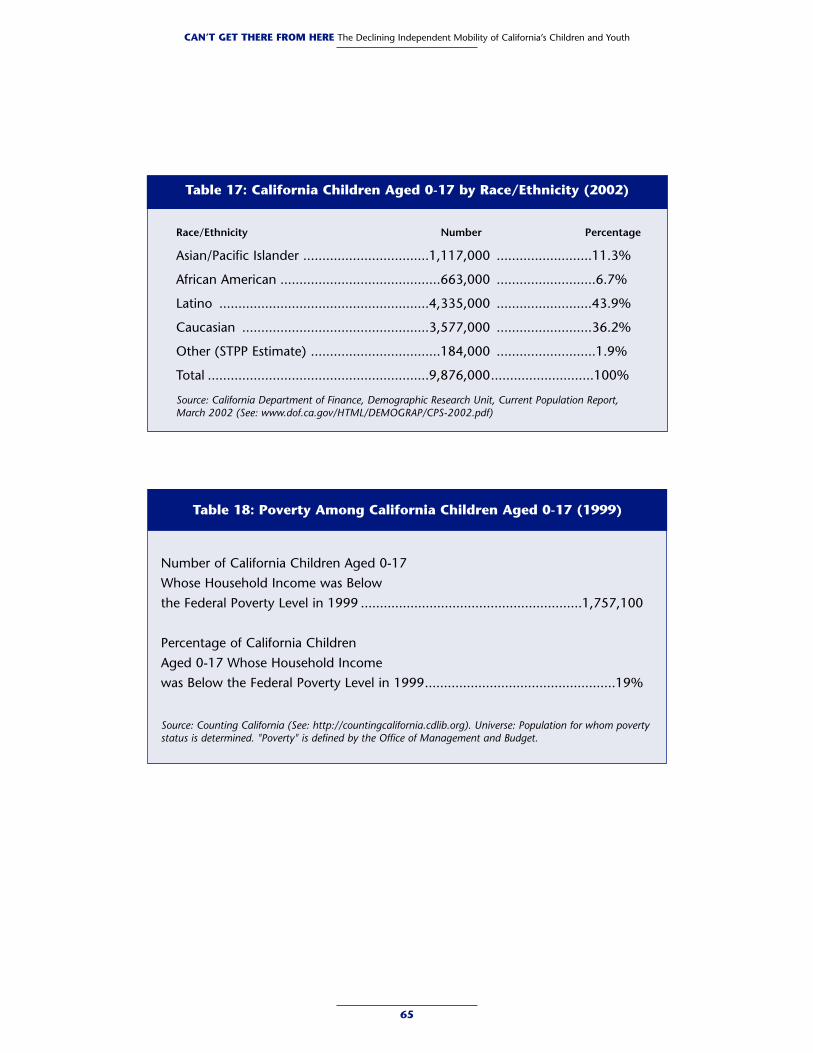
Table 17: California Children Aged 0-17 by Race/Ethnicity (2002)
65
CAN’T GET THERE FROM HERE The Declining Independent Mobility of California’s Children and Youth
Race/Ethnicity Number Percentage
Asian/Pacific Islander .................................1,117,000 .........................11.3%
African American ..........................................663,000 ..........................6.7%
Latino .......................................................4,335,000 .........................43.9%
Caucasian .................................................3,577,000 .........................36.2%
Other (STPP Estimate) ..................................184,000 ..........................1.9%
Total ..........................................................9,876,000...........................100%
Source: California Department of Finance, Demographic Research Unit, Current Population Report, March 2002 (See: www.dof.ca.gov/HTML/DEMOGRAP/CPS-2002.pdf)
Number of California Children Aged 0-17 Whose Household Income was Below the Federal Poverty Level in 1999 ..........................................................1,757,100
Percentage of California Children Aged 0-17 Whose Household Income was Below the Federal Poverty Level in 1999..................................................19%
Source: Counting California (See: http://countingcalifornia.cdlib.org). Universe: Population for whom povertystatus is determined. "Poverty" is defined by the Office of Management and Budget.
Table 18: Poverty Among California Children Aged 0-17 (1999)
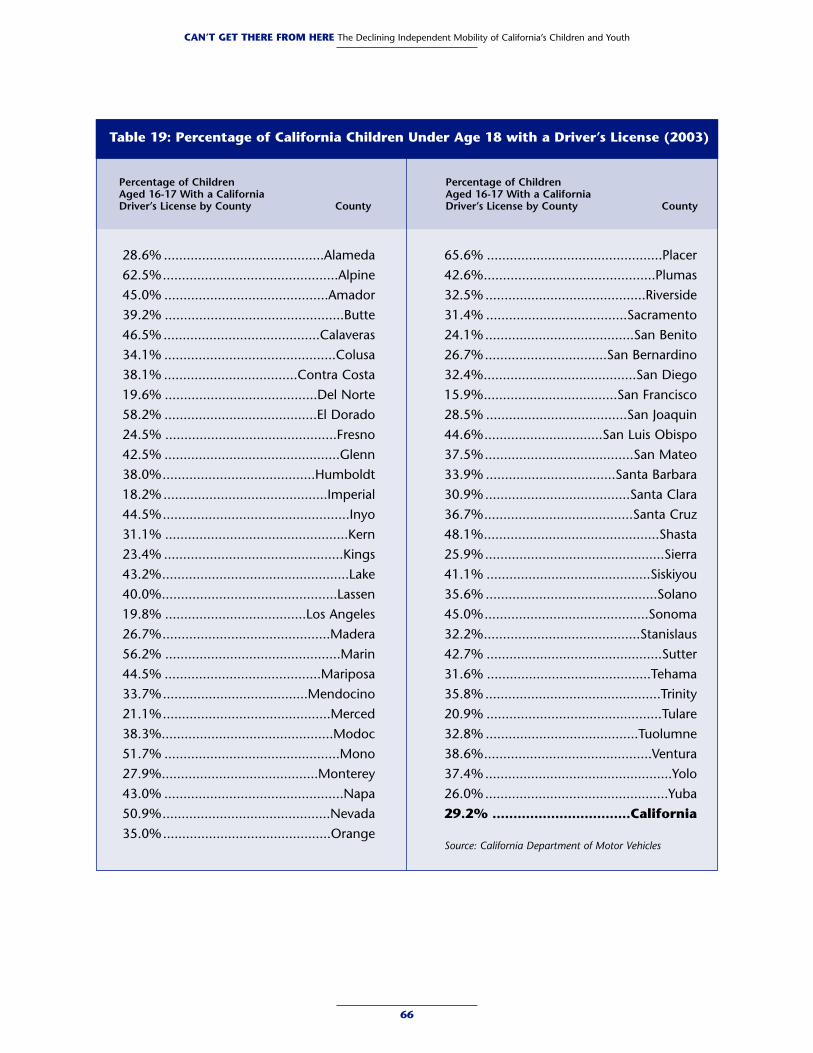
28.6% ..........................................Alameda 62.5%..............................................Alpine 45.0% ...........................................Amador 39.2% ...............................................Butte 46.5% .........................................Calaveras 34.1% .............................................Colusa 38.1% ...................................Contra Costa 19.6% ........................................Del Norte 58.2% ........................................El Dorado 24.5% .............................................Fresno 42.5% ..............................................Glenn 38.0%........................................Humboldt 18.2% ...........................................Imperial 44.5%.................................................Inyo 31.1% ................................................Kern 23.4% ...............................................Kings 43.2%.................................................Lake 40.0%..............................................Lassen 19.8% .....................................Los Angeles 26.7%............................................Madera 56.2% ..............................................Marin 44.5% .........................................Mariposa 33.7%......................................Mendocino 21.1%............................................Merced 38.3%.............................................Modoc 51.7% ..............................................Mono 27.9%.........................................Monterey 43.0% ...............................................Napa 50.9%............................................Nevada 35.0%............................................Orange
65.6% ..............................................Placer 42.6%.............................................Plumas 32.5% ..........................................Riverside 31.4% .....................................Sacramento 24.1%.......................................San Benito 26.7%................................San Bernardino 32.4%........................................San Diego 15.9%...................................San Francisco 28.5% .....................................San Joaquin 44.6%...............................San Luis Obispo 37.5%.......................................San Mateo33.9% ..................................Santa Barbara 30.9%......................................Santa Clara36.7%.......................................Santa Cruz 48.1%..............................................Shasta 25.9%...............................................Sierra 41.1% ...........................................Siskiyou 35.6% .............................................Solano 45.0%...........................................Sonoma 32.2%.........................................Stanislaus 42.7% ..............................................Sutter 31.6% ...........................................Tehama 35.8%..............................................Trinity 20.9% ..............................................Tulare 32.8% ........................................Tuolumne 38.6%............................................Ventura 37.4%.................................................Yolo 26.0%................................................Yuba 29.2% .................................California
Source: California Department of Motor Vehicles
66
CAN’T GET THERE FROM HERE The Declining Independent Mobility of California’s Children and Youth
Percentage of Children Aged 16-17 With a California Driver’s License by County County
Percentage of Children Aged 16-17 With a California Driver’s License by County County
Table 19: Percentage of California Children Under Age 18 with a Driver’s License (2003)
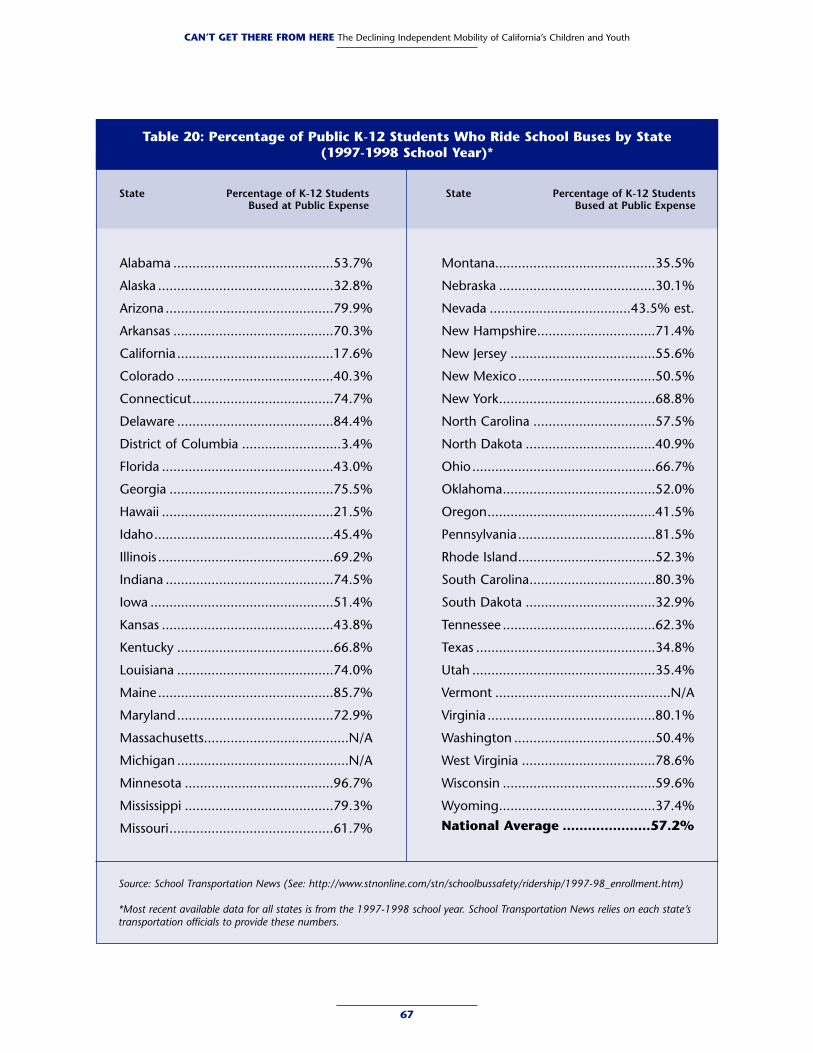
State Percentage of K-12 Students Bused at Public Expense
State Percentage of K-12 Students Bused at Public Expense
Table 20: Percentage of Public K-12 Students Who Ride School Buses by State (1997-1998 School Year)*
Alabama ..........................................53.7%
Alaska ..............................................32.8%
Arizona ............................................79.9%
Arkansas ..........................................70.3%
California.........................................17.6%
Colorado .........................................40.3%
Connecticut.....................................74.7%
Delaware .........................................84.4%
District of Columbia ..........................3.4%
Florida .............................................43.0%
Georgia ...........................................75.5%
Hawaii .............................................21.5%
Idaho...............................................45.4%
Illinois ..............................................69.2%
Indiana ............................................74.5%
Iowa ................................................51.4%
Kansas .............................................43.8%
Kentucky .........................................66.8%
Louisiana .........................................74.0%
Maine..............................................85.7%
Maryland.........................................72.9%
Massachusetts......................................N/A
Michigan .............................................N/A
Minnesota .......................................96.7%
Mississippi .......................................79.3%
Missouri...........................................61.7%
Montana..........................................35.5%
Nebraska .........................................30.1%
Nevada .....................................43.5% est.
New Hampshire...............................71.4%
New Jersey ......................................55.6%
New Mexico....................................50.5%
New York.........................................68.8%
North Carolina ................................57.5%
North Dakota ..................................40.9%
Ohio................................................66.7%
Oklahoma........................................52.0%
Oregon............................................41.5%
Pennsylvania....................................81.5%
Rhode Island....................................52.3%
South Carolina.................................80.3%
South Dakota ..................................32.9%
Tennessee ........................................62.3%
Texas ...............................................34.8%
Utah ................................................35.4%
Vermont ..............................................N/A
Virginia ............................................80.1%
Washington .....................................50.4%
West Virginia ...................................78.6%
Wisconsin ........................................59.6%
Wyoming.........................................37.4% National Average .....................57.2%
67
CAN’T GET THERE FROM HERE The Declining Independent Mobility of California’s Children and Youth
Source: School Transportation News (See: http://www.stnonline.com/stn/schoolbussafety/ridership/1997-98_enrollment.htm)
*Most recent available data for all states is from the 1997-1998 school year. School Transportation News relies on each state’stransportation officials to provide these numbers.
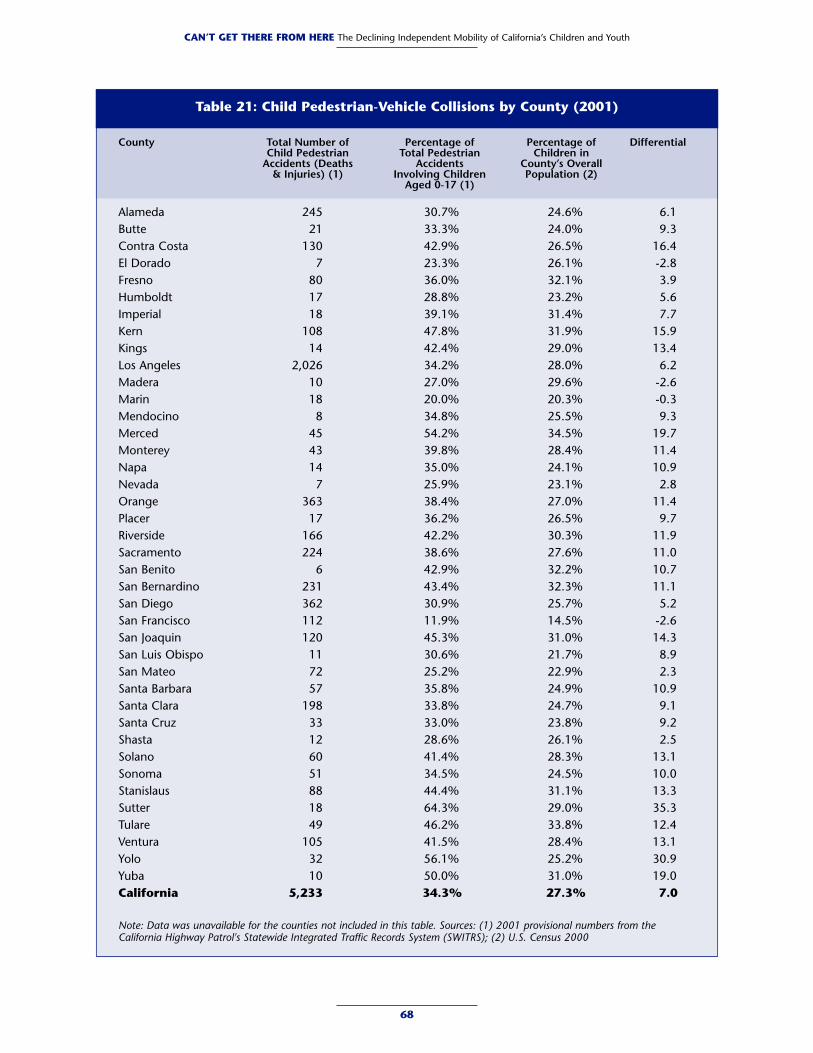
Table 21: Child Pedestrian-Vehicle Collisions by County (2001)
County Total Number of Percentage of Percentage of DifferentialChild Pedestrian Total Pedestrian Children in
Accidents (Deaths Accidents County’s Overall& Injuries) (1) Involving Children Population (2)
Aged 0-17 (1)
Alameda 245 30.7% 24.6% 6.1Butte 21 33.3% 24.0% 9.3Contra Costa 130 42.9% 26.5% 16.4El Dorado 7 23.3% 26.1% -2.8Fresno 80 36.0% 32.1% 3.9Humboldt 17 28.8% 23.2% 5.6Imperial 18 39.1% 31.4% 7.7Kern 108 47.8% 31.9% 15.9Kings 14 42.4% 29.0% 13.4Los Angeles 2,026 34.2% 28.0% 6.2Madera 10 27.0% 29.6% -2.6Marin 18 20.0% 20.3% -0.3Mendocino 8 34.8% 25.5% 9.3Merced 45 54.2% 34.5% 19.7Monterey 43 39.8% 28.4% 11.4Napa 14 35.0% 24.1% 10.9Nevada 7 25.9% 23.1% 2.8Orange 363 38.4% 27.0% 11.4Placer 17 36.2% 26.5% 9.7Riverside 166 42.2% 30.3% 11.9Sacramento 224 38.6% 27.6% 11.0San Benito 6 42.9% 32.2% 10.7San Bernardino 231 43.4% 32.3% 11.1San Diego 362 30.9% 25.7% 5.2San Francisco 112 11.9% 14.5% -2.6San Joaquin 120 45.3% 31.0% 14.3San Luis Obispo 11 30.6% 21.7% 8.9San Mateo 72 25.2% 22.9% 2.3Santa Barbara 57 35.8% 24.9% 10.9Santa Clara 198 33.8% 24.7% 9.1Santa Cruz 33 33.0% 23.8% 9.2Shasta 12 28.6% 26.1% 2.5Solano 60 41.4% 28.3% 13.1Sonoma 51 34.5% 24.5% 10.0Stanislaus 88 44.4% 31.1% 13.3Sutter 18 64.3% 29.0% 35.3Tulare 49 46.2% 33.8% 12.4Ventura 105 41.5% 28.4% 13.1Yolo 32 56.1% 25.2% 30.9Yuba 10 50.0% 31.0% 19.0California 5,233 34.3% 27.3% 7.0
Note: Data was unavailable for the counties not included in this table. Sources: (1) 2001 provisional numbers from theCalifornia Highway Patrol's Statewide Integrated Traffic Records System (SWITRS); (2) U.S. Census 2000
68
CAN’T GET THERE FROM HERE The Declining Independent Mobility of California’s Children and Youth
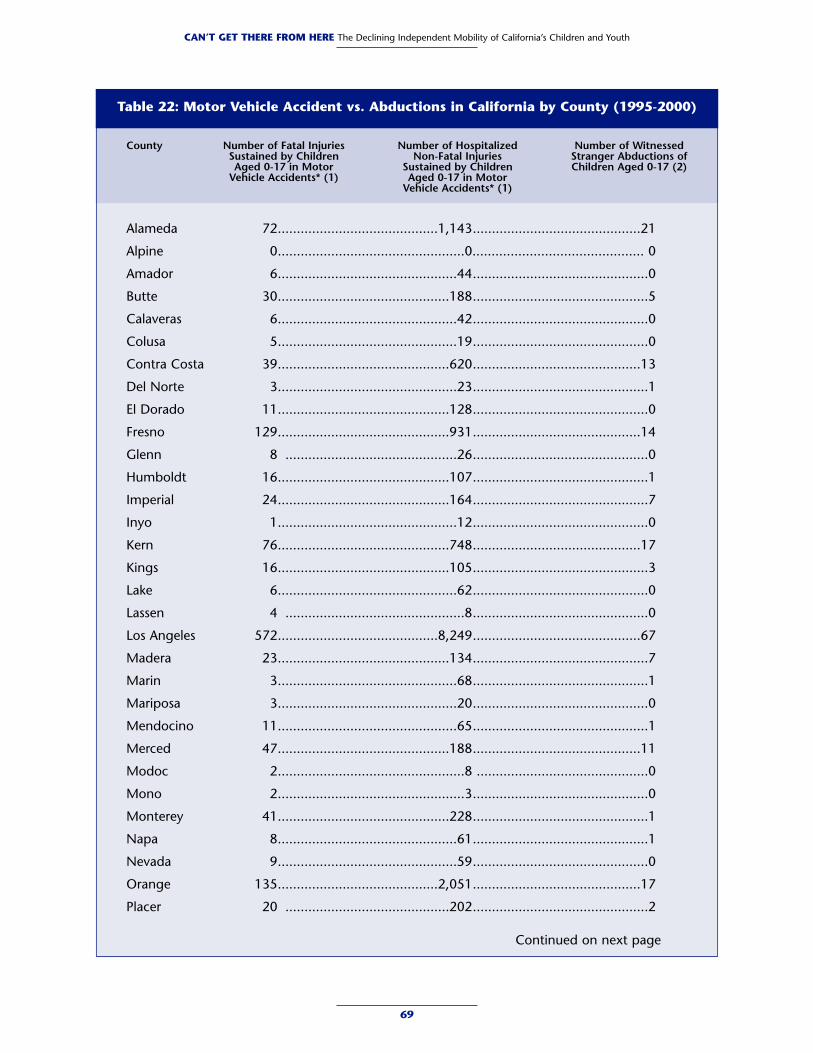
69
CAN’T GET THERE FROM HERE The Declining Independent Mobility of California’s Children and Youth
Table 22: Motor Vehicle Accident vs. Abductions in California by County (1995-2000)
County Number of Fatal Injuries Number of Hospitalized Number of WitnessedSustained by Children Non-Fatal Injuries Stranger Abductions of Aged 0-17 in Motor Sustained by Children Children Aged 0-17 (2)
Vehicle Accidents* (1) Aged 0-17 in MotorVehicle Accidents* (1)
Alameda 72..........................................1,143............................................21
Alpine 0.................................................0............................................. 0
Amador 6...............................................44..............................................0
Butte 30.............................................188..............................................5
Calaveras 6...............................................42..............................................0
Colusa 5...............................................19..............................................0
Contra Costa 39.............................................620............................................13
Del Norte 3...............................................23..............................................1
El Dorado 11.............................................128..............................................0
Fresno 129.............................................931............................................14
Glenn 8 .............................................26..............................................0
Humboldt 16.............................................107..............................................1
Imperial 24.............................................164..............................................7
Inyo 1...............................................12..............................................0
Kern 76.............................................748............................................17
Kings 16.............................................105..............................................3
Lake 6...............................................62..............................................0
Lassen 4 ...............................................8..............................................0
Los Angeles 572..........................................8,249............................................67
Madera 23.............................................134..............................................7
Marin 3...............................................68..............................................1
Mariposa 3...............................................20..............................................0
Mendocino 11...............................................65..............................................1
Merced 47.............................................188............................................11
Modoc 2.................................................8 .............................................0
Mono 2.................................................3..............................................0
Monterey 41.............................................228..............................................1
Napa 8...............................................61..............................................1
Nevada 9...............................................59..............................................0
Orange 135..........................................2,051............................................17
Placer 20 ...........................................202..............................................2
Continued on next page
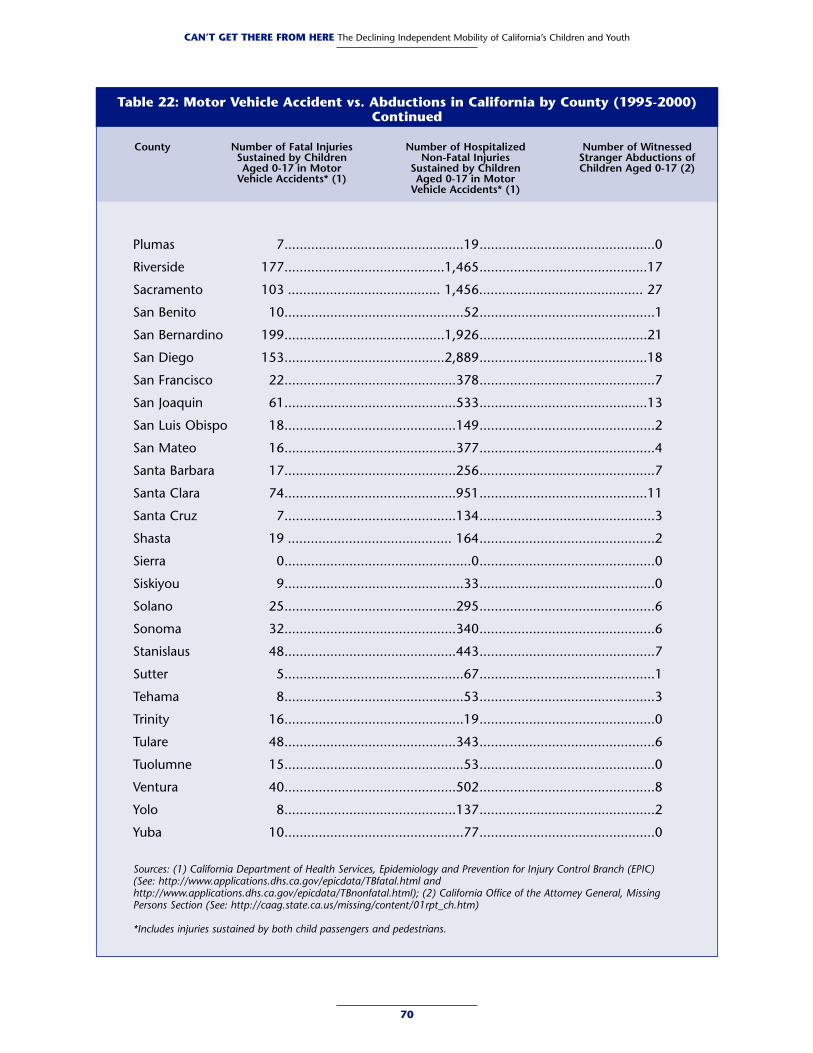
Table 22: Motor Vehicle Accident vs. Abductions in California by County (1995-2000)Continued
Plumas 7...............................................19..............................................0
Riverside 177..........................................1,465............................................17
Sacramento 103 ........................................ 1,456........................................... 27
San Benito 10...............................................52..............................................1
San Bernardino 199..........................................1,926............................................21
San Diego 153..........................................2,889............................................18
San Francisco 22.............................................378..............................................7
San Joaquin 61.............................................533............................................13
San Luis Obispo 18.............................................149..............................................2
San Mateo 16.............................................377..............................................4
Santa Barbara 17.............................................256..............................................7
Santa Clara 74.............................................951............................................11
Santa Cruz 7.............................................134..............................................3
Shasta 19 ........................................... 164..............................................2
Sierra 0.................................................0..............................................0
Siskiyou 9...............................................33..............................................0
Solano 25.............................................295..............................................6
Sonoma 32.............................................340..............................................6
Stanislaus 48.............................................443..............................................7
Sutter 5...............................................67..............................................1
Tehama 8...............................................53..............................................3
Trinity 16...............................................19..............................................0
Tulare 48.............................................343..............................................6
Tuolumne 15...............................................53..............................................0
Ventura 40.............................................502..............................................8
Yolo 8.............................................137..............................................2
Yuba 10...............................................77..............................................0
Sources: (1) California Department of Health Services, Epidemiology and Prevention for Injury Control Branch (EPIC) (See: http://www.applications.dhs.ca.gov/epicdata/TBfatal.html andhttp://www.applications.dhs.ca.gov/epicdata/TBnonfatal.html); (2) California Office of the Attorney General, MissingPersons Section (See: http://caag.state.ca.us/missing/content/01rpt_ch.htm)
*Includes injuries sustained by both child passengers and pedestrians.
70
CAN’T GET THERE FROM HERE The Declining Independent Mobility of California’s Children and Youth
County Number of Fatal Injuries Number of Hospitalized Number of WitnessedSustained by Children Non-Fatal Injuries Stranger Abductions of Aged 0-17 in Motor Sustained by Children Children Aged 0-17 (2)
Vehicle Accidents* (1) Aged 0-17 in MotorVehicle Accidents* (1)
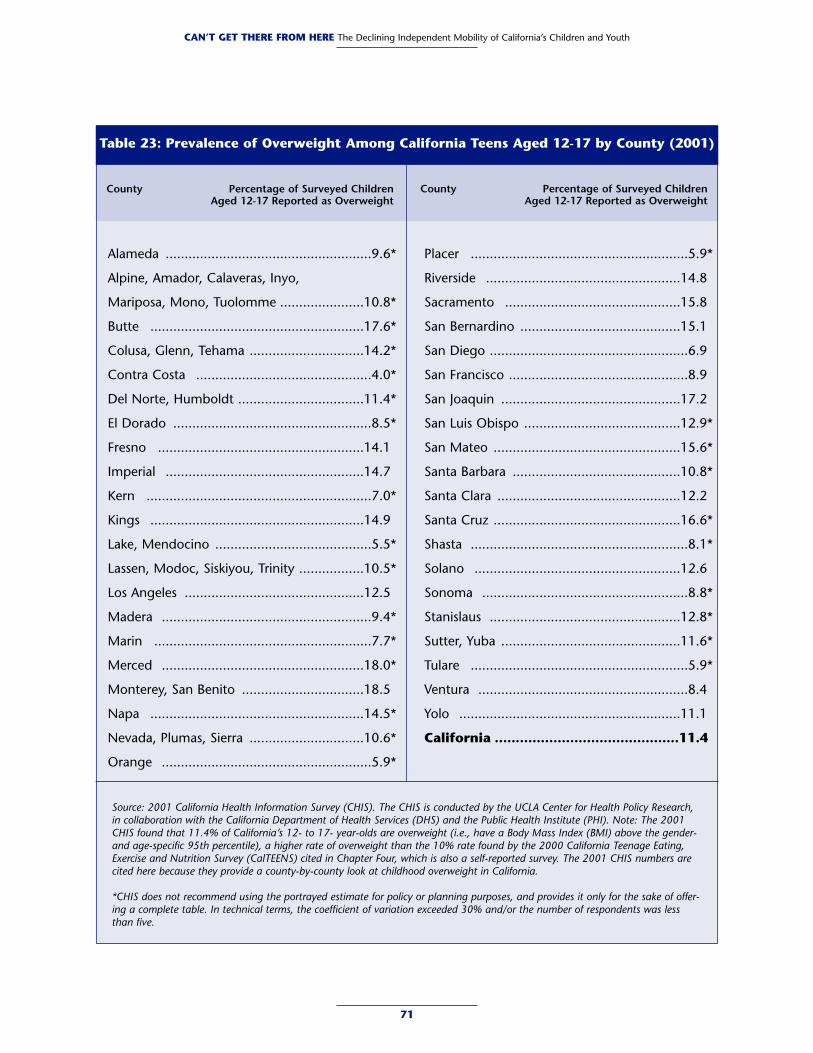
71
CAN’T GET THERE FROM HERE The Declining Independent Mobility of California’s Children and Youth
County Percentage of Surveyed Children Aged 12-17 Reported as Overweight
County Percentage of Surveyed Children Aged 12-17 Reported as Overweight
Table 23: Prevalence of Overweight Among California Teens Aged 12-17 by County (2001)
Alameda ......................................................9.6*
Alpine, Amador, Calaveras, Inyo,
Mariposa, Mono, Tuolomme ......................10.8*
Butte ........................................................17.6*
Colusa, Glenn, Tehama ..............................14.2*
Contra Costa ..............................................4.0*
Del Norte, Humboldt .................................11.4*
El Dorado ....................................................8.5*
Fresno ......................................................14.1
Imperial ....................................................14.7
Kern ...........................................................7.0*
Kings ........................................................14.9
Lake, Mendocino .........................................5.5*
Lassen, Modoc, Siskiyou, Trinity .................10.5*
Los Angeles ...............................................12.5
Madera .......................................................9.4*
Marin .........................................................7.7*
Merced .....................................................18.0*
Monterey, San Benito ................................18.5
Napa ........................................................14.5*
Nevada, Plumas, Sierra ..............................10.6*
Orange .......................................................5.9*
Placer .........................................................5.9*
Riverside ...................................................14.8
Sacramento ..............................................15.8
San Bernardino ..........................................15.1
San Diego ....................................................6.9
San Francisco ...............................................8.9
San Joaquin ...............................................17.2
San Luis Obispo .........................................12.9*
San Mateo .................................................15.6*
Santa Barbara ............................................10.8*
Santa Clara ................................................12.2
Santa Cruz .................................................16.6*
Shasta .........................................................8.1*
Solano ......................................................12.6
Sonoma ......................................................8.8*
Stanislaus ..................................................12.8*
Sutter, Yuba ...............................................11.6*
Tulare .........................................................5.9*
Ventura .......................................................8.4
Yolo ..........................................................11.1
California ............................................11.4
Source: 2001 California Health Information Survey (CHIS). The CHIS is conducted by the UCLA Center for Health Policy Research,in collaboration with the California Department of Health Services (DHS) and the Public Health Institute (PHI). Note: The 2001CHIS found that 11.4% of California’s 12- to 17- year-olds are overweight (i.e., have a Body Mass Index (BMI) above the gender-and age-specific 95th percentile), a higher rate of overweight than the 10% rate found by the 2000 California Teenage Eating,Exercise and Nutrition Survey (CalTEENS) cited in Chapter Four, which is also a self-reported survey. The 2001 CHIS numbers arecited here because they provide a county-by-county look at childhood overweight in California.
*CHIS does not recommend using the portrayed estimate for policy or planning purposes, and provides it only for the sake of offer-ing a complete table. In technical terms, the coefficient of variation exceeded 30% and/or the number of respondents was lessthan five.
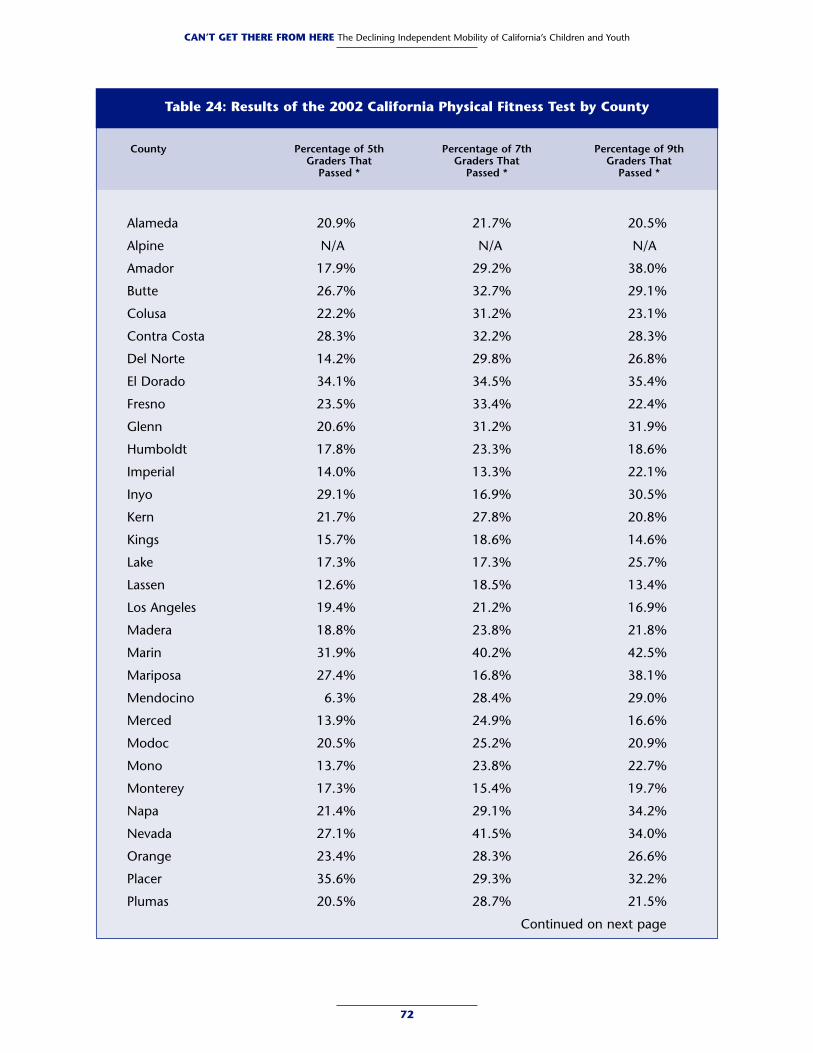
Table 24: Results of the 2002 California Physical Fitness Test by County
Alameda 20.9% 21.7% 20.5%
Alpine N/A N/A N/A
Amador 17.9% 29.2% 38.0%
Butte 26.7% 32.7% 29.1%
Colusa 22.2% 31.2% 23.1%
Contra Costa 28.3% 32.2% 28.3%
Del Norte 14.2% 29.8% 26.8%
El Dorado 34.1% 34.5% 35.4%
Fresno 23.5% 33.4% 22.4%
Glenn 20.6% 31.2% 31.9%
Humboldt 17.8% 23.3% 18.6%
Imperial 14.0% 13.3% 22.1%
Inyo 29.1% 16.9% 30.5%
Kern 21.7% 27.8% 20.8%
Kings 15.7% 18.6% 14.6%
Lake 17.3% 17.3% 25.7%
Lassen 12.6% 18.5% 13.4%
Los Angeles 19.4% 21.2% 16.9%
Madera 18.8% 23.8% 21.8%
Marin 31.9% 40.2% 42.5%
Mariposa 27.4% 16.8% 38.1%
Mendocino 6.3% 28.4% 29.0%
Merced 13.9% 24.9% 16.6%
Modoc 20.5% 25.2% 20.9%
Mono 13.7% 23.8% 22.7%
Monterey 17.3% 15.4% 19.7%
Napa 21.4% 29.1% 34.2%
Nevada 27.1% 41.5% 34.0%
Orange 23.4% 28.3% 26.6%
Placer 35.6% 29.3% 32.2%
Plumas 20.5% 28.7% 21.5%
72
CAN’T GET THERE FROM HERE The Declining Independent Mobility of California’s Children and Youth
County Percentage of 5th Percentage of 7th Percentage of 9thGraders That Graders That Graders That
Passed * Passed * Passed *
Continued on next page
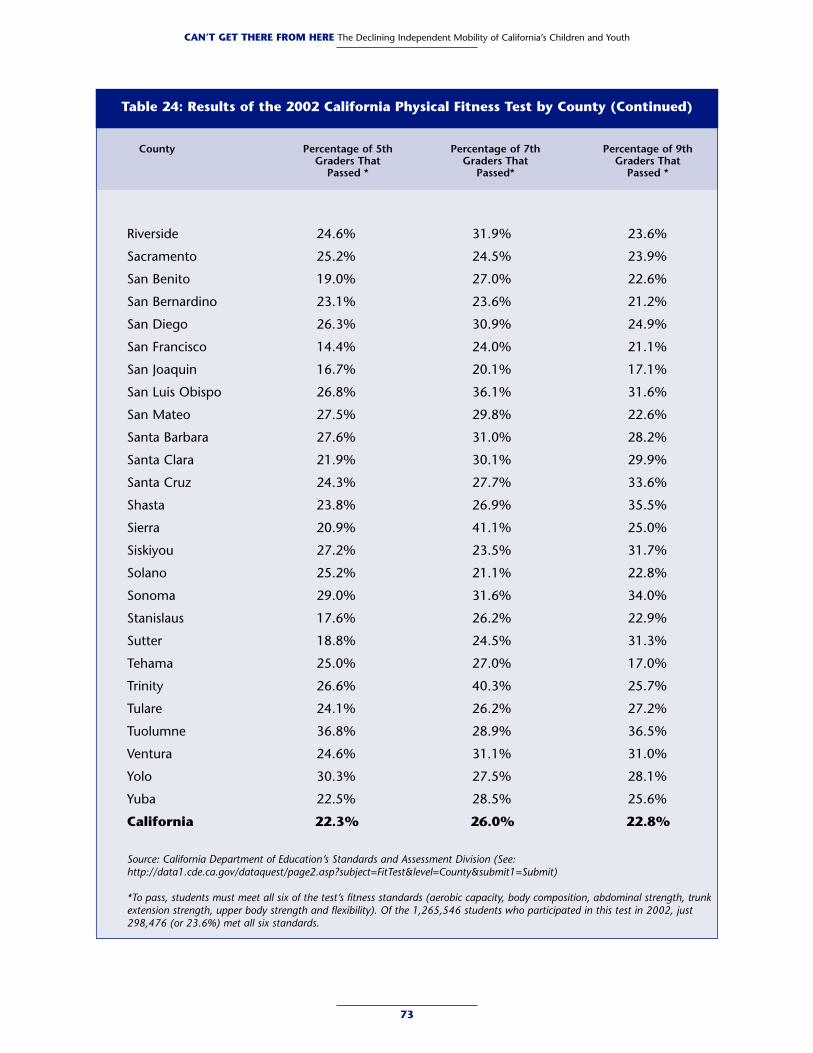
Table 24: Results of the 2002 California Physical Fitness Test by County (Continued)
Riverside 24.6% 31.9% 23.6%
Sacramento 25.2% 24.5% 23.9%
San Benito 19.0% 27.0% 22.6%
San Bernardino 23.1% 23.6% 21.2%
San Diego 26.3% 30.9% 24.9%
San Francisco 14.4% 24.0% 21.1%
San Joaquin 16.7% 20.1% 17.1%
San Luis Obispo 26.8% 36.1% 31.6%
San Mateo 27.5% 29.8% 22.6%
Santa Barbara 27.6% 31.0% 28.2%
Santa Clara 21.9% 30.1% 29.9%
Santa Cruz 24.3% 27.7% 33.6%
Shasta 23.8% 26.9% 35.5%
Sierra 20.9% 41.1% 25.0%
Siskiyou 27.2% 23.5% 31.7%
Solano 25.2% 21.1% 22.8%
Sonoma 29.0% 31.6% 34.0%
Stanislaus 17.6% 26.2% 22.9%
Sutter 18.8% 24.5% 31.3%
Tehama 25.0% 27.0% 17.0%
Trinity 26.6% 40.3% 25.7%
Tulare 24.1% 26.2% 27.2%
Tuolumne 36.8% 28.9% 36.5%
Ventura 24.6% 31.1% 31.0%
Yolo 30.3% 27.5% 28.1%
Yuba 22.5% 28.5% 25.6%
California 22.3% 26.0% 22.8%
Source: California Department of Education’s Standards and Assessment Division (See:http://data1.cde.ca.gov/dataquest/page2.asp?subject=FitTest&level=County&submit1=Submit)
*To pass, students must meet all six of the test’s fitness standards (aerobic capacity, body composition, abdominal strength, trunkextension strength, upper body strength and flexibility). Of the 1,265,546 students who participated in this test in 2002, just298,476 (or 23.6%) met all six standards.
73
CAN’T GET THERE FROM HERE The Declining Independent Mobility of California’s Children and Youth
County Percentage of 5th Percentage of 7th Percentage of 9thGraders That Graders That Graders That
Passed * Passed* Passed *
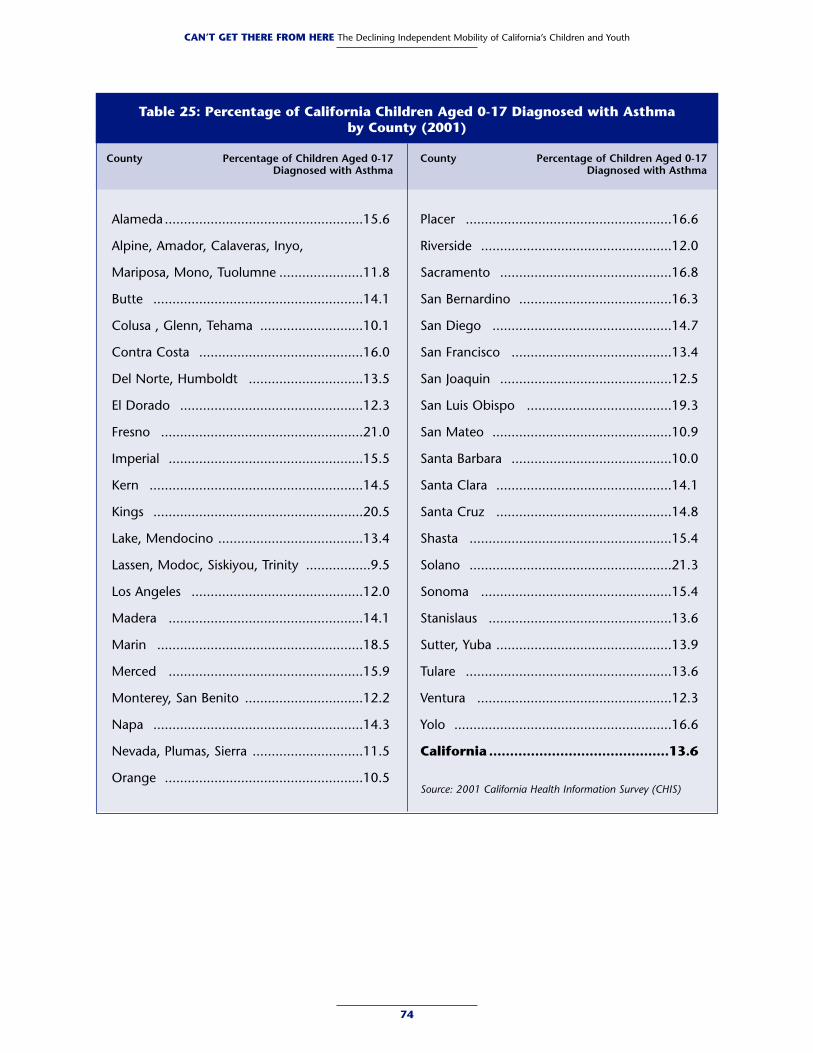
74
CAN’T GET THERE FROM HERE The Declining Independent Mobility of California’s Children and Youth
County Percentage of Children Aged 0-17Diagnosed with Asthma
County Percentage of Children Aged 0-17Diagnosed with Asthma
Table 25: Percentage of California Children Aged 0-17 Diagnosed with Asthma by County (2001)
Alameda ....................................................15.6
Alpine, Amador, Calaveras, Inyo,
Mariposa, Mono, Tuolumne ......................11.8
Butte .......................................................14.1
Colusa , Glenn, Tehama ...........................10.1
Contra Costa ...........................................16.0
Del Norte, Humboldt ..............................13.5
El Dorado ................................................12.3
Fresno .....................................................21.0
Imperial ...................................................15.5
Kern ........................................................14.5
Kings .......................................................20.5
Lake, Mendocino ......................................13.4
Lassen, Modoc, Siskiyou, Trinity .................9.5
Los Angeles .............................................12.0
Madera ...................................................14.1
Marin ......................................................18.5
Merced ...................................................15.9
Monterey, San Benito ...............................12.2
Napa .......................................................14.3
Nevada, Plumas, Sierra .............................11.5
Orange ....................................................10.5
Placer ......................................................16.6
Riverside ..................................................12.0
Sacramento .............................................16.8
San Bernardino ........................................16.3
San Diego ...............................................14.7
San Francisco ..........................................13.4
San Joaquin .............................................12.5
San Luis Obispo ......................................19.3
San Mateo ...............................................10.9
Santa Barbara ..........................................10.0
Santa Clara ..............................................14.1
Santa Cruz ..............................................14.8
Shasta .....................................................15.4
Solano .....................................................21.3
Sonoma ..................................................15.4
Stanislaus ................................................13.6
Sutter, Yuba ..............................................13.9
Tulare ......................................................13.6
Ventura ...................................................12.3
Yolo .........................................................16.6
California ...........................................13.6
Source: 2001 California Health Information Survey (CHIS)
Chapter One:The California Department of Transportation’s 2000-2001California Statewide Household Travel Survey, seehttp://www.dot.ca.gov/hq/tsip/TSIPPDF/2000_Household_Survey.pdf.
Tracy E. McMillian, “Six Miles Uphill Both Ways: A Child’sTrip to School,” Paper presented at the Association ofCollegiate Schools of Planning, 2001 Annual Conference.
The 2001 National Household Transportation Survey(NHTS), available online at http://nhts.ornl.gov.
Chapter Two:Constance E. Beaumont and Elizabeth G. Pianca, “HistoricNeighborhood Schools in the Age of Sprawl: Why JohnnyCan’t Walk to School,” National Trust for HistoricPreservation, November 2000, see http://www.nationaltrust.org/news/docs/20001116_john-ny_cantwalk.html.
S. Bingler, “What If: New Schools, Better Neighborhoods,More Livable Communities,” The Metropolitan ForumProject, 1999, see http://www.nsbn.org/whatif/index.html.
Dan Burden, “Walkable Communities,” Sierra Club website,see http://www.sierraclub.org/sprawl/community/walkable.asp.
California Department of Education’s School FacilitiesDivision, “Guide to School Site Analysis andDevelopment,” 2000 edition, seehttp://www.cde.ca.gov/facilities/field/sitereview.htm.
Peter Calthorpe, “The Next American Metropolis,”Princeton Architectural Press, 1993.
Robert Cervero and Carolyn Radisch, “Travel Choices inPedestrian Versus Automobile Oriented Neighborhoods,”Transport Policy 1996; 3, pp. 127-141.
Robert Cervero and R. Gorham, “Commuting in Transitversus Automobile Neighborhoods,” Journal of theAmerican Planning Association 1995; 61, pp. 210-225.
Michelle DeRobertis, “Neotraditional Design: Mobility forAll Ages,” Wilbur Smith Associates, San Francisco, TRBCircular 019, Urban Street Symposium: ConferenceProceedings, 2000, see http://www4.nas.edu/trb/onlinepubs.nsf/web/circular?opendocument.
A.M. Dellinger, et al., “Barriers to Children Walking andBiking to School — United States, 1999,” CDC MMWR2002; 51(32), pp. 701-704.
Reid Ewing, Rolf Pendall and Don Chen, “MeasuringSprawl and Its Impact,” Smart Growth America, October2002, see http://www.smartgrowthamerica.com/sprawlindex/sprawlindex.html.
Richard J. Jackson and Chris Kochtitzky, “Creating aHealthy Environment: The Impact of the BuiltEnvironment on Public Health,” distributed by SprawlWatch Clearinghouse, see http://www.sprawlwatch.org.
Reid Ewing and Robert Cervero, “Travel and the BuiltEnvironment: A Synthesis,” Transportation ResearchRecord 2001; 1780, pp. 87-114.
Reid Ewing, Padma Haliyur and G. William Page, “GettingAround a Traditional City, a Suburban Planned UnitDevelopment, and Everything in Between,” TransportationResearch Record 1466, pp. 53-61.
Lawrence D. Frank and Peter Engelke, “How Land Use andTransportation Systems Impact Public Health: A LiteratureReview of the Relationship between Physical Activity andUrban Form,” Active Community Environments (ACEs)Working Paper #1, 2000, see http://www.cdc.gov/nccdphp/dnpa/pdf/aces-workingpaper1.pdf.
Lawrence D. Frank and Gary Pivo, “Impacts of Mixed Useand Density on Utilization of Three Modes of Travel:Single-Occupant vehicle, Transit, and Walking,”Transportation Research Record 1466, pp. 44-52.
Lawrence Frank, “Land Use and Transportation Interaction:Implications on Public health and Quality of Life,” Journalof Planning, Education and Research, October 2000.
B. Friedman, et al., “Effect of Neotraditional NeighborhoodDesign on Travel Characteristics,” Transportation ResearchRecord 1466, pp. 63-70.
Joel S. Hirschhorn and Paul Souza, “New CommunityDesign to the Rescue: Fulfilling Another American Dream,”National Governors Association, Center for Best Practices,2001, see http://www.nga.org/cda/files/072001NCDFULL.pdf.
John Holtzclaw, “Explaining Urban Density and TransitImpacts on Auto Use.” (Paper presented to the CaliforniaEnergy Resource Conservation and DevelopmentCommission, Docket No. 89-CR_90,1991.)
John Holtzclaw, “Using Residential Patterns and Transit toDecrease Auto Dependence and Costs,” Natural ResourcesDefense Council and California Home Energy EfficiencyRating Systems, 1994.
“How Suburban Design is Failing American Teenagers,”New York Times, May 6, 1999.
Richard Jackson and Chris Kochtitzky, Centers for DiseaseControl and Prevention, “Creating a Healthy Environment:The Impact of the Built Environment on Public Health,”Sprawlwatch Clearinghouse Monograph Series, seehttp://www.sprawlwatch.org.
Richard E. Killingsworth and Jean Lamming,“Development and Public Health: Could Our DevelopmentPatterns Be Affecting Our Personal Health?” Urban Land,
R E F E R E N C E S
75
July 2001, pp. 12- 17.
Richard E. Killingsworth, “Public Health and Land UsePlanning: Natural Partners to Promote Active, Healthy andLivable Communities,” Getting Smart!; Vol. 4, No. 3, NewYork: Smart Growth Network.
Kara Maria Kockelman, “Travel Behavior as Function ofAccessibility, Land Use Mixing, and Land Use Balance:Evidence from San Francisco Bay Area,” TransportationResearch Record 1607, pp. 116-124.
Anup Kulkami, Ruey-min Wang and Michael G. McNally,“Variation of Travel Behavior in Alternative Network andLand Use Patterns,” Institute of Transportation Engineers65th Annual Meeting, 1995 Compendium of TechnicalPapers.
Local Government Commission, “New Schools for OlderNeighborhoods: Strategies for Building Our Communities’Most Important Assets.”
David R. Loutzenheiser, “Pedestrian Access to Transit:Model of Walk Trips and Their Design and Urban FormDeterminants Around Bay Area Rapid Transit Stations,”Transportation Research Record 1604, pp. 40-49.
Edward T. McMahon, “School Sprawl,” PlanningCommissioners Journal, Number 39, Summer 2000.
Martha T. Moore, “City, Suburban Designs Could be Badfor Your Health,” USA Today, April 23, 2003.
National Transportation Safety Board, “BusCrashworthiness Issues,” Highway Special InvestigationReport NTSB/SIR-99/04, 1999.
“New Tack on School Sites: Sacramento Should FosterInnovations Such as Non-Traditional Locations or Multi-Story Structures,” Los Angeles Times editorial, November22, 1999. Article appears on NSBN website athttp://nsbn.org/media/art_112299b.html.
John P. Robinson and Geoffrey Godbey, “Time for Life: theSurprising Ways Americans Use Their Time,” PennsylvaniaPress, 1997.
Sandra Rosenbloom and G.J. Fielding, “Transit Markets ofthe Future: The Challenge of Change,” Transit CooperativeResearch Program (TCRP) Report No. 28, TransportationResearch Board, 1998, see http://www4.trb.org/trb/onlinepubs.nsf/web/tcrp_reports.
Catherine L. Ross and Anne E. Dunning, “Land UseTransportation Interaction: An Examination of the 1995NPTS Data,” Georgia Institute of Technology, prepared forU.S. Dept. of Transportation, October 1997.
Dr. David Salvesen (principal investigator) and PhilipHervey, “Good Schools — Good Neighborhoods: TheImpacts of State and Local School Board Policies on theDesign and Location of Schools in North Carolina,” Centerfor Urban and Regional Studies at the University of NorthCarolina at Chapel Hill, June 2003, seehttp://www.unc.edu/depts/curs/goodschoolsreport.pdf.
Thomas W. Sanchez, Rich Stolz and Jacinta S. Ma,“Moving to Equity: Addressing Inequitable Effects ofTransportation Policies on Minorities, “ The Civil RightsProject at Harvard University, Cambridge, MA, June 2003,see http://www.civilrightsproject.harvard.edu/research/transportation/MovingtoEquity.pdf.
Robert J. Spillar and G. Scott Rutherford, “The Effects ofPopulation Density and Income on Per Capita TransitRidership in Western American Cities,” ITE 1990Compendium of Technical Papers.
Surface Transportation Policy Project, “Beyond Gridlock:Meeting California’s Transportation Needs in the 21stCentury,” May 2000, see http://www.transact.org/ca.
Surface Transportation Policy Project, “Driven to Spend,”2000, see http://www.transact.org/.
Urban Land Institute, “Putting the Pieces Together: StateActions to Encourage Smart Growth Practices inCalifornia,” September 2002.
Chapter Three:Bruce S. Appleyard, “Planning Safe Routes to School,”Planning, May 2003.
California Department of Health Services, California’s SafeRoutes to School Initiative: Final Report, September 2002,see http://www.dhs.ca.gov/routes2school.
Centers for Disease Control & Prevention’s National Centerfor Health Statistics (NCHS), National Mortality Data 1997,Hyattsville, MD, 1998, see http://www.cdc.gov/ncipc/duip/duip.htm
Hillman, Adams and Whitelegg, “One False Move...A Studyof Children’s Independent Mobility,” Policy StudiesInstitute (UK), 1990.
W.A. Leaf and D.F. Preusser, “Literature Review on VehicleTravel Speeds and Pedestrian Injuries,” National HighwayTraffic Safety Administration, 1999.
National Safe Kids Campaign, Report to the Nation onChild Pedestrian Safety, 2002, seehttp://www.safekids.org/tier3_cd.cfm?content_item_id=7571&folder_id=680.
F.P. Rivara and M. Barber, “”Demographic Analysis ofChildhood Pedestrian Injuries,” Pediatrics 1985; 76, pp.375-381.
F.P. Rivara, et al., “Parental Attitudes and Practices towardChildren as Pedestrians,” Pediatrics 1989; 84, pp. 1017-1021.
Surface Transportation Policy Project, “Dangerous byDesign: Pedestrian Safety in California,” September 2000,available online at http://www.transact.org/ca.
Surface Transportation Policy Project, “Caught in theCrosswalk: Pedestrian Safety in California,” September1999, see http://www.transact.org/ca.
76
CAN’T GET THERE FROM HERE The Declining Independent Mobility of California’s Children and Youth
Surface Transportation Policy Project, “Mean Streets 2002:Pedestrian Safety, Health and Federal TransportationSpending,” 2002, see http://www.transact.org/.
Transportation Research Board, Committee on SchoolTransportation Safety, “The Relative Risks of School Travel:A National Perspective and Guidance for Local CommunityRisk Assessment,” Special Report 269, 2002, seehttp://www.nap.edu/html/SR269/SR269.pdf.
U.S. Department of Justice, Office of Juvenile Justice andDelinquency Prevention (OJJDP), Second NationalIncidence Studies of Missing, Abducted, Runaway andThrownaway Children (NISMART-2), conducted 1997-1999and released in 2002, see http://www.ncjrs.org/html/ojjdp/nismart/qa/.
A. Weinstein, et al., “Neighborhood Safety and thePrevalence of Physical Inactivity — Selected States, 1996,”Morbidity and Mortality Weekly Reports (MMWR) 1999;48)7), pp. 143-146.
Chapter Four:American Lung Association, “State of the Air: 2003,” seehttp://lungaction.org/reports/SOTA03_stateozone.html?geo_area_id=06.
Denise H. Amschler, “The Alarming Increase of Type 2Diabetes in Children,” Journal of School Health, January 1,2002.
Barbara Anderson and Matt Leedy, “Smog Levels SparkHealth Warnings,” Fresno Bee, May 29, 2003.
California Air Resources Board, “2002 California Almanacof Emissions & Air Quality.”
California Center for Public Health Advocacy, “AnEpidemic: Overweight and Unfit Children in CaliforniaAssembly Districts,” 2002. Seewww.publichealthadvocacy.org/policy_briefs/overweight_and_unfit.html.
Joel Cohen, “Overweight Kids: Why Should We Care?”California Research Bureau, December 2000.
Greg Critser, Fat Land: How Americans Became the FattestPeople in the World, Houghton Mifflin, 2003.
Allison L. Diamant, et al., “Diabetes in California: Findingsfrom the 2001 California Health Interview Survey,” 2003,see http://www.chis.ucla.edu/main/default.asp?timeout=1.
“Diet, Physical Activity and Dietary Supplements,”Testimony of Dr. William Dietz, Director of CDC’s Divisionof Nutrition and Physical Activity, before the HouseGovernment Reform Committee, July 25, 2002. Seehttp://www.cdc.gov/washington/testimony/pa072502.htm.
Howard Frumkin, “Urban Sprawl and Public Health,”Public Health Reports, Vol. 117, May/June 2002.
James Glanz, “Particles are Tiny, but Damage Can beGreat,” New York Times, October 30, 2001.
Todd Goldman, “Consequences of Sprawl: Threats toCalifornia’s Natural Environment and Human Health,”Working Paper 2001-06, University of California Instituteof Urban and Regional Development, 2003.
S.L. Gortmaker, et al., “Increasing pediatric obesity in theUnited States,”Am J Dis Child 1987; 141, pp. 535-40.
J.O. Hill and F.L.Trowbridge, “The Causes and HealthConsequences of Obesity in Children and Adolescents,”Pediatrics 1998;101:(3 part 2), pp. 497-574.
Moira Inkelas, et al., “The Health of Young Children inCalifornia: Findings from the 2001 California HealthInterview Survey,” July 2003, prepared jointly by the UCLACenter for Healthier Children, Families and Communities,the UCLA Center for Health Policy Research, and thePublic Health Institute, is the first of its kind to reveal keymeasures of health and well-being for Calfiornia childrenunder age 6, see http://www.healthpolicy.ucla.edu/pubs/publication.asp?pubID=71.
Jason B. Johnson, “Asthma Epidemic Sickens Thousands ofBay Area Kids,” San Francisco Chronicle, February 11,2003.
Jeffrey P. Koplan and William H. Dietz, “Caloric Imbalanceand Public Health Policy,” JAMA; Vol. 282, No. 16, October27, 1999.
Michael McCabe, “Breathless,” San Francisco Chronicle,August 17, 2002.
Cynthia L. Ogden, et al., “Prevalence and Trends inOverweight Among US Children and Adolescents, 1999-2000,” JAMA; Vol. 288, No. 14, October 9, 2002.
M. Pratt, et al., “Higher Direct Medical Costs Associatedwith Physical Inactivity,” Physician and Sports Medicine2000; 28(10).
Lorrene Ritchie, et al., “Pediatric Overweight: A Review ofthe Literature,” The Center for Weight and Health at U.C.Berkeley, June 2001, see http://www.cnr.berkeley.edu/cwh/PDFs/Full_COPI_secure.pdf.
Lorrene Ritchie, et al., “Prevention of ChildhoodOverweight — What Should be Done?” (Position Paper),The Center for Weight and Health at U.C. Berkeley, June2001. An overview of determinants of child overweight,effective strategies to prevent child overweight and recom-mendations for action, see http://www.cnr.berkeley.edu/cwh/PDFs/Prev_Child_Oweight_10-28-02.pdf.
Eric Schlosser, Fast Food Nation, Houghton MifflinCompany, 2001.
Jeffrey B. Schwimmer, et al., “Health-Related Quality of Lifeof Severely Obese Children and Adolescents,” JAMA, Vol.289, pp. 1813-1819, April 9, 2003.
South Coast Air Quality Management District, Multiple AirToxics Exposure Study (MATES II), 2002, seehttp://www.aqmd.gov/matesiidf/matestoc.htm.
R. Strauss and H. Pollack, “Epidemic Increase in Childhood
77
CAN’T GET THERE FROM HERE The Declining Independent Mobility of California’s Children and Youth
Overweight, 1986-1998,” JAMA 2001; 286.
Dennis Michael Styne, “Childhood Obesity: Time forAction, Not Complacency,” American Family Physician,February 15, 1999. See http://www.aafp.org/afp/990215ap/editorials.html.
Surface Transportation Policy Project, “Clearing the Air2003,” August 2003, see http://www.transact.org/.
U.S. Department of Health and Human Services andNational Heart, Lung and Blood Institute. 1999, Data FactSheet: Asthma Statistics, see http://www.nhlbi.nih.gov/health/prof/lung/asthma/asthstat.pdf.
U.S. Department of Health and Human Services, TheSurgeon General’s Call to Action to Prevent and DecreaseOverweight and Obesity, 2001, see http://www.surgeongeneral.gov/topics/obesity.
U.S. Environmental Protection Agency (EPA), “America’sChildren and the Environment: Measures ofContaminants, Body Burdens, and Illnesses,” SecondEdition, February 2003.
U.S. Public Interest Research Group (U.S. PIRG), “DangersOf Diesel: How Diesel Soot And Other Air Toxics IncreaseAmericans’ Risk Of Cancer,” October 2002, seehttp://uspirg.org/uspirg.asp?id2=8122&id3=USPIRG.
Gail Woodward-Lopez, et al., Excerpt from “ImprovingChildren’s Academic Performance, Health and Quality ofLife: A Top Policy Commitment in Response to Children’sObesity and Health Crisis in California,” The Center forWeight and Health, University of California at Berkeleywith the California Elected Women’s Association forEducation and Research (CEWAER). A concise review of theimportance of healthy eating and physical activity forCalifornia children’s academic performance, physical healthand social well-being. See http://www.cnr.berkeley.edu/cwh/PDFs/CewaerPaper_Research.pdf.
A,M. Wolf and G.A. Colditz, “Current Estimates of theEconomic Cost of Obesity in the United States,” Obes Res1998; 6, pp.97-106.
78
CAN’T GET THERE FROM HERE The Declining Independent Mobility of California’s Children and Youth
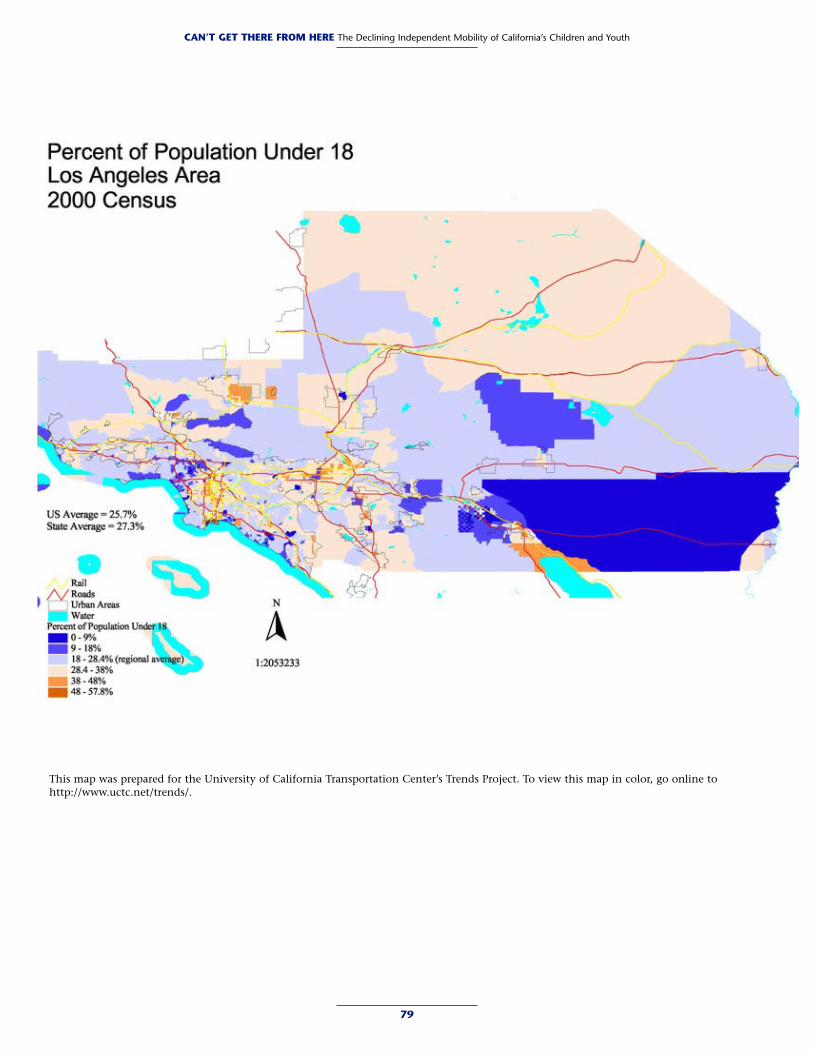
79
CAN’T GET THERE FROM HERE The Declining Independent Mobility of California’s Children and Youth
This map was prepared for the University of California Transportation Center’s Trends Project. To view this map in color, go online tohttp://www.uctc.net/trends/.
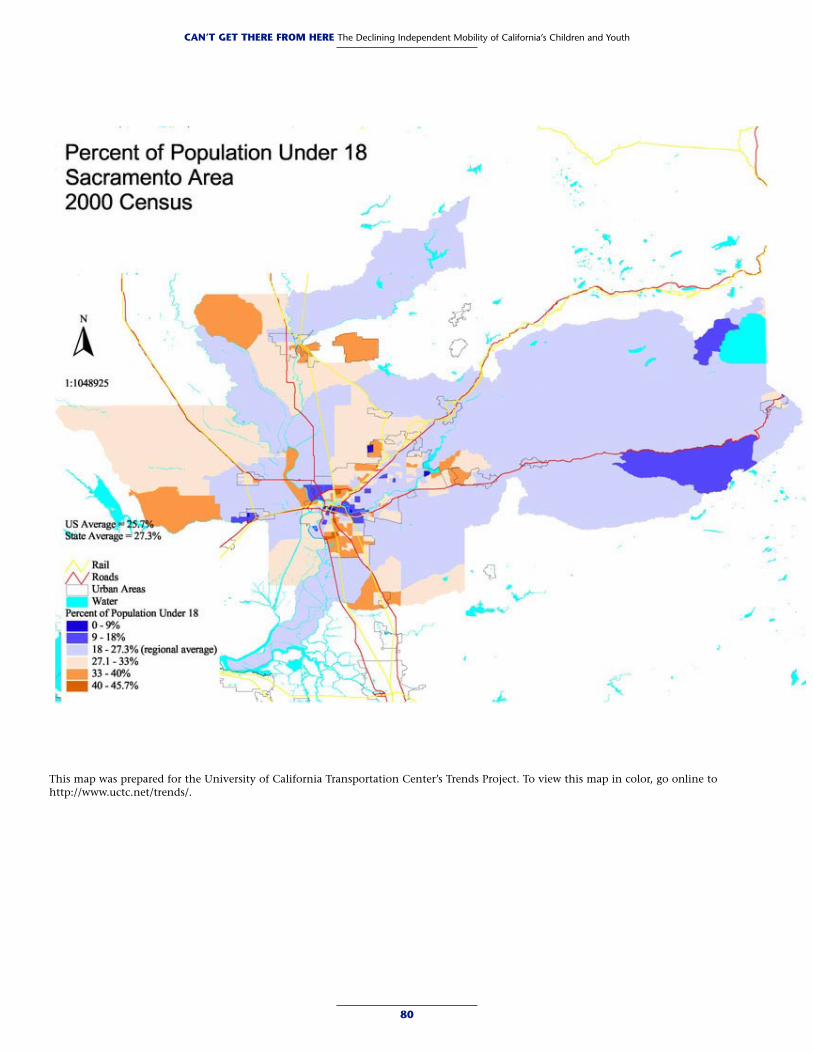
80
CAN’T GET THERE FROM HERE The Declining Independent Mobility of California’s Children and Youth
This map was prepared for the University of California Transportation Center’s Trends Project. To view this map in color, go online tohttp://www.uctc.net/trends/.

81
CAN’T GET THERE FROM HERE The Declining Independent Mobility of California’s Children and Youth
This map was prepared for the University of California Transportation Center’s Trends Project. To view this map in color, go onlineto http://www.uctc.net/trends/.
Surface Transportation Policy ProjectNorthern California Office
26 O’Farrell Street, Suite 400San Francisco, CA 94108Phone: (415) 956-7795
http://www.transact.org/ca/
Transportation and Land Use Coalition414 13th Street, 5th Floor
Oakland, CA 94612Phone: (510) 740-3150
http://www.transcoalition.org
Latino Issues Forum785 Market Street, 3rd Floor
San Francisco, CA 94103Phone: (415) 284-7228
http://www.lif.org