canned tuna in the middle east: a market searching for...
TRANSCRIPT

Canned Tuna in the Middle East: A market searching for profit ? May 2018
Arnab Sengupta

This document aims to answer the following:
Key Questions
Is Middle East an interesting market for canned tuna?
1
Parameters of tuna consumption we should know while entering ME
2
What should be done to gain more market share
3
Table of Contents
Middle East Food Retail
How to we consume Tuna
Tuna Market Overview

Middle East Tuna Market: Overview
4
Frozen is limited to very niche sushi stores and some
local coastal catch near Oman and
Yemen. Catching's are seasonal, near
coast and not consistent
Tuna consumption in Middle East and North African is primarily in canned format some local catch, negligible in frozen format. In canned format the market is around $800M
The region does not have any non tariff barriers. Arab league 0% rest of the world 5%. Sustainability growing interest. Though a region
bound by language and religion, tuna eating hobbits differ.
Growing Interest from international brands, though the market is driven by familiarity and heritage. Rio Mare, John West carving a niche in the premium segment. Growth for profit, current mantra
5
Market Sizes – Canned Tuna
5
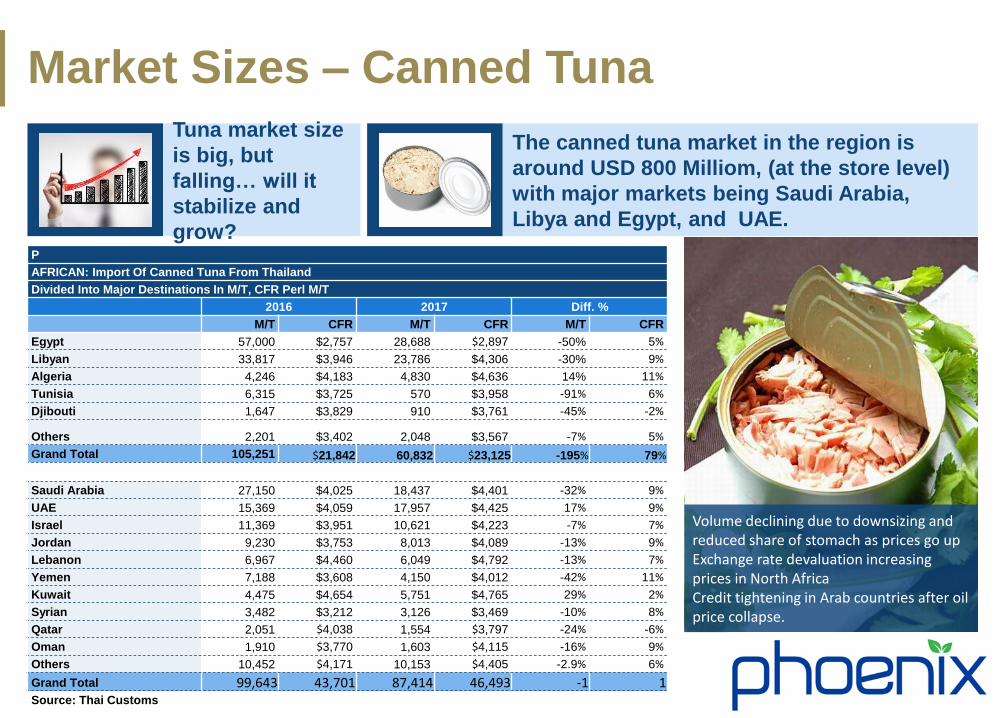
Tuna market size
is big, but
falling… will it
stabilize and
grow?
The canned tuna market in the region is
around USD 800 Milliom, (at the store level)
with major markets being Saudi Arabia,
Libya and Egypt, and UAE.
Volume declining due to downsizing and reduced share of stomach as prices go up Exchange rate devaluation increasing prices in North Africa Credit tightening in Arab countries after oil price collapse.
P
AFRICAN: Import Of Canned Tuna From Thailand
Divided Into Major Destinations In M/T, CFR Perl M/T
2016 2017 Diff. %
M/T CFR M/T CFR M/T CFR
Egypt 57,000 $2,757 28,688 $2,897 -50% 5%
Libyan 33,817 $3,946 23,786 $4,306 -30% 9%
Algeria 4,246 $4,183 4,830 $4,636 14% 11%
Tunisia 6,315 $3,725 570 $3,958 -91% 6%
Djibouti 1,647 $3,829 910 $3,761 -45% -2%
Others 2,201 $3,402 2,048 $3,567 -7% 5%
Grand Total 105,251 $21,842 60,832 $23,125 -195% 79%
Saudi Arabia 27,150 $4,025 18,437 $4,401 -32% 9%
UAE 15,369 $4,059 17,957 $4,425 17% 9%
Israel 11,369 $3,951 10,621 $4,223 -7% 7%
Jordan 9,230 $3,753 8,013 $4,089 -13% 9%
Lebanon 6,967 $4,460 6,049 $4,792 -13% 7%
Yemen 7,188 $3,608 4,150 $4,012 -42% 11%
Kuwait 4,475 $4,654 5,751 $4,765 29% 2%
Syrian 3,482 $3,212 3,126 $3,469 -10% 8%
Qatar 2,051 $4,038 1,554 $3,797 -24% -6%
Oman 1,910 $3,770 1,603 $4,115 -16% 9%
Others 10,452 $4,171 10,153 $4,405 -2.9% 6%
Grand Total 99,643 43,701 87,414 46,493 -1 1 Source: Thai Customs

Tuna Value Trend
Sinusoidal Volume Behavior with 50%+ Value Captured by Libya and Egypt
6
Tuna Volumes Full Year Trend Tuna Value Market Distribution
4
29
22 2327
40
36 3633
22
36 35 33
4 46
2016 Val by mkt in USD
2014 Val by mkt in USD
2
2015 Val by mkt in USD
3
2
2013 Val by mkt in USD
3
UAE LIBYA KWT KSA EGY
1,555
3,0133,0922,9992,578
3,401
2,092
2,193
2,2052,0801,8721,967
3,000
4,000
1,000
2,000
0
2,206
1,431
2011 12 13 14 15 16 17
Mid-East VOL-FCL Africa VOL-FCL
60,000
70,000
75,000
55,000
50,000
0
65,000 51,910
15
73,412 66,636
48,299
17 16
59,388 66,734
57,074
14
69,779
74,202
13
44,938
64,253
12
58,330 63,614
73,882
2011
ME Avg. Price per FCL in USD
A Africa Avg. Price per FCL
7
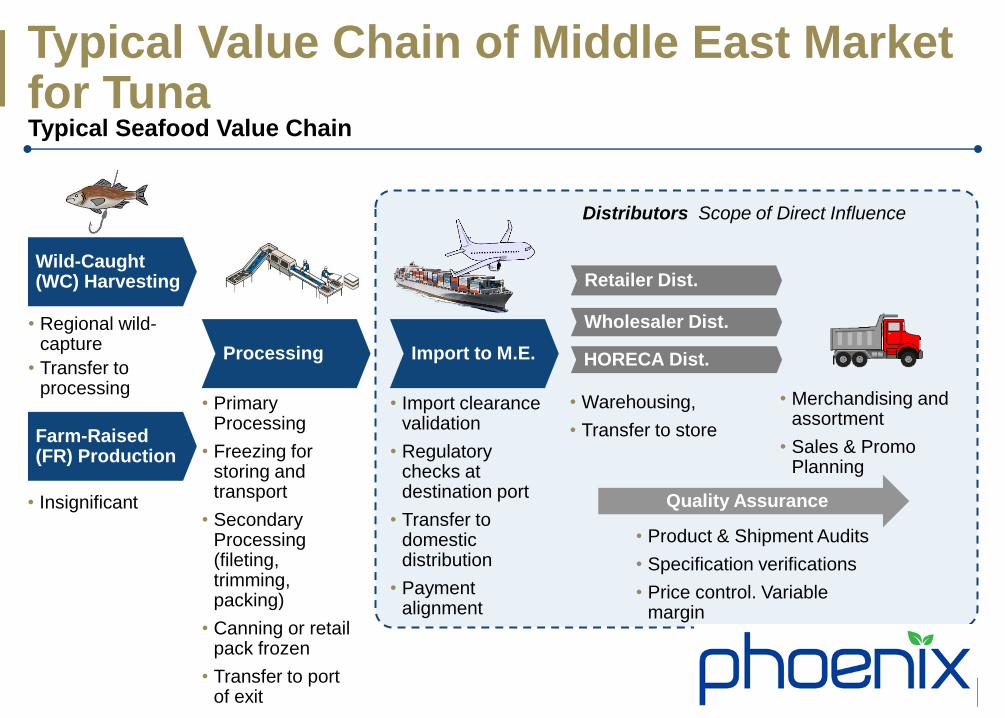
Typical Value Chain of Middle East Market for Tuna Typical Seafood Value Chain
Wild-Caught (WC) Harvesting
Processing
Farm-Raised (FR) Production
Import to M.E.
Retailer Dist.
• Primary Processing
• Freezing for storing and transport
• Secondary Processing (fileting, trimming, packing)
• Canning or retail pack frozen
• Transfer to port of exit
• Import clearance validation
• Regulatory checks at destination port
• Transfer to domestic distribution
• Payment alignment
• Merchandising and assortment
• Sales & Promo Planning
• Warehousing,
• Transfer to store
• Regional wild-capture
• Transfer to processing
• Insignificant
Distributors Scope of Direct Influence
Wholesaler Dist.
HORECA Dist.
Quality Assurance
• Product & Shipment Audits
• Specification verifications
• Price control. Variable margin

Table of Contents
Middle East Food Retail
How to we consume Tuna
Tuna Market Overview
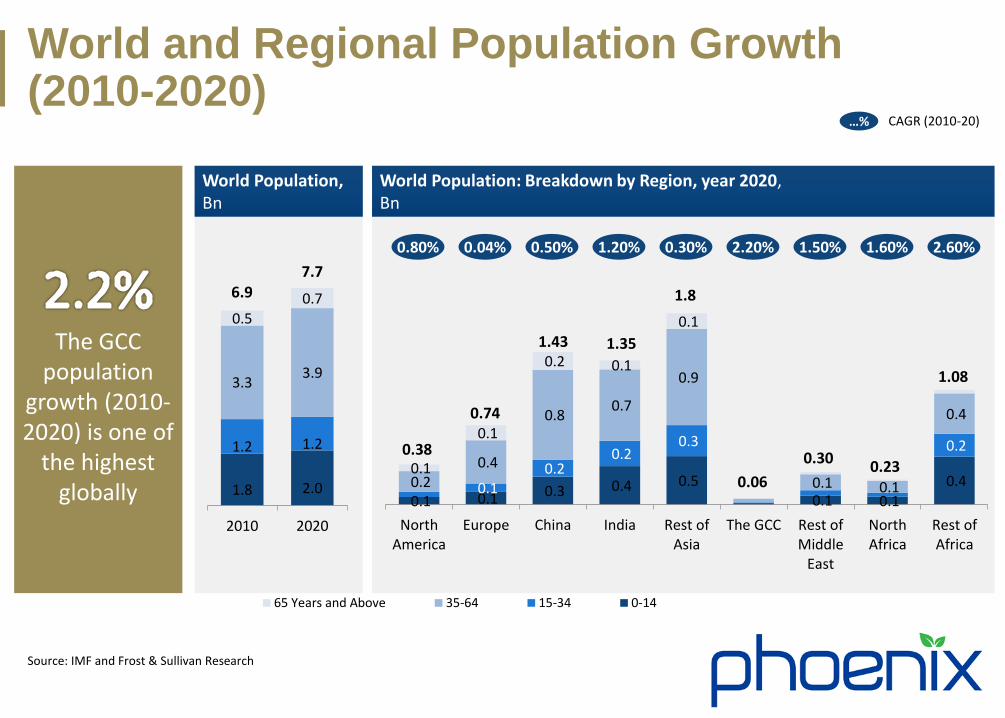
World and Regional Population Growth (2010-2020)
9
The GCC population
growth (2010-2020) is one of
the highest globally
World Population, Bn
World Population: Breakdown by Region, year 2020, Bn
1.8
2.0
1.2
1.2
3.3
3.9
0.5 0.7
2010 2020
0.1 0.1 0.3 0.4 0.5 0.1 0.1
0.4 0.1 0.2
0.2 0.3 0.2
0.2 0.4
0.8 0.7
0.9
0.1 0.1
0.4
0.1
0.1
0.2 0.1
0.1
NorthAmerica
Europe China India Rest ofAsia
The GCC Rest ofMiddle
East
NorthAfrica
Rest ofAfrica
65 Years and Above 35-64 15-34 0-14
6.9 7.7
0.38
0.74
1.43 1.35
1.8
0.06
0.30 0.23
1.08
0.80% 0.04% 0.50% 1.20% 0.30% 2.20% 1.50% 1.60% 2.60%
…% CAGR (2010-20)
Source: IMF and Frost & Sullivan Research

Catering to the new generation consumer is key in the GCC
10
The GCC Population, Mn.
11.0 11.6 12.7 14.1
14.2 18.5 19.7 20.9
9.7
14.3 19.0
23.1
0.9
1.0
1.3
1.9
2005 2010 2015 2020
0-14 15-34 35-64 65 Years and Above
Classification/ Categorisation of the Consumer segments
Generation X - Typically born before the 70s. • Has less impact of the Oil boom in the GCC and more into
traditional consumer behaviour with relative loyalty to a few brands
Generation Y/ Millennials – Born in the 80s and 90s. • Self-involved, Dependent, Racially and Ethnically diverse
group raised during the explosion of TV and Internet. Less loyal towards brands
Generation Z – Born after 2000 • Anxious, Highly connected, living in an age of high-tech
communication, technology driven lifestyles and prolific use of social media with mindful of the future
39%
35%
24%
Source: Frost & Sullivan Research
Generation Y+Z account on
overall population by 2020 and are
highly influential on Generation
X purchases

Megatrends Shaping up the Food & Beverages Sector
11
Meg
atre
nd
s
Growing Baseline
Market
POPULATION
Improving rate of
organization of the
Industry
URBANIZATION
‘Good For You’
Campaign
HEALTH &
WELLNESS
Exposure to
multicuisine /
products
GLOBALISATION
Change in Lifestyles
Growing Income Healthy Food Choice to Choose Quick Serve
Food Retail Product
Categories Micro
Segmentation Processed Food
Product Level Impact Industry Level Impact
Res
ult
of
Meg
atre
nd
s
Creating a Pool of Sub Trends

Categorizing consumer trends
12
Nutritional Facts
Increasing habit of reading labels to
understand product claims and
nutritional facts
Functional Products
Look out for functional products which reduce risk of chronic diseases
beyond basic nutritional functions
Consumption Experience
Products which suit ‘Snackification’ while skipping
conventional meals.
Good for you!
No artificial ingredients,
low fat, high fibre and organic version of
products
Packaging
Something which offers ease towards multiple
consumption occasions on the go. Also, which
suits the ‘Style Statement’
Taste
Product which is new to
the palate
Source: Frost & Sullivan Research

Which segment companies should act?
13
BREAKFAST
SNACKS
LUNCH
DINNER
Ready to eat, Protein based breakfast offering added benefits
Opportunity for
• Meat processing companies
• Bakery companies
• Breakfast cereal companies
Target consumer segment
• Entire range of consumers
• Probably focus on kids
Products with benefits
Opportunity for
• Dairy companies
• Beverage companies
• Snack companies
• Nutraceutical companies
Target consumer segment
• Generation Y and Generation Z

Table of Contents
Middle East Food Retail
How to we consume Tuna
Tuna Market Overview

Consumer Insights
15

Cooking still a domain of Housewife
The majority of consumers claim to do most of the cooking themselves
– Some get help from house maid or other members of the family
Working women rely heavily on housemaid
Cooking seen to be the duty of a good wife and mother
– Some do not openly admit to getting help
Men feel that only the lady of the house should cook, seen as a matter of pride
– Makes him feel important if she cares enough to cook for him
Housewife is always
challenged to prepare
dishes all will like
16

Lunch is the Main Meal of the Day
Lunch requires the most planning and preparation
– More complex / heavy
– Entire family sits together
– Main meal of the day
Dinner is often unplanned and spur of the moment
– Lighter
– More diverse / variety
– Family may eat independently
Breakfast is a very individual meal
– Except Fridays which turns into brunch
– Light cold dishes mostly
– Diverse / variety of dishes
Lunch in Arab world can happen
at 5pm meal when we sit
together and eat
DINNER
LUNCH
BREAKFAST
17
TUNA BUYING HABITS
18

Insights
Tuna is a staple available in every household
– Stocked quite heavily by the majority
Most families consume Tuna at least 2 times a week. In some cases consumption goes up 4 -5 times a week
For the majority Tuna is used more for dinner and lunch and often at parties and for outings (Picnics)
It is also seen as nutritious and liked by children who often do not like fresh fish
Tuna is considered quick and versatile and liked by the entire family
Often for short notice – unplanned meals
Tuna is considered on
economic dish for
everyday use-but also
seen as a commodity
19

Insights for us.
The number of cans consumed per occasion are quite high when used in main dish
Opportunity for family pack / economy pack
Overall, consumers are aware of different type of tuna, but in some cases the terminology used is not common to the industry
There is little awareness off difference between solid pack and other.
– Clearest distinction is between flakes and chunk tuna - prefer chunks
Few consumers take note or consider the oil type in which the tuna is packed.
– Majority agree it should be a light oil
Most consumers are aware of Tuna in brine, but use is limited to use when dieting.
Do not like fishy smell.
20

Tuna Category is Driven by Familiarity Mainly. BRAND CONSIDERATION Driving BRAND EQUITY Equity Drivers For Tuna
Sources of
Brand Equity
Industry Norms
Awareness: 30% Familiarity: 10% Associations: 60%
Awareness 11%
Familiarity 64%
Association 25%
Based on FMCG & Retail categories
Importance of Association Factors in Tuna
LIGHT & HIGH QUALITY
HEALTHY & PROVIDES VALUE
AESTHETICS MEAT QUALITIES
8% 8% 7% 2%
21 Source: Winning Brands Categories

Canned Tuna MENA – Positive and Negative Factors
22
Negative factors
New food option/Packing
Matured category
Low margin, trade uninterested
Status of low cost protein
My tuna recipe
Positive factors
Variety of eating usage for tuna
Side dish, cooked to sandwich
Recognition of healthy option
Part of growing up
Costal fishing heritage
Growing market
+ −

Communication Review

Communication: Tuna middle East
24
Merchandising support growing
ATL in certain
premium brands,
category lead by Rio Mare
Internet based tools are gaining popularity
Mostly promotions,
with secondary
display

Activations
25

In-Store
26

In-Store Presence
27

From the Internet
Communication review
28
Going beyond display campaigns few tuna brands are building
microsites on popular portals that included games/competitions
as well as content sharing and knowledge sharing about tuna

Digital
29

30
Opportunities in the Middle East Market Seafood Category Overview
Sourcing Process • Tuna pricing is driven by commodity
index hence spot purchased in favorable periods
• A mix of and spot buy are popular. Usually contacts are in 20 fcl or 2 fcl lots
ME Internal Demand • Market demand's cheap source for
protein. Tuna satisfy key criteria • Devaluation of regional currencies in
North Africa. • Demand of tuna at the HORECA level • Demand falling, lead by North Africa
Market Outlook • Canned tuna market in Middle East has
seen more than 20% dip this year due to currency.
• Frozen Fresh tuna demand increasing in GCC.
• Pet food market in UAE 65% of human food
Restaurant Items • Focus on Horeca needs. Ready to serve
sushi, pouch tuna, opportunity to grow
Pet Food • Hit directly, high margin category.
Allowing for efficiency gaps
Tuna • Efficiency of production, work on
packaging and printing technology. • Catering size opportunities
Key Strategic Initiatives
Benefits Potential
~M USD
Low hanging fruits
Thank you [email protected]

Main markets for Tuna in the region. Libya, KSA and Egypt.
33
Libya is the largest per capita tuna consumer in the world.
With its small population, it consumes more chunks pack than Egypt around 3 Million cases of 48 cans in 2016, a low year.
KSA is a growing market for chunks pack, while being predominantly a solid market.
The market of chunks and flakes are around 22% of around 3.3 M Cs Total market.
Tunisia and Algeria are potential markets, which are protected by hi tariff for non Arab league tuna, competition is limited.
Domestic consumption of tuna in Egypt is around 6.5 M cases of 48, of which 48% are flakes and rest chunks& solid.
Tunisia
Libya KSA
Algeria Egypt
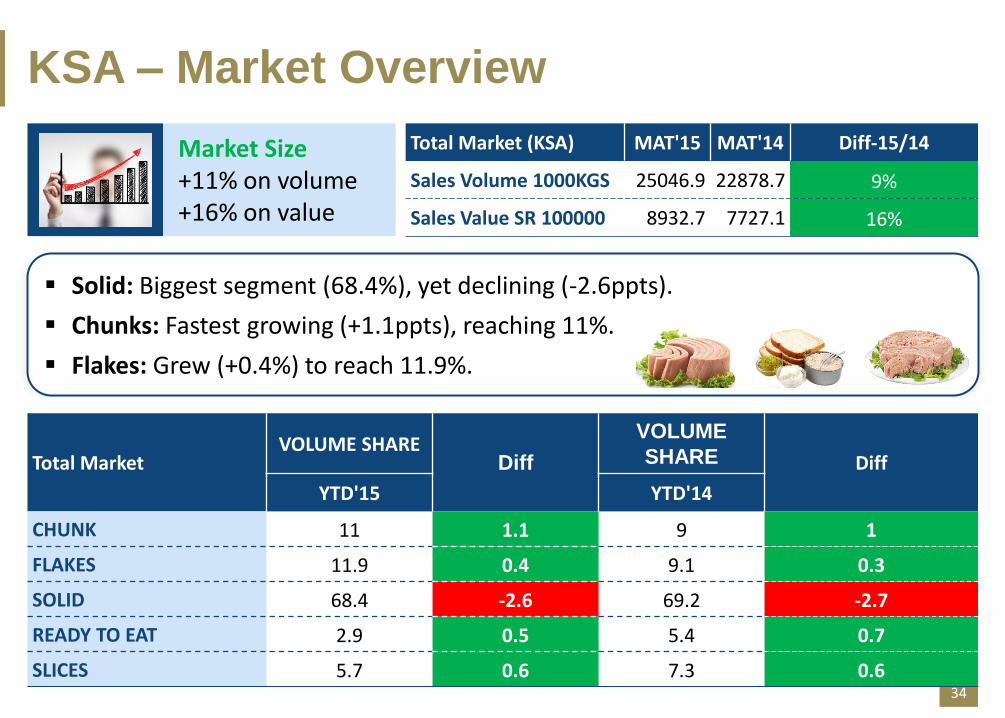
KSA – Market Overview
34
Market Size +11% on volume +16% on value
Total Market (KSA) MAT'15 MAT'14 Diff-15/14
Sales Volume 1000KGS 25046.9 22878.7 9%
Sales Value SR 100000 8932.7 7727.1 16%
Solid: Biggest segment (68.4%), yet declining (-2.6ppts).
Chunks: Fastest growing (+1.1ppts), reaching 11%.
Flakes: Grew (+0.4%) to reach 11.9%.
Total Market VOLUME SHARE
Diff
VOLUME
SHARE Diff
YTD'15 YTD'14
CHUNK 11 1.1 9 1
FLAKES 11.9 0.4 9.1 0.3
SOLID 68.4 -2.6 69.2 -2.7
READY TO EAT 2.9 0.5 5.4 0.7
SLICES 5.7 0.6 7.3 0.6

Egypt – Market Overview
Market Size -8.5% on volume -5.5% on value
Total Market MAT'15 MAT'14 Diff-15/14
Sales Volume 1000KGS 61901 72590 -8.5%
Sales Value LE 100000 25770 24655 +5.5%
Flakes: Biggest segment (53.2)% declined a few points (2.3%)
Solid: Growing segment (13.7%), growing
Chunks: Fastest growing (+1.1ppts), reaching 30.8%
Egypt currency has devalued ( 8.5 to 18) pushing the
prices in the market
35

Solid: Remains to be the largest cut at 54.9% (flat vs. YA), followed by
Chunks: at 18.8% (also flat), then
Flakes: at 16.2% (+0.4ppts)
UAE – Market Overview
36
Market Size +6% (volume and value)
Total Market MAT'15 MAT'14 Percentage Growth
Sales Volume 1000 KGS 3781.9 3554.5 6%
Sales Value 1000 AED 144165 132041 6%
Total Market VOLUME SHARE
Diff YTD'15 YTD'14
SOLID 54.9 55.0 -0.1
CHUNK 19.8 18.7 0.0
FLAKES 17.2 15.8 1.4
READY TO EAT 7.9 7.6 0.3
SLICES 1.4 2.8 -0.4