candlestick patterns · pdf filecandlestick patterns 2 contents . introducing candlestick...
TRANSCRIPT
Candlestick Patterns
www.binaryforexbrokers.net
Candlestick Patterns
2
Contents
Introducing Candlestick Patterns ............................................................................................................ 3
Bearish Abandoned Baby .................................................................................................................... 4
Bearish Belt Holt ................................................................................................................................. 4
Bearish Engulfing ................................................................................................................................ 5
Bearish Harami .................................................................................................................................... 6
Bearish Harami Cross .......................................................................................................................... 6
Bearish Kicking .................................................................................................................................... 7
Bullish Abandoned Baby ..................................................................................................................... 8
Bullish Belt Hold .................................................................................................................................. 8
Bullish Engulfing .................................................................................................................................. 9
Bullish Harami ................................................................................................................................... 10
Bullish Harami Cross ......................................................................................................................... 10
Bullish Kicking.................................................................................................................................... 11
Dark Cloud Cover .............................................................................................................................. 12
Doji .................................................................................................................................................... 12
Downside Tasuki Gap ........................................................................................................................ 13
Evening Star ...................................................................................................................................... 14
Falling Three Methods ...................................................................................................................... 15
Hammer ............................................................................................................................................ 15
Hanging Man ..................................................................................................................................... 16
Inverted Hammer .............................................................................................................................. 17
Morning Star ..................................................................................................................................... 17
Piercing Line ...................................................................................................................................... 18
Rising Three Methods ....................................................................................................................... 19
Shooting Star ..................................................................................................................................... 20
Stick Sandwich .................................................................................................................................. 20
Three Black Crows ............................................................................................................................. 21
Three White Soldiers ......................................................................................................................... 22
Upside Gap Two Crows ..................................................................................................................... 22
Upside Tasuki Gap ............................................................................................................................. 23
Candlestick Patterns
3
Introducing Candlestick Patterns The objective of a candlestick pattern is to identify the underlying market trend within the pattern. This will include the highs, lows and the opens and closes, especially relative to the previous candlesticks.
Candlestick charts display the open, high, low, and closing prices in a format similar to a modern-day bar-chart, but in a manner that extenuates the relationship between the opening and closing prices. Candlestick charts are simply a new way of looking at prices, they don't involve any calculations. When a candlestick attempts new highs and fails to close at those highs you can get some clues as to who’s in charge at the moment, the bulls or the bears. There are single candlestick clues, as well as 2, 3 and even 4 candlestick patterns that will reveal a lot about who’s in charge.
When applying a pattern to a Chart, you need to input the Trend Strength. The input value for the Trend Strength specifies the number of bars required to define a trend when a pattern requires a prevailing trend. A value of zero will disable trend requirement. Since many candlesticks define a reversal in the market, we use the Indicator Swing to identify whether we have bull or a bear trend before the pattern occurs.
After applying one or more patterns to a strategy, you can combine these patterns with some specific indicators to identifying short term market tops and bottoms as well as some very specific entry and exit points.
This document / section describes briefly about the candlestick patterns used in Straticator.
Candlestick Patterns
4
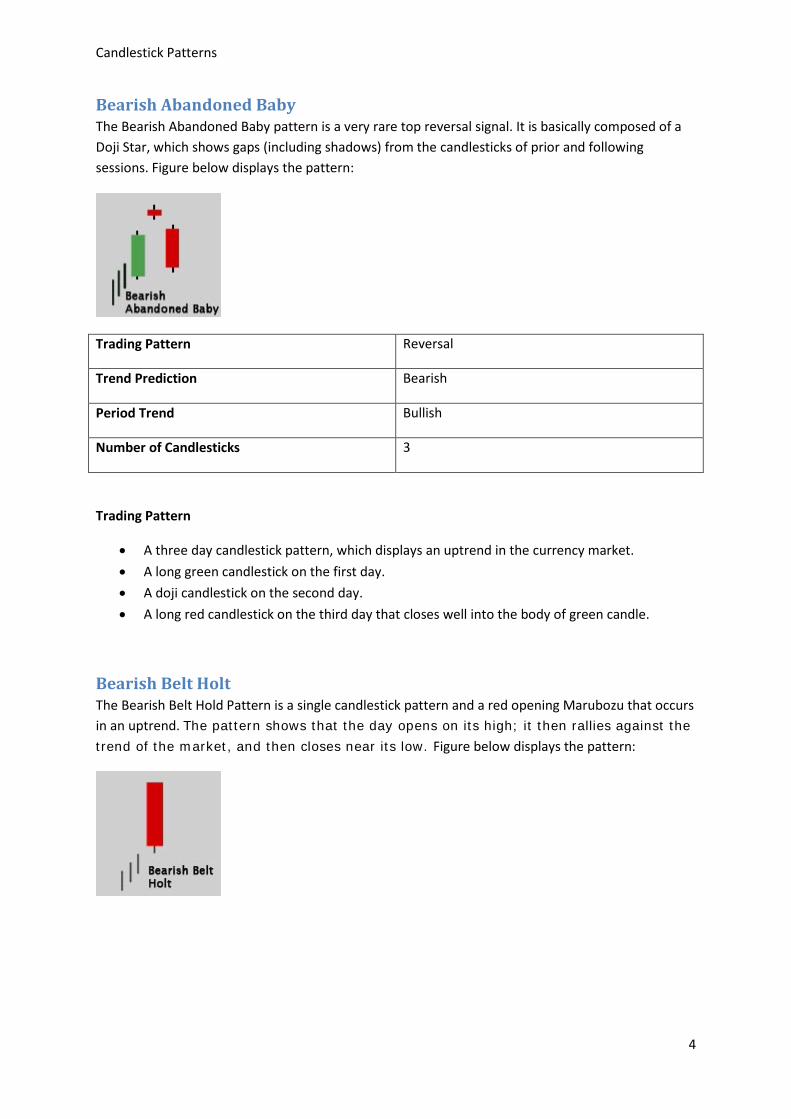
Bearish Abandoned Baby The Bearish Abandoned Baby pattern is a very rare top reversal signal. It is basically composed of a Doji Star, which shows gaps (including shadows) from the candlesticks of prior and following sessions. Figure below displays the pattern:
Trading Pattern Reversal
Trend Prediction Bearish
Period Trend Bullish
Number of Candlesticks 3
Trading Pattern
• A three day candlestick pattern, which displays an uptrend in the currency market. • A long green candlestick on the first day. • A doji candlestick on the second day. • A long red candlestick on the third day that closes well into the body of green candle.
Bearish Belt Holt The Bearish Belt Hold Pattern is a single candlestick pattern and a red opening Marubozu that occurs in an uptrend. The pattern shows that the day opens on its high; it then rallies against the
trend of the market, and then closes near its low. Figure below displays the pattern:
Candlestick Patterns
5
Trading Pattern Reversal
Trend Prediction Bearish
Period Trend Bullish
Number of Candlesticks 1
Note: The candlesticks without any shadows are termed as Marubozu
Trading Pattern
• A one day candlestick pattern, which displays an uptrend in the currency market. • The day gaps up and prices open high but gradually, prices move down closing near its low
for the day. • Henceforth, a red body characterized by the absence of upper shadow, which is called a red
opening Marubozu, is displayed.
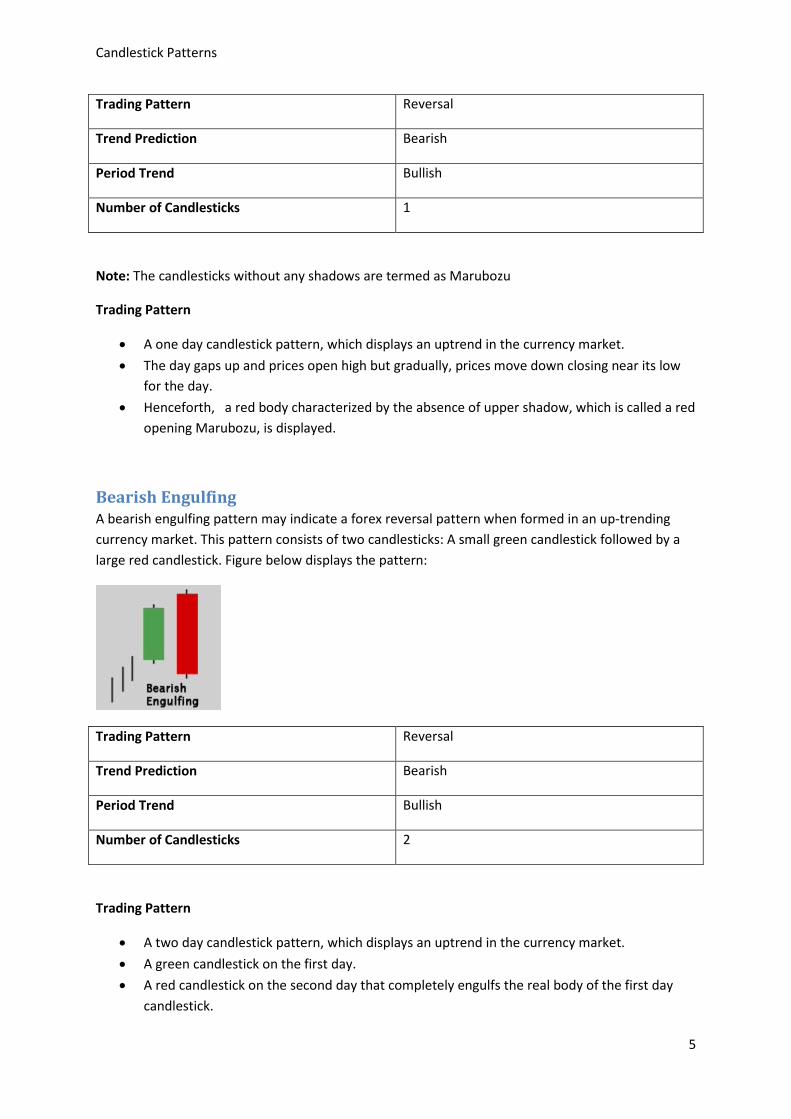
Bearish Engulfing A bearish engulfing pattern may indicate a forex reversal pattern when formed in an up-trending currency market. This pattern consists of two candlesticks: A small green candlestick followed by a large red candlestick. Figure below displays the pattern:
Trading Pattern Reversal
Trend Prediction Bearish
Period Trend Bullish
Number of Candlesticks 2
Trading Pattern
• A two day candlestick pattern, which displays an uptrend in the currency market. • A green candlestick on the first day. • A red candlestick on the second day that completely engulfs the real body of the first day
candlestick.
Candlestick Patterns
6
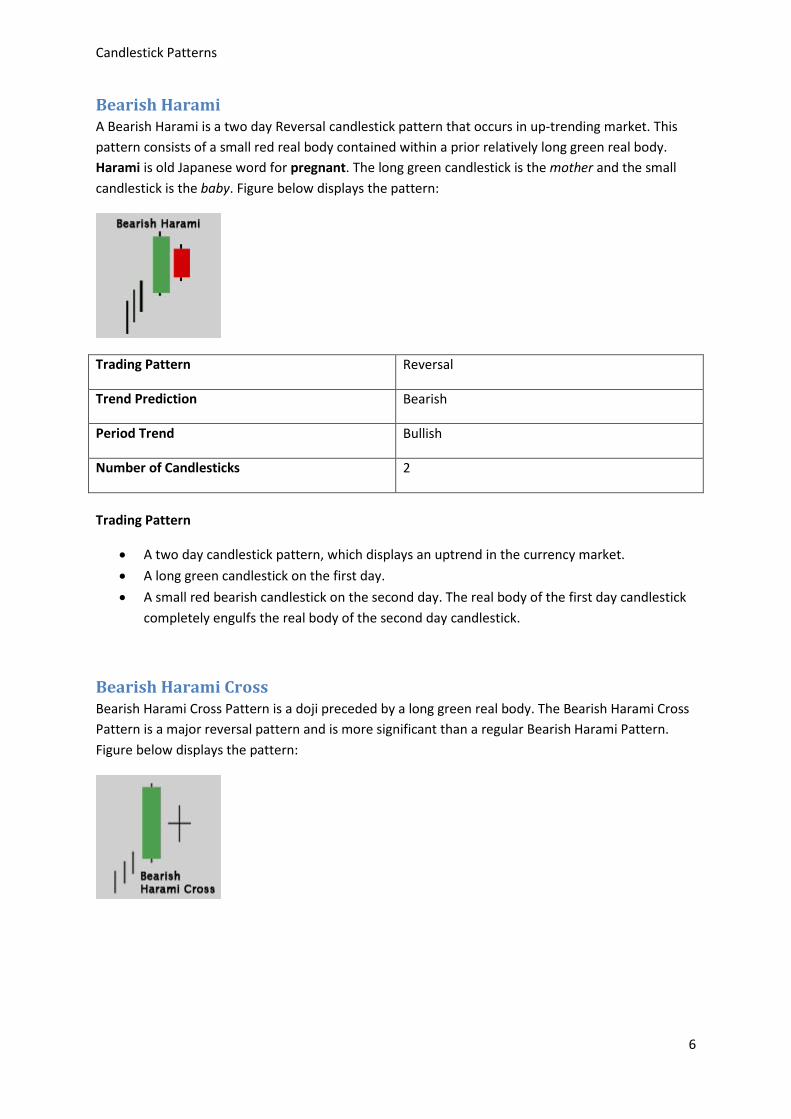
Bearish Harami A Bearish Harami is a two day Reversal candlestick pattern that occurs in up-trending market. This pattern consists of a small red real body contained within a prior relatively long green real body. Harami is old Japanese word for pregnant. The long green candlestick is the mother and the small candlestick is the baby. Figure below displays the pattern:
Trading Pattern Reversal
Trend Prediction Bearish
Period Trend Bullish
Number of Candlesticks 2
Trading Pattern
• A two day candlestick pattern, which displays an uptrend in the currency market. • A long green candlestick on the first day. • A small red bearish candlestick on the second day. The real body of the first day candlestick
completely engulfs the real body of the second day candlestick.
Bearish Harami Cross Bearish Harami Cross Pattern is a doji preceded by a long green real body. The Bearish Harami Cross Pattern is a major reversal pattern and is more significant than a regular Bearish Harami Pattern. Figure below displays the pattern:
Candlestick Patterns
7
Trading Pattern Reversal
Trend Prediction Bearish
Period Trend Bullish
Number of Candlesticks 2
Trading Pattern
• A two day candlestick pattern, which displays an uptrend in the currency market. • A long green candlestick on the first day. • A doji candlestick on the second day. The real body of the first day candlestick engulfs the
second day candlestick and the shadows (high/low) of this Doji may not be contained within the first day candlestick.
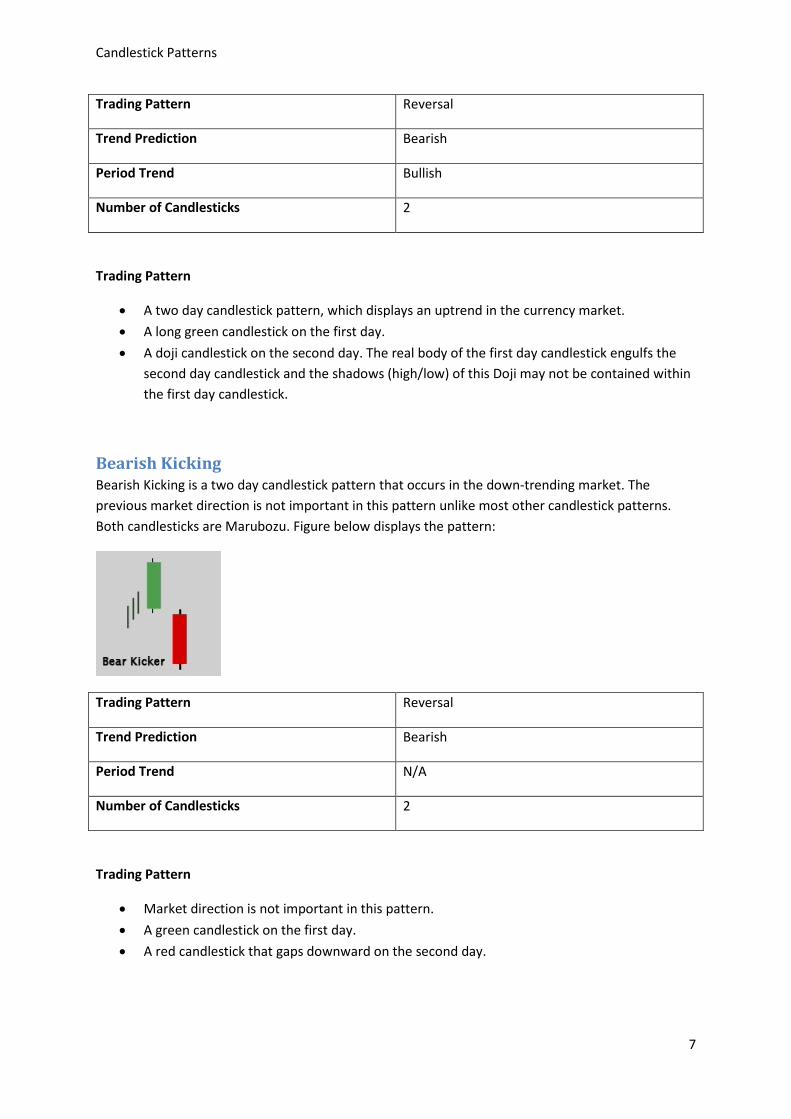
Bearish Kicking Bearish Kicking is a two day candlestick pattern that occurs in the down-trending market. The previous market direction is not important in this pattern unlike most other candlestick patterns. Both candlesticks are Marubozu. Figure below displays the pattern:
Trading Pattern Reversal
Trend Prediction Bearish
Period Trend N/A
Number of Candlesticks 2
Trading Pattern
• Market direction is not important in this pattern. • A green candlestick on the first day. • A red candlestick that gaps downward on the second day.
Candlestick Patterns
8
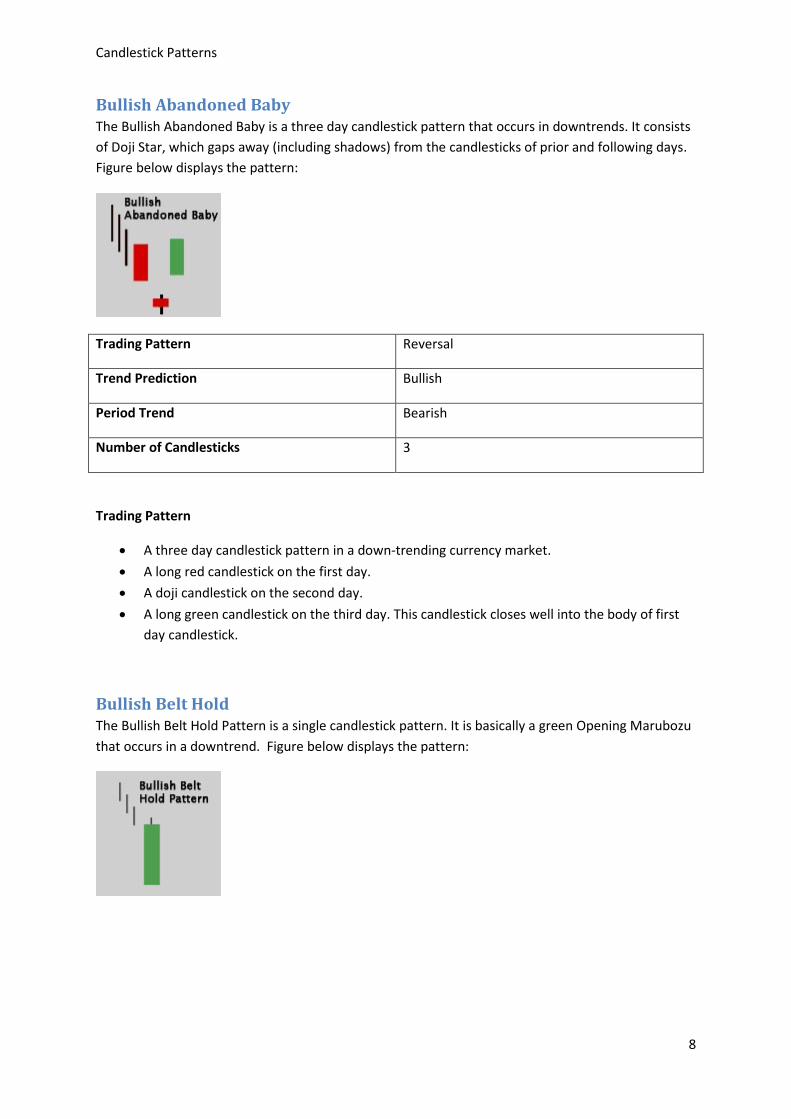
Bullish Abandoned Baby The Bullish Abandoned Baby is a three day candlestick pattern that occurs in downtrends. It consists of Doji Star, which gaps away (including shadows) from the candlesticks of prior and following days. Figure below displays the pattern:
Trading Pattern Reversal
Trend Prediction Bullish
Period Trend Bearish
Number of Candlesticks 3
Trading Pattern
• A three day candlestick pattern in a down-trending currency market. • A long red candlestick on the first day. • A doji candlestick on the second day. • A long green candlestick on the third day. This candlestick closes well into the body of first
day candlestick.
Bullish Belt Hold The Bullish Belt Hold Pattern is a single candlestick pattern. It is basically a green Opening Marubozu that occurs in a downtrend. Figure below displays the pattern:
Candlestick Patterns
9
Trading Pattern Reversal
Trend Prediction Bullish
Period Trend Bearish
Number of Candlesticks 1
Trading Pattern
• A one day candlestick pattern in a down-trending currency market. • As the day gaps down, the market opens at its low but then prices go up during the day and
they close near to the day’s high. • A green candlestick body that has no lower shadow.
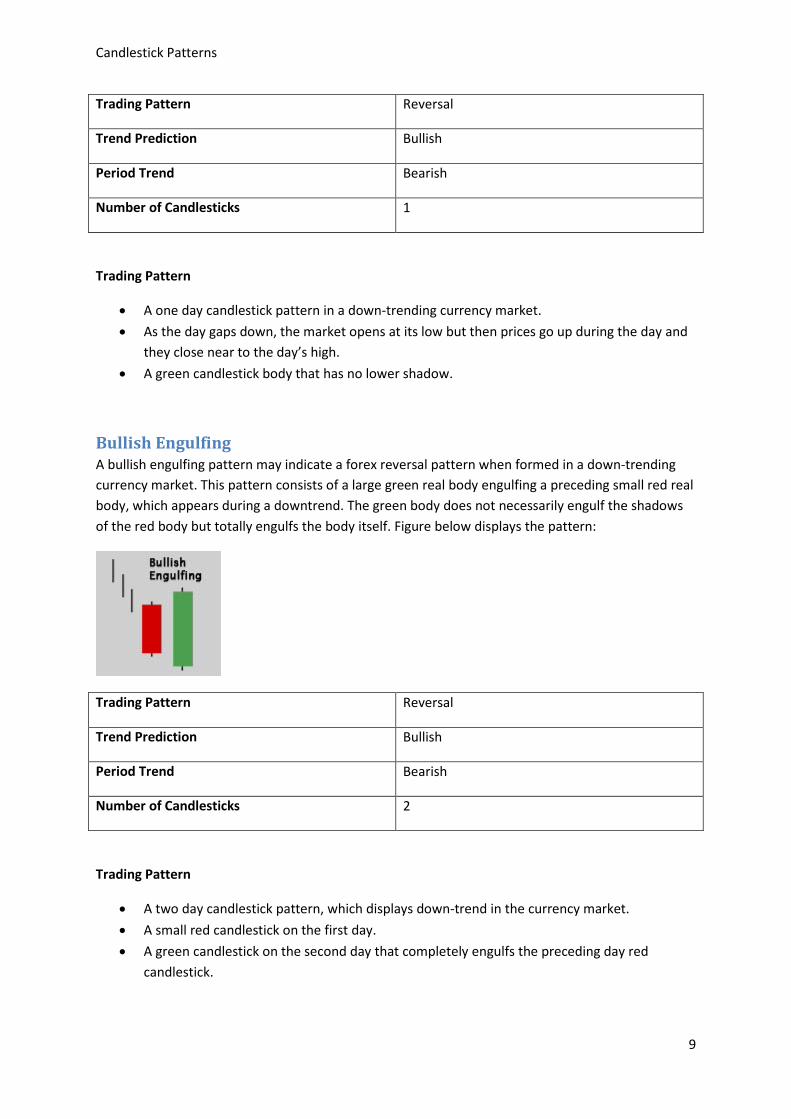
Bullish Engulfing A bullish engulfing pattern may indicate a forex reversal pattern when formed in a down-trending currency market. This pattern consists of a large green real body engulfing a preceding small red real body, which appears during a downtrend. The green body does not necessarily engulf the shadows of the red body but totally engulfs the body itself. Figure below displays the pattern:
Trading Pattern Reversal
Trend Prediction Bullish
Period Trend Bearish
Number of Candlesticks 2
Trading Pattern
• A two day candlestick pattern, which displays down-trend in the currency market. • A small red candlestick on the first day. • A green candlestick on the second day that completely engulfs the preceding day red
candlestick.
Candlestick Patterns
10
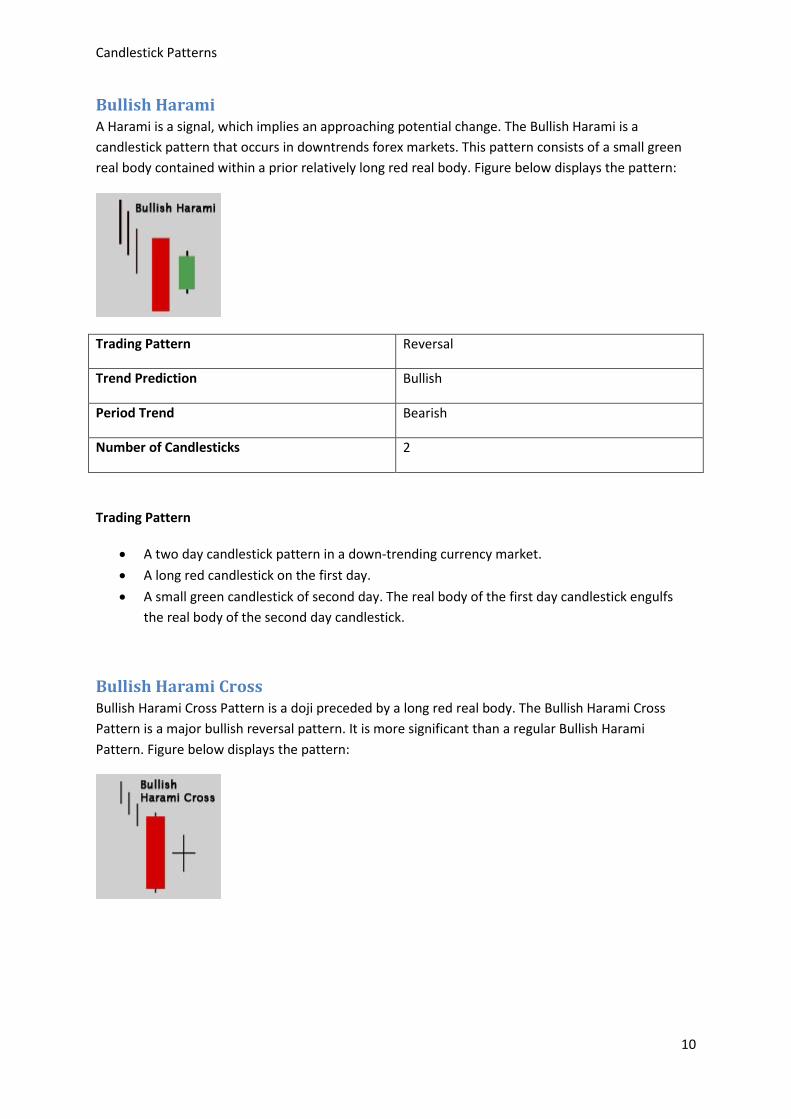
Bullish Harami A Harami is a signal, which implies an approaching potential change. The Bullish Harami is a candlestick pattern that occurs in downtrends forex markets. This pattern consists of a small green real body contained within a prior relatively long red real body. Figure below displays the pattern:
Trading Pattern Reversal
Trend Prediction Bullish
Period Trend Bearish
Number of Candlesticks 2
Trading Pattern
• A two day candlestick pattern in a down-trending currency market. • A long red candlestick on the first day. • A small green candlestick of second day. The real body of the first day candlestick engulfs
the real body of the second day candlestick.
Bullish Harami Cross Bullish Harami Cross Pattern is a doji preceded by a long red real body. The Bullish Harami Cross Pattern is a major bullish reversal pattern. It is more significant than a regular Bullish Harami Pattern. Figure below displays the pattern:
Candlestick Patterns
11
Trading Pattern Reversal
Trend Prediction Bullish
Period Trend Bearish
Number of Candlesticks 2
Trading Pattern
• A two day candlestick pattern in a down-trending currency market. • A long red candlestick on the first day. • A Doji candlestick on the second day. The first day candlestick completely engulfs body of
the second day candlestick. The shadows (high/low) of the doji may not be necessarily contained within the red candlestick body.
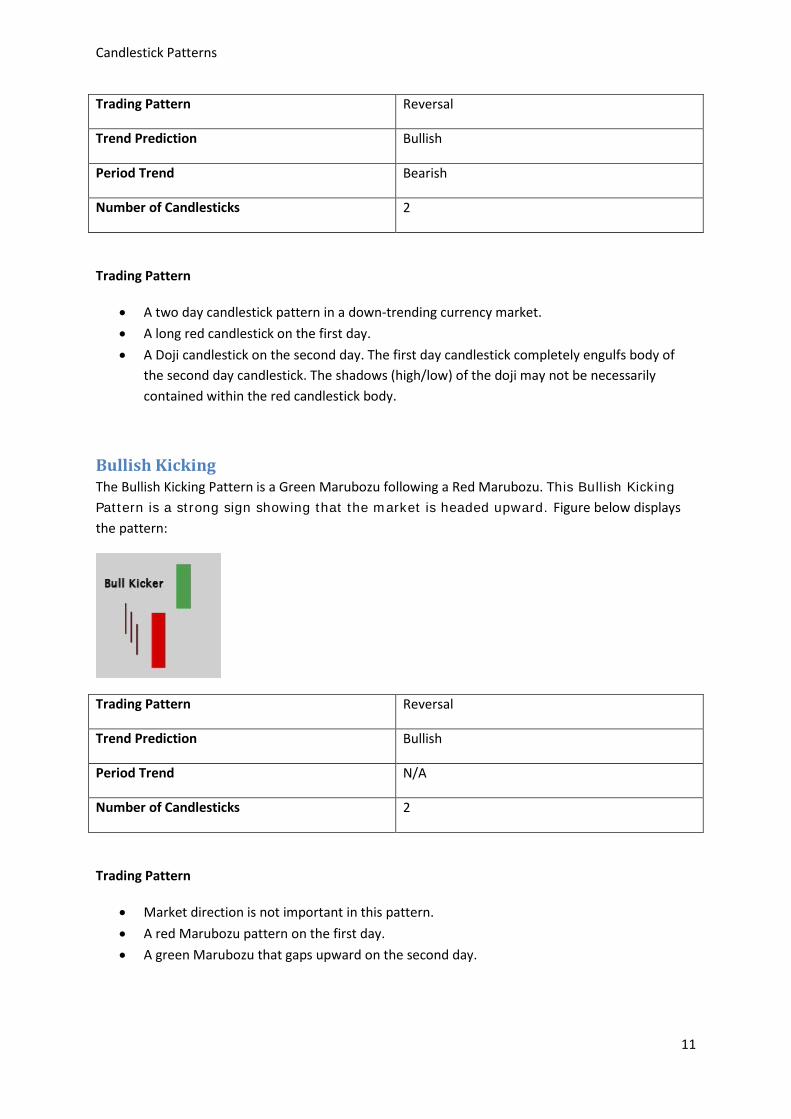
Bullish Kicking The Bullish Kicking Pattern is a Green Marubozu following a Red Marubozu. This Bullish Kicking
Pattern is a strong sign showing that the market is headed upward. Figure below displays the pattern:
Trading Pattern Reversal
Trend Prediction Bullish
Period Trend N/A
Number of Candlesticks 2
Trading Pattern
• Market direction is not important in this pattern. • A red Marubozu pattern on the first day. • A green Marubozu that gaps upward on the second day.
Candlestick Patterns
12
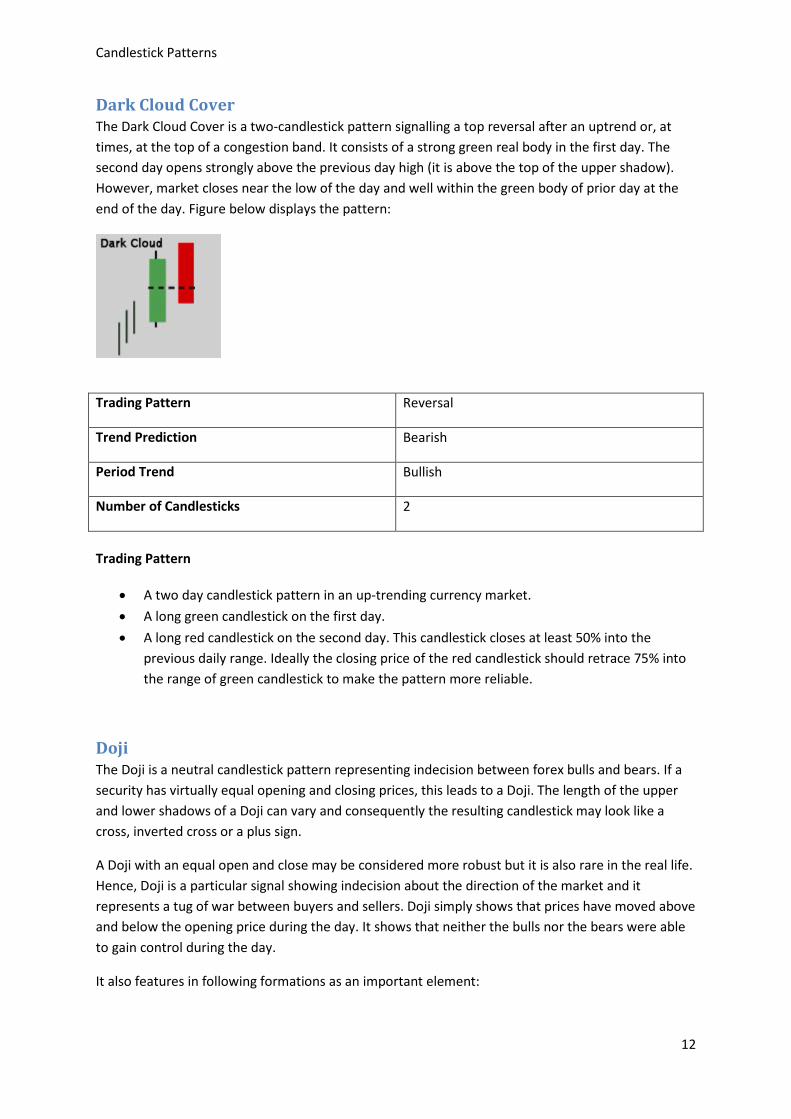
Dark Cloud Cover The Dark Cloud Cover is a two-candlestick pattern signalling a top reversal after an uptrend or, at times, at the top of a congestion band. It consists of a strong green real body in the first day. The second day opens strongly above the previous day high (it is above the top of the upper shadow). However, market closes near the low of the day and well within the green body of prior day at the end of the day. Figure below displays the pattern:
Trading Pattern Reversal
Trend Prediction Bearish
Period Trend Bullish
Number of Candlesticks 2
Trading Pattern
• A two day candlestick pattern in an up-trending currency market. • A long green candlestick on the first day. • A long red candlestick on the second day. This candlestick closes at least 50% into the
previous daily range. Ideally the closing price of the red candlestick should retrace 75% into the range of green candlestick to make the pattern more reliable.
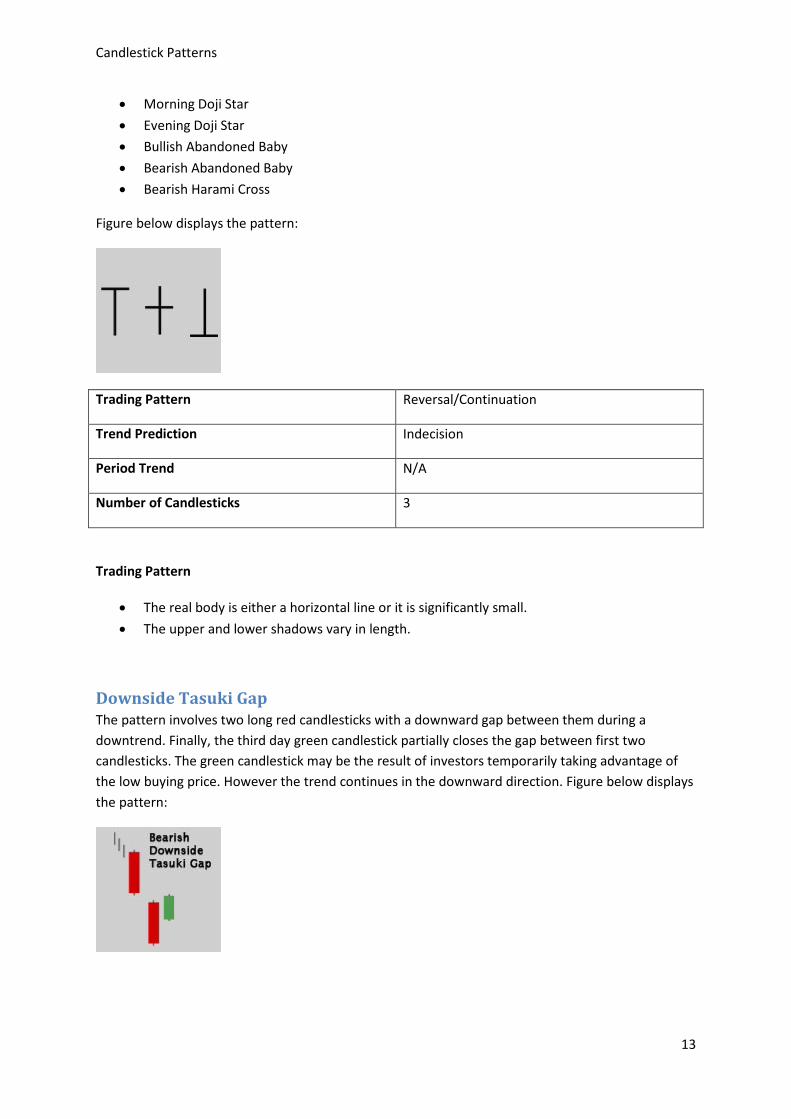
Doji The Doji is a neutral candlestick pattern representing indecision between forex bulls and bears. If a security has virtually equal opening and closing prices, this leads to a Doji. The length of the upper and lower shadows of a Doji can vary and consequently the resulting candlestick may look like a cross, inverted cross or a plus sign.
A Doji with an equal open and close may be considered more robust but it is also rare in the real life. Hence, Doji is a particular signal showing indecision about the direction of the market and it represents a tug of war between buyers and sellers. Doji simply shows that prices have moved above and below the opening price during the day. It shows that neither the bulls nor the bears were able to gain control during the day.
It also features in following formations as an important element:
Candlestick Patterns
13
• Morning Doji Star • Evening Doji Star • Bullish Abandoned Baby • Bearish Abandoned Baby • Bearish Harami Cross
Figure below displays the pattern:
Trading Pattern Reversal/Continuation
Trend Prediction Indecision
Period Trend N/A
Number of Candlesticks 3
Trading Pattern
• The real body is either a horizontal line or it is significantly small. • The upper and lower shadows vary in length.
Downside Tasuki Gap The pattern involves two long red candlesticks with a downward gap between them during a downtrend. Finally, the third day green candlestick partially closes the gap between first two candlesticks. The green candlestick may be the result of investors temporarily taking advantage of the low buying price. However the trend continues in the downward direction. Figure below displays the pattern:
Candlestick Patterns
14
Trading Pattern Continuation
Trend Prediction Bearish
Period Trend Bearish
Number of Candlesticks 3
Trading Pattern
• A three day candlestick pattern in a down-trending currency market. • Two long red candlesticks with a gap between them on the first and second days. • A green candlestick characterized with an opening within the body of the second day
candlestick. • The body of third day candlestick closes into the gap but does not fully close the gap.
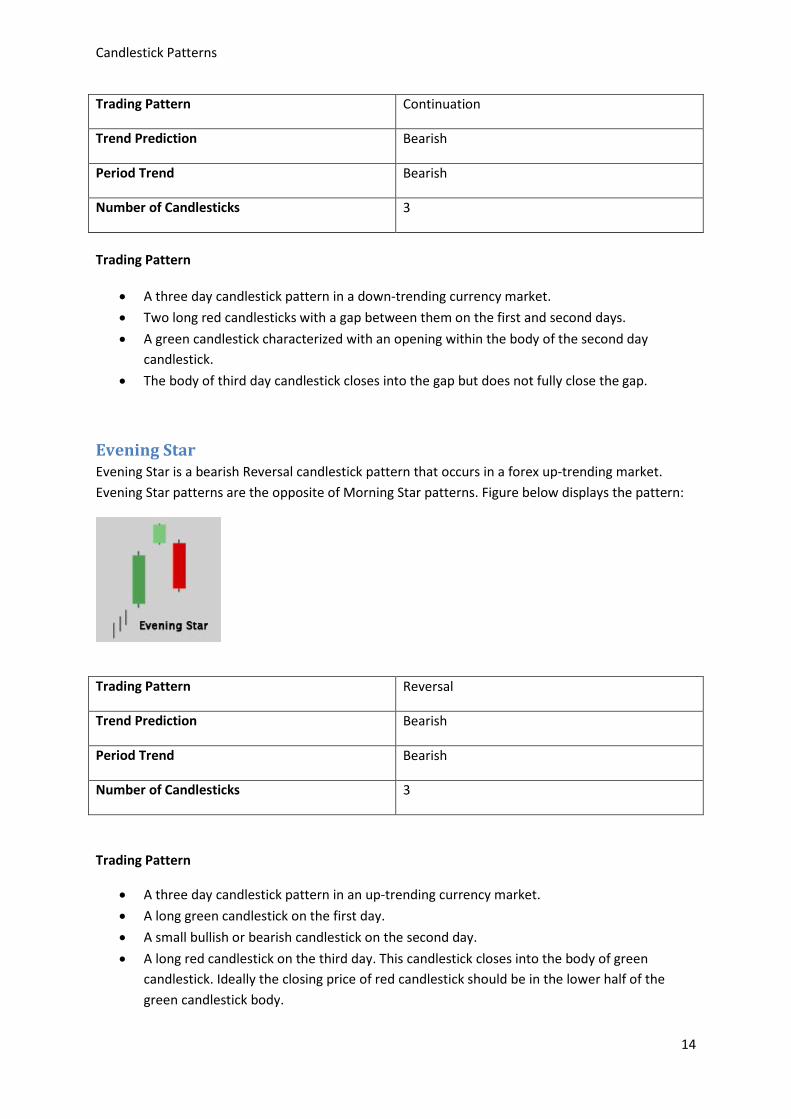
Evening Star Evening Star is a bearish Reversal candlestick pattern that occurs in a forex up-trending market. Evening Star patterns are the opposite of Morning Star patterns. Figure below displays the pattern:
Trading Pattern Reversal
Trend Prediction Bearish
Period Trend Bearish
Number of Candlesticks 3
Trading Pattern
• A three day candlestick pattern in an up-trending currency market. • A long green candlestick on the first day. • A small bullish or bearish candlestick on the second day. • A long red candlestick on the third day. This candlestick closes into the body of green
candlestick. Ideally the closing price of red candlestick should be in the lower half of the green candlestick body.
Candlestick Patterns
15
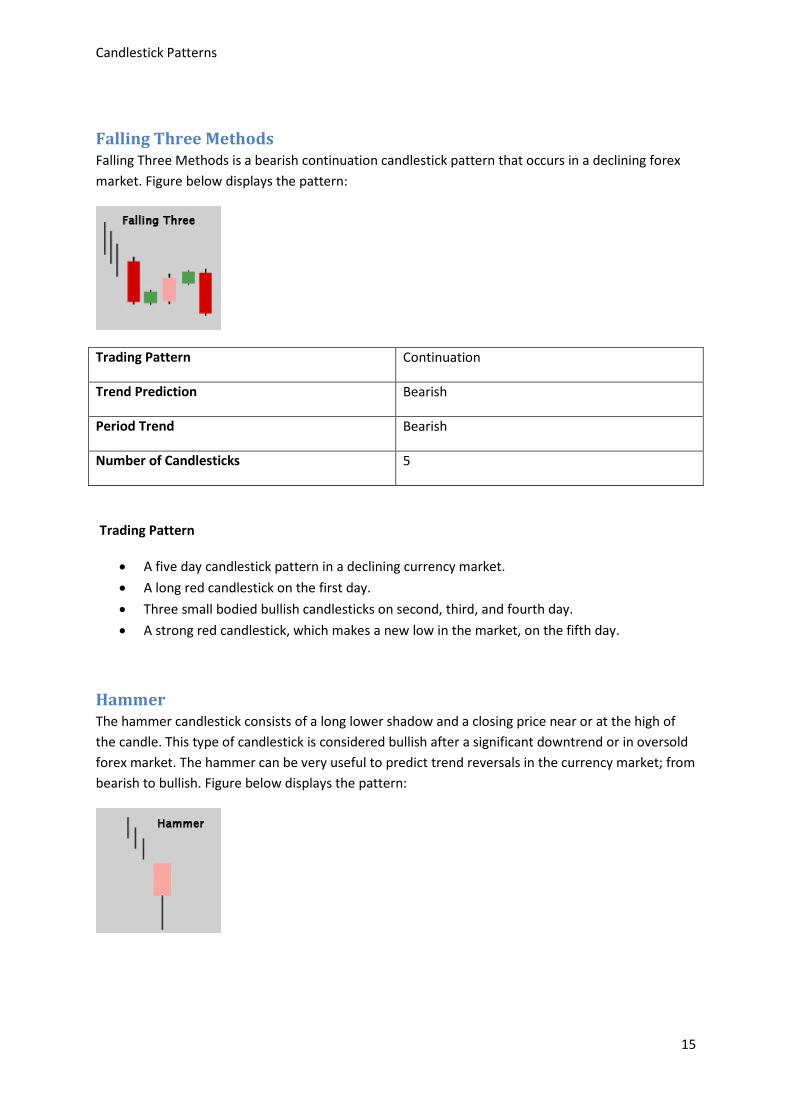
Falling Three Methods Falling Three Methods is a bearish continuation candlestick pattern that occurs in a declining forex market. Figure below displays the pattern:
Trading Pattern Continuation
Trend Prediction Bearish
Period Trend Bearish
Number of Candlesticks 5
Trading Pattern
• A five day candlestick pattern in a declining currency market. • A long red candlestick on the first day. • Three small bodied bullish candlesticks on second, third, and fourth day. • A strong red candlestick, which makes a new low in the market, on the fifth day.
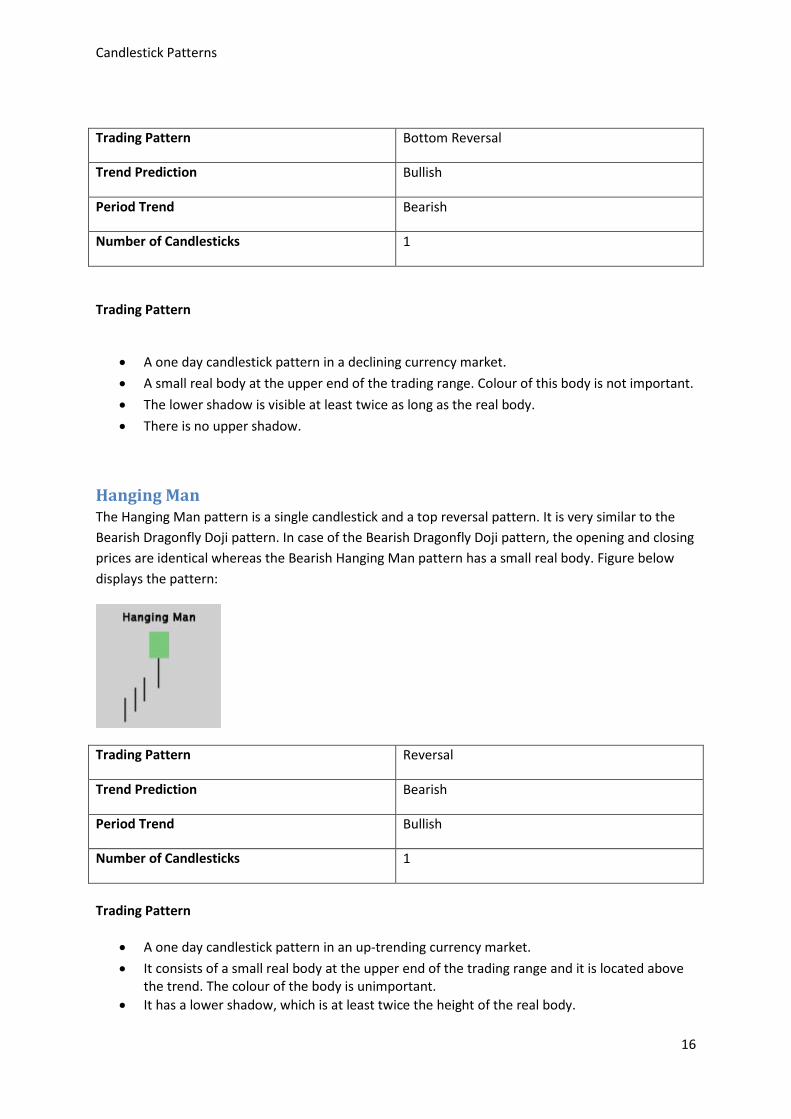
Hammer The hammer candlestick consists of a long lower shadow and a closing price near or at the high of the candle. This type of candlestick is considered bullish after a significant downtrend or in oversold forex market. The hammer can be very useful to predict trend reversals in the currency market; from bearish to bullish. Figure below displays the pattern:
Candlestick Patterns
16
Trading Pattern Bottom Reversal
Trend Prediction Bullish
Period Trend Bearish
Number of Candlesticks 1
Trading Pattern
• A one day candlestick pattern in a declining currency market. • A small real body at the upper end of the trading range. Colour of this body is not important. • The lower shadow is visible at least twice as long as the real body. • There is no upper shadow.
Hanging Man The Hanging Man pattern is a single candlestick and a top reversal pattern. It is very similar to the Bearish Dragonfly Doji pattern. In case of the Bearish Dragonfly Doji pattern, the opening and closing prices are identical whereas the Bearish Hanging Man pattern has a small real body. Figure below displays the pattern:
Trading Pattern Reversal
Trend Prediction Bearish
Period Trend Bullish
Number of Candlesticks 1
Trading Pattern
• A one day candlestick pattern in an up-trending currency market. • It consists of a small real body at the upper end of the trading range and it is located above
the trend. The colour of the body is unimportant. • It has a lower shadow, which is at least twice the height of the real body.
Candlestick Patterns
17
• There is either no upper shadow or a very short upper shadow.
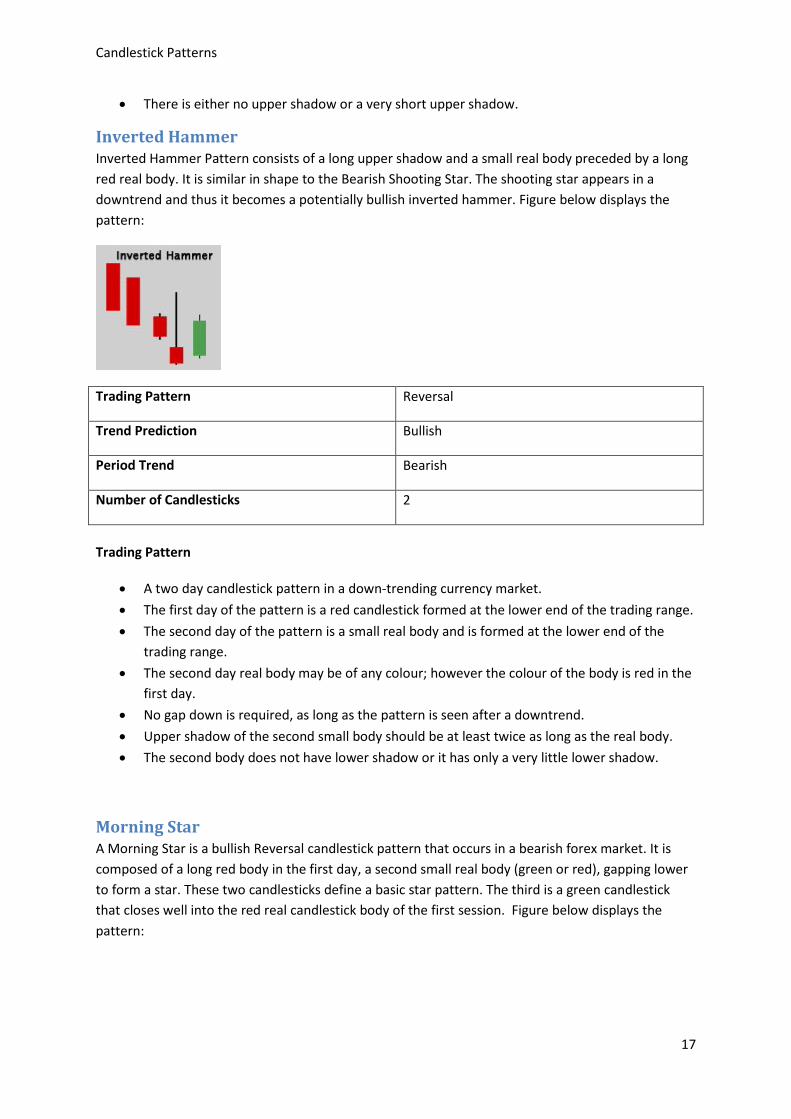
Inverted Hammer Inverted Hammer Pattern consists of a long upper shadow and a small real body preceded by a long red real body. It is similar in shape to the Bearish Shooting Star. The shooting star appears in a downtrend and thus it becomes a potentially bullish inverted hammer. Figure below displays the pattern:
Trading Pattern Reversal
Trend Prediction Bullish
Period Trend Bearish
Number of Candlesticks 2
Trading Pattern
• A two day candlestick pattern in a down-trending currency market. • The first day of the pattern is a red candlestick formed at the lower end of the trading range. • The second day of the pattern is a small real body and is formed at the lower end of the
trading range. • The second day real body may be of any colour; however the colour of the body is red in the
first day. • No gap down is required, as long as the pattern is seen after a downtrend. • Upper shadow of the second small body should be at least twice as long as the real body. • The second body does not have lower shadow or it has only a very little lower shadow.
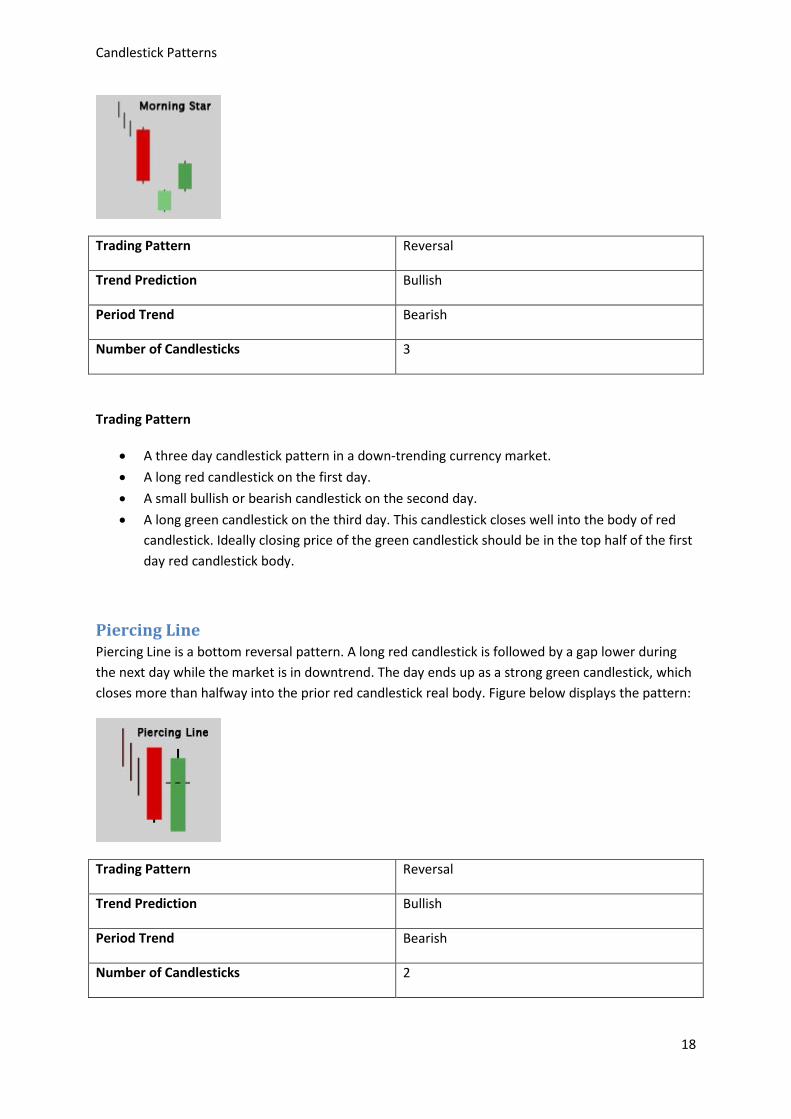
Morning Star A Morning Star is a bullish Reversal candlestick pattern that occurs in a bearish forex market. It is composed of a long red body in the first day, a second small real body (green or red), gapping lower to form a star. These two candlesticks define a basic star pattern. The third is a green candlestick that closes well into the red real candlestick body of the first session. Figure below displays the pattern:
Candlestick Patterns
18
Trading Pattern Reversal
Trend Prediction Bullish
Period Trend Bearish
Number of Candlesticks 3
Trading Pattern
• A three day candlestick pattern in a down-trending currency market. • A long red candlestick on the first day. • A small bullish or bearish candlestick on the second day. • A long green candlestick on the third day. This candlestick closes well into the body of red
candlestick. Ideally closing price of the green candlestick should be in the top half of the first day red candlestick body.
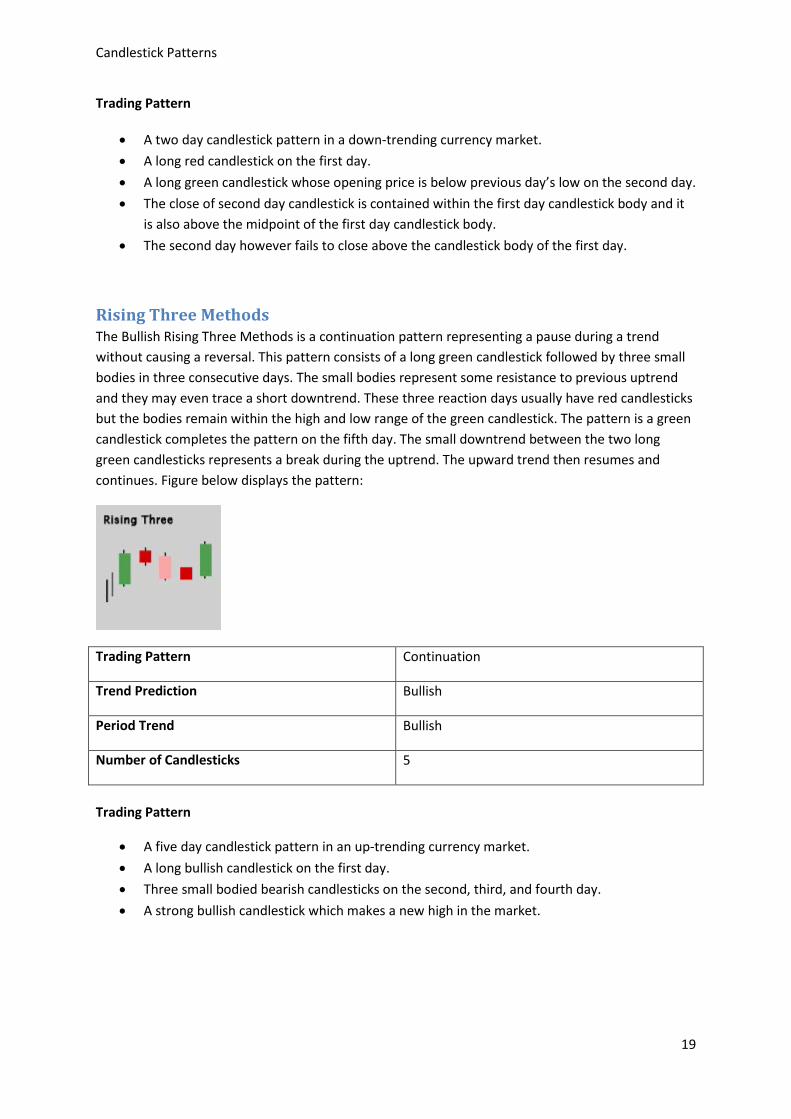
Piercing Line Piercing Line is a bottom reversal pattern. A long red candlestick is followed by a gap lower during the next day while the market is in downtrend. The day ends up as a strong green candlestick, which closes more than halfway into the prior red candlestick real body. Figure below displays the pattern:
Trading Pattern Reversal
Trend Prediction Bullish
Period Trend Bearish
Number of Candlesticks 2
Candlestick Patterns
19
Trading Pattern
• A two day candlestick pattern in a down-trending currency market. • A long red candlestick on the first day. • A long green candlestick whose opening price is below previous day’s low on the second day. • The close of second day candlestick is contained within the first day candlestick body and it
is also above the midpoint of the first day candlestick body. • The second day however fails to close above the candlestick body of the first day.
Rising Three Methods The Bullish Rising Three Methods is a continuation pattern representing a pause during a trend without causing a reversal. This pattern consists of a long green candlestick followed by three small bodies in three consecutive days. The small bodies represent some resistance to previous uptrend and they may even trace a short downtrend. These three reaction days usually have red candlesticks but the bodies remain within the high and low range of the green candlestick. The pattern is a green candlestick completes the pattern on the fifth day. The small downtrend between the two long green candlesticks represents a break during the uptrend. The upward trend then resumes and continues. Figure below displays the pattern:
Trading Pattern Continuation
Trend Prediction Bullish
Period Trend Bullish
Number of Candlesticks 5
Trading Pattern
• A five day candlestick pattern in an up-trending currency market. • A long bullish candlestick on the first day. • Three small bodied bearish candlesticks on the second, third, and fourth day. • A strong bullish candlestick which makes a new high in the market.

Candlestick Patterns
20
Shooting Star The Shooting Star Pattern suggests that prices may be approaching to a top, as its name, a shooting star. The shooting star is a small real body characterized by a long upper shadow, which gaps away from the prior real body. Figure below displays the pattern:
Trading Pattern Reversal
Trend Prediction Bearish
Period Trend Bullish
Number of Candlesticks 2
Trading Pattern
• A two day candlestick pattern in an up-trending currency market. • A green candlestick on the first day. • Prices then open with a gap and create a small real body at the lower end of the trading
range on the second day. • Upper shadow of the pattern on the second day is usually at least twice as long as the real
body. • However; second day pattern has no lower shadow.
Stick Sandwich The Bullish Stick Sandwich Pattern is characterized by consecutive higher opens for three days, but results in an eventual close equal to the first day's close. It may warn that prices are now finding a support price. We may then see a reversal from this support level. Figure below displays the pattern:
Candlestick Patterns
21
Trading Pattern Reversal
Trend Prediction Bullish
Period Trend Bearish
Number of Candlesticks 3
Trading Pattern
• A three day candlestick pattern in a down-trending currency market. • A red closing Marubozu on the first day. • A green candlestick, which is above the close of the first day. • Then again a red closing Marubozu characterized with a close equal to the close of the first
day.
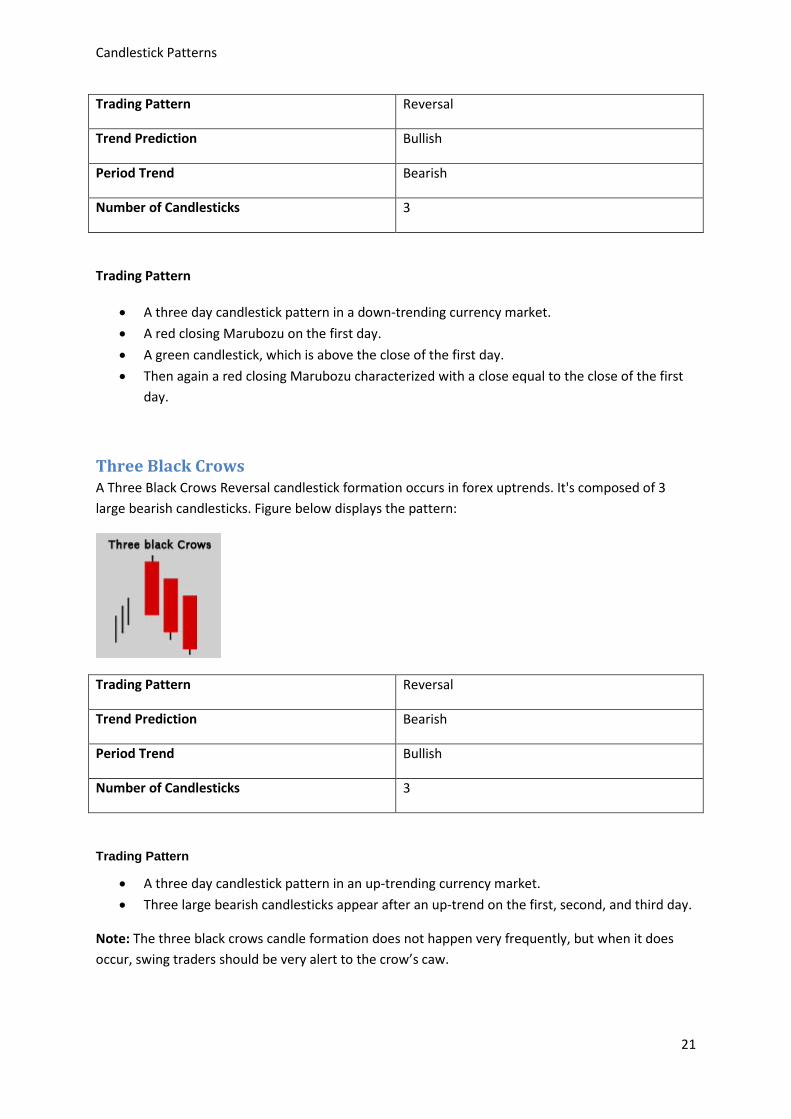
Three Black Crows A Three Black Crows Reversal candlestick formation occurs in forex uptrends. It's composed of 3 large bearish candlesticks. Figure below displays the pattern:
Trading Pattern Reversal
Trend Prediction Bearish
Period Trend Bullish
Number of Candlesticks 3
Trading Pattern
• A three day candlestick pattern in an up-trending currency market. • Three large bearish candlesticks appear after an up-trend on the first, second, and third day.
Note: The three black crows candle formation does not happen very frequently, but when it does occur, swing traders should be very alert to the crow’s caw.
Candlestick Patterns
22
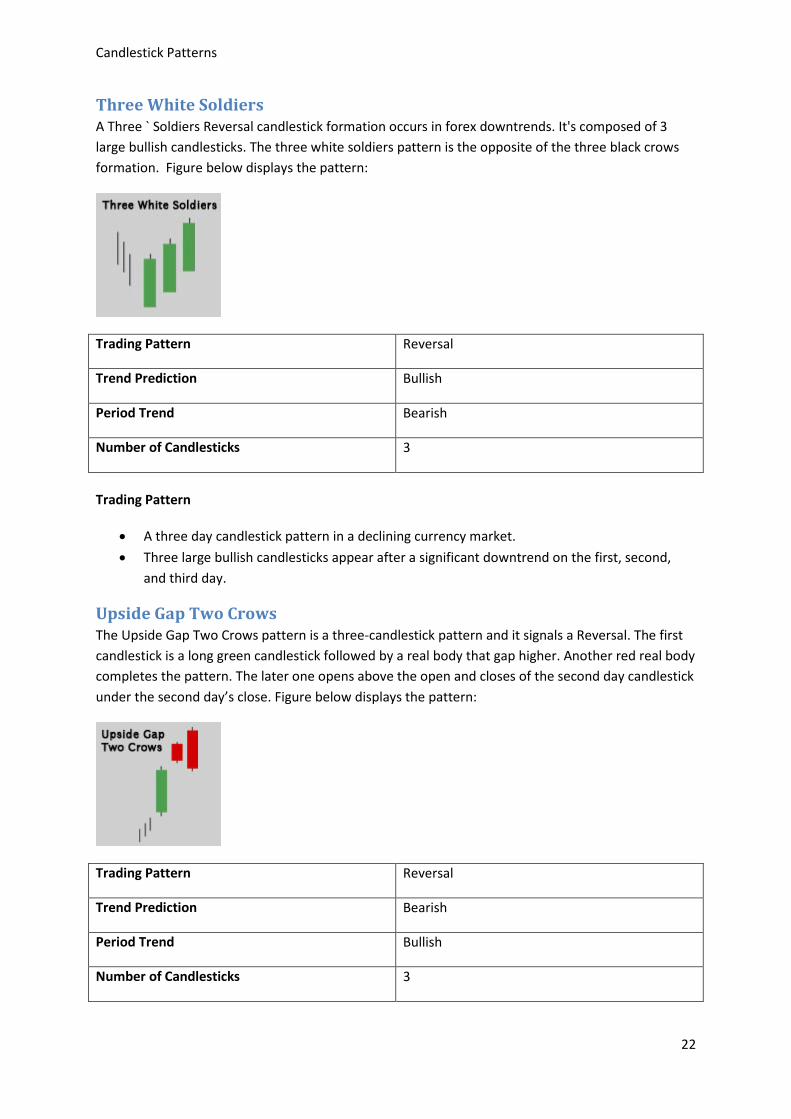
Three White Soldiers A Three ` Soldiers Reversal candlestick formation occurs in forex downtrends. It's composed of 3 large bullish candlesticks. The three white soldiers pattern is the opposite of the three black crows formation. Figure below displays the pattern:
Trading Pattern Reversal
Trend Prediction Bullish
Period Trend Bearish
Number of Candlesticks 3
Trading Pattern
• A three day candlestick pattern in a declining currency market. • Three large bullish candlesticks appear after a significant downtrend on the first, second,
and third day.
Upside Gap Two Crows The Upside Gap Two Crows pattern is a three-candlestick pattern and it signals a Reversal. The first candlestick is a long green candlestick followed by a real body that gap higher. Another red real body completes the pattern. The later one opens above the open and closes of the second day candlestick under the second day’s close. Figure below displays the pattern:
Trading Pattern Reversal
Trend Prediction Bearish
Period Trend Bullish
Number of Candlesticks 3
Candlestick Patterns
23
Trading Pattern
• A three day candlestick pattern in an up-trending currency market. • A long green candlestick on the first day that signals the continuation of uptrend. • Then a red body with a gap up on the second day. • The third day is characterized by another red candlestick having an opening above the first
day red candlestick and also closing below the body of the first day red candlestick. The body of third day engulfs the body of the first day.
• The close of the second day red candlestick remains above the close of the first long green candlestick.
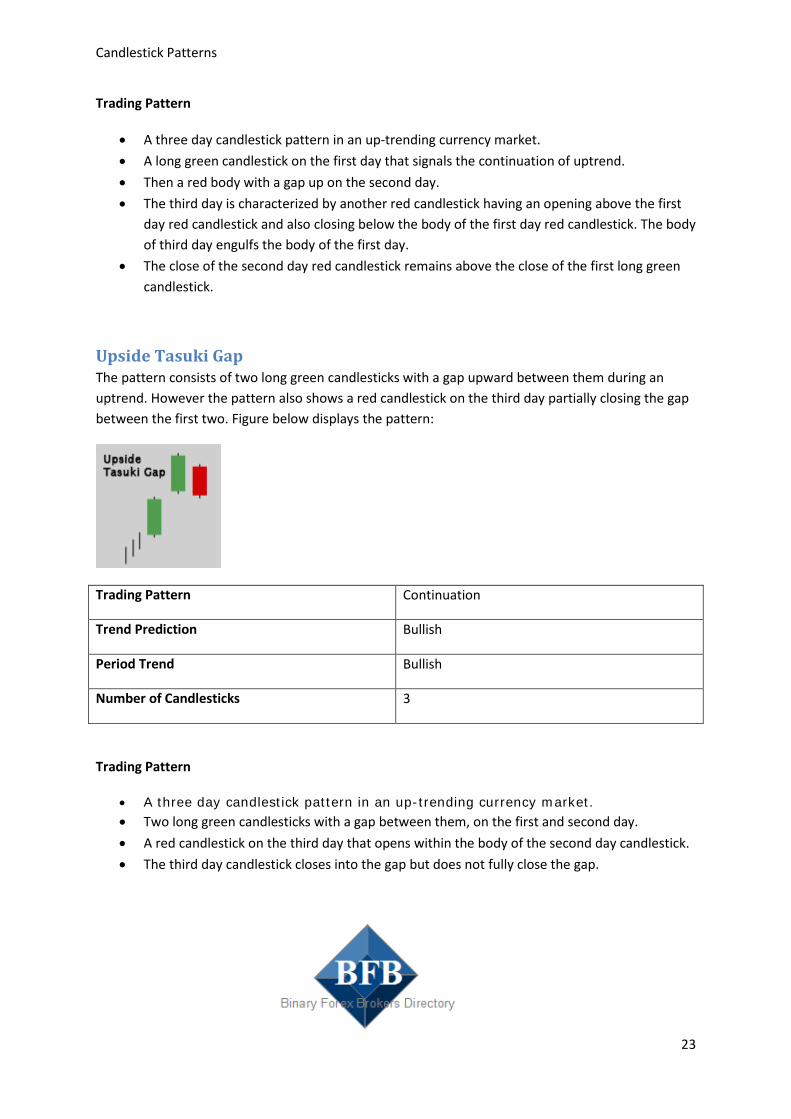
Upside Tasuki Gap The pattern consists of two long green candlesticks with a gap upward between them during an uptrend. However the pattern also shows a red candlestick on the third day partially closing the gap between the first two. Figure below displays the pattern:
Trading Pattern Continuation
Trend Prediction Bullish
Period Trend Bullish
Number of Candlesticks 3
Trading Pattern
• A three day candlestick pattern in an up-trending currency market. • Two long green candlesticks with a gap between them, on the first and second day. • A red candlestick on the third day that opens within the body of the second day candlestick. • The third day candlestick closes into the gap but does not fully close the gap.