cancer using an integrated bioinformatics analysis
TRANSCRIPT

Page 1/21
Identi�cation of Key genes associated withpolycystic ovary syndrome (PCOS) and ovariancancer using an integrated bioinformatics analysisJuan Zou
University of South ChinaYukun Li
university of south chinaNianchun Liao
University of South ChinaJue Liu
University of South ChinaQunfeng Zhang
University of South ChinaMin Luo
University of South ChinaJiao Xiao
University of South ChinaYanhua Chen
University of South ChinaMengjie Wang
University of South ChinaKexin Chen
University of South ChinaJuan Zeng ( [email protected] )
University of South ChinaZhongcheng Mo
Guilin Medical University
Research Article
Keywords: Ovarian cancer, Polycystic ovary syndrome, Bioinformatic analysis, OGN, Prognostic marker
Posted Date: September 27th, 2021
DOI: https://doi.org/10.21203/rs.3.rs-934214/v1

Page 2/21
License: This work is licensed under a Creative Commons Attribution 4.0 International License. Read Full License

Page 3/21
Abstract
BackgroundAccumulating evidence suggested a strong association between polycystic ovary syndrome (PCOS) andovarian cancer (OC), but the potential molecular mechanism is still unclear. In this study, we identifyunrecognized but signi�cant genes correlated to PCOS and OC via bioinformatics.
Materials and methodsMultiple bioinformatic analysis, such as Differential expression analysis, Univariate Cox analysis,functional and pathway enrichment analysis, protein–protein interaction (PPI) network construction,survival analysis, and Immune in�ltration analysis were utilized. We further evaluated the effect of OGNon FSHR expression via immuno�uorescence.
ResultsThe TCGA-OC dataset, GSE140082 (for OC) and GSE34526 (for PCOS) dataset were downloaded. 12genes, RNF144B, LPAR3, CRISPLD2, JCHAIN, OR7E14P, IL27RA, PTPRD, STAT1, NR4A1, OGN, GALNT6and CXCL11, were recognized as signature genes. Drug sensitive analysis was showed that OGN mightbe a hub gene in the progression of PCOS and OC. Experimental analysis found OGN could increase theFSHR expression, indicating OGN could regulate the hormonal response in PCOS and OC. Furthermore,correlation analysis indicated that the function of OGN might be closely related with m6A and ferroptosis.
ConclusionsOur study indicated 12 signatures that might involved in the prognosis signi�cance of OC, and closelyrelated the correlation between OC and PCOS. Furthermore, the hub gene, OGN, was a signi�cant gene inthe OC and PCOS progression via regulating the hormonal response.
IntroductionPolycystic ovary syndrome (PCOS), a multi-system reproductive metabolic disease of the reproductivesystem, is characterized by the pathological accumulation of non-maturating and atretic follicles, ovarianand stromal abnormal hyperplasia, hyperandrogenemia (HA), hyperinsulinemia, insulin resistance (IR),metabolic aberrant, an imbalance ratio of luteinizing hormone (LH) to follicle-stimulating hormone (FSH),and polycystic ovary(1). The mRNA and microRNA pro�les of PCOS patients were extremely similar withovarian cancer (OC) patients, which indicated that the same molecular mechanisms might be betweenOC and PCOS patients(2, 3).

Page 4/21
In the progression of PCOS patients, HA is an important factor for promoting ovulatory dysfunction(4),increasing frequency and amplitude of LH and GnRH pulse secretion(5), inducing lipid metabolismdisorders(6), mediating hyperinsulinemia and insulin resistance(7), and dysregulating the ratio of LH toFSH(8).
For the clinical management of patients with PCOS, the anti-androgen therapy is the �rst line of treatmentfor patients diagnosed with PCOS(9). Over recent years, the relationship between the PCOS and OCprogression has been a hot topic for these study due to AR signaling axis and metabolic disorders arecorrelated with a high risk of OC(3, 10, 11). Both OC and PCOS are multifactorial diseases, with genetic,endogenous, endocrine maladjusted, metabolically disturbed and environmental factors. Therefore, abetter understanding of the physiopathologic mechanism regulating these complex molecular effects isurgently needed to promote the research and development of new drugs, and to improve these patient’sprognosis.
With the development of bioinformatic analysis and public databases, such as The Cancer Genome Atlas(TCGA)(12) and Gene Expression Omnibus (GEO)(13), understanding the molecular mechanisms ofcurrently available treatments against PCOS and OC provides a means to emphasize targets for effectivetreatments. For example, Surleen Kaur found that in PCOS tissues there is amount of differentiallyexpressed genes correlated to metabolic disorders and oxidative stress, and with a potential relationshipwith cancer as well(14). HSA2 and CBLN1 were all identi�ed in an PCOS dataset(15). Another studyidenti�ed 36 highly altered genes, among them 10 were shared among endometrial cancer (EC), OC andbreast cancer (BC), resulting in cell proliferation, hormone response, and endogenous stimulation(16). Aseries of bioinformatics tools were used for integrated analysis and detection of metabolism relatedgenes (MRGs) in OC. For example, we found that ENPP1, FH, CYP2E1, HPGDS, ADCY9, NDUFA5, ADH1Band PYGB were correlated with the underlying mechanisms of metabolic reprogramming in OCprogression(17). Yang et al. found that CCNB2, TYMS, KIF11, KIF4A, BIRC5, BUB1B, FOXM1, and CDC20might be potential therapeutic targets for OC patients(18). Nevertheless, it is still unclear as to whetherthese hub genes are uniquely involved in individual disease progression or not.
To determine potentially molecular mechanisms between PCOS and OC, we integrated two datasets,including PCOS and OC. Utilizing multiple bioinformatic and experimental analysis, we hence sought tovalidate hub genes and pathway of interest, and to search for potential therapeutic drugs or targets inPCOS and OC.
Materials And MethodsData extraction
TCGA database(12) (https://portal.gdc.cancer.gov/) is the largest cancer gene information database, andit includes data concerning gene expression. We extracted data for 374 cases of patients with OSC.Moreover, we downloaded level three FPKM data for subsequent analysis. The transcriptome RNA-sequencing and clinical information of 88 normal ovarian samples were extracted from the GTEX

Page 5/21
database (https://www.gtexportal.org/)(19). Furthermore, the GSE140082 and GSE34526 dataset wasdownloaded from GEO database(13).
Functional enrichment analyses
The functional enrichment analyses was also performed as previously published(17).
PPI network construction
GeneMANIA (http://genemania.org)(20) was used to construct the PPI network for 128 DEGs.
Establishing prognostic indicators based on DEGs
Univariate Cox analysis was used to select genes associated with prognosis, and prognostic correlationmodel was further constructed. After incorporating the expression value of each speci�c gene, a riskscore formula was constructed for each patient. According to the risk score formula, patients weredivided into low-risk group and high-risk group, with the median risk score as the cut-off point. Kaplan-meier analysis was used to evaluate the survival difference between the two groups, and log-rankstatistical method was used to compare. Finally, receiver operating characteristic (ROC) curve was usedto study the accuracy of model prediction.
Protein expression of OGN by bioinformatic analysis
The protein expression of OGN in OC was con�rmed by HPA database (https://www.proteinatlas.org/)(21) and CPTAC database (https://cptac-data-portal.georgetown.edu/)(22).
The Relationship of key Genes and Immune in�ltration
The correlation between immune cell content and the level of 5 key genes (JCHAIN, CXCL11, OGN, STAT1,and GALNT6) was con�rmed by TIMER database (https://cistrome.shinyapps.io/timer/)(23).
The GSVA and GSEA analysis
Gene set variation analysis (GSVA) is a nonparametric and unsupervised method for assessing theenrichment of transcriptome gene sets. GSVA converts gene-level changes into pathway-level changes bycomprehensively scoring the sets of genes of interest to judge the biological function of the samples. Inthis study, gene sets will be downloaded from The Molecular Signatures Database (v7.0), and each geneset will be comprehensively scored by GSVA algorithm to evaluate the potential biological functionchanges of different samples.
GSEA analysis uses a prede�ned set of genes, sequencing genes according to how differentiallyexpressed they are in the two types of samples, and then testing whether the prede�ned set of genes isenriched at the top or bottom of the sequencing table. In this study, the possible molecular mechanism ofthe difference in prognosis of different patients in ovarian cancer was explored by comparing the

Page 6/21
difference in signal pathways between the high-expression group and the low-expression group of GSEA,in which the number of replacements was set to 1000 and the replacement type to phenotype.
Cell culture and transfection
Human ovarian cancer cell line (SKOV3 and KGN) were bought from the American Type Culture Collection(ATCC, VA, USA). Dulbecco’s Modi�ed Eagle’s Medium (DMEM) containing 10% (v/v) fetal bovine serum(FBS; Gibco, Invitrogen, Carlsbad, CA, USA) and 1% penicillin/streptomycin (GIBCO, CA, USA,) growthmedia was used for SKOV3 and KGN cell culture. All cells were incubated at 37°C and 5% CO2. The over-expressed OGN and empty vector plasmids were purchased from GeneCopoeia Biotechnology(GeneCopoeia Biotechnology, MD, USA). For transient cell transfection, SKOV3 and KGN cells were seededin 6-wll plates for 24 hours. After incubation, cells were transfected with 3 μg empty vector and 3 μg over-expressed OGN plasmid using Lipfectamine 3000 (Invitrogen, Carlsbad, CA, USA) according to theprotocol to establish a cell line with upregulated OGN expression.
qRT-PCR analysis
Total RNA was extracted by TRIzol (Invitrogen, CA, USA) according to the manufacturer’s instructions.cDNA was produced by reverse transcription kit (TaKaRa, Dalian, China). PCR were carried out in ABI7500 fast system (Applied Biosystems, CA, USA). Primer sequences were as follows: OGN Forward: 5´-TCTACACTTCTCCTGTTACTGCT-3´, OGN Reverse: 5´-GAGGTAATGGTGTTAT TGCCTCA-3´;
Immuno�uorescence
The immuno�uorescence assays were performed with anti-FSHR (Abcam, 1:300) according to theprotocol. The primary antibodies used in this study were against FSHR (ab113421). Incubated with thecorresponding FITC conjugated secondary antibodies (Abcam, 1:200). Two hours later, 0.1%DAPI stainedthe nucleus for 30 minutes. Images were detected by confocal microscopy (Leica, Jena, Germany).
Statistical analysis
All statistical analyses were performed in the R language (Version 3.6). All statistical tests were bilateral,and P < 0.05 was statistically signi�cant
ResultsIdenti�cation of common 128 signi�cant differentially expressed genes DEGs in PCOS and OC
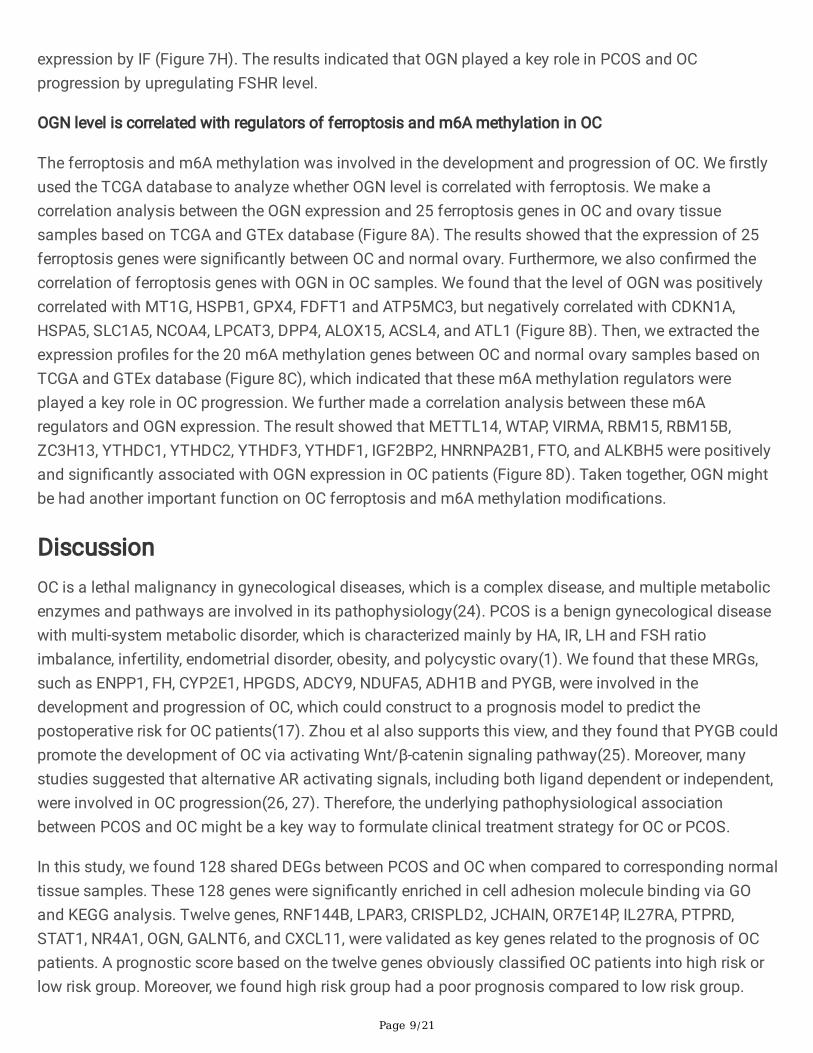
Firstly, we found 1061 DEGs in the PCOS patients compared to normal women based on GSE34526dataset of GEO database, and 2254 DEGs in the OC patient samples compared to normal ovary samplesbased on OC dataset of TCGA database (Figure1 A&B). Moreover, we found that there were 128 commonDEGs in PCOS and OC progression (Figure1 C). We also constructed the protein–protein interactions (PPI)network to identify all of 120 genes in the dataset of PCOS and OC, which were visualized by GeneMANIA

Page 7/21
database (Figure1 D), which indicated that these genes have closely interactions. The PCA analysisfound that these DEGs expression could well discriminates between ovarian cancer (blue) and normal(red) (Figure1 E). We extracted GO and KEGG pathway data for these genes based on DAVID database. Inthe term of GO enrichment, these genes were enriched in cell adhesion molecule binding, actin binding,cadherin binding, actin �lament binding, cell-substrate junction, cell-substrate adherens junction, focaladhesion, collagen-containing extracellular matrix, antigen processing and presentation, and so on(Figure1 F). In the term of KEGG enrichment, these genes were enriched in cell adhesion molecules,staphylococcus aureus infection, hematopoietic cell lineage, viral myocarditis, and Asthma (Figure1 G). Insummary, these results indicated that common DEGs highlighted the signi�cant role of cell adhesion inthe relationship between PCOS and OC.
Evaluation of clinical outcomes in OC based on the common 128 DEGs
The common 128 DEGs were used to analyse the prognosis in OC patients by the univariate Cox method.A number of twelve key genes were closely associated to the prognosis of OC patients, includingRNF144B, LPAR3, CRISPLD2, JCHAIN, OR7E14P, IL27RA, PTPRD, STAT1, NR4A1, OGN, GALNT6 andCXCL11 (Figure 2A). Then, we used these expression pro�le to construct the prognosis model, and therisk score formula was as follow: Risk score = RNF144B*(-0.1441) + LPAR3*(-0.0187) +CRISPLD2*0.0701 + IL27RA*0.2226 + PTPRD*0.0055 + STAT1*(-0.0988) + NR4A1*0.0369 + OGN*0.0590+ GALNT6*(-0.0718) + CXCL11*(-0.0886). Next, we could divide these OC patients into high risk and lowrisk group with the median risk score based on the risk score formula (Figure 2B).
The survival score and status of the two groups in the training cohort based on TCGA database OCdatasets were shown in Figure 3A&B. These twelve key genes expression pro�les were shown by theheatmap (Figure 3C). Moreover, we used the GSE140082 dataset as a test cohort to validate the risk scoreformula, which survival score and status of high risk and low risk group were shown in Figure 3D&E.These key genes expression �les in GSE140082 datasets was also visualization by the heatmap (Figure3F).
In the training cohort, the survival time and rate were signi�cantly decreased with the risk score increased(Figure 4A). The AUC at 1, 2, and 3 years under the ROC curve were 0.571, 0.607, and 0.554, respectively,indicating that a moderate incubation period could be utilized as a prognostic marker of twelve key genesexpression pro�les in survival monitoring (Figure 4B). However, t-SNE analysis showed that OC patients indifferent risk groups were not distributed in two group based on TCGA database, which suggested thatthe 12 signatures could not be an excellent subtype marker (Figure 4C). To validate the e�ciency of theprognosis model constructed from the TCGA-OC cohort, we used the median value of training cohort todivide the OC patients into high risk and low risk group based on the GSE140082 cohort. Similar to theresults of training cohort, OC patients with high risk had a poor prognosis compared to other OC patientsin the low risk group (Figure 4D). The AUC value in 1, 2, and 3 years were 0.617, 0.682, and 0.651 in thetest cohort (Figure 4E). The t-SNE analysis was also similar to the training cohort (Figure 4F).
The ectopic expression and prognosis signi�cance of 12 signatures in OC patients

Page 8/21
Next, we used the boxplot to visualize the mRNA level of 12 signatures in OC samples, which indicatedthat LPAR3, JCHAIN, IL27RA, GALNT6, CXCL11, RNF144B, STAT1, OR7E14P were signi�cantly increasedin OC patients, but CRISPLD2, PTPRD, OGN, NR4A1 were obviously decreased in patients with OC (Figure5A). We also con�rmed the overall survival rate of 12 signatures in OC patients based on TCGA database,suggesting that OGN was signi�cantly and negatively correlated with OC patient’s prognosis, but JCHAIN,GALNT6, CXCL11, STAT1 were signi�cantly and positively correlated with prognosis in OC patients(Figure 5B). These results suggested that JCHAIN, GALNT6, CXCL11, STAT1, and OGN might play a keyrole in the progression of OC patients.
The DNA alteration and immune in�ltration of 5 key genes in OC progression
We found the 5 genes were genetically altered, such as missense mutation, ampli�cation and deepdeletion (Figure 6A). The CNV of JCHAIN was signi�cantly correlated with CD8+ T cell, Neutrophil, andDendritic cell. CXCL11 CNV was closely associated with CD8+ T cell, CD4+ T cell, Neutrophil, andDendritic cell. The CNV level of OGN was markedly related to Macrophage. STAT1 CNV level had a closelyrelationship with CD8+ T cell and Dendritic cell. The CNV of GALNT6 was signi�cantly associated with Bcell, CD8+ T cell and CD4+ T cell (Figure 6B). Furthermore, we found the mRNA expression of GALNT6was not obviously correlated with immune in�ltration in any immune cell types. JCHAIN level was closelyassociated with purity, CD8+ T cell, CD4+ T cell, Neutrophil, and Dendritic cell. CXCL11 expression wascorrelated with the in�ltration of purity, B cell, CD8+ T cell, CD4+ T cell, Neutrophil, and Dendritic cell. OGNlevel was signi�cantly correlated with purity. STAT1 mRNA level had a closely relationship with purity,CD8+ T cell, Neutrophil, and Dendritic cell (Figure 6C). Taken together, the expression and alteration ofthese 5 key genes was involved in the immune in�ltration progression of OC.
The drug sensitivity of hub gene
We further used the drug sensitivity analysis to con�rm these 5 key genes. The result showed that OGNwas closely correlated with chemotherapy resistance based on GSCALite database (SupplementaryFigures S1). Therefore, targeting OGN could be a potential target in the treatment of patients with OC orPCOS.
The characteristics of OGN in OC and PCOS
For elucidate the expression, function and structure of OGN, we used the PDB databased to con�rm theOGN structure, as shown in Figure 7A. The OGN has an LRR_8 domain and multiple phosphorylation,acetylation and N-linked glycosylation site. The protein expression was signi�cantly decreased in OCtissues samples compare to normal ovary samples (Figure 7B&C). We further utilized GSVA and GSEAanalysis to predict the potential function of OGN, as shown in Figure 7D&E. OGN might be involved in theprogression of steroid hormone biosynthesis and steroid hormone response. Furthermore, we found thelevel of OGN was signi�cantly and positively correlated with the level of FSHR in OC (Figure 7F). Weoverexpressed OGN in KGN and SKOV3 cell lines (Figure 7G), and con�rmed the effect of OGN on FSHR
Page 9/21
expression by IF (Figure 7H). The results indicated that OGN played a key role in PCOS and OCprogression by upregulating FSHR level.
OGN level is correlated with regulators of ferroptosis and m6A methylation in OC
The ferroptosis and m6A methylation was involved in the development and progression of OC. We �rstlyused the TCGA database to analyze whether OGN level is correlated with ferroptosis. We make acorrelation analysis between the OGN expression and 25 ferroptosis genes in OC and ovary tissuesamples based on TCGA and GTEx database (Figure 8A). The results showed that the expression of 25ferroptosis genes were signi�cantly between OC and normal ovary. Furthermore, we also con�rmed thecorrelation of ferroptosis genes with OGN in OC samples. We found that the level of OGN was positivelycorrelated with MT1G, HSPB1, GPX4, FDFT1 and ATP5MC3, but negatively correlated with CDKN1A,HSPA5, SLC1A5, NCOA4, LPCAT3, DPP4, ALOX15, ACSL4, and ATL1 (Figure 8B). Then, we extracted theexpression pro�les for the 20 m6A methylation genes between OC and normal ovary samples based onTCGA and GTEx database (Figure 8C), which indicated that these m6A methylation regulators wereplayed a key role in OC progression. We further made a correlation analysis between these m6Aregulators and OGN expression. The result showed that METTL14, WTAP, VIRMA, RBM15, RBM15B,ZC3H13, YTHDC1, YTHDC2, YTHDF3, YTHDF1, IGF2BP2, HNRNPA2B1, FTO, and ALKBH5 were positivelyand signi�cantly associated with OGN expression in OC patients (Figure 8D). Taken together, OGN mightbe had another important function on OC ferroptosis and m6A methylation modi�cations.
DiscussionOC is a lethal malignancy in gynecological diseases, which is a complex disease, and multiple metabolicenzymes and pathways are involved in its pathophysiology(24). PCOS is a benign gynecological diseasewith multi-system metabolic disorder, which is characterized mainly by HA, IR, LH and FSH ratioimbalance, infertility, endometrial disorder, obesity, and polycystic ovary(1). We found that these MRGs,such as ENPP1, FH, CYP2E1, HPGDS, ADCY9, NDUFA5, ADH1B and PYGB, were involved in thedevelopment and progression of OC, which could construct to a prognosis model to predict thepostoperative risk for OC patients(17). Zhou et al also supports this view, and they found that PYGB couldpromote the development of OC via activating Wnt/β-catenin signaling pathway(25). Moreover, manystudies suggested that alternative AR activating signals, including both ligand dependent or independent,were involved in OC progression(26, 27). Therefore, the underlying pathophysiological associationbetween PCOS and OC might be a key way to formulate clinical treatment strategy for OC or PCOS.
In this study, we found 128 shared DEGs between PCOS and OC when compared to corresponding normaltissue samples. These 128 genes were signi�cantly enriched in cell adhesion molecule binding via GOand KEGG analysis. Twelve genes, RNF144B, LPAR3, CRISPLD2, JCHAIN, OR7E14P, IL27RA, PTPRD,STAT1, NR4A1, OGN, GALNT6, and CXCL11, were validated as key genes related to the prognosis of OCpatients. A prognostic score based on the twelve genes obviously classi�ed OC patients into high risk orlow risk group. Moreover, we found high risk group had a poor prognosis compared to low risk group.

Page 10/21
Given the underlying molecular mechanisms of these MRGs, studies on the functions and mechanismsof RNF144B, JCHAIN, OR7E14P, IL27RA, PTPRD, and OGN have not been con�rmed in OC progression.But another six genes have been elucidated in OC development, namely, LPAR3, CRISPLD2, STAT1,NR4A1, GALNT6, and CXCL11. The expression of LPAR3 is signi�cantly increased in OC tissue samplescompared to normal ovary tissue samples, which might play a role in carcinogenesis of ovariancancer(28). High expression of CRISPLD2 was correlated with the worse prognosis in OC patients(29).High levels of STAT1 was associated with the improved prognosis in OC patients, which might be usingfor the development of new immunomodulator drugs to OC treatment(30). Ectopic expression of NR4A1protein was signi�cantly correlated with poor prognosis in patients with OC(31), which could modulateplatinum resistance in OC(32). GALNT6 could modify O-glycans on EGFR to increase its activation, whichwas able to signi�cantly enhance the OC cell viability, migration, and invasion(33). Many studiesindicated that CXCL11 could promote the OC progression via mediating angiogenesis(34), lymph nodemetastasis(35), and immune in�ltration(36, 37). Moreover, we found RNF144B, JCHAIN, OR7E14P,IL27RA, PTPRD, OGN, CRISPLD2, and GALNT6 have not been con�rmed in PCOS progression. STAT1could co-interact with CD44-OPN adhesion complex, ERα, and NF-κB to formulate a signi�cant crosstalk,resulting in modulating endometrial receptivity(38). Insulin could enhance the expression of STAT1 andSTAT3 to repress the level of miR-27a-3p which could decrease granule cells proliferation ability andapoptosis escaping ability(39). High level of androgen could mediate a series of important genes,including TFAP2A, ETS1, ELK1, ERG, FLI1 and SPI1, to increase the level of NR4A1 in PCOS(40). CXCL11expression was signi�cantly and obviously correlated with Prolactin and 17-OH-progesterone level inPCOS(41). Based on previous studies and our study, we were able to obtain only limited informationabout the 12 key genes involved in OC patient survival and in PCOS patients pathophysiological change.
To seek e�cient therapeutic agents for the treatment of OC and PCOS, we further screened these 12 keygenes by expression, survival signi�cance, immune in�ltration, and drug sensitivity. Osteoglycin (OGN), asmall proteoglycan with tandem leucine-rich repeats (LRR), is overexpressed in blood vessels and bone,mediating bone formation mediating by transforming growth factor beta(42). The function of OGN isinvolved in the progression of extracellular matrix and remodeling and tissue development(42, 43). KatjaHummitzsch et al found that the expression of OGN mRNA was signi�cantly upregulated in ovary thecainternal compared to stroma(44). Hao and his colleagues further found that OGN protein expression wasmarkedly associated with signaling pathway related to follicular development, especially in estrogen,insulin, and PI3K-Akt signaling pathway(45). We found that OGN mRNA and protein expression weresigni�cantly decreased in OC/PCOS compared to normal ovary tissues or granule cells from woman withnon-PCOS. Taken together, these results indicated OGN might be a signi�cant factor in the progression ofOC and PCOS. Furthermore, our GSVA and GSEA analysis showed that highly expressed OGN could alsoenhance steroid hormone biosynthesis, and correlation analysis indicated that OGN was signi�cantlyassociated with the level of FSHR. Many studies have been indicated that FSHR was a signi�cantoncogene in OC development, which could mediate the cell proliferation(46, 47), metastasis(48), andapoptosis escaping(49). Moreover, the FSHR level was signi�cantly decreased in PCOS granulosa cellscompared to normal granulosa cells(50). FSHR is critical for FSH mediated follicle growth and

Page 11/21
development, and the decrease of FSH/FSHR pathway might be induce the follicular growth arrest,promoting the progression of PCOS(51, 52). Therefore, OGN might upregulate the FSHR to sensitize thesteroid hormone response, which could accelerate the OC formation and progression, but reverse theprogression of PCOS. The low expression of OGN is an important feature from PCOS to OC, indicatingthat the PCOS patient with low level of OGN may has the greater OC risk. The aberrant activation of OGNhas been associated with high tumor invasiveness and poor prognosis in the OC patients(53). Moreover,the function of OGN in OC progression is closely related with m6A modi�cation and ferroptosis. Insummary, we infer that OGN might be a new risk marker for PCOS to OC, although this assumption needsto be veri�ed in further studies.
ConclusionsIn conclusion, this study provided evidence about the association between PCOS and OC. Through thefunctional analysis of identi�ed DEGs, we found that cell adhesion was signi�cantly enriched in PCOSand OC datasets. We also con�rmed 12 key genes to construct the prognosis model, which divide OCpatients into high risk and low risk group for the prognosis prediction. Moreover, we found OGN might bea key biomarker, indicating the greater OC risk for PCOS patients. Nevertheless, further experimentalveri�cation is required.
Abbreviationspolycystic ovary syndrome (PCOS), hyperandrogenemia (HA), insulin resistance (IR), luteinizing hormone(LH), follicle-stimulating hormone (FSH), ovarian cancer (OC), The Cancer Genome Atlas (TCGA), GeneExpression Omnibus (GEO), endometrial cancer (EC), breast cancer (BC), metabolism related genes(MRGs), protein–protein interactions (PPI), Osteoglycin (OGN)
DeclarationsEthics approval and consent to participate
Not applicable.
Consent for publication
Not applicable.
Availability of data and material
The data used to support the �ndings of this study are available from the corresponding author uponrequest
Competing interests

Page 12/21
The authors declare that they have no competing interests
Funding
The present study was supported by the Hunan Provincial Health Commission 2019 Annual Scienti�cResearch (Grant No. C2019098).
Authors’ contributions
Conception and design: Yukun Li, Juan Zou and Nianchun Liao. Collection and assembly of data: JueLiu, Qunfeng Zhang, and Jiao Xiao. Data analysis and interpretation: Yanhua Chen, Mengjie Wang, KexinChen, and Min Luo. Manuscript writing: Yukun Li and Juan Zou. Paper revision: Juan Zeng andZhongcheng Mo. Final approval of manuscript: all authors.
Acknowledgements
Not applicable.
Figures
Page 13/21
Figure 1
Identi�cation of the DEGs associated PCOS and OC. A. The DEGs in PCOS based on GSE34526 datasets.B. The DEGs in OC based on TCGA-OC datasets. C. The common DEGs in PCOS and OC. D. The PPInetwork of 128 common DEGs in PCOS and OC. E. The PCA analysis between OC patient samples (TCGA-OC dataset) and normal ovary samples (GTEx-ovary datasets) based on 128 DEGs. F. The GO functionalenrichment analysis for 128 DEGs. G. The KEGG enrichment analysis for 128 DEGs.

Page 14/21
Figure 2
Key genes prognostic values. A. Prognostic values of 12 genes via forest plot. B. Prognostic signaturesconstruction by lasso Cox analysis.

Page 15/21
Figure 3
12 prognostic index of OC patients. A. The PI distribution of patients in the training dataset. B. Thesurvival of OC patients in the training dataset. C. The expression pro�les of 12 key genes in trainingdataset. D The PI distribution of patients in the test dataset. E. The survival of OC patients in the testdataset. F. The expression pro�les of 12 key genes in test dataset.

Page 16/21
Figure 4
Prognostic analysis of the 12-gene signature model in the training cohort and test cohort. A. Kaplan-Meiercurves for OS of patients with high or low risk groups in the training cohort. B. AUC time-dependent ROCcurves for OS in the training cohort. C. t-SNE analysis for OS in the training cohort. D. Kaplan-Meier curvesfor OS of patients with high or low risk groups in the test cohort. E. AUC time-dependent ROC curves forOS in the test cohort. F. t-SNE analysis for OS in the test cohort.

Page 17/21
Figure 5
The expression and prognosis signi�cance of 12 signatures. A. The mRNA expression of 12 signaturesbased on TCGA database. B. The prognosis signi�cance of 12 signatures based on TCGA database.

Page 18/21
Figure 6
The DNA alteration and immune in�ltration of 5 key genes. A. The DNA alteration of 5 key genes. B. TheCNV affecting the distribution for the 5 genes. C. The cancer purity and immune in�ltration for 5 genes.

Page 19/21
Figure 7
The structure, expression and function of OGN. A. The Structure of OGN. B. The OGN protein expressionin OC based on CPTAC database. C. The OGN protein expression in OC based on HPA database. D. GSVAanalysis for OGN. E. GSEA analysis for OGN. F. The correlation analysis for OGN and FSHR in TCGA-OCdataset. G. The mRNA levels between vector and OGN overexpression of KGN and SKOV3 cells. H. Theeffect of OGN on FSHR tested by immuno�uorescence.

Page 20/21
Figure 8
Association of OGN level with ferroptosis and m6A methylation related genes in OC. A. The ferroptosisgenes expression in OC with high or low level OGN and normal ovary. B. The ferroptosis genes expressionin OC with high or low level OGN. C. The m6A methylation genes expression in OC with high or low levelOGN and normal ovary. D. The m6A methylation genes expression in OC with high or low level OGN.

Page 21/21
Supplementary Files
This is a list of supplementary �les associated with this preprint. Click to download.
CTRP.png