cancer prevention and early detection facts and …...2 cancer prevention & early detection...
TRANSCRIPT
AL
AZAR
CA CO
CT
DE
FL
GA
PR
ID
IL IN
IA
KSKY
LA
ME
MD
MA
MN
MS
MO
MT
NENV
NH
NJ
NM
NY
NC
ND
OH
OK
OR
PA
RI
SC
SD
TN
TX
UT
VT
VA
WA
WV
WIWY
DC
HI
AK
MI
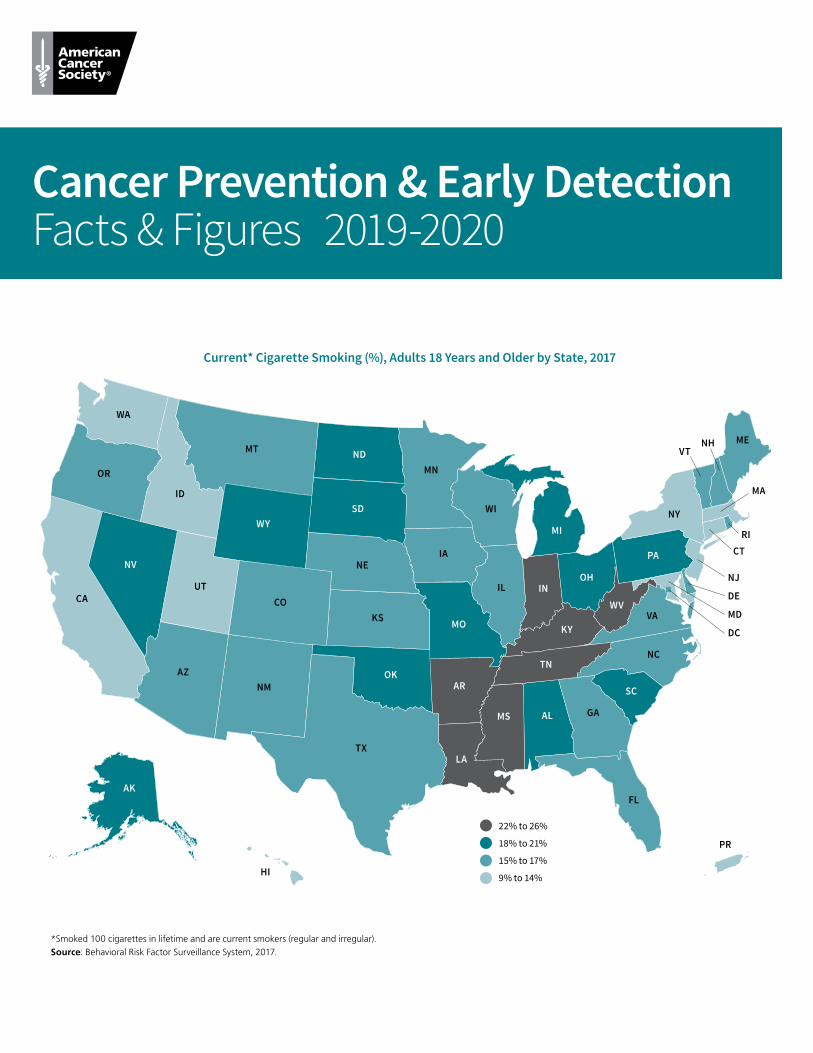
*Smoked 100 cigarettes in lifetime and are current smokers (regular and irregular).Source: Behavioral Risk Factor Surveillance System, 2017.
Current* Cigarette Smoking (%), Adults 18 Years and Older by State, 2017
22% to 26%
18% to 21%
15% to 17%
9% to 14%
Cancer Prevention & Early DetectionFacts & Figures 2019-2020
ContentsIntroduction 1
References 1
Highlights, CPED 2019-2020 1
Tobacco 2
Cigarette Smoking 2
Other Combustible Tobacco Products 3
E-cigarettes (Vaping Devices) 4
Smokeless Tobacco Products 7
Secondhand Smoke 7
Tobacco Cessation 8
Reducing Tobacco Use and Exposure 9
References 12
Excess Body Weight, Alcohol, Diet, and Physical Activity 14
Excess Body Weight 14
Alcohol 16
Diet 18
Physical Activity 21
Type 2 Diabetes 22
Community Action 22
References 25
Ultraviolet Radiation 27
Solar UVR Exposure 27
Artificial UVR Exposure (Indoor Tanning) 27
UVR Exposure and Protective Behaviors 28
Prevention Strategies in Skin Cancer 29
Early Detection of Skin Cancer 30
References 31
Infectious Agents 32
Human Papillomavirus 32
Helicobacter Pylori 34
Hepatitis B Virus 35
Hepatitis C Virus 37
Human Immunodeficiency Virus 38
Epstein-Barr Virus 38
References 38
Occupational and Environmental Cancer Risk Factors 40
Occupational Cancer Risk Factors 41
Environmental Cancer Risk Factors 41
Conclusions 44
References 44
Cancer Screening 45
Breast Cancer Screening 45
Cervical Cancer Screening 48
Colorectal Cancer Screening 50
Lung Cancer Screening 53
Prostate Cancer Screening 53
Endometrial Cancer Screening 54
Cancer Screening Obstacles and Opportunities to Improve Utilization 54
American Cancer Society Recommendations for the Early Detection of Cancer in Average-risk Asymptomatic People* 55
References 57
Special Notes 58
Glossary 58
Survey Sources 59
Global Headquarters: American Cancer Society Inc. 250 Williams Street, NW, Atlanta, GA 30303-1002
404-320-3333
©2019, American Cancer Society, Inc. All rights reserved, including the right to reproduce this publication
or portions thereof in any form.
For written permission, address the Legal department of the American Cancer Society, 250 Williams Street, NW,
Atlanta, GA 30303-1002.
This publication attempts to summarize current scientific information about cancer. Except when specified, it does not represent the official policy of the American Cancer Society.
Suggested citation: American Cancer Society. Cancer Prevention & Early Detection Facts & Figures 2019-2020. Atlanta: American Cancer Society; 2019.

Cancer Prevention & Early Detection Facts & Figures 2019-2020 1
IntroductionCancer prevention and early detection are central to the American Cancer Society’s mission to save lives, celebrate lives, and lead the fight for a world without cancer. Over the past several years, cancer incidence has decreased among men while remaining stable among women; cancer mortality has declined in recent decades.1 Additional cancer morbidity and mortality could be prevented by implementing evidence-based interventions to reduce cancer risk factors and increase cancer screening uptake.2 An estimated 42% of cancer cases and 45% of cancer deaths in the US are attributed to potentially
modifiable risk factors.3 Furthermore, cancer screening tests can prevent thousands of additional cancer cases and deaths.
References1. Siegel RL, Miller KD, Jemal A. Cancer Statistics, 2019. CA Cancer J Clin. 2019;69: 7-34.2. Siegel RL, Jemal A, Wender RC, Gansler T, Ma J, Brawley OW. An assessment of progress in cancer control. CA Cancer J Clin. 2018.3. Islami F, Goding Sauer A, Miller KD, et al. Proportion and number of cancer cases and deaths attributable to potentially modifiable risk factors in the United States. CA Cancer J Clin. 2018;68: 31-54.
Highlights, CPED 2019-2020Tobacco • In 1965, 42% of adults were current cigarette smokers,
decreasing to 14% in 2017. Prevalence varied widely by state, ranging from 9% in Utah to 26% in West Virginia.
• Current cigarette smoking among high school students declined from 29% in 1999 to 8% in 2018 and ranged from 4% in Utah and Puerto Rico to 14% in Arkansas, Kentucky, and West Viriginia in 2017.
• Unchanged since 2009, the federal excise tax is $1.01 per pack. As of December 21, 2018, the average state cigarette excise tax was $1.79 per pack, ranging from 17 cents in Missouri to $4.50 in the District of Columbia and $5.10 in Puerto Rico.
• Among high school students, current e-cigarette use increased from about 2% in 2011 to 21% in 2018.
Excess Body Weight, Alcohol, Diet, and Physical Activity• Among adults, the prevalence of overweight has remained
relatively stable since the early 1960s, but obesity has markedly increased. In 2015-2016, approximately 7 in 10 adults were overweight or obese; about 4 in 10 were obese.
• From 1971 to 2002, the prevalence of obesity among youth ages 2-19 years tripled from 5% to 15%, increasing to 19% in 2015-2016. Among youth, the prevalence of obesity was higher in older (ages 12-19 years: 21%) than younger (ages 2-5 years: 14%) children in 2015-2016.
• In 2017, approximately 6% of adults reported drinking heavily (>14 drinks per week for males or >7 drinks per week for females).
• In 2017, an estimated 54% of adults and only 26% of high school students reported meeting recommended levels of physical activity.
Ultraviolet Radiation• Despite declining use in recent years, 8% of female high school
students in 2017 reported use of indoor tanning in the past year.
• As of January 1, 2019, only 17 states and the District of Columbia had a law prohibiting indoor tanning for minors without exemptions.
• In 2015, approximately 4% of adults reported using an indoor tanning device in the past year; use was highest among women, younger adults (ages 18-29 years), and those living in the Midwest.
Infectious Agents• HPV vaccination among adolescents remains low. In 2017,
42% of girls and 31% of boys received two doses before their 13th birthday.
• In 2017, 53% of girls and 44% of boys ages 13-17 years were up-to-date.
Cancer Screening• In 2015, 50% of women ages 40 years and older reported
having a mammogram within the past year, and 64% reported having one within the past two years. Mammography use in the past two years was lowest among the uninsured (31%).
• Among women ages 21-65 years, 83% were up-to-date with cervical cancer screening in 2015; uptake was lowest among the uninsured (64%) and recent immigrants (70%).
• In 2015, 63% of adults ages 50 years and older were up-to-date for colorectal cancer screening. Prevalence was less than or equal to 50% among Hispanics, Asians, people with less than a high school diploma, recent immigrants, and the uninsured.
• In 2015, only 4% of eligible former and current smokers reported having a low-dose computed tomography screening for lung cancer in the past year.

2 Cancer Prevention & Early Detection Facts & Figures 2019-2020
TobaccoThe first US Surgeon General’s Report on Smoking and Health in 1964 concluded that cigarette smoking caused lung cancer.1 Since then, other tobacco products, including cigars, cigarillos, waterpipes, and smokeless tobacco, have been causally linked to cancer as well.2 About 30% of all cancer deaths in the US3, 4 and as much as 40% in men in some Southern states, are still caused by smoking.5 Despite decades of declining smoking prevalence, the burden of smoking-related cancers remains high because the risk of cancer exists even after exposure has ceased. Additionally, smoking prevalence remains high in many segments of the population (e.g., those with low socioeconomic status and/or mental illness).6 Tobacco use remains the most preventable cause of death in the US.
Cigarette SmokingCigarette smoking increases the risk of several cancers, including those of the oral cavity and pharynx, larynx, lung, esophagus, pancreas, uterine cervix, kidney, bladder, stomach, colorectum, liver; and acute myeloid leukemia.2 Evidence suggests that smoking may also increase the risk of fatal prostate cancer and a rare type of ovarian cancer.2, 7 The proportion of cases and deaths attributable to smoking varies across cancer sites (Figure 1A).4 Health consequences increase with both duration and intensity of smoking.
Tobacco use in youth is an important public health issue because almost 90% of adults who smoke regularly began smoking before the age of 18; adolescents appear to be more easily addicted to nicotine.8
Adult Cigarette Smoking • The prevalence of current smoking among adults
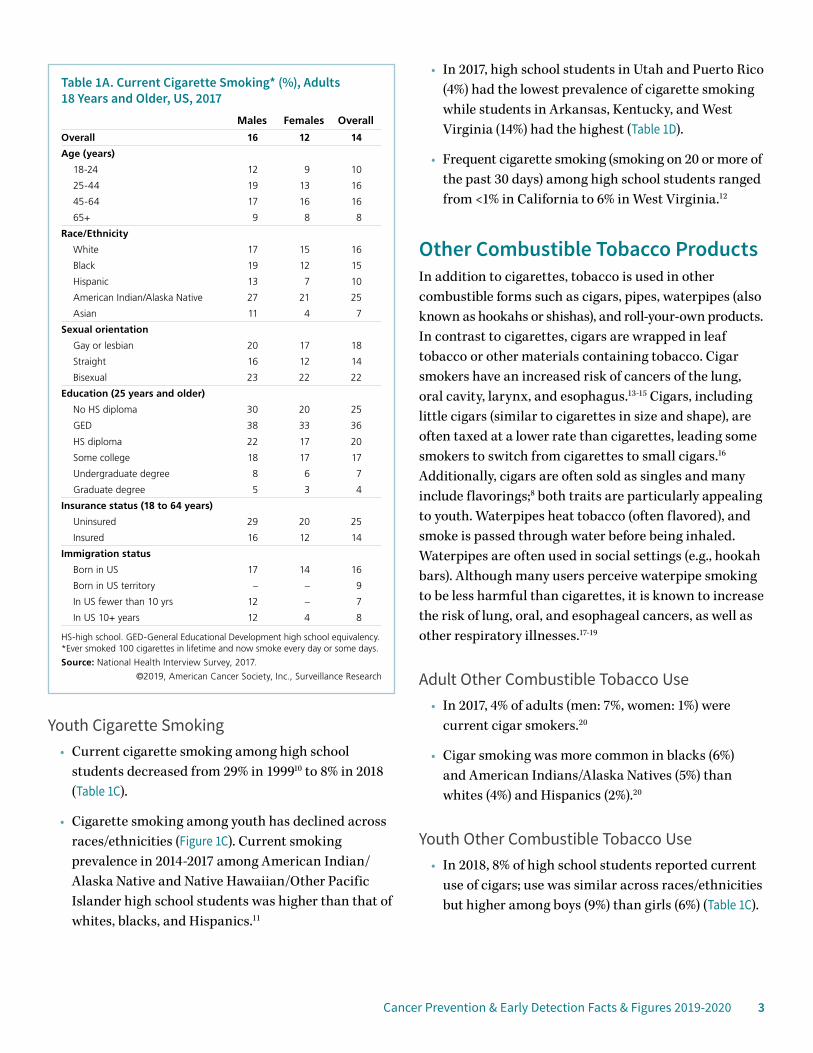
decreased from 42% in 1965 to 25% in 1997.9 In 2017, an estimated 14% (more than 34 million adults) were current smokers (Table 1A).
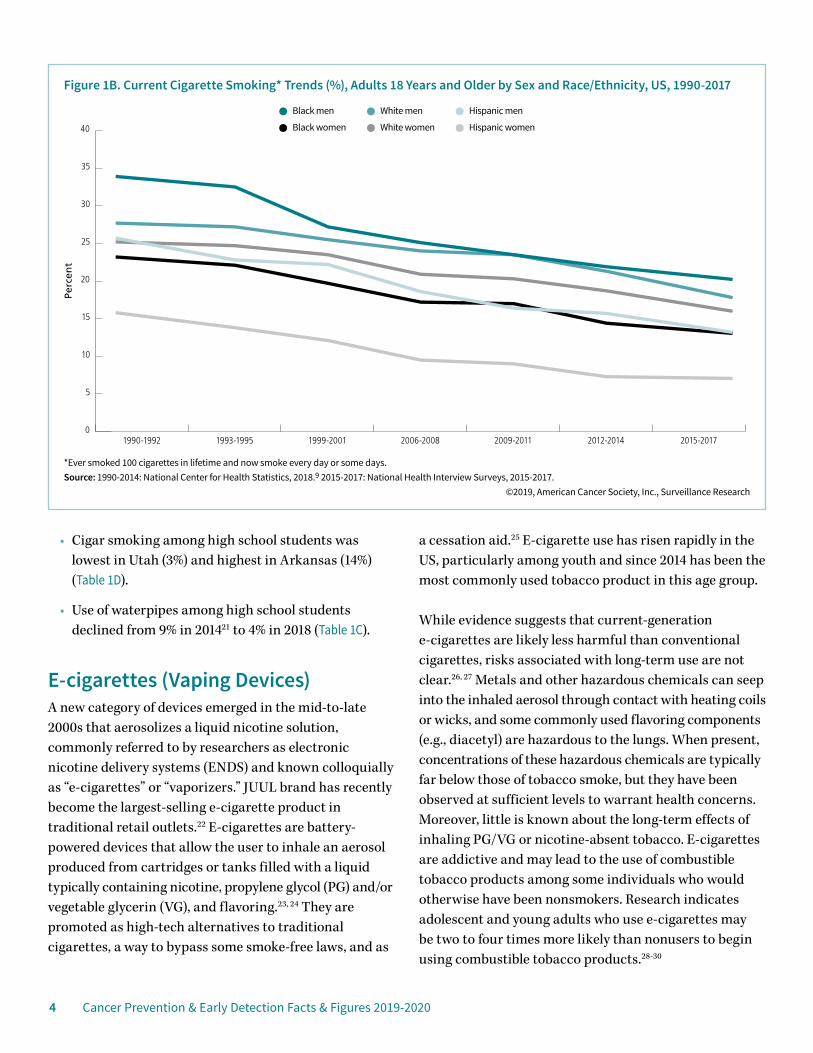
• Smoking prevalence has declined across races/ethnicities and in men and women, though substantial disparities remain (Figure 1B). In 2017,
smoking prevalence was lowest among Asians (7%) and highest among American Indians/Alaska Natives (25%), with the largest gender gap in blacks and Asians (Table 1A).
• Smoking prevalence in 2017 was lowest among those with a graduate degree (4%) and highest among adults with a GED (36%) (Table 1A).
• In 2017, smoking prevalence was lower among those who self-identified as straight (14%) than among people who self-identified as gay or lesbian (18%) or bisexual (22%) (Table 1A).
• By state, smoking prevalence was lowest in Utah (9%) and highest in West Virginia (26%) (Cover, Table 1B).
Source: Islami F et al, 2018.4
©2019 American Cancer Society, Surveillance Research
Percent
Figure 1A. Proportion of Cancer Cases and Deaths Attributable to Cigarette Smoking, Adults 30 Years and Older, US, 2014
82%81%
72%74%
50%50%
47%49%
47%45%
23%22%
20%20%
17%17%
17%17%
15%15%
12%11%
10%10%
Cases Deaths
0 20 40 60 80 100
Pancreas
Colorectum
Myeloid leukemia
Stomach
Kidney, renal pelvis,ureter
Cervix
Liver
Urinary bladder
Oral cavity, pharynx,nasal cavity,
paranasal sinus
Esophagus
Larynx
Lung
Cancer Prevention & Early Detection Facts & Figures 2019-2020 3
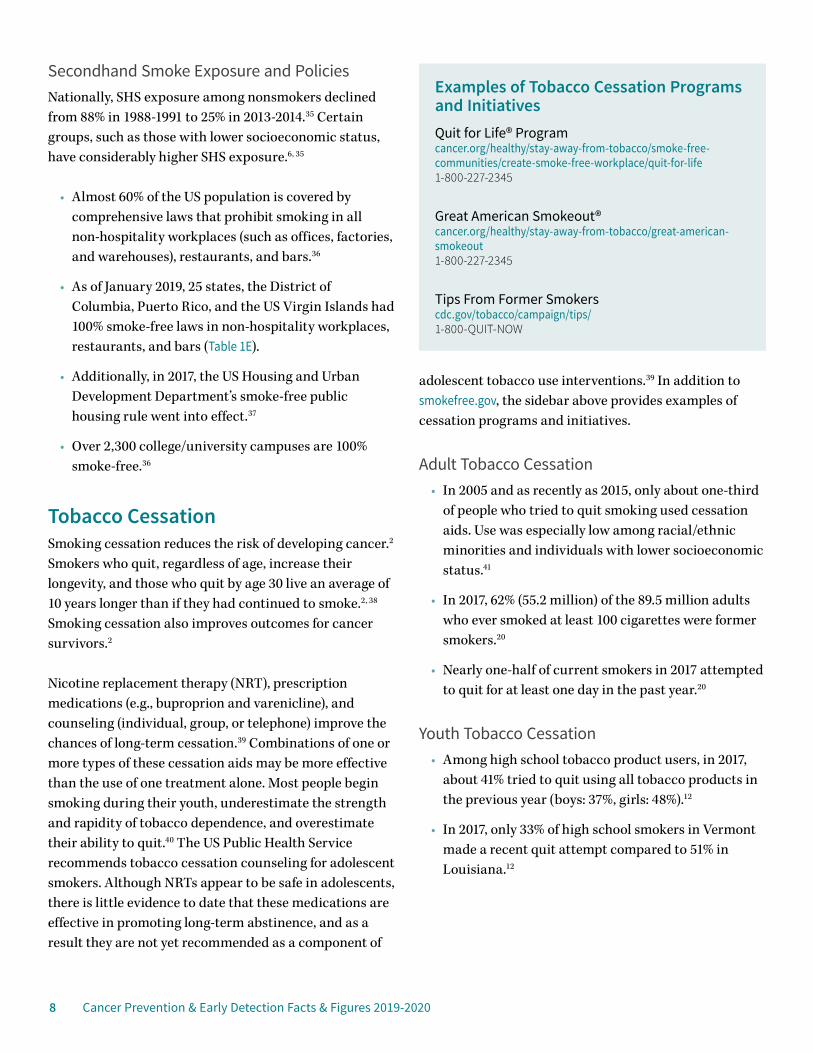
Youth Cigarette Smoking• Current cigarette smoking among high school
students decreased from 29% in 199910 to 8% in 2018 (Table 1C).
• Cigarette smoking among youth has declined across races/ethnicities (Figure 1C). Current smoking prevalence in 2014-2017 among American Indian/Alaska Native and Native Hawaiian/Other Pacific Islander high school students was higher than that of whites, blacks, and Hispanics.11
• In 2017, high school students in Utah and Puerto Rico (4%) had the lowest prevalence of cigarette smoking while students in Arkansas, Kentucky, and West Virginia (14%) had the highest (Table 1D).
• Frequent cigarette smoking (smoking on 20 or more of the past 30 days) among high school students ranged from <1% in California to 6% in West Virginia.12
Other Combustible Tobacco ProductsIn addition to cigarettes, tobacco is used in other combustible forms such as cigars, pipes, waterpipes (also known as hookahs or shishas), and roll-your-own products. In contrast to cigarettes, cigars are wrapped in leaf tobacco or other materials containing tobacco. Cigar smokers have an increased risk of cancers of the lung, oral cavity, larynx, and esophagus.13-15 Cigars, including little cigars (similar to cigarettes in size and shape), are often taxed at a lower rate than cigarettes, leading some smokers to switch from cigarettes to small cigars.16 Additionally, cigars are often sold as singles and many include flavorings;8 both traits are particularly appealing to youth. Waterpipes heat tobacco (often flavored), and smoke is passed through water before being inhaled. Waterpipes are often used in social settings (e.g., hookah bars). Although many users perceive waterpipe smoking to be less harmful than cigarettes, it is known to increase the risk of lung, oral, and esophageal cancers, as well as other respiratory illnesses.17-19
Adult Other Combustible Tobacco Use• In 2017, 4% of adults (men: 7%, women: 1%) were
current cigar smokers.20
• Cigar smoking was more common in blacks (6%) and American Indians/Alaska Natives (5%) than whites (4%) and Hispanics (2%).20
Youth Other Combustible Tobacco Use• In 2018, 8% of high school students reported current
use of cigars; use was similar across races/ethnicities but higher among boys (9%) than girls (6%) (Table 1C).
Table 1A. Current Cigarette Smoking* (%), Adults 18 Years and Older, US, 2017
Males Females Overall
Overall 16 12 14
Age (years)
18-24 12 9 10
25-44 19 13 16
45-64 17 16 16
65+ 9 8 8
Race/Ethnicity
White 17 15 16
Black 19 12 15
Hispanic 13 7 10
American Indian/Alaska Native 27 21 25
Asian 11 4 7
Sexual orientation
Gay or lesbian 20 17 18
Straight 16 12 14
Bisexual 23 22 22
Education (25 years and older)
No HS diploma 30 20 25
GED 38 33 36
HS diploma 22 17 20
Some college 18 17 17
Undergraduate degree 8 6 7
Graduate degree 5 3 4
Insurance status (18 to 64 years)
Uninsured 29 20 25
Insured 16 12 14
Immigration status
Born in US 17 14 16
Born in US territory – – 9
In US fewer than 10 yrs 12 – 7
In US 10+ years 12 4 8
HS-high school. GED-General Educational Development high school equivalency. *Ever smoked 100 cigarettes in lifetime and now smoke every day or some days.
Source: National Health Interview Survey, 2017.
©2019, American Cancer Society, Inc., Surveillance Research
4 Cancer Prevention & Early Detection Facts & Figures 2019-2020
• Cigar smoking among high school students was lowest in Utah (3%) and highest in Arkansas (14%) (Table 1D).
• Use of waterpipes among high school students declined from 9% in 201421 to 4% in 2018 (Table 1C).
E-cigarettes (Vaping Devices)A new category of devices emerged in the mid-to-late 2000s that aerosolizes a liquid nicotine solution, commonly referred to by researchers as electronic nicotine delivery systems (ENDS) and known colloquially as “e-cigarettes” or “vaporizers.” JUUL brand has recently become the largest-selling e-cigarette product in traditional retail outlets.22 E-cigarettes are battery-powered devices that allow the user to inhale an aerosol produced from cartridges or tanks filled with a liquid typically containing nicotine, propylene glycol (PG) and/or vegetable glycerin (VG), and flavoring.23, 24 They are promoted as high-tech alternatives to traditional cigarettes, a way to bypass some smoke-free laws, and as
a cessation aid.25 E-cigarette use has risen rapidly in the US, particularly among youth and since 2014 has been the most commonly used tobacco product in this age group.
While evidence suggests that current-generation e-cigarettes are likely less harmful than conventional cigarettes, risks associated with long-term use are not clear.26, 27 Metals and other hazardous chemicals can seep into the inhaled aerosol through contact with heating coils or wicks, and some commonly used flavoring components (e.g., diacetyl) are hazardous to the lungs. When present, concentrations of these hazardous chemicals are typically far below those of tobacco smoke, but they have been observed at sufficient levels to warrant health concerns. Moreover, little is known about the long-term effects of inhaling PG/VG or nicotine-absent tobacco. E-cigarettes are addictive and may lead to the use of combustible tobacco products among some individuals who would otherwise have been nonsmokers. Research indicates adolescent and young adults who use e-cigarettes may be two to four times more likely than nonusers to begin using combustible tobacco products.28-30
*Ever smoked 100 cigarettes in lifetime and now smoke every day or some days.Source: 1990-2014: National Center for Health Statistics, 2018.9 2015-2017: National Health Interview Surveys, 2015-2017.
©2019, American Cancer Society, Inc., Surveillance Research
Perc
ent
Figure 1B. Current Cigarette Smoking* Trends (%), Adults 18 Years and Older by Sex and Race/Ethnicity, US, 1990-2017
0
5
10
15
20
25
30
35
40
2015-20172012-20142009-20112006-20081999-20011993-19951990-1992
Black men White men Hispanic men
Black women White women Hispanic women
Cancer Prevention & Early Detection Facts & Figures 2019-2020 5
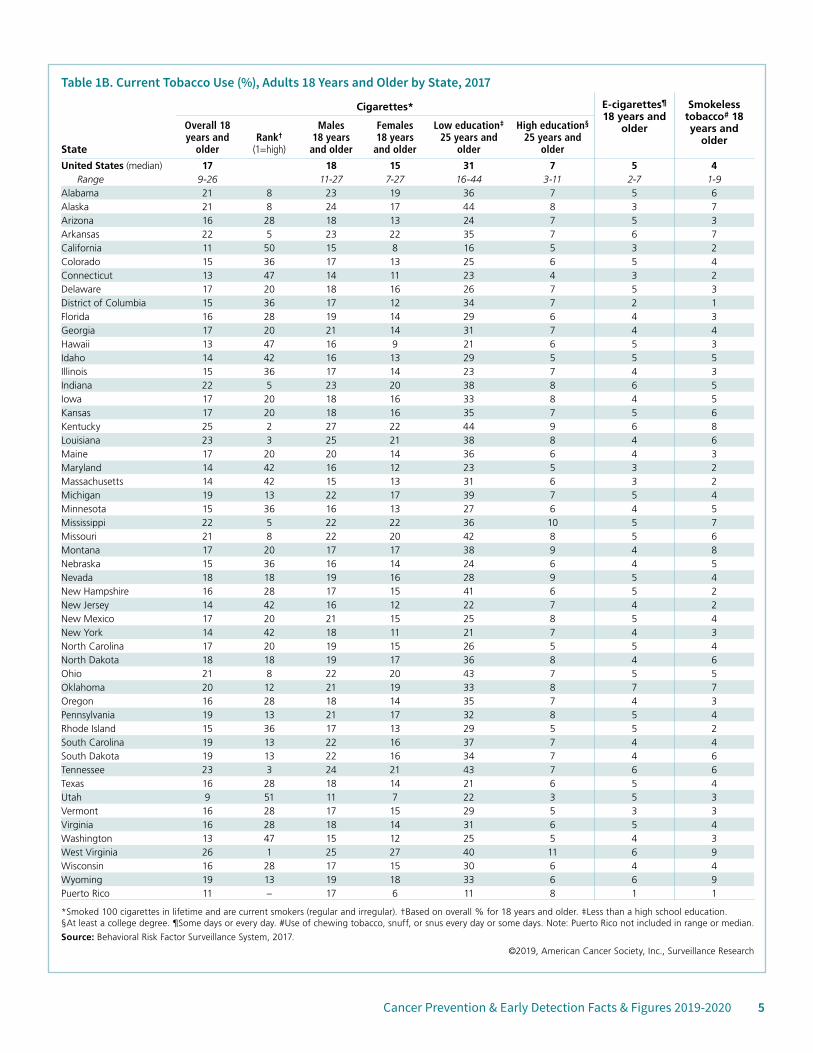
Table 1B. Current Tobacco Use (%), Adults 18 Years and Older by State, 2017
Cigarettes* E-cigarettes¶ 18 years and
older
Smokeless tobacco# 18 years and
olderState
Overall 18 years and
olderRank†
(1=high)
Males 18 years
and older
Females 18 years
and older
Low education‡ 25 years and
older
High education§
25 years and older
United States (median) 17 18 15 31 7 5 4Range 9-26 11-27 7-27 16-44 3-11 2-7 1-9
Alabama 21 8 23 19 36 7 5 6Alaska 21 8 24 17 44 8 3 7Arizona 16 28 18 13 24 7 5 3Arkansas 22 5 23 22 35 7 6 7California 11 50 15 8 16 5 3 2Colorado 15 36 17 13 25 6 5 4Connecticut 13 47 14 11 23 4 3 2Delaware 17 20 18 16 26 7 5 3District of Columbia 15 36 17 12 34 7 2 1Florida 16 28 19 14 29 6 4 3Georgia 17 20 21 14 31 7 4 4Hawaii 13 47 16 9 21 6 5 3Idaho 14 42 16 13 29 5 5 5Illinois 15 36 17 14 23 7 4 3Indiana 22 5 23 20 38 8 6 5Iowa 17 20 18 16 33 8 4 5Kansas 17 20 18 16 35 7 5 6Kentucky 25 2 27 22 44 9 6 8Louisiana 23 3 25 21 38 8 4 6Maine 17 20 20 14 36 6 4 3Maryland 14 42 16 12 23 5 3 2Massachusetts 14 42 15 13 31 6 3 2Michigan 19 13 22 17 39 7 5 4Minnesota 15 36 16 13 27 6 4 5Mississippi 22 5 22 22 36 10 5 7Missouri 21 8 22 20 42 8 5 6Montana 17 20 17 17 38 9 4 8Nebraska 15 36 16 14 24 6 4 5Nevada 18 18 19 16 28 9 5 4New Hampshire 16 28 17 15 41 6 5 2New Jersey 14 42 16 12 22 7 4 2New Mexico 17 20 21 15 25 8 5 4New York 14 42 18 11 21 7 4 3North Carolina 17 20 19 15 26 5 5 4North Dakota 18 18 19 17 36 8 4 6Ohio 21 8 22 20 43 7 5 5Oklahoma 20 12 21 19 33 8 7 7Oregon 16 28 18 14 35 7 4 3Pennsylvania 19 13 21 17 32 8 5 4Rhode Island 15 36 17 13 29 5 5 2South Carolina 19 13 22 16 37 7 4 4South Dakota 19 13 22 16 34 7 4 6Tennessee 23 3 24 21 43 7 6 6Texas 16 28 18 14 21 6 5 4Utah 9 51 11 7 22 3 5 3Vermont 16 28 17 15 29 5 3 3Virginia 16 28 18 14 31 6 5 4Washington 13 47 15 12 25 5 4 3West Virginia 26 1 25 27 40 11 6 9Wisconsin 16 28 17 15 30 6 4 4Wyoming 19 13 19 18 33 6 6 9Puerto Rico 11 – 17 6 11 8 1 1
*Smoked 100 cigarettes in lifetime and are current smokers (regular and irregular). †Based on overall % for 18 years and older. ‡Less than a high school education. §At least a college degree. ¶Some days or every day. #Use of chewing tobacco, snuff, or snus every day or some days. Note: Puerto Rico not included in range or median.
Source: Behavioral Risk Factor Surveillance System, 2017.
©2019, American Cancer Society, Inc., Surveillance Research
6 Cancer Prevention & Early Detection Facts & Figures 2019-2020
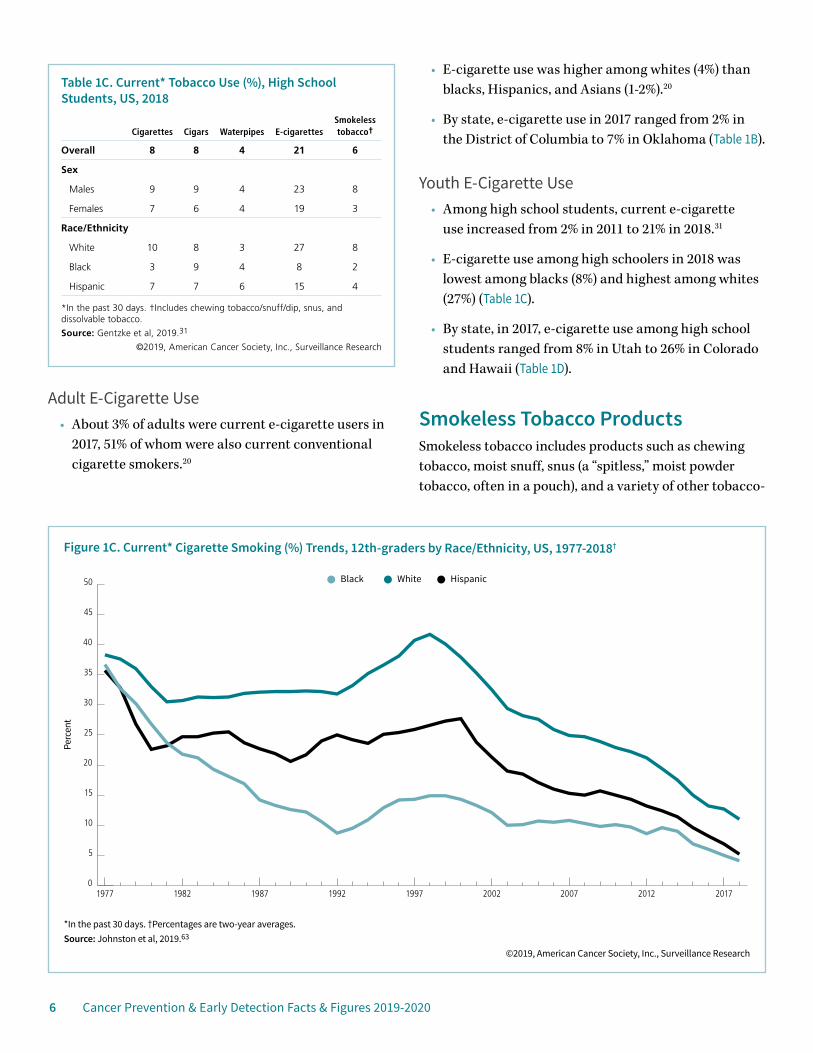
Adult E-Cigarette Use• About 3% of adults were current e-cigarette users in
2017, 51% of whom were also current conventional cigarette smokers.20
• E-cigarette use was higher among whites (4%) than blacks, Hispanics, and Asians (1-2%).20
• By state, e-cigarette use in 2017 ranged from 2% in the District of Columbia to 7% in Oklahoma (Table 1B).
Youth E-Cigarette Use• Among high school students, current e-cigarette
use increased from 2% in 2011 to 21% in 2018.31
• E-cigarette use among high schoolers in 2018 was lowest among blacks (8%) and highest among whites (27%) (Table 1C).
• By state, in 2017, e-cigarette use among high school students ranged from 8% in Utah to 26% in Colorado and Hawaii (Table 1D).
Smokeless Tobacco ProductsSmokeless tobacco includes products such as chewing tobacco, moist snuff, snus (a “spitless,” moist powder tobacco, often in a pouch), and a variety of other tobacco-
Table 1C. Current* Tobacco Use (%), High School Students, US, 2018
Cigarettes Cigars Waterpipes E-cigarettesSmokeless tobacco†
Overall 8 8 4 21 6
Sex
Males 9 9 4 23 8
Females 7 6 4 19 3
Race/Ethnicity
White 10 8 3 27 8
Black 3 9 4 8 2
Hispanic 7 7 6 15 4
*In the past 30 days. †Includes chewing tobacco/snuff/dip, snus, and dissolvable tobacco.
Source: Gentzke et al, 2019.31
©2019, American Cancer Society, Inc., Surveillance Research
*In the past 30 days. †Percentages are two-year averages.Source: Johnston et al, 2019.63
©2019, American Cancer Society, Inc., Surveillance Research
Perc
ent
Figure 1C. Current* Cigarette Smoking (%) Trends, 12th-graders by Race/Ethnicity, US, 1977-2018†
0
5
10
15
20
25
30
35
40
45
50
201720122007200219971992198719821977
White HispanicBlack
Cancer Prevention & Early Detection Facts & Figures 2019-2020 7
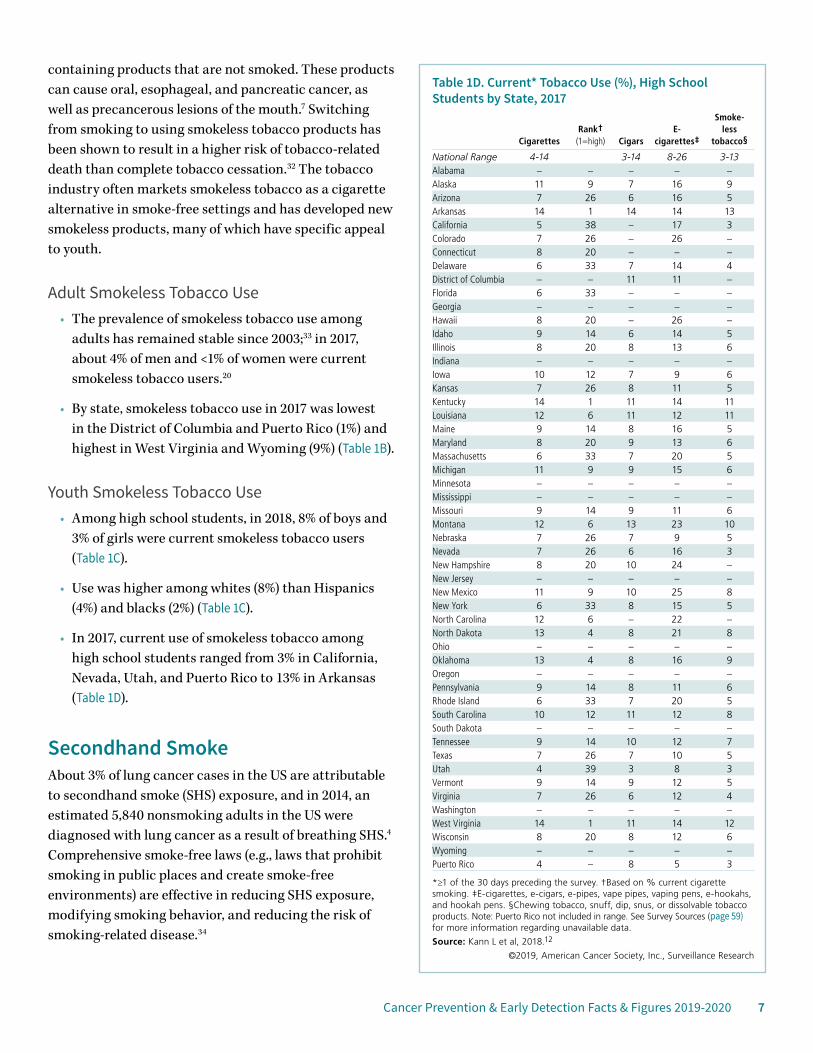
containing products that are not smoked. These products can cause oral, esophageal, and pancreatic cancer, as well as precancerous lesions of the mouth.7 Switching from smoking to using smokeless tobacco products has been shown to result in a higher risk of tobacco-related death than complete tobacco cessation.32 The tobacco industry often markets smokeless tobacco as a cigarette alternative in smoke-free settings and has developed new smokeless products, many of which have specific appeal to youth.
Adult Smokeless Tobacco Use• The prevalence of smokeless tobacco use among
adults has remained stable since 2003;33 in 2017, about 4% of men and <1% of women were current smokeless tobacco users.20
• By state, smokeless tobacco use in 2017 was lowest in the District of Columbia and Puerto Rico (1%) and highest in West Virginia and Wyoming (9%) (Table 1B).
Youth Smokeless Tobacco Use• Among high school students, in 2018, 8% of boys and
3% of girls were current smokeless tobacco users (Table 1C).
• Use was higher among whites (8%) than Hispanics (4%) and blacks (2%) (Table 1C).
• In 2017, current use of smokeless tobacco among high school students ranged from 3% in California, Nevada, Utah, and Puerto Rico to 13% in Arkansas (Table 1D).
Secondhand SmokeAbout 3% of lung cancer cases in the US are attributable to secondhand smoke (SHS) exposure, and in 2014, an estimated 5,840 nonsmoking adults in the US were diagnosed with lung cancer as a result of breathing SHS.4 Comprehensive smoke-free laws (e.g., laws that prohibit smoking in public places and create smoke-free environments) are effective in reducing SHS exposure, modifying smoking behavior, and reducing the risk of smoking-related disease.34
Table 1D. Current* Tobacco Use (%), High School Students by State, 2017
CigarettesRank†
(1=high) CigarsE-
cigarettes‡
Smoke- less
tobacco§
National Range 4-14 3-14 8-26 3-13Alabama – – – – –Alaska 11 9 7 16 9Arizona 7 26 6 16 5Arkansas 14 1 14 14 13California 5 38 – 17 3Colorado 7 26 – 26 –Connecticut 8 20 – – –Delaware 6 33 7 14 4District of Columbia – – 11 11 –Florida 6 33 – – –Georgia – – – – –Hawaii 8 20 – 26 –Idaho 9 14 6 14 5Illinois 8 20 8 13 6Indiana – – – – –Iowa 10 12 7 9 6Kansas 7 26 8 11 5Kentucky 14 1 11 14 11Louisiana 12 6 11 12 11Maine 9 14 8 16 5Maryland 8 20 9 13 6Massachusetts 6 33 7 20 5Michigan 11 9 9 15 6Minnesota – – – – –Mississippi – – – – –Missouri 9 14 9 11 6Montana 12 6 13 23 10Nebraska 7 26 7 9 5Nevada 7 26 6 16 3New Hampshire 8 20 10 24 –New Jersey – – – – –New Mexico 11 9 10 25 8New York 6 33 8 15 5North Carolina 12 6 – 22 –North Dakota 13 4 8 21 8Ohio – – – – –Oklahoma 13 4 8 16 9Oregon – – – – –Pennsylvania 9 14 8 11 6Rhode Island 6 33 7 20 5South Carolina 10 12 11 12 8South Dakota – – – – –Tennessee 9 14 10 12 7Texas 7 26 7 10 5Utah 4 39 3 8 3Vermont 9 14 9 12 5Virginia 7 26 6 12 4Washington – – – – –West Virginia 14 1 11 14 12Wisconsin 8 20 8 12 6Wyoming – – – – –Puerto Rico 4 – 8 5 3
*≥1 of the 30 days preceding the survey. †Based on % current cigarette smoking. ‡E-cigarettes, e-cigars, e-pipes, vape pipes, vaping pens, e-hookahs, and hookah pens. §Chewing tobacco, snuff, dip, snus, or dissolvable tobacco products. Note: Puerto Rico not included in range. See Survey Sources (page 59) for more information regarding unavailable data.
Source: Kann L et al, 2018.12
©2019, American Cancer Society, Inc., Surveillance Research
8 Cancer Prevention & Early Detection Facts & Figures 2019-2020
Secondhand Smoke Exposure and PoliciesNationally, SHS exposure among nonsmokers declined from 88% in 1988-1991 to 25% in 2013-2014.35 Certain groups, such as those with lower socioeconomic status, have considerably higher SHS exposure.6, 35
• Almost 60% of the US population is covered by comprehensive laws that prohibit smoking in all non-hospitality workplaces (such as offices, factories, and warehouses), restaurants, and bars.36
• As of January 2019, 25 states, the District of Columbia, Puerto Rico, and the US Virgin Islands had 100% smoke-free laws in non-hospitality workplaces, restaurants, and bars (Table 1E).
• Additionally, in 2017, the US Housing and Urban Development Department’s smoke-free public housing rule went into effect.37
• Over 2,300 college/university campuses are 100% smoke-free.36
Tobacco CessationSmoking cessation reduces the risk of developing cancer.2 Smokers who quit, regardless of age, increase their longevity, and those who quit by age 30 live an average of 10 years longer than if they had continued to smoke.2, 38 Smoking cessation also improves outcomes for cancer survivors.2
Nicotine replacement therapy (NRT), prescription medications (e.g., buproprion and varenicline), and counseling (individual, group, or telephone) improve the chances of long-term cessation.39 Combinations of one or more types of these cessation aids may be more effective than the use of one treatment alone. Most people begin smoking during their youth, underestimate the strength and rapidity of tobacco dependence, and overestimate their ability to quit.40 The US Public Health Service recommends tobacco cessation counseling for adolescent smokers. Although NRTs appear to be safe in adolescents, there is little evidence to date that these medications are effective in promoting long-term abstinence, and as a result they are not yet recommended as a component of
adolescent tobacco use interventions.39 In addition to smokefree.gov, the sidebar above provides examples of cessation programs and initiatives.
Adult Tobacco Cessation• In 2005 and as recently as 2015, only about one-third
of people who tried to quit smoking used cessation aids. Use was especially low among racial/ethnic minorities and individuals with lower socioeconomic status.41
• In 2017, 62% (55.2 million) of the 89.5 million adults who ever smoked at least 100 cigarettes were former smokers.20
• Nearly one-half of current smokers in 2017 attempted to quit for at least one day in the past year.20
Youth Tobacco Cessation• Among high school tobacco product users, in 2017,
about 41% tried to quit using all tobacco products in the previous year (boys: 37%, girls: 48%).12
• In 2017, only 33% of high school smokers in Vermont made a recent quit attempt compared to 51% in Louisiana.12
Examples of Tobacco Cessation Programs and Initiatives Quit for Life® Programcancer.org/healthy/stay-away-from-tobacco/smoke-free-communities/create-smoke-free-workplace/quit-for-life 1-800-227-2345
Great American Smokeout®cancer.org/healthy/stay-away-from-tobacco/great-american-smokeout 1-800-227-2345
Tips From Former Smokerscdc.gov/tobacco/campaign/tips/ 1-800-QUIT-NOW
Cancer Prevention & Early Detection Facts & Figures 2019-2020 9
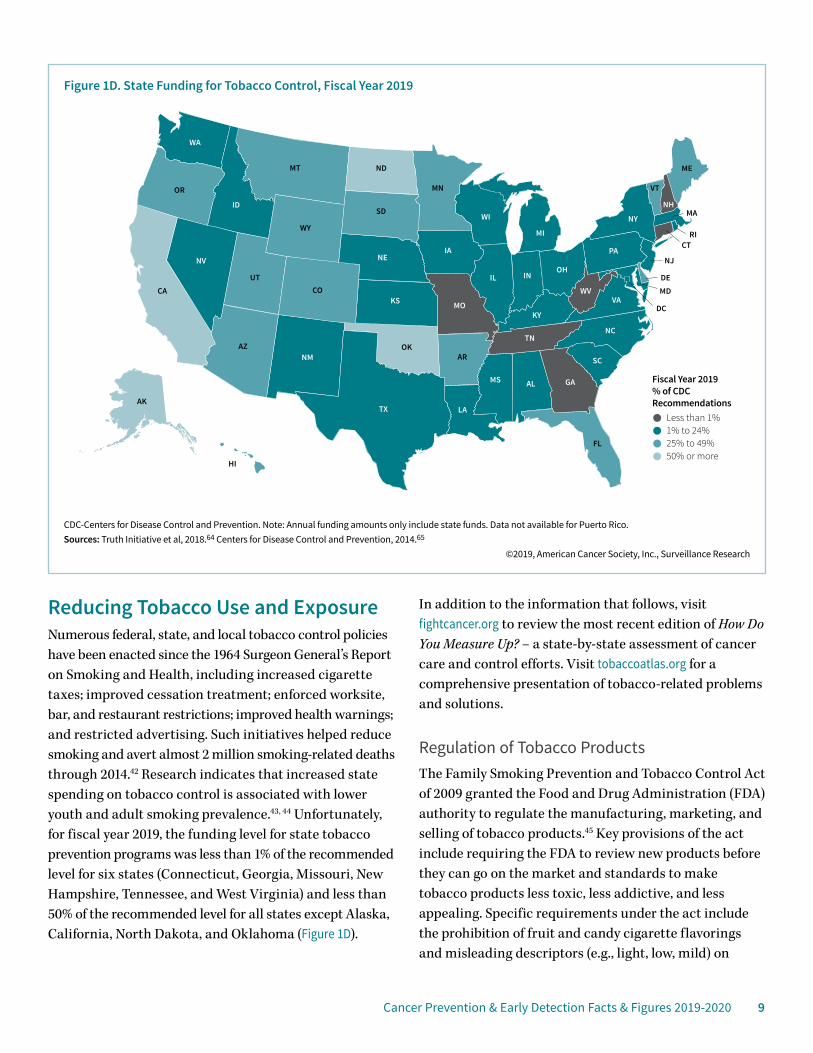
Reducing Tobacco Use and Exposure Numerous federal, state, and local tobacco control policies have been enacted since the 1964 Surgeon General’s Report on Smoking and Health, including increased cigarette taxes; improved cessation treatment; enforced worksite, bar, and restaurant restrictions; improved health warnings; and restricted advertising. Such initiatives helped reduce smoking and avert almost 2 million smoking-related deaths through 2014.42 Research indicates that increased state spending on tobacco control is associated with lower youth and adult smoking prevalence.43, 44 Unfortunately, for fiscal year 2019, the funding level for state tobacco prevention programs was less than 1% of the recommended level for six states (Connecticut, Georgia, Missouri, New Hampshire, Tennessee, and West Virginia) and less than 50% of the recommended level for all states except Alaska, California, North Dakota, and Oklahoma (Figure 1D).
In addition to the information that follows, visit fightcancer.org to review the most recent edition of How Do You Measure Up? – a state-by-state assessment of cancer care and control efforts. Visit tobaccoatlas.org for a comprehensive presentation of tobacco-related problems and solutions.
Regulation of Tobacco ProductsThe Family Smoking Prevention and Tobacco Control Act of 2009 granted the Food and Drug Administration (FDA) authority to regulate the manufacturing, marketing, and selling of tobacco products.45 Key provisions of the act include requiring the FDA to review new products before they can go on the market and standards to make tobacco products less toxic, less addictive, and less appealing. Specific requirements under the act include the prohibition of fruit and candy cigarette flavorings and misleading descriptors (e.g., light, low, mild) on
Figure 1D. State Funding for Tobacco Control, Fiscal Year 2019
AL
AZAR
CA CO
CT
DE
FL
GA
ID
IL IN
IA
KS
KY
LA
ME
MD
MA
MN
MS
MO
MT
NENV
NH
NJ
NM
NY
NC
ND
OH
OK
OR
PA
RI
SC
SD
TN
TX
UT
VT
VA
WA
WV
WIWY
DC
AK
HI
MI
CDC-Centers for Disease Control and Prevention. Note: Annual funding amounts only include state funds. Data not available for Puerto Rico. Sources: Truth Initiative et al, 2018.64 Centers for Disease Control and Prevention, 2014.65
©2019, American Cancer Society, Inc., Surveillance Research
Fiscal Year 2019 % of CDC Recommendations
Less than 1%1% to 24%25% to 49%50% or more
10 Cancer Prevention & Early Detection Facts & Figures 2019-2020
tobacco product labels. Evidence suggests that the prohibition of flavored cigarettes was associated with a reduction in overall tobacco use among youth, although there was an increase in use of tobacco products not included in the prohibition of flavors (e.g., menthol cigarettes, cigars, and pipes).46
In 2016, the FDA expanded their regulations to include additional tobacco products (e.g., waterpipes, e-cigarettes, loose tobacco, cigars), as well as future products that meet the statutory definition of a tobacco product.47 In 2017, the FDA announced a new strategy focused on making cigarettes less addictive by reducing nicotine levels. While a rule has not yet been proposed, evidence suggests that a reduction in nicotine could result in a significant decrease in tobacco-related death because smokers would be more likely to quit and nonsmokers would be less likely to initiate or re-initiate.48 Additionally, the American Cancer Society Cancer Action NetworkSM (ACS CAN), the American Cancer Society’s nonprofit, nonpartisan advocacy affiliate, and its partners won a lawsuit in 2018 requiring the FDA to develop larger, graphic warning labels for cigarettes as required by law.
Tobacco Taxes The affordability of a tobacco product, which incorporates price as well as an individual’s income and ability to purchase the product, varies widely across the US.49 There is very strong evidence that the price of cigarettes is inversely and predictably related to consumption.50 Tax increases are particularly effective at reducing smoking rates among smokers with lower socioeconomic status and/or young smokers who are particularly price sensitive.51, 52 Tobacco control advocates aim for taxation levels that help ensure prices are not too low even if the product is heavily discounted. Unfortunately, loopholes in tax regulations and tobacco industry tactics can negate the benefits of cigarette excise tax increases. Taxes on tobacco products other than cigarettes vary by product type53 and continue to lag behind, often providing less expensive alternatives to conventional cigarettes.
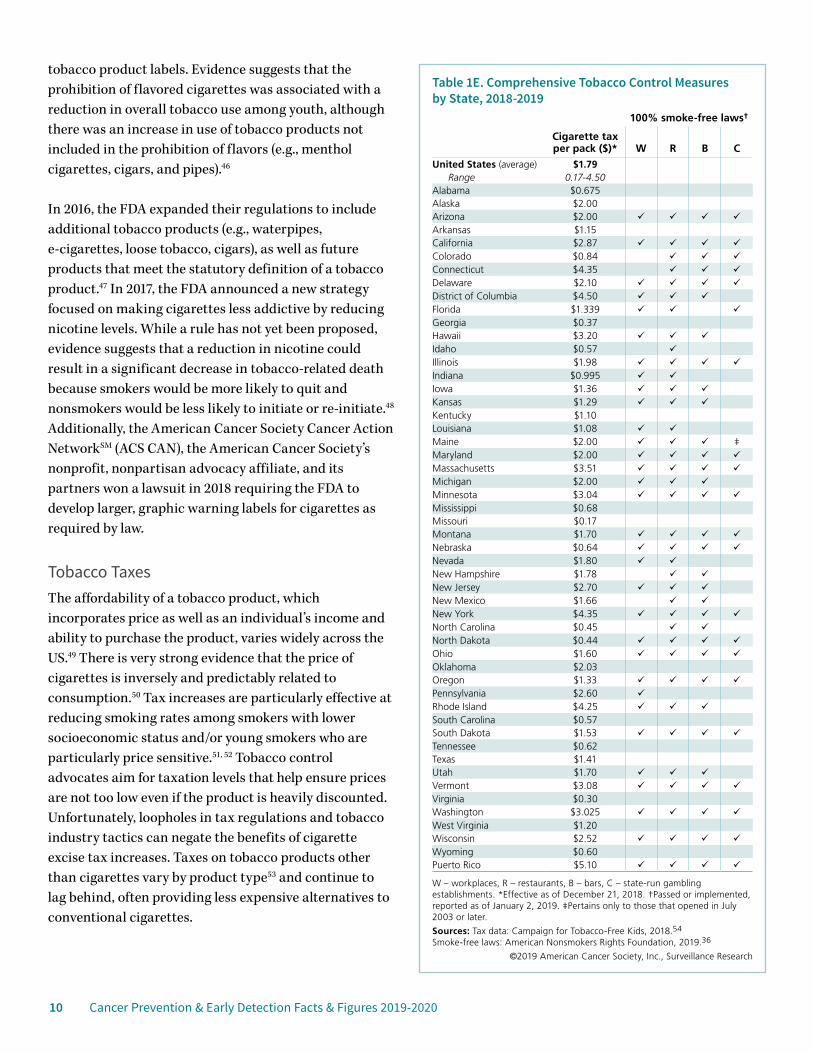
Table 1E. Comprehensive Tobacco Control Measures by State, 2018-2019
100% smoke-free laws†
Cigarette tax per pack ($)* W R B C
United States (average) $1.79 Range 0.17-4.50
Alabama $0.675 Alaska $2.00 Arizona $2.00 Arkansas $1.15 California $2.87 Colorado $0.84 Connecticut $4.35 Delaware $2.10 District of Columbia $4.50 Florida $1.339 Georgia $0.37 Hawaii $3.20 Idaho $0.57 Illinois $1.98 Indiana $0.995 Iowa $1.36 Kansas $1.29 Kentucky $1.10 Louisiana $1.08 Maine $2.00 ‡Maryland $2.00 Massachusetts $3.51 Michigan $2.00 Minnesota $3.04 Mississippi $0.68 Missouri $0.17 Montana $1.70 Nebraska $0.64 Nevada $1.80 New Hampshire $1.78 New Jersey $2.70 New Mexico $1.66 New York $4.35 North Carolina $0.45 North Dakota $0.44 Ohio $1.60 Oklahoma $2.03 Oregon $1.33 Pennsylvania $2.60 Rhode Island $4.25 South Carolina $0.57 South Dakota $1.53 Tennessee $0.62 Texas $1.41 Utah $1.70 Vermont $3.08 Virginia $0.30 Washington $3.025 West Virginia $1.20 Wisconsin $2.52 Wyoming $0.60 Puerto Rico $5.10
W – workplaces, R – restaurants, B – bars, C – state-run gambling establishments. *Effective as of December 21, 2018. †Passed or implemented, reported as of January 2, 2019. ‡Pertains only to those that opened in July 2003 or later.
Sources: Tax data: Campaign for Tobacco-Free Kids, 2018.54 Smoke-free laws: American Nonsmokers Rights Foundation, 2019.36
©2019 American Cancer Society, Inc., Surveillance Research
Cancer Prevention & Early Detection Facts & Figures 2019-2020 11
• Unchanged since 2009, the federal cigarette tax is $1.01.2 As of December 21, 2018, the average state cigarette excise tax rate was $1.79, ranging from 17 cents per pack in Missouri to $4.50 per pack in the District of Columbia and $5.10 in Puerto Rico (Table 1E).
• E-cigarettes are not taxed at the federal level, but as of November 14, 2018, California, Delaware, the District of Columbia, Kansas, Louisiana, Minnesota, New Jersey, North Carolina, Pennsylvania, and West Virginia had an e-cigarette excise tax.55
Cessation AssistanceProvisions of the Affordable Care Act (ACA) require coverage for evidence-based cessation treatments for people in most private and some public health insurance plans. In addition, pregnant women and people covered by Medicaid in states that have expanded coverage have access to no-cost tobacco cessation services. Although there have been improvements in state Medicaid tobacco cessation coverage, as of June 30, 2017, only 10 states covered individual and group counseling in addition to the FDA-approved cessation medications.56 Statewide telephone quitlines have broad accessibility and can deliver effective behavioral counseling to diverse groups
of tobacco users. Integrating standard NRT into state quitline programs can further improve quit rates.39, 57
Age RestrictionsFederal law prohibits the sale of all tobacco products, including e-cigarettes, to persons under the age of 18. In addition, as of January 1, 2019, California, the District of Columbia, Hawaii, New Jersey, Maine, Massachusetts, and Oregon, along with many localities, had passed legislation to increase the minimum age of sale for tobacco products to 21.58
Countering Tobacco Industry MarketingExposure to tobacco industry marketing (advertising and promotions) significantly increases both the likelihood that adolescents will use tobacco and per-capita cigarette consumption in adults and youth.59 Tobacco companies increased their cigarette advertising and promotional expenditures from $6.7 billion in 1998 to a peak of $15.1 billion in 2003; in 2016 expenditures totaled $8.7 billion.60 Efforts such as the FDA’s smoking prevention campaign, “The Real Cost,” which educates at-risk teens on the harmful effects of smoking, are an attempt to counter industry marketing. “The Real Cost” has been associated with preventing approximately
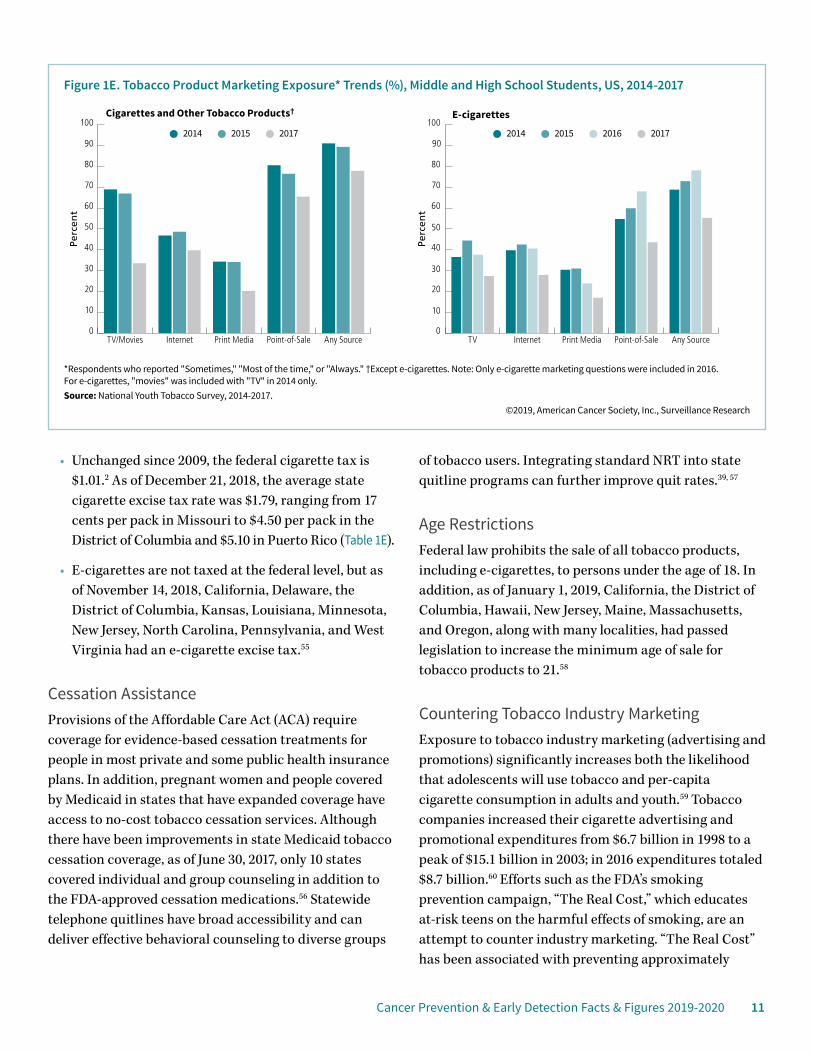
*Respondents who reported "Sometimes," "Most of the time," or "Always." †Except e-cigarettes. Note: Only e-cigarette marketing questions were included in 2016. For e-cigarettes, "movies" was included with "TV" in 2014 only. Source: National Youth Tobacco Survey, 2014-2017.
©2019, American Cancer Society, Inc., Surveillance Research
Perc
ent
Perc
ent
Figure 1E. Tobacco Product Marketing Exposure* Trends (%), Middle and High School Students, US, 2014-2017
2014 2015 2017 2014 2015 2016 2017
0
10
20
30
40
50
60
70
80
90
100
Any SourcePoint-of-SalePrint MediaInternetTV/Movies0
10
20
30
40
50
60
70
80
90
100
Any SourcePoint-of-SalePrint MediaInternetTV
Cigarettes and Other Tobacco Products† E-cigarettes
12 Cancer Prevention & Early Detection Facts & Figures 2019-2020
350,000 youth from smoking initiation between 2014 and 2016,61 which is associated with a savings of $31 billion in smoking-related costs.62 Among middle and high school students, from 2014 to 2017, there were notable decreases in exposure to tobacco product marketing (Figure 1E). Despite these declines, in 2017, 78% of youth reported some exposure to marketing for cigarettes and other tobacco products, mostly through point-of-sale advertising; about 55% of youth reported exposure to e-cigarette marketing.
References1. US Department of Health and Human Services. Smoking and Health Report of the Advisory Committee to the Surgeon General of the Public Health Service. Washington, DC: Public Health Service, 1964.2. US Department of Health and Human Services. The Health Consequences of Smoking-50 Years of Progress. A Report from the Surgeon General. Atlanta, GA; USA: Department of Health and Human Services. Centers for Disease Control and Prevention, National Center for Chronic Disease Prevention and Health Promotion, 2014.3. Jacobs EJ, Newton CC, Carter BD, et al. What proportion of cancer deaths in the contemporary United States is attributable to cigarette smoking? Ann Epidemiol. 2015;25: 179-182.4. Islami F, Goding Sauer A, Miller KD, et al. Proportion and number of cancer cases and deaths attributable to potentially modifiable risk factors in the United States. CA Cancer J Clin. 2018;68: 31-54.5. Lortet-Tieulent J, Goding Sauer A, Siegel RL, et al. State-Level Cancer Mortality Attributable to Cigarette Smoking in the United States. JAMA Intern Med. 2016;176: 1792-1798.6. Drope J, Liber AC, Cahn Z, et al. Who’s still smoking? Disparities in adult cigarette smoking prevalence in the United States. CA Cancer J Clin. 2018;68: 106-115.7. Secretan B, Straif K, Baan R, et al. A review of human carcinogens – Part E: tobacco, areca nut, alcohol, coal smoke, and salted fish. Lancet Oncol. 2009 10: 1033-1034.8. US Department of Health and Human Services. Preventing Tobacco Use Among Youth and Young Adults: A Report of the Surgeon General. Atlanta, GA: US Department of Health and Human Services, Centers for Disease Control and Prevention, National Center for Chronic Disease and Prevention and Health Promotion, Office of Smoking and Health, 2012.9. National Center for Health Statistics. Health, United States, 2017: With special feature on mortality. Hyattsville, MD, 2018.10. Centers for Disease Control and Prevention. Youth Tobacco Surveillance United States, 1998-1999. MMWR Surveill Summ. 2000;49.11. Odani S, Armour BS, Agaku ID. Racial/Ethnic Disparities in Tobacco Product Use Among Middle and High School Students – United States, 2014-2017. MMWR Morb Mortal Wkly Rep. 2018;67: 952-957.12. Kann L, McManus T, Harris WA, et al. Youth Risk Behavior Surveillance – United States, 2017. MMWR Surveill Summ. 2018;67: 1-114.13. Baker F, Ainsworth SR, Dye JT, et al. Health risks associated with cigar smoking. JAMA. 2000;284: 735-740.
14. Shanks TG, Burns DM. Disease consequences of cigar smoking. National Cancer Institute, Smoking and Tobacco Control, Monograph 9: Cigars – Health Effects and Trends. Washington, DC: National Institutes of Health, 1998.15. Shapiro JA, Jacobs EJ, Thun MJ. Cigar smoking in men and risk of death from tobacco-related cancers. J Natl Cancer Inst. 2000;92: 333-337.16. Gammon DG, Loomis BR, Dench DL, King BA, Fulmer EB, Rogers T. Effect of price changes in little cigars and cigarettes on little cigar sales: USA, Q4 2011-Q4 2013. Tob Control. 2016;25: 538-544.17. Waziry R, Jawad M, Ballout RA, Al Akel M, Akl EA. The effects of waterpipe tobacco smoking on health outcomes: an updated systematic review and meta-analysis. Int J Epidemiol. 2017;46: 32-43.18. Montazeri Z, Nyiraneza C, El-Katerji H, Little J. Waterpipe smoking and cancer: systematic review and meta-analysis. Tob Control. 2017;26: 92-97.19. Haddad L, Kelly DL, Weglicki LS, Barnett TE, Ferrell AV, Ghadban R. A Systematic Review of Effects of Waterpipe Smoking on Cardiovascular and Respiratory Health Outcomes. Tobacco use insights. 2016;9: 13-28.20. National Center for Health Statistics. National Health Interview Survey, 2017. Public-use data file and documentation. Available from URL: http://www.cdc.gov/nchs/nhis/quest_data_related_1997_forward.htm Accessed July 9, 2018.21. Arrazola RA, Singh T, Corey CG, et al. Tobacco use among middle and high school students – United States, 2011-2014. MMWR Morb Mortal Wkly Rep. 2015;64: 381-385.22. Huang J, Duan Z, Kwok J, et al. Vaping versus JUULing: how the extraordinary growth and marketing of JUUL transformed the US retail e-cigarette market. Tob Control. 2018.23. Cheng T. Chemical evaluation of electronic cigarettes. Tob Control. 2014;May: Suppl 2:ii11-17.24. US Food and Drug Administration. Vaporizers, E-Cigarettes, and Other Electronic Nicotine Delivery Systems (ENDS). Available from URL: http://www.fda.gov/TobaccoProducts/Labeling/ProductsIngredientsComponents/ucm456610.htm Accessed September 26, 2016.25. Hajek P, Phillips-Waller A, Przulj D, et al. A Randomized Trial of E-Cigarettes versus Nicotine-Replacement Therapy. N Engl J Med. 2019.26. Dinakar C, O’Connor GT. The Health Effects of Electronic Cigarettes. N Engl J Med. 2016;375: 1372-1381.27. National Academy of Sciences E, and Medicine. Public Health Consequences of E-Cigarettes. Washington, DC: The National Academies Press, 2018.28. Leventhal AM, Strong DR, Kirkpatrick MG, et al. Association of Electronic Cigarette Use With Initiation of Combustible Tobacco Product Smoking in Early Adolescence. JAMA. 2015;314: 700-707.29. Soneji S, Barrington-Trimis JL, Wills TA, et al. Association Between Initial Use of e-Cigarettes and Subsequent Cigarette Smoking Among Adolescents and Young Adults: A Systematic Review and Meta-analysis. JAMA Pediatr. 2017;171: 788-797.30. Miech R, Patrick ME, O’Malley PM, Johnston LD. E-cigarette use as a predictor of cigarette smoking: results from a 1-year follow-up of a national sample of 12th grade students. Tob Control. 2017;26: e106-e111.31. Gentzke AS, Creamer M, Cullen KA, et al. Vital Signs: Tobacco Product Use Among Middle and High School Students – United States, 2011-2018. MMWR Morb Mortal Wkly Rep. 2019;68: 157-164.
Cancer Prevention & Early Detection Facts & Figures 2019-2020 13
32. Henley SJ, Connell CJ, Richter P, et al. Tobacco-related disease mortality among men who switched from cigarettes to spit tobacco. Tob Control. 2007;16: 22-28.33. Chang JT, Levy DT, Meza R. Trends and Factors Related to Smokeless Tobacco Use in the United States. Nicotine Tob Res. 2016;18: 1740-1748.34. Institute of Medicine. Secondhand Smoke Exposure and Cardiovascular Effects: Making Sense of the Evidence. Washington, DC: Institute of Medicine, 2009.35. Tsai J, Homa DM, Gentzke AS, et al. Exposure to Secondhand Smoke Among Nonsmokers – United States, 1988-2014. MMWR Morb Mortal Wkly Rep. 2018;67: 196-200.36. American Nonsmokers’ Rights Foundation. Overview List – How many Smokefree Laws? Available from URL: http://no-smoke.org/wp-content/uploads/pdf/mediaordlist.pdf Accessed January 29, 2019.37. US Department of Housing and Urban Development. Smoke-Free Public Housing. Available from URL: https://www.hud.gov/smokefreepublichousing Accessed August 8, 2018.38. Doll R, Peto R, Boreham J, Sutherland I. Mortality in relation to smoking: 50 years’ observation on male British doctors. BMJ. 2004;328: 1519-1527.39. Clinical Practice Guideline Treating Tobacco Use and Dependence 2008 Update Panel, Liaisons, and Staff. A clinical practice guideline for treating tobacco use and dependence: 2008 update. A U.S. Public Health Service report. Am J Prev Med. 2008;35: 158-176.40. Johnston LD, O’Malley PM, Bachman JG, Schulenberg JE. Monitoring the Future national survey results on drug use, 1975-2012. Volume I: Secondary school students. Ann Arbor, MI: University of Michigan, 2013.41. Babb S, Malarcher A, Schauer G, Asman K, Jamal A. Quitting Smoking Among Adults – United States, 2000-2015. MMWR Morb Mortal Wkly Rep. 2017;65: 1457-1464.42. Levy DT, Meza R, Zhang Y, Holford TR. Gauging the Effect of U.S. Tobacco Control Policies From 1965 Through 2014 Using SimSmoke. Am J Prev Med. 2016;50: 535-542.43. Farrelly MC, Pechacek TF, Thomas KY, Nelson D. The impact of tobacco control programs on adult smoking. Am J Public Health. 2008;98: 304-309.44. Tauras J, Chaloupka F, Farrelly M, et al. State tobacco control spending and youth smoking. Am J Public Health. 2005;95: 338-344.45. US Food and Drug Administration. Tobacco Control Act. Available from URL: http://www.fda.gov/TobaccoProducts/GuidanceComplianceRegulatoryInformation/ucm246129.htm Accessed September 26, 2016.46. Courtemanche CJ, Palmer MK, Pesko MF. Influence of the Flavored Cigarette Ban on Adolescent Tobacco Use. Am J Prev Med. 2017;52: e139-e146.47. US Food and Drug Administration. FDA’s New Regulations for E-Cigarettes, Cigars, and All Other Tobacco Products. Available from URL: http://www.fda.gov/TobaccoProducts/Labeling/RulesRegulationsGuidance/ucm394909.htm Accessed September 23, 2016.48. Apelberg BJ, Feirman SP, Salazar E, et al. Potential Public Health Effects of Reducing Nicotine Levels in Cigarettes in the United States. N Engl J Med. 2018;378: 1725-1733.49. Bandi P, Blecher E, Cokkinides V, Ross H, Jemal A. Cigarette affordability in the United States. Nicotine Tob Res. 2013;15: 1484-1491.
50. US Department of Health and Human Services. Reducing Tobacco Use: A Report of the Surgeon General. Atlanta, GA: US Department of Health and Human Services, Centers for Disease Control and Prevention, National Center for Chronic Disease Prevention and Health Promotion, Office on Smoking and Health, 2000.51. Institute of Medicine. Ending the Tobacco Problem: A Blueprint for the Nation. Washington, D.C., 2007.52. Chaloupka FJ, Straif K, Leon ME, International Agency for Research on Cancer Working Group. Effectiveness of tax and price policies in tobacco control. Tob Control. 2011;20: 235-238.53. O’Connor RJ. Non-cigarette tobacco products: what have we learnt and where are we headed? Tob Control. 2012;21: 181-190.54. Campaign For Tobacco-Free Kids. State Cigarette Excise Tax Rates and Rankings (as of December 21, 2018). Available from URL: https://www.tobaccofreekids.org/assets/factsheets/0097.pdf Accessed January 4, 2019.55. Campaign For Tobacco-Free Kids. State Excise Tax Rates for Non-Cigarette Tobacco Products. Available from URL: https://www.tobaccofreekids.org/research/factsheets/pdf/0169.pdf Accessed November 26, 2018.56. DiGiulio A, Jump Z, Yu A, et al. State Medicaid Coverage for Tobacco Cessation Treatments and Barriers to Accessing Treatments – United States, 2015-2017. MMWR Morb Mortal Wkly Rep. 2018;67: 390-395.57. McAfee TA, Bush T, Deprey TM, et al. Nicotine patches and uninsured quitline callers. A randomized trial of two versus eight weeks. Am J Prev Med. 2008;35: 103-110.58. Campaign for Tobacco-Free Kids. States and localities that have raised the minimum legal sale age for tobacco products to 21. Available from URL: https://www.tobaccofreekids.org/assets/content/what_we_do/state_local_issues/sales_21/states_localities_MLSA_21.pdf Accessed November 27, 2018.59. National Cancer Institute. The Role of the Media in Promoting and Reducing Tobacco Use. Tobacco Control Monograph No. 19. Bethesda, MD: U.S. Department of Health and Human Services, National Institutes of Health, National Cancer Institute, 2008.60. Federal Trade Commission. Federal Trade Commission Cigarette Report for 2016, 2018.61. Farrelly MC, Duke JC, Nonnemaker J, et al. Association Between The Real Cost Media Campaign and Smoking Initiation Among Youths – United States, 2014–2016. MMWR Morb Mortal Wkly Rep. 2017;66: 47-50.62. MacMonegle AJ, Nonnemaker J, Duke JC, et al. Cost-Effectiveness Analysis of The Real Cost Campaign’s Effect on Smoking Prevention. Am J Prev Med. 2018;55: 319-325.63. Johnston LD, Miech RA, O’Malley PM, Bachman JG, Schulenberg JE, and Patrick ME. (2019). Demographic subgroup trends among adolescents in the use of various licit and illicit drugs, 1975-2018 (Monitoring the Future Occasional Paper No. 92). Ann Arbor, MI: Institute for Social Research, The University of Michigan.64. Truth Initiative, Campaign for Tobacco-Free Kids, American Heart Association, et al. Broken Promises to Our Children: A State-by-State Look at the 1998 State Tobacco Settlement 20 Years Later, 2018.65. Centers for Disease Control and Prevention. Best Practices for Comprehensive Tobacco Control Programs-2014. Atlanta, GA: U.S. Department of Health and Human Services, Centers for Disease Control and Prevention, National Center for Chronic Disease Prevention and Health Promotion, Office on Smoking and Health, 2014.
14 Cancer Prevention & Early Detection Facts & Figures 2019-2020
Excess Body Weight, Alcohol, Diet, and Physical Activity
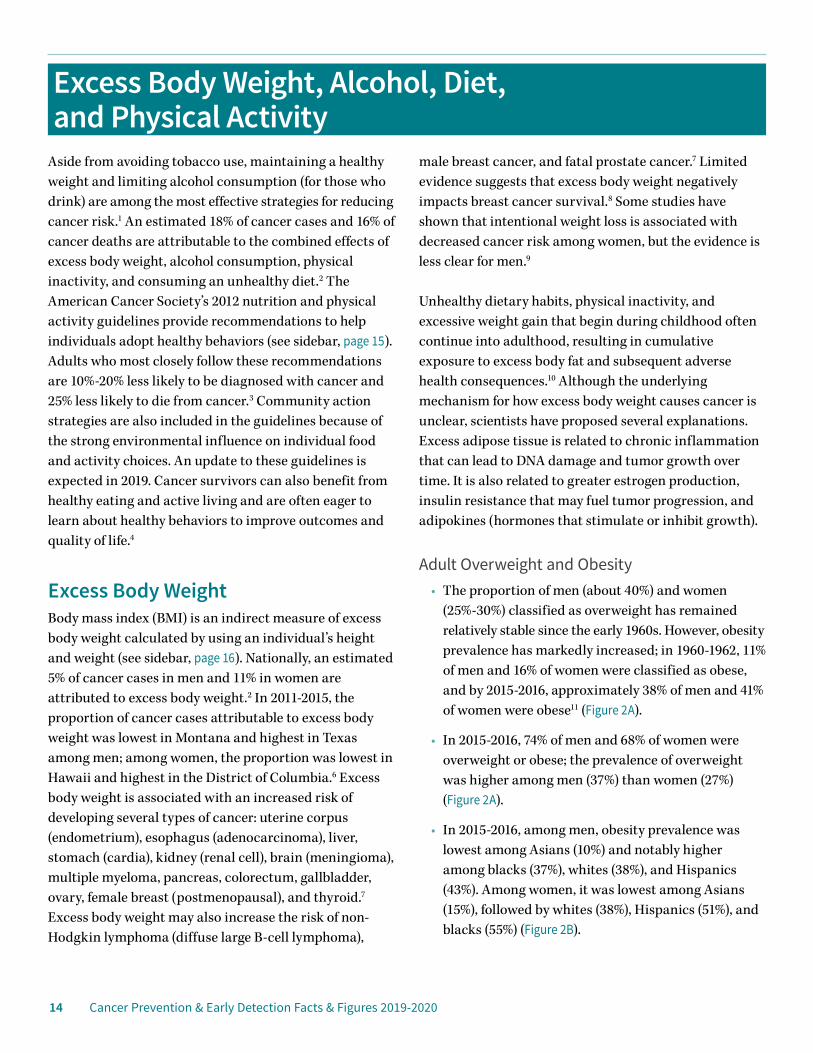
Aside from avoiding tobacco use, maintaining a healthy weight and limiting alcohol consumption (for those who drink) are among the most effective strategies for reducing cancer risk.1 An estimated 18% of cancer cases and 16% of cancer deaths are attributable to the combined effects of excess body weight, alcohol consumption, physical inactivity, and consuming an unhealthy diet.2 The American Cancer Society’s 2012 nutrition and physical activity guidelines provide recommendations to help individuals adopt healthy behaviors (see sidebar, page 15). Adults who most closely follow these recommendations are 10%-20% less likely to be diagnosed with cancer and 25% less likely to die from cancer.3 Community action strategies are also included in the guidelines because of the strong environmental influence on individual food and activity choices. An update to these guidelines is expected in 2019. Cancer survivors can also benefit from healthy eating and active living and are often eager to learn about healthy behaviors to improve outcomes and quality of life.4
Excess Body WeightBody mass index (BMI) is an indirect measure of excess body weight calculated by using an individual’s height and weight (see sidebar, page 16). Nationally, an estimated 5% of cancer cases in men and 11% in women are attributed to excess body weight.2 In 2011-2015, the proportion of cancer cases attributable to excess body weight was lowest in Montana and highest in Texas among men; among women, the proportion was lowest in Hawaii and highest in the District of Columbia.6 Excess body weight is associated with an increased risk of developing several types of cancer: uterine corpus (endometrium), esophagus (adenocarcinoma), liver, stomach (cardia), kidney (renal cell), brain (meningioma), multiple myeloma, pancreas, colorectum, gallbladder, ovary, female breast (postmenopausal), and thyroid.7 Excess body weight may also increase the risk of non-Hodgkin lymphoma (diffuse large B-cell lymphoma),
male breast cancer, and fatal prostate cancer.7 Limited evidence suggests that excess body weight negatively impacts breast cancer survival.8 Some studies have shown that intentional weight loss is associated with decreased cancer risk among women, but the evidence is less clear for men.9
Unhealthy dietary habits, physical inactivity, and excessive weight gain that begin during childhood often continue into adulthood, resulting in cumulative exposure to excess body fat and subsequent adverse health consequences.10 Although the underlying mechanism for how excess body weight causes cancer is unclear, scientists have proposed several explanations. Excess adipose tissue is related to chronic inflammation that can lead to DNA damage and tumor growth over time. It is also related to greater estrogen production, insulin resistance that may fuel tumor progression, and adipokines (hormones that stimulate or inhibit growth).
Adult Overweight and Obesity• The proportion of men (about 40%) and women
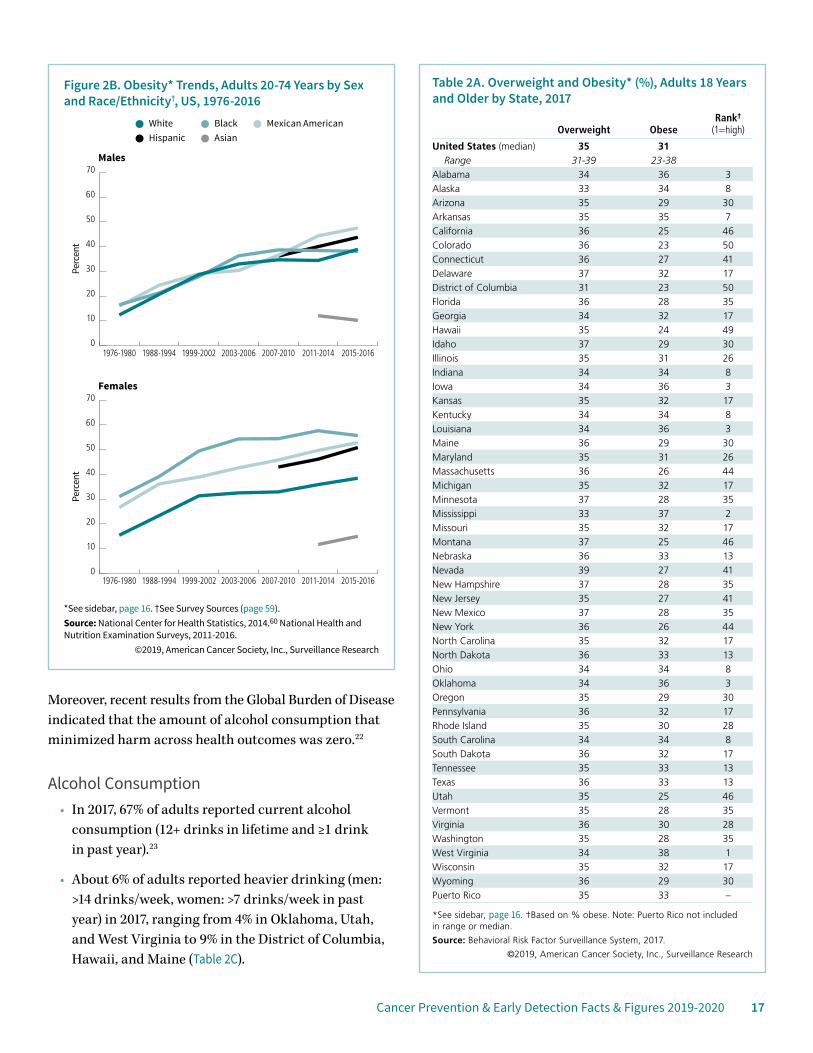
(25%-30%) classified as overweight has remained relatively stable since the early 1960s. However, obesity prevalence has markedly increased; in 1960-1962, 11% of men and 16% of women were classified as obese, and by 2015-2016, approximately 38% of men and 41% of women were obese11 (Figure 2A).
• In 2015-2016, 74% of men and 68% of women were overweight or obese; the prevalence of overweight was higher among men (37%) than women (27%) (Figure 2A).
• In 2015-2016, among men, obesity prevalence was lowest among Asians (10%) and notably higher among blacks (37%), whites (38%), and Hispanics (43%). Among women, it was lowest among Asians (15%), followed by whites (38%), Hispanics (51%), and blacks (55%) (Figure 2B).
Cancer Prevention & Early Detection Facts & Figures 2019-2020 15
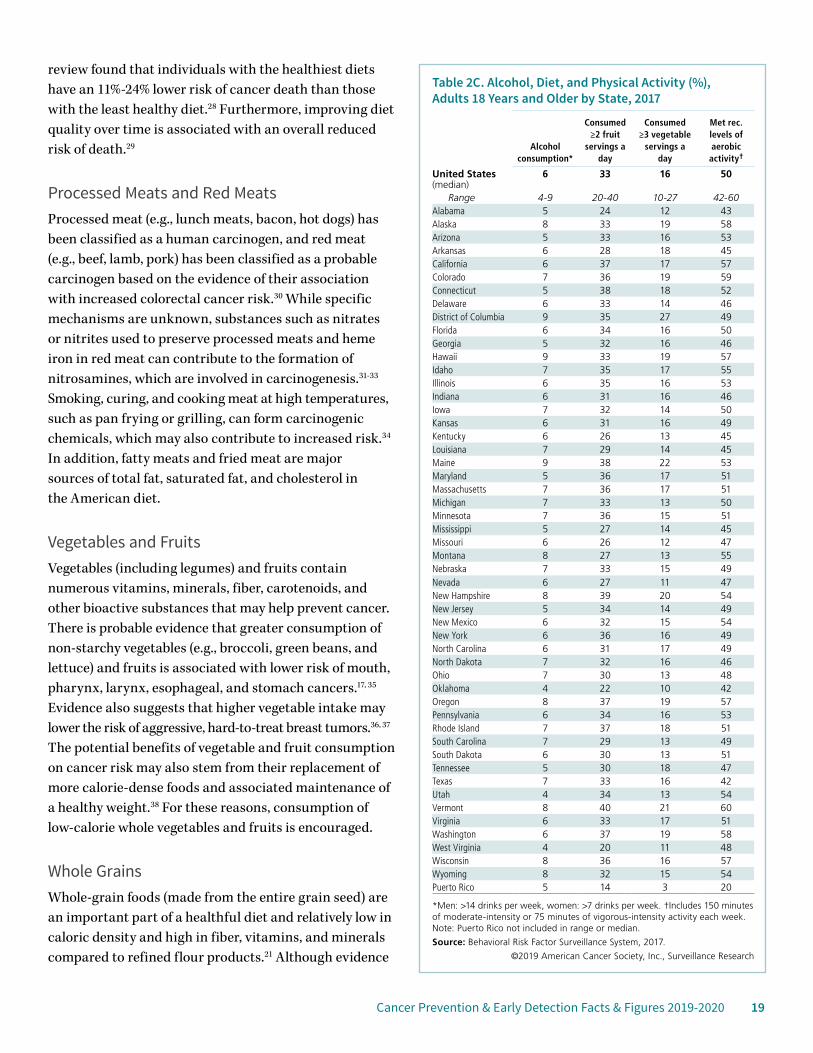
• In 2017, by state, obesity prevalence among adults ranged from 23% in Colorado and the District of Columbia to 38% in West Virginia (Table 2A).
• Obesity prevalence is higher in rural counties compared to more urban counties, with the largest disparities in the South.12
• About one-half of US adults report being obese at one point in their lifetime.13 In 2013-2016, about two-thirds of obese and one-half of overweight adults tried to lose weight in the previous year; the proportion was higher for women than men.14
Youth Overweight and Obesity• The prevalence of overweight among youth ages 2-19
years increased from 10% in 1971-1974 to 17% in 2015-2016.15
• From 1971 to 2002, the prevalence of obesity among youth ages 2-19 years tripled from 5% to 15%, increasing to 19% in 2015-2016.15
• By age, in 2015-2016 obesity prevalence ranged from 14% in young children (ages 2-5 years) to 21% in adolescents (ages 12-19 years) (Figure 2A).
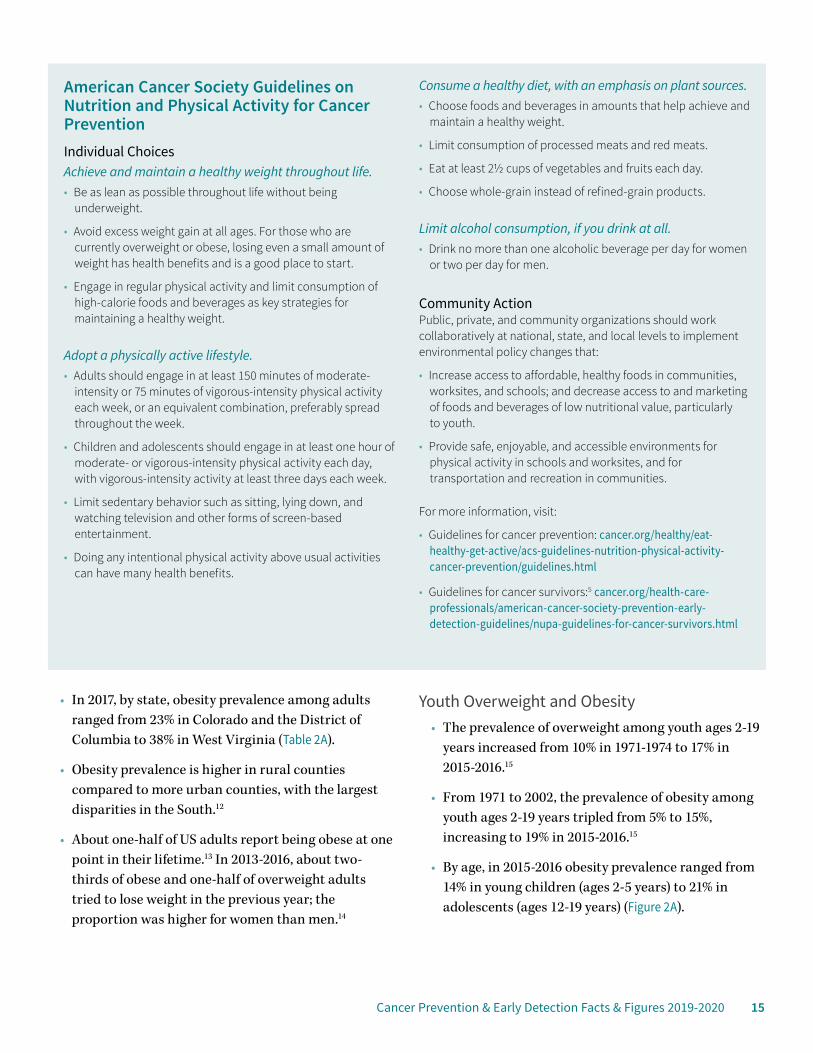
American Cancer Society Guidelines on Nutrition and Physical Activity for Cancer PreventionIndividual ChoicesAchieve and maintain a healthy weight throughout life.• Be as lean as possible throughout life without being
underweight.
• Avoid excess weight gain at all ages. For those who are currently overweight or obese, losing even a small amount of weight has health benefits and is a good place to start.
• Engage in regular physical activity and limit consumption of high-calorie foods and beverages as key strategies for maintaining a healthy weight.
Adopt a physically active lifestyle.• Adults should engage in at least 150 minutes of moderate-
intensity or 75 minutes of vigorous-intensity physical activity each week, or an equivalent combination, preferably spread throughout the week.
• Children and adolescents should engage in at least one hour of moderate- or vigorous-intensity physical activity each day, with vigorous-intensity activity at least three days each week.
• Limit sedentary behavior such as sitting, lying down, and watching television and other forms of screen-based entertainment.
• Doing any intentional physical activity above usual activities can have many health benefits.
Consume a healthy diet, with an emphasis on plant sources.• Choose foods and beverages in amounts that help achieve and
maintain a healthy weight.
• Limit consumption of processed meats and red meats.
• Eat at least 2½ cups of vegetables and fruits each day.
• Choose whole-grain instead of refined-grain products.
Limit alcohol consumption, if you drink at all.• Drink no more than one alcoholic beverage per day for women
or two per day for men.
Community ActionPublic, private, and community organizations should work collaboratively at national, state, and local levels to implement environmental policy changes that:
• Increase access to affordable, healthy foods in communities, worksites, and schools; and decrease access to and marketing of foods and beverages of low nutritional value, particularly to youth.
• Provide safe, enjoyable, and accessible environments for physical activity in schools and worksites, and for transportation and recreation in communities.
For more information, visit:
• Guidelines for cancer prevention: cancer.org/healthy/eat-healthy-get-active/acs-guidelines-nutrition-physical-activity-cancer-prevention/guidelines.html
• Guidelines for cancer survivors:5 cancer.org/health-care-professionals/american-cancer-society-prevention-early-detection-guidelines/nupa-guidelines-for-cancer-survivors.html

16 Cancer Prevention & Early Detection Facts & Figures 2019-2020
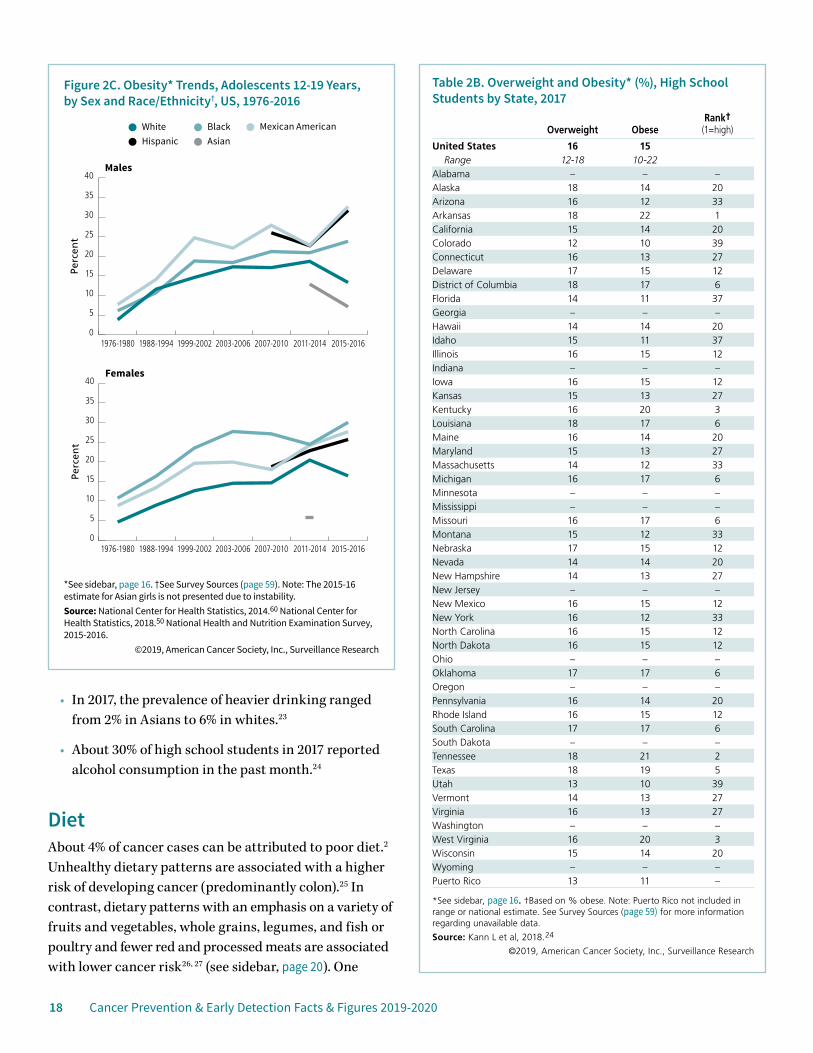
• Trends in obesity prevalence vary by sex and race/ethnicity15 (Figure 2C). Among adolescent boys, prevalence has consistently been highest among Mexican Americans while among girls, prevalence has been highest among blacks. Among both boys and girls, prevalence is lowest among Asians.
• In 2017, the prevalence of obesity among high school students ranged from 10% in Colorado and Utah to 22% in Arkansas (Table 2B). Evidence suggests that adolescent obesity exceeds 20% in many counties located in the Deep South and Southern Appalachian regions.16
Alcohol An estimated 6% of cancer cases can be attributed to alcohol consumption,2 which increases the risk for cancers of the mouth, pharynx, larynx, esophagus, liver, colorectum, and female breast.17 Approximately three or more drinks per day may also increase the risk of stomach and pancreatic cancer.17, 18 Cancer risk increases with alcohol volume, and even a few drinks per week may be associated with a slightly elevated risk of female breast cancer.19 Combined with tobacco use, alcohol consumption increases the risk of cancers of the mouth, pharynx, larynx, and esophagus far more than the independent effect of either drinking or smoking alone.20
The American Cancer Society’s 2012 nutrition and physical activity guidelines recommend that people who drink alcohol should limit their intake to no more than two drinks per day for men and one drink per day for women.1, 21 The recommended limit is lower for women because of their smaller body size and slower metabolism of alcohol.
Defining Body Mass IndexBody mass index (BMI) is defined by an individual’s height and weight. For adults, a BMI of 25.0-29.9 kg/m2 is overweight; a BMI of ≥30.0 kg/m2 is obese. Excess body weight is defined as a BMI of ≥25.0 kg/m2. For youth (ages 2-20 years), BMI is based on percentile rankings of the individual’s height and weight on age- and sex-specific growth charts; BMIs between the 85th and 94.9th percentile are considered overweight, and BMIs at or above the 95th percentile are classified as obese. See Glossary (page 58) for more information.
Hei
ght (
cm)
Hei
ght (
ft, in
)
Weight (kg)
Weight (lb)
140
150
160
170
180
190
200
4’7”
4’11”
5’3”
5’7”
5’11”
6’3”
6’7”
140130120110100908070605040
30928726524322019817615413211088
40
302518.5
Underweight
Normal
Overweight
Obese
Extremely obese
BMI Categories for Adults
F: females, M: males, O: overall. *See sidebar above. Sources: National Health and Nutrition Examination Survey, 2015-2016. Fryar, 2018.11 Fryar, 2018.15
©2019, American Cancer Society, Inc., Surveillance Research
Perc
ent
Figure 2A. Excess Body Weight* (%), Youth and Adults, US, 2015-2016
Overweight Obese
0
20
40
60
80
100
OMFOMFOMFOMF
Children2-5 yrs
Children6-11 yrs
Adolescents12-19 yrs
Adults20+ yrs
13
26 26 2631
3734
4337
40
6874 71
14 14 1416
20 18
2120
21
41
3840
12 12 15 17 1622
16 1927
37 32
Cancer Prevention & Early Detection Facts & Figures 2019-2020 17
Moreover, recent results from the Global Burden of Disease indicated that the amount of alcohol consumption that minimized harm across health outcomes was zero.22
Alcohol Consumption• In 2017, 67% of adults reported current alcohol
consumption (12+ drinks in lifetime and ≥1 drink in past year).23
• About 6% of adults reported heavier drinking (men: >14 drinks/week, women: >7 drinks/week in past year) in 2017, ranging from 4% in Oklahoma, Utah, and West Virginia to 9% in the District of Columbia, Hawaii, and Maine (Table 2C).
Table 2A. Overweight and Obesity* (%), Adults 18 Years and Older by State, 2017
Overweight ObeseRank†
(1=high)
United States (median) 35 31Range 31-39 23-38
Alabama 34 36 3Alaska 33 34 8Arizona 35 29 30Arkansas 35 35 7California 36 25 46Colorado 36 23 50Connecticut 36 27 41Delaware 37 32 17District of Columbia 31 23 50Florida 36 28 35Georgia 34 32 17Hawaii 35 24 49Idaho 37 29 30Illinois 35 31 26Indiana 34 34 8Iowa 34 36 3Kansas 35 32 17Kentucky 34 34 8Louisiana 34 36 3Maine 36 29 30Maryland 35 31 26Massachusetts 36 26 44Michigan 35 32 17Minnesota 37 28 35Mississippi 33 37 2Missouri 35 32 17Montana 37 25 46Nebraska 36 33 13Nevada 39 27 41New Hampshire 37 28 35New Jersey 35 27 41New Mexico 37 28 35New York 36 26 44North Carolina 35 32 17North Dakota 36 33 13Ohio 34 34 8Oklahoma 34 36 3Oregon 35 29 30Pennsylvania 36 32 17Rhode Island 35 30 28South Carolina 34 34 8South Dakota 36 32 17Tennessee 35 33 13Texas 36 33 13Utah 35 25 46Vermont 35 28 35Virginia 36 30 28Washington 35 28 35West Virginia 34 38 1Wisconsin 35 32 17Wyoming 36 29 30Puerto Rico 35 33 –
*See sidebar, page 16. †Based on % obese. Note: Puerto Rico not included in range or median.
Source: Behavioral Risk Factor Surveillance System, 2017.
©2019, American Cancer Society, Inc., Surveillance Research
*See sidebar, page 16. †See Survey Sources (page 59).Source: National Center for Health Statistics, 2014.60 National Health and Nutrition Examination Surveys, 2011-2016.
©2019, American Cancer Society, Inc., Surveillance Research
Perc
ent
Perc
ent
Figure 2B. Obesity* Trends, Adults 20-74 Years by Sex and Race/Ethnicity†, US, 1976-2016
WhiteAsianHispanic
Mexican AmericanBlack
Males
Females
0
10
20
30
40
50
60
70
2015-20162011-20142007-20102003-20061999-20021988-19941976-1980
0
10
20
30
40
50
60
70
2015-20162011-20142007-20102003-20061999-20021988-19941976-1980
18 Cancer Prevention & Early Detection Facts & Figures 2019-2020
• In 2017, the prevalence of heavier drinking ranged from 2% in Asians to 6% in whites.23
• About 30% of high school students in 2017 reported alcohol consumption in the past month.24
DietAbout 4% of cancer cases can be attributed to poor diet.2 Unhealthy dietary patterns are associated with a higher risk of developing cancer (predominantly colon).25 In contrast, dietary patterns with an emphasis on a variety of fruits and vegetables, whole grains, legumes, and fish or poultry and fewer red and processed meats are associated with lower cancer risk26, 27 (see sidebar, page 20). One
*See sidebar, page 16. †See Survey Sources (page 59). Note: The 2015-16 estimate for Asian girls is not presented due to instability.Source: National Center for Health Statistics, 2014.60 National Center for Health Statistics, 2018.50 National Health and Nutrition Examination Survey, 2015-2016.
©2019, American Cancer Society, Inc., Surveillance Research
Perc
ent
Perc
ent
Figure 2C. Obesity* Trends, Adolescents 12-19 Years, by Sex and Race/Ethnicity†, US, 1976-2016
WhiteAsianHispanic
Mexican AmericanBlack
Males
Females
0
5
10
15
20
25
30
35
40
2015-20162011-20142007-20102003-20061999-20021988-19941976-1980
0
5
10
15
20
25
30
35
40
2015-20162011-20142007-20102003-20061999-20021988-19941976-1980
Table 2B. Overweight and Obesity* (%), High School Students by State, 2017
Overweight ObeseRank†
(1=high)
United States 16 15Range 12-18 10-22
Alabama – – –Alaska 18 14 20Arizona 16 12 33Arkansas 18 22 1California 15 14 20Colorado 12 10 39Connecticut 16 13 27Delaware 17 15 12District of Columbia 18 17 6Florida 14 11 37Georgia – – –Hawaii 14 14 20Idaho 15 11 37Illinois 16 15 12Indiana – – –Iowa 16 15 12Kansas 15 13 27Kentucky 16 20 3Louisiana 18 17 6Maine 16 14 20Maryland 15 13 27Massachusetts 14 12 33Michigan 16 17 6Minnesota – – –Mississippi – – –Missouri 16 17 6Montana 15 12 33Nebraska 17 15 12Nevada 14 14 20New Hampshire 14 13 27New Jersey – – –New Mexico 16 15 12New York 16 12 33North Carolina 16 15 12North Dakota 16 15 12Ohio – – –Oklahoma 17 17 6Oregon – – –Pennsylvania 16 14 20Rhode Island 16 15 12South Carolina 17 17 6South Dakota – – –Tennessee 18 21 2Texas 18 19 5Utah 13 10 39Vermont 14 13 27Virginia 16 13 27Washington – – –West Virginia 16 20 3Wisconsin 15 14 20Wyoming – – –Puerto Rico 13 11 –
*See sidebar, page 16. †Based on % obese. Note: Puerto Rico not included in range or national estimate. See Survey Sources (page 59) for more information regarding unavailable data.
Source: Kann L et al, 2018.24
©2019, American Cancer Society, Inc., Surveillance Research
Cancer Prevention & Early Detection Facts & Figures 2019-2020 19
review found that individuals with the healthiest diets have an 11%-24% lower risk of cancer death than those with the least healthy diet.28 Furthermore, improving diet quality over time is associated with an overall reduced risk of death.29
Processed Meats and Red MeatsProcessed meat (e.g., lunch meats, bacon, hot dogs) has been classified as a human carcinogen, and red meat (e.g., beef, lamb, pork) has been classified as a probable carcinogen based on the evidence of their association with increased colorectal cancer risk.30 While specific mechanisms are unknown, substances such as nitrates or nitrites used to preserve processed meats and heme iron in red meat can contribute to the formation of nitrosamines, which are involved in carcinogenesis.31-33 Smoking, curing, and cooking meat at high temperatures, such as pan frying or grilling, can form carcinogenic chemicals, which may also contribute to increased risk.34 In addition, fatty meats and fried meat are major sources of total fat, saturated fat, and cholesterol in the American diet.
Vegetables and FruitsVegetables (including legumes) and fruits contain numerous vitamins, minerals, fiber, carotenoids, and other bioactive substances that may help prevent cancer. There is probable evidence that greater consumption of non-starchy vegetables (e.g., broccoli, green beans, and lettuce) and fruits is associated with lower risk of mouth, pharynx, larynx, esophageal, and stomach cancers.17, 35 Evidence also suggests that higher vegetable intake may lower the risk of aggressive, hard-to-treat breast tumors.36, 37 The potential benefits of vegetable and fruit consumption on cancer risk may also stem from their replacement of more calorie-dense foods and associated maintenance of a healthy weight.38 For these reasons, consumption of low-calorie whole vegetables and fruits is encouraged.
Whole GrainsWhole-grain foods (made from the entire grain seed) are an important part of a healthful diet and relatively low in caloric density and high in fiber, vitamins, and minerals compared to refined flour products.21 Although evidence
Table 2C. Alcohol, Diet, and Physical Activity (%), Adults 18 Years and Older by State, 2017
Alcohol consumption*
Consumed ≥2 fruit
servings a day
Consumed ≥3 vegetable
servings a day
Met rec. levels of aerobic activity†
United States (median)
6 33 16 50
Range 4-9 20-40 10-27 42-60Alabama 5 24 12 43Alaska 8 33 19 58Arizona 5 33 16 53Arkansas 6 28 18 45California 6 37 17 57Colorado 7 36 19 59Connecticut 5 38 18 52Delaware 6 33 14 46District of Columbia 9 35 27 49Florida 6 34 16 50Georgia 5 32 16 46Hawaii 9 33 19 57Idaho 7 35 17 55Illinois 6 35 16 53Indiana 6 31 16 46Iowa 7 32 14 50Kansas 6 31 16 49Kentucky 6 26 13 45Louisiana 7 29 14 45Maine 9 38 22 53Maryland 5 36 17 51Massachusetts 7 36 17 51Michigan 7 33 13 50Minnesota 7 36 15 51Mississippi 5 27 14 45Missouri 6 26 12 47Montana 8 27 13 55Nebraska 7 33 15 49Nevada 6 27 11 47New Hampshire 8 39 20 54New Jersey 5 34 14 49New Mexico 6 32 15 54New York 6 36 16 49North Carolina 6 31 17 49North Dakota 7 32 16 46Ohio 7 30 13 48Oklahoma 4 22 10 42Oregon 8 37 19 57Pennsylvania 6 34 16 53Rhode Island 7 37 18 51South Carolina 7 29 13 49South Dakota 6 30 13 51Tennessee 5 30 18 47Texas 7 33 16 42Utah 4 34 13 54Vermont 8 40 21 60Virginia 6 33 17 51Washington 6 37 19 58West Virginia 4 20 11 48Wisconsin 8 36 16 57Wyoming 8 32 15 54Puerto Rico 5 14 3 20
*Men: >14 drinks per week, women: >7 drinks per week. †Includes 150 minutes of moderate-intensity or 75 minutes of vigorous-intensity activity each week. Note: Puerto Rico not included in range or median.
Source: Behavioral Risk Factor Surveillance System, 2017.
©2019 American Cancer Society, Inc., Surveillance Research
20 Cancer Prevention & Early Detection Facts & Figures 2019-2020
of the association between whole-grain foods and different types of cancer is limited, studies support the role of a diet high in whole-grain foods and fiber in reducing the risk of colorectal cancer. Some evidence also shows reduced mortality with increased fiber intake after a colorectal cancer diagnosis.39
Adult Dietary Patterns • Consumption of total fruit and vegetables and of
processed meats has not changed since 1999; although, from 1999-2000 to 2011-2012, there was an increase in consumption of whole grains, nuts, and seeds.40
• Despite a decrease in sugar sweetened beverages (SSBs) consumption since 1999-2000,40 in 2011-2014, about 50% of adults consumed at least one on a given day, and these beverages accounted for 6%-7% of daily caloric intake.41
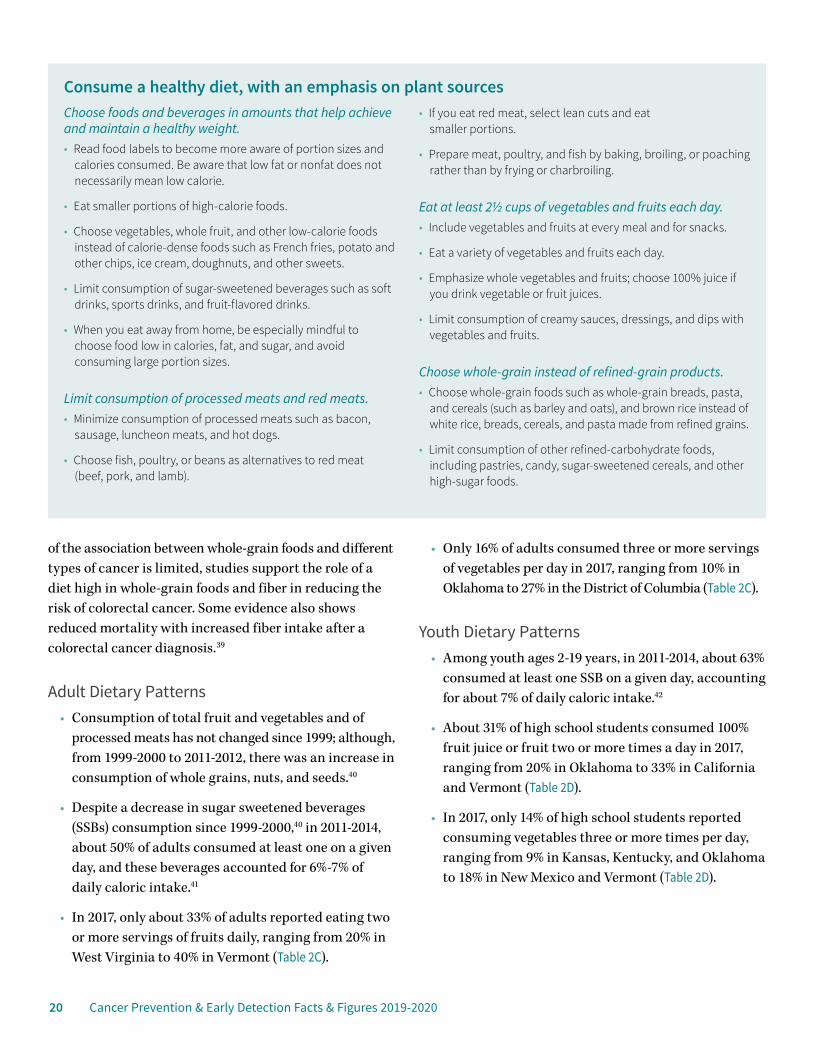
• In 2017, only about 33% of adults reported eating two or more servings of fruits daily, ranging from 20% in West Virginia to 40% in Vermont (Table 2C).
• Only 16% of adults consumed three or more servings of vegetables per day in 2017, ranging from 10% in Oklahoma to 27% in the District of Columbia (Table 2C).
Youth Dietary Patterns • Among youth ages 2-19 years, in 2011-2014, about 63%
consumed at least one SSB on a given day, accounting for about 7% of daily caloric intake.42
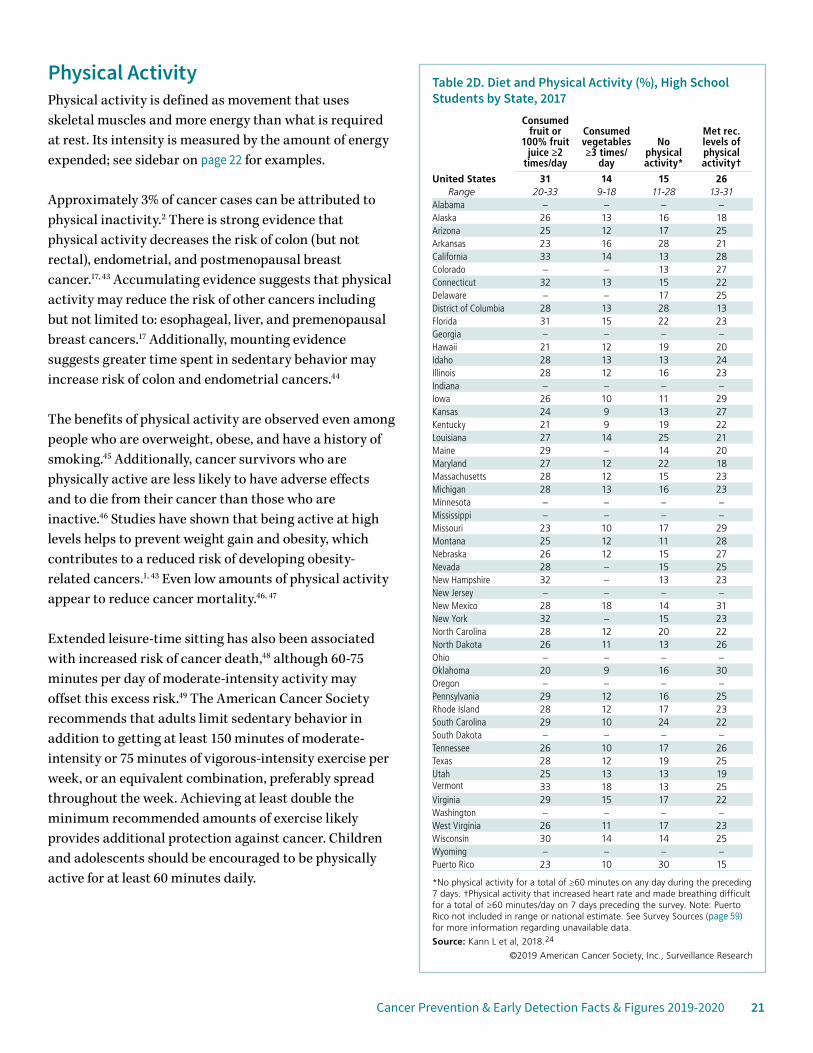
• About 31% of high school students consumed 100% fruit juice or fruit two or more times a day in 2017, ranging from 20% in Oklahoma to 33% in California and Vermont (Table 2D).
• In 2017, only 14% of high school students reported consuming vegetables three or more times per day, ranging from 9% in Kansas, Kentucky, and Oklahoma to 18% in New Mexico and Vermont (Table 2D).
Consume a healthy diet, with an emphasis on plant sourcesChoose foods and beverages in amounts that help achieve and maintain a healthy weight.• Read food labels to become more aware of portion sizes and
calories consumed. Be aware that low fat or nonfat does not necessarily mean low calorie.
• Eat smaller portions of high-calorie foods.
• Choose vegetables, whole fruit, and other low-calorie foods instead of calorie-dense foods such as French fries, potato and other chips, ice cream, doughnuts, and other sweets.
• Limit consumption of sugar-sweetened beverages such as soft drinks, sports drinks, and fruit-flavored drinks.
• When you eat away from home, be especially mindful to choose food low in calories, fat, and sugar, and avoid consuming large portion sizes.
Limit consumption of processed meats and red meats.• Minimize consumption of processed meats such as bacon,
sausage, luncheon meats, and hot dogs.
• Choose fish, poultry, or beans as alternatives to red meat (beef, pork, and lamb).
• If you eat red meat, select lean cuts and eat smaller portions.
• Prepare meat, poultry, and fish by baking, broiling, or poaching rather than by frying or charbroiling.
Eat at least 2½ cups of vegetables and fruits each day.• Include vegetables and fruits at every meal and for snacks.
• Eat a variety of vegetables and fruits each day.
• Emphasize whole vegetables and fruits; choose 100% juice if you drink vegetable or fruit juices.
• Limit consumption of creamy sauces, dressings, and dips with vegetables and fruits.
Choose whole-grain instead of refined-grain products.• Choose whole-grain foods such as whole-grain breads, pasta,
and cereals (such as barley and oats), and brown rice instead of white rice, breads, cereals, and pasta made from refined grains.
• Limit consumption of other refined-carbohydrate foods, including pastries, candy, sugar-sweetened cereals, and other high-sugar foods.
Cancer Prevention & Early Detection Facts & Figures 2019-2020 21
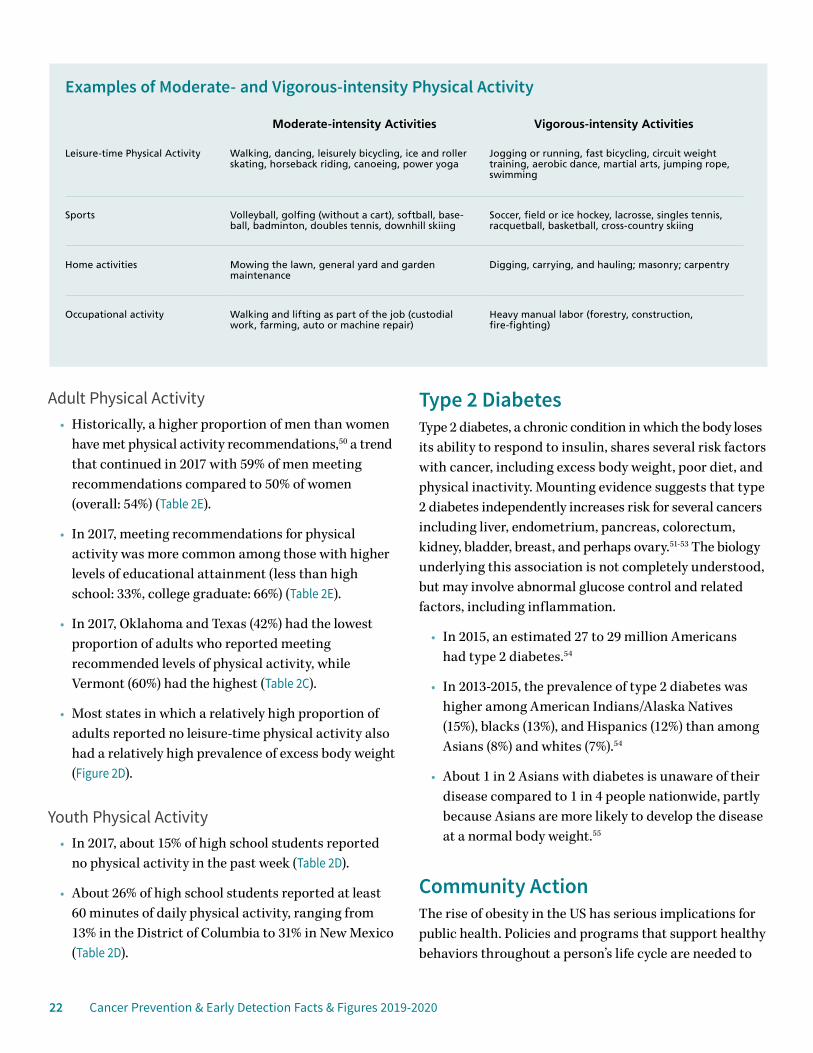
Physical ActivityPhysical activity is defined as movement that uses skeletal muscles and more energy than what is required at rest. Its intensity is measured by the amount of energy expended; see sidebar on page 22 for examples.
Approximately 3% of cancer cases can be attributed to physical inactivity.2 There is strong evidence that physical activity decreases the risk of colon (but not rectal), endometrial, and postmenopausal breast cancer.17, 43 Accumulating evidence suggests that physical activity may reduce the risk of other cancers including but not limited to: esophageal, liver, and premenopausal breast cancers.17 Additionally, mounting evidence suggests greater time spent in sedentary behavior may increase risk of colon and endometrial cancers.44
The benefits of physical activity are observed even among people who are overweight, obese, and have a history of smoking.45 Additionally, cancer survivors who are physically active are less likely to have adverse effects and to die from their cancer than those who are inactive.46 Studies have shown that being active at high levels helps to prevent weight gain and obesity, which contributes to a reduced risk of developing obesity-related cancers.1, 43 Even low amounts of physical activity appear to reduce cancer mortality.46, 47
Extended leisure-time sitting has also been associated with increased risk of cancer death,48 although 60-75 minutes per day of moderate-intensity activity may offset this excess risk.49 The American Cancer Society recommends that adults limit sedentary behavior in addition to getting at least 150 minutes of moderate-intensity or 75 minutes of vigorous-intensity exercise per week, or an equivalent combination, preferably spread throughout the week. Achieving at least double the minimum recommended amounts of exercise likely provides additional protection against cancer. Children and adolescents should be encouraged to be physically active for at least 60 minutes daily.
Table 2D. Diet and Physical Activity (%), High School Students by State, 2017
Consumed fruit or
100% fruit juice ≥2
times/day
Consumed vegetables ≥3 times/
day
No physical activity*
Met rec. levels of physical activity†
United States 31 14 15 26Range 20-33 9-18 11-28 13-31
Alabama – – – –Alaska 26 13 16 18Arizona 25 12 17 25Arkansas 23 16 28 21California 33 14 13 28Colorado – – 13 27Connecticut 32 13 15 22Delaware – – 17 25District of Columbia 28 13 28 13Florida 31 15 22 23Georgia – – – –Hawaii 21 12 19 20Idaho 28 13 13 24Illinois 28 12 16 23Indiana – – – –Iowa 26 10 11 29Kansas 24 9 13 27Kentucky 21 9 19 22Louisiana 27 14 25 21Maine 29 – 14 20Maryland 27 12 22 18Massachusetts 28 12 15 23Michigan 28 13 16 23Minnesota – – – –Mississippi – – – –Missouri 23 10 17 29Montana 25 12 11 28Nebraska 26 12 15 27Nevada 28 – 15 25New Hampshire 32 – 13 23New Jersey – – – –New Mexico 28 18 14 31New York 32 – 15 23North Carolina 28 12 20 22North Dakota 26 11 13 26Ohio – – – –Oklahoma 20 9 16 30Oregon – – – –Pennsylvania 29 12 16 25Rhode Island 28 12 17 23South Carolina 29 10 24 22South Dakota – – – –Tennessee 26 10 17 26Texas 28 12 19 25Utah 25 13 13 19Vermont 33 18 13 25Virginia 29 15 17 22Washington – – – –West Virginia 26 11 17 23Wisconsin 30 14 14 25Wyoming – – – –Puerto Rico 23 10 30 15
*No physical activity for a total of ≥60 minutes on any day during the preceding 7 days. †Physical activity that increased heart rate and made breathing difficult for a total of ≥60 minutes/day on 7 days preceding the survey. Note: Puerto Rico not included in range or national estimate. See Survey Sources (page 59) for more information regarding unavailable data.
Source: Kann L et al, 2018.24
©2019 American Cancer Society, Inc., Surveillance Research
22 Cancer Prevention & Early Detection Facts & Figures 2019-2020
Adult Physical Activity• Historically, a higher proportion of men than women
have met physical activity recommendations,50 a trend that continued in 2017 with 59% of men meeting recommendations compared to 50% of women (overall: 54%) (Table 2E).
• In 2017, meeting recommendations for physical activity was more common among those with higher levels of educational attainment (less than high school: 33%, college graduate: 66%) (Table 2E).
• In 2017, Oklahoma and Texas (42%) had the lowest proportion of adults who reported meeting recommended levels of physical activity, while Vermont (60%) had the highest (Table 2C).
• Most states in which a relatively high proportion of adults reported no leisure-time physical activity also had a relatively high prevalence of excess body weight (Figure 2D).
Youth Physical Activity• In 2017, about 15% of high school students reported
no physical activity in the past week (Table 2D).
• About 26% of high school students reported at least 60 minutes of daily physical activity, ranging from 13% in the District of Columbia to 31% in New Mexico (Table 2D).
Type 2 DiabetesType 2 diabetes, a chronic condition in which the body loses its ability to respond to insulin, shares several risk factors with cancer, including excess body weight, poor diet, and physical inactivity. Mounting evidence suggests that type 2 diabetes independently increases risk for several cancers including liver, endometrium, pancreas, colorectum, kidney, bladder, breast, and perhaps ovary.51-53 The biology underlying this association is not completely understood, but may involve abnormal glucose control and related factors, including inflammation.
• In 2015, an estimated 27 to 29 million Americans had type 2 diabetes.54
• In 2013-2015, the prevalence of type 2 diabetes was higher among American Indians/Alaska Natives (15%), blacks (13%), and Hispanics (12%) than among Asians (8%) and whites (7%).54
• About 1 in 2 Asians with diabetes is unaware of their disease compared to 1 in 4 people nationwide, partly because Asians are more likely to develop the disease at a normal body weight.55
Community ActionThe rise of obesity in the US has serious implications for public health. Policies and programs that support healthy behaviors throughout a person’s life cycle are needed to
Examples of Moderate- and Vigorous-intensity Physical Activity
Moderate-intensity Activities Vigorous-intensity Activities
Leisure-time Physical Activity Walking, dancing, leisurely bicycling, ice and roller skating, horseback riding, canoeing, power yoga
Jogging or running, fast bicycling, circuit weight training, aerobic dance, martial arts, jumping rope, swimming
Sports Volleyball, golfing (without a cart), softball, base-ball, badminton, doubles tennis, downhill skiing
Soccer, field or ice hockey, lacrosse, singles tennis, racquetball, basketball, cross-country skiing
Home activities Mowing the lawn, general yard and garden maintenance
Digging, carrying, and hauling; masonry; carpentry
Occupational activity Walking and lifting as part of the job (custodial work, farming, auto or machine repair)
Heavy manual labor (forestry, construction, fire-fighting)
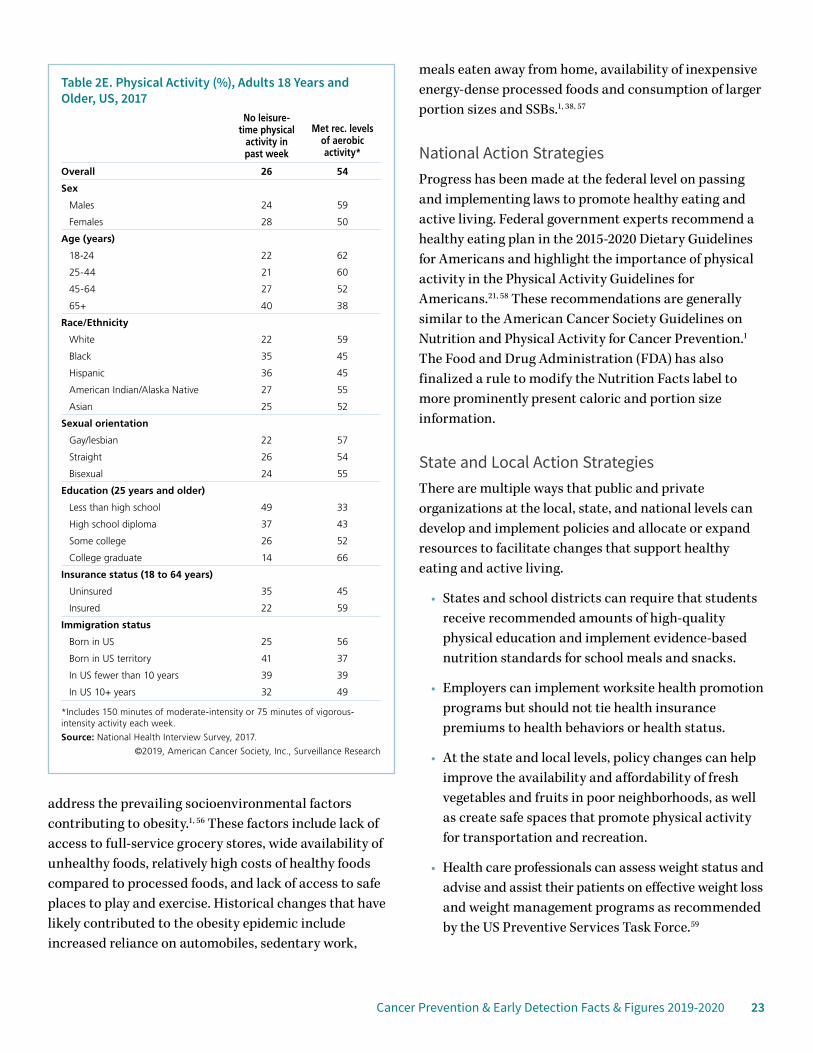
Cancer Prevention & Early Detection Facts & Figures 2019-2020 23
address the prevailing socioenvironmental factors contributing to obesity.1, 56 These factors include lack of access to full-service grocery stores, wide availability of unhealthy foods, relatively high costs of healthy foods compared to processed foods, and lack of access to safe places to play and exercise. Historical changes that have likely contributed to the obesity epidemic include increased reliance on automobiles, sedentary work,
meals eaten away from home, availability of inexpensive energy-dense processed foods and consumption of larger portion sizes and SSBs.1, 38, 57
National Action StrategiesProgress has been made at the federal level on passing and implementing laws to promote healthy eating and active living. Federal government experts recommend a healthy eating plan in the 2015-2020 Dietary Guidelines for Americans and highlight the importance of physical activity in the Physical Activity Guidelines for Americans.21, 58 These recommendations are generally similar to the American Cancer Society Guidelines on Nutrition and Physical Activity for Cancer Prevention.1 The Food and Drug Administration (FDA) has also finalized a rule to modify the Nutrition Facts label to more prominently present caloric and portion size information.
State and Local Action StrategiesThere are multiple ways that public and private organizations at the local, state, and national levels can develop and implement policies and allocate or expand resources to facilitate changes that support healthy eating and active living.
• States and school districts can require that students receive recommended amounts of high-quality physical education and implement evidence-based nutrition standards for school meals and snacks.
• Employers can implement worksite health promotion programs but should not tie health insurance premiums to health behaviors or health status.
• At the state and local levels, policy changes can help improve the availability and affordability of fresh vegetables and fruits in poor neighborhoods, as well as create safe spaces that promote physical activity for transportation and recreation.
• Health care professionals can assess weight status and advise and assist their patients on effective weight loss and weight management programs as recommended by the US Preventive Services Task Force.59
Table 2E. Physical Activity (%), Adults 18 Years and Older, US, 2017
No leisure- time physical
activity in past week
Met rec. levels of aerobic activity*
Overall 26 54
Sex
Males 24 59
Females 28 50
Age (years)
18-24 22 62
25-44 21 60
45-64 27 52
65+ 40 38
Race/Ethnicity
White 22 59
Black 35 45
Hispanic 36 45
American Indian/Alaska Native 27 55
Asian 25 52
Sexual orientation
Gay/lesbian 22 57
Straight 26 54
Bisexual 24 55
Education (25 years and older)
Less than high school 49 33
High school diploma 37 43
Some college 26 52
College graduate 14 66
Insurance status (18 to 64 years)
Uninsured 35 45
Insured 22 59
Immigration status
Born in US 25 56
Born in US territory 41 37
In US fewer than 10 years 39 39
In US 10+ years 32 49
*Includes 150 minutes of moderate-intensity or 75 minutes of vigorous- intensity activity each week.
Source: National Health Interview Survey, 2017.
©2019, American Cancer Society, Inc., Surveillance Research
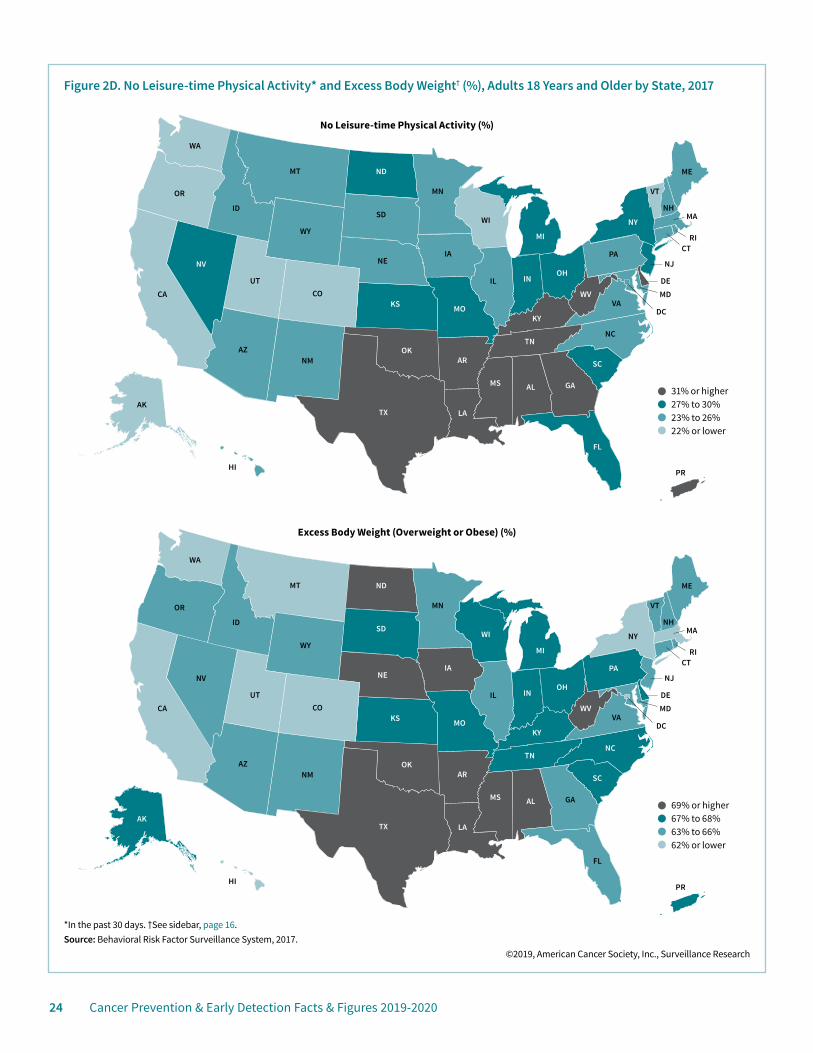
24 Cancer Prevention & Early Detection Facts & Figures 2019-2020
Figure 2D. No Leisure-time Physical Activity* and Excess Body Weight† (%), Adults 18 Years and Older by State, 2017
AL
AZAR
CA CO
CT
DE
FL
GA
ID
IL IN
IA
KS
KY
LA
ME
MD
MA
MN
MS
MO
MT
NENV
NH
NJ
NM
NY
NC
PR
ND
OH
OK
OR
PA
RI
SC
SD
TN
TX
UT
VT
VA
WA
WV
WIWY
DC
AK
HI
MI
*In the past 30 days. †See sidebar, page 16.Source: Behavioral Risk Factor Surveillance System, 2017.
©2019, American Cancer Society, Inc., Surveillance Research
31% or higher27% to 30%23% to 26%22% or lower
69% or higher67% to 68%63% to 66%62% or lower
AL
AZAR
CA CO
CT
DE
FL
GA
ID
IL IN
IA
KS
KY
LA
ME
MD
MA
MN
MS
MO
MT
NENV
NH
NJ
NM
NY
NC
ND
OH
OK
OR
PA
RI
SC
SD
TN
TX
UT
VT
VA
WA
WV
WIWY
DC
AK
HI
MI
Excess Body Weight (Overweight or Obese) (%)
No Leisure-time Physical Activity (%)
PR
Cancer Prevention & Early Detection Facts & Figures 2019-2020 25
Initiatives of the American Cancer Society/American Cancer Society Cancer Action NetworkThe American Cancer Society and the American Cancer Society Cancer Action NetworkSM (ACS CAN), our nonprofit, nonpartisan advocacy affiliate, also have specific initiatives to address excess body weight and physical inactivity by promoting healthy eating and active living. Such initiatives include but are not limited to nutrition and physical activity research and working with communities to help identify and address barriers to healthy eating and active living. ACS CAN also supports well-designed taxes on SSBs as a component of multifaceted efforts to promote healthy eating and active living. Visit fightcancer.org to learn more about ACS CAN’s initiatives and to view the most recent edition of How Do You Measure Up? – a state-by-state assessment of cancer care and control efforts.
References1. Kushi LH, Doyle C, McCullough M, et al. American Cancer Society Guidelines on Nutrition and Physical Activity for cancer prevention: reducing the risk of cancer with healthy food choices and physical activity. CA Cancer J Clin. 2012;62(1): 30-67.2. Islami F, Goding Sauer A, Miller KD, et al. Proportion and number of cancer cases and deaths attributable to potentially modifiable risk factors in the United States. CA Cancer J Clin. 2018;68: 31-54.3. Kabat GC, Matthews CE, Kamensky V, Hollenbeck AR, Rohan TE. Adherence to cancer prevention guidelines and cancer incidence, cancer mortality, and total mortality: a prospective cohort study. Am J Clin Nutr. 2015;101: 558-569.4. Jones LW, Demark-Wahnefried W. Diet, exercise, and complementary therapies after primary treatment for cancer. Lancet Oncol. 2006;7: 1017-1026.5. Rock CL, Doyle C, Demark-Wahnefried W, et al. Nutrition and physical activity guidelines for cancer survivors. CA Cancer J Clin. 2012;62: 243-274.6. Islami F, Goding Sauer A, Gapstur SM, Jemal A. Proportion of Cancer Cases Attributable to Excess Body Weight by US State, 2011-2015. JAMA Oncol. 2018.7. Lauby-Secretan B, Scoccianti C, Loomis D, Grosse Y, Bianchini F, Straif K. Body Fatness and Cancer – Viewpoint of the IARC Working Group. N Engl J Med. 2016;375: 794-798.8. Demark-Wahnefried W, Platz EA, Ligibel JA, et al. The role of obesity in cancer survival and recurrence. Cancer Epidemiol Biomarkers Prev. 2012;21: 1244-1259.9. Birks S, Peeters A, Backholer K, O’Brien P, Brown W. A systematic review of the impact of weight loss on cancer incidence and mortality. Obes Rev. 2012;13: 868-891.10. Song M, Willett WC, Hu FB, et al. Trajectory of body shape across the lifespan and cancer risk. Int J Cancer. 2016;138: 2383-2395.
11. Fryar CD, Carroll MD, Ogden CL. Prevalence of Overweight, Obesity, and Severe Obesity Among Adults Aged 20 and Over: United States, 1960-1962 Through 2015-2016. National Center for Health Statistics Health E-Stats. 2018.12. Lundeen EA, Park S, Pan L, O’Toole T, Matthews K, Blanck HD. Obesity Prevalence Among Adults Living in Metropolitan and Nonmetropolitan Counties – United States, 2016. MMWR Morb Mortal Wkly Rep. 2018;67: 653-658.13. Stokes A, Ni Y, Preston SH. Prevalence and Trends in Lifetime Obesity in the U.S., 1988-2014. Am J Prev Med. 2017;53: 567-575.14. Martin CB, Herrick KA, Sarafrazi N, Ogden CL. Attempts to Lose Weight Among Adults in the United States, 2013-2016. NCHS Data Brief. 2018.15. Fryar CD, Carroll MD, Ogden CL. Prevalence of Overweight, Obesity, and Severe Obesity Among Children and Adolescents Aged 2-19 Years: United States, 1963-1965 Through 2015-2016. National Center for Health Statistics Health E-Stats. 2018.16. Kramer MR, Raskind IG, Van Dyke ME, Matthews SA, Cook-Smith JN. Geography of Adolescent Obesity in the U.S., 2007-2011. Am J Prev Med. 2016;51: 898-909.17. World Cancer Research Fund and American Institute for Cancer Research. Continuous Update Project Available from URL: https://www.wcrf.org/dietandcancer/contents Accessed August 17, 2018.18. Bagnardi V, Rota M, Botteri E, et al. Alcohol consumption and site-specific cancer risk: a comprehensive dose-response meta-analysis. Br J Cancer. 2015;112: 580-593.19. Chen WY, Rosner B, Hankinson SE, Colditz GA, Willett WC. Moderate alcohol consumption during adult life, drinking patterns, and breast cancer risk. JAMA. 2011;306: 1884-1890.20. International Agency for Research on Cancer. IARC Monographs on the Evaluation of Carcinogenic Risks to Humans. Alcohol Consumption and Ethyl Carbamate. Lyon, France: International Agency for Research on Cancer, 2010.21. US Department of Health and Human Services and US Department of Agriculture. 2015-2020 Dietary Guidelines for Americans, 2015.22. GBD 2016 Alcohol Collaborators. Alcohol use and burden for 195 countries and territories, 1990-2016: a systematic analysis for the Global Burden of Disease Study 2016. Lancet. 2018;392: 1015-1035.23. National Center for Health Statistics. National Health Interview Survey, 2017. Public-use data file and documentation. Available from URL: http://www.cdc.gov/nchs/nhis/quest_data_related_1997_forward.htm Accessed July 9, 2018.24. Kann L, McManus T, Harris WA, et al. Youth Risk Behavior Surveillance – United States, 2017. MMWR Surveill Summ. 2018;67: 1-114.25. Grosso G, Bella F, Godos J, et al. Possible role of diet in cancer: systematic review and multiple meta-analyses of dietary patterns, lifestyle factors, and cancer risk. Nutr Rev. 2017;75: 405-419.26. Schwingshackl L, Hoffmann G. Adherence to Mediterranean diet and risk of cancer: an updated systematic review and meta-analysis of observational studies. Cancer Med. 2015;4: 1933-1947.27. Schwingshackl L, Bogensberger B, Hoffmann G. Diet Quality as Assessed by the Healthy Eating Index, Alternate Healthy Eating Index, Dietary Approaches to Stop Hypertension Score, and Health Outcomes: An Updated Systematic Review and Meta-Analysis of Cohort Studies. J Acad Nutr Diet. 2018;118: 74-100.e111.
26 Cancer Prevention & Early Detection Facts & Figures 2019-2020
28. Liese AD, Krebs-Smith SM, Subar AF, et al. The Dietary Patterns Methods Project: synthesis of findings across cohorts and relevance to dietary guidance. J Nutr. 2015;145: 393-402.29. Sotos-Prieto M, Bhupathiraju SN, Mattei J, et al. Association of Changes in Diet Quality with Total and Cause-Specific Mortality. N Engl J Med. 2017;377: 143-153.30. Bouvard V, Loomis D, Guyton KZ, et al. Carcinogenicity of consumption of red and processed meat. Lancet Oncol. 2015;16: 1599-1600.31. Sinha R, Cross AJ, Graubard BI, Leitzmann MF, Schatzkin A. Meat intake and mortality: a prospective study of over half a million people. Arch Intern Med. 2009;169: 562-571.32. Joosen AM, Kuhnle GG, Aspinall SM, et al. Effect of processed and red meat on endogenous nitrosation and DNA damage. Carcinogenesis. 2009;30: 1402-1407.33. Cross AJ, Pollock JR, Bingham SA. Haem, not protein or inorganic iron, is responsible for endogenous intestinal N-nitrosation arising from red meat. Cancer Res. 2003;63: 2358-2360.34. Sinha R, Rothman N, Salmon CP, et al. Heterocyclic amine content in beef cooked by different methods to varying degrees of doneness and gravy made from meat drippings. Food Chem Toxicol. 1998;36: 279-287.35. World Cancer Research Fund and American Institute for Cancer Research. Diet and Cancer Report. Washington DC: Research Fund and American Institute for Cancer Research, 2007.36. Farvid MS, Chen WY, Rosner BA, Tamimi RM, Willett WC, Eliassen AH. Fruit and vegetable consumption and breast cancer incidence: Repeated measures over 30 years of follow-up. Int J Cancer. 2018.37. Emaus MJ, Peeters PH, Bakker MF, et al. Vegetable and fruit consumption and the risk of hormone receptor-defined breast cancer in the EPIC cohort. Am J Clin Nutr. 2016;103: 168-177.38. Krebs-Smith SM, Guenther PM, Subar AF, Kirkpatrick SI, Dodd KW. Americans do not meet federal dietary recommendations. J Nutr. 2010;140: 1832-1838.39. Song M, Wu K, Meyerhardt JA, et al. Fiber Intake and Survival After Colorectal Cancer Diagnosis. JAMA Oncol. 2018;4: 71-79.40. Rehm CD, Penalvo JL, Afshin A, Mozaffarian D. Dietary Intake Among US Adults, 1999-2012. JAMA. 2016;315: 2542-2553.41. Rosinger A, Herrick K, Gahche J, Park S. Sugar-sweetened beverage consumption among U.S. adults, 2011-2014. NCHS Data Brief. 2017.42. Rosinger A, Herrick K, Gahche J, Park S. Sugar-sweetened beverage consumption among U.S. youth, 2011-2014. NCHS Data Brief. 2017.43. International Agency for Research on Cancer. IARC Handbooks of Cancer Prevention. Volume 6: Weight Control and Physical Activity. Lyon, France: IARC Press, 2002.44. Kerr J, Anderson C, Lippman SM. Physical activity, sedentary behaviour, diet, and cancer: an update and emerging new evidence. Lancet Oncol. 2017;18: e457-e471.45. Moore SC, Lee IM, Weiderpass E, et al. Association of Leisure-Time Physical Activity With Risk of 26 Types of Cancer in 1.44 Million Adults. JAMA Intern Med. 2016;176: 816-825.46. Cormie P, Zopf EM, Zhang X, Schmitz KH. The Impact of Exercise on Cancer Mortality, Recurrence, and Treatment-Related Adverse Effects. Epidemiol Rev. 2017;39: 71-92.
47. O’Donovan G, Lee IM, Hamer M, Stamatakis ED. Association of “Weekend Warrior” and Other Leisure Time Physical Activity Patterns With Risks for All-Cause, Cardiovascular Disease, and Cancer Mortality. JAMA Intern Med. 2017;177: 335-342.48. Patel AV, Maliniak ML, Rees-Punia E, Matthews CE, Gapstur SM. Prolonged Leisure-Time Spent Sitting in Relation to Cause-specific Mortality in a Large U.S. Cohort. Am J Epidemiol. 2018;187: 2151-2158.49. Ekelund U, Steene-Johannessen J, Brown WJ, et al. Does physical activity attenuate, or even eliminate, the detrimental association of sitting time with mortality? A harmonised meta-analysis of data from more than 1 million men and women. Lancet. 2016;388: 1302-1310.50. National Center for Health Statistics. Health, United States, 2017: With special feature on mortality. Hyattsville, MD, 2018.51. Giovannucci E, Harlan DM, Archer MC, et al. Diabetes and cancer: a consensus report. CA Cancer J Clin. 2010;60: 207-221.52. Bao C, Yang X, Xu W, et al. Diabetes mellitus and incidence and mortality of kidney cancer: a meta-analysis. J Diabetes Complications. 2013;27: 357-364.53. Wang L, Wang L, Zhang J, Wang B, Liu HD. Association between diabetes mellitus and subsequent ovarian cancer in women: A systematic review and meta-analysis of cohort studies. Medicine. 2017;96: e6396.54. Centers for Disease Control and Prevention. National Diabetes Statistics Report 2017. Atlanta, GA: Centers for Disease Control and Prevention, U.S. Dept of Health and Human Services, 2017.55. National Center for Chronic Disease Prevention and Health Promotion, Division of Diabetes Translation. Diabetes and Asian Americans. Available from URL: https://www.cdc.gov/diabetes/library/spotlights/diabetes-asian-americans.html Accessed August 22, 2018.56. Kumanyika SK, Obarzanek E, Stettler N, et al. Population-based prevention of obesity: the need for comprehensive promotion of healthful eating, physical activity, and energy balance: a scientific statement from American Heart Association Council on Epidemiology and Prevention, Interdisciplinary Committee for Prevention (formerly the expert panel on population and prevention science). Circulation. 2008;118: 428-464.57. Darmon N, Drewnowski A. Does social class predict diet quality? Am J Clin Nutr. 2008;87: 1107-1117.58. US Department of Health and Human Services. Physical Activity Guidelines for Americans. Washington, DC: Department of Health and Human Services, 2018.59. Moyer VA. Screening for and management of obesity in adults: U.S. Preventive Services Task Force recommendation statement. Ann Intern Med. 2012;157: 373-378.60. National Center for Health Statistics. Health, United States, 2013: With a Special Feature on Prescription Drugs. Hyattsville, MD, 2014.
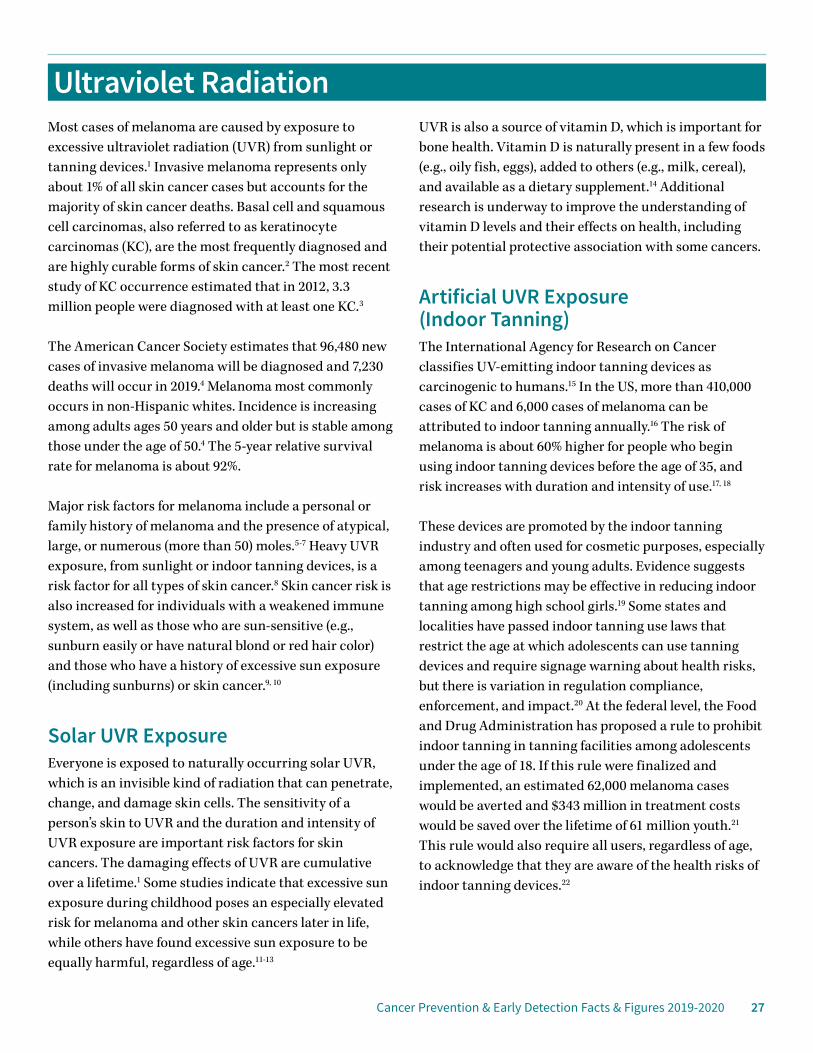
Cancer Prevention & Early Detection Facts & Figures 2019-2020 27
Ultraviolet RadiationMost cases of melanoma are caused by exposure to excessive ultraviolet radiation (UVR) from sunlight or tanning devices.1 Invasive melanoma represents only about 1% of all skin cancer cases but accounts for the majority of skin cancer deaths. Basal cell and squamous cell carcinomas, also referred to as keratinocyte carcinomas (KC), are the most frequently diagnosed and are highly curable forms of skin cancer.2 The most recent study of KC occurrence estimated that in 2012, 3.3 million people were diagnosed with at least one KC.3
The American Cancer Society estimates that 96,480 new cases of invasive melanoma will be diagnosed and 7,230 deaths will occur in 2019.4 Melanoma most commonly occurs in non-Hispanic whites. Incidence is increasing among adults ages 50 years and older but is stable among those under the age of 50.4 The 5-year relative survival rate for melanoma is about 92%.
Major risk factors for melanoma include a personal or family history of melanoma and the presence of atypical, large, or numerous (more than 50) moles.5-7 Heavy UVR exposure, from sunlight or indoor tanning devices, is a risk factor for all types of skin cancer.8 Skin cancer risk is also increased for individuals with a weakened immune system, as well as those who are sun-sensitive (e.g., sunburn easily or have natural blond or red hair color) and those who have a history of excessive sun exposure (including sunburns) or skin cancer.9, 10
Solar UVR ExposureEveryone is exposed to naturally occurring solar UVR, which is an invisible kind of radiation that can penetrate, change, and damage skin cells. The sensitivity of a person’s skin to UVR and the duration and intensity of UVR exposure are important risk factors for skin cancers. The damaging effects of UVR are cumulative over a lifetime.1 Some studies indicate that excessive sun exposure during childhood poses an especially elevated risk for melanoma and other skin cancers later in life, while others have found excessive sun exposure to be equally harmful, regardless of age.11-13
UVR is also a source of vitamin D, which is important for bone health. Vitamin D is naturally present in a few foods (e.g., oily fish, eggs), added to others (e.g., milk, cereal), and available as a dietary supplement.14 Additional research is underway to improve the understanding of vitamin D levels and their effects on health, including their potential protective association with some cancers.
Artificial UVR Exposure (Indoor Tanning)The International Agency for Research on Cancer classifies UV-emitting indoor tanning devices as carcinogenic to humans.15 In the US, more than 410,000 cases of KC and 6,000 cases of melanoma can be attributed to indoor tanning annually.16 The risk of melanoma is about 60% higher for people who begin using indoor tanning devices before the age of 35, and risk increases with duration and intensity of use.17, 18
These devices are promoted by the indoor tanning industry and often used for cosmetic purposes, especially among teenagers and young adults. Evidence suggests that age restrictions may be effective in reducing indoor tanning among high school girls.19 Some states and localities have passed indoor tanning use laws that restrict the age at which adolescents can use tanning devices and require signage warning about health risks, but there is variation in regulation compliance, enforcement, and impact.20 At the federal level, the Food and Drug Administration has proposed a rule to prohibit indoor tanning in tanning facilities among adolescents under the age of 18. If this rule were finalized and implemented, an estimated 62,000 melanoma cases would be averted and $343 million in treatment costs would be saved over the lifetime of 61 million youth.21 This rule would also require all users, regardless of age, to acknowledge that they are aware of the health risks of indoor tanning devices.22
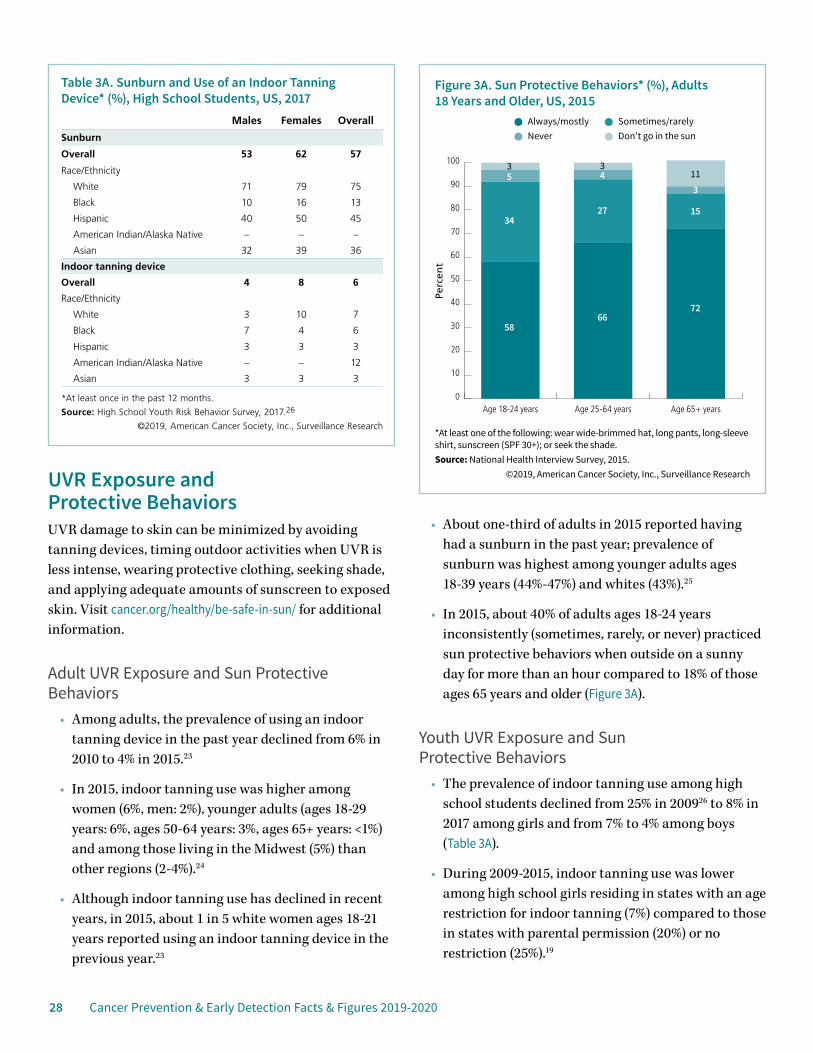
28 Cancer Prevention & Early Detection Facts & Figures 2019-2020
UVR Exposure and Protective BehaviorsUVR damage to skin can be minimized by avoiding tanning devices, timing outdoor activities when UVR is less intense, wearing protective clothing, seeking shade, and applying adequate amounts of sunscreen to exposed skin. Visit cancer.org/healthy/be-safe-in-sun/ for additional information.
Adult UVR Exposure and Sun Protective Behaviors
• Among adults, the prevalence of using an indoor tanning device in the past year declined from 6% in 2010 to 4% in 2015.23
• In 2015, indoor tanning use was higher among women (6%, men: 2%), younger adults (ages 18-29 years: 6%, ages 50-64 years: 3%, ages 65+ years: <1%) and among those living in the Midwest (5%) than other regions (2-4%).24
• Although indoor tanning use has declined in recent years, in 2015, about 1 in 5 white women ages 18-21 years reported using an indoor tanning device in the previous year.23
• About one-third of adults in 2015 reported having had a sunburn in the past year; prevalence of sunburn was highest among younger adults ages 18-39 years (44%-47%) and whites (43%).25
• In 2015, about 40% of adults ages 18-24 years inconsistently (sometimes, rarely, or never) practiced sun protective behaviors when outside on a sunny day for more than an hour compared to 18% of those ages 65 years and older (Figure 3A).
Youth UVR Exposure and Sun Protective Behaviors
• The prevalence of indoor tanning use among high school students declined from 25% in 200926 to 8% in 2017 among girls and from 7% to 4% among boys (Table 3A).
• During 2009-2015, indoor tanning use was lower among high school girls residing in states with an age restriction for indoor tanning (7%) compared to those in states with parental permission (20%) or no restriction (25%).19
*At least one of the following: wear wide-brimmed hat, long pants, long-sleeve shirt, sunscreen (SPF 30+); or seek the shade.Source: National Health Interview Survey, 2015.
©2019, American Cancer Society, Inc., Surveillance Research
Perc
ent
Figure 3A. Sun Protective Behaviors* (%), Adults 18 Years and Older, US, 2015
Always/mostly Sometimes/rarelyNever Don’t go in the sun
0
10
20
30
40
50
60
70
80
90
100
Age 65+ yearsAge 25-64 yearsAge 18-24 years
5866
72
152734
53
43
113
Table 3A. Sunburn and Use of an Indoor Tanning Device* (%), High School Students, US, 2017
Males Females Overall
Sunburn
Overall 53 62 57
Race/Ethnicity
White 71 79 75
Black 10 16 13
Hispanic 40 50 45
American Indian/Alaska Native – – –
Asian 32 39 36
Indoor tanning device
Overall 4 8 6
Race/Ethnicity
White 3 10 7
Black 7 4 6
Hispanic 3 3 3
American Indian/Alaska Native – – 12
Asian 3 3 3
*At least once in the past 12 months.
Source: High School Youth Risk Behavior Survey, 2017.26
©2019, American Cancer Society, Inc., Surveillance Research
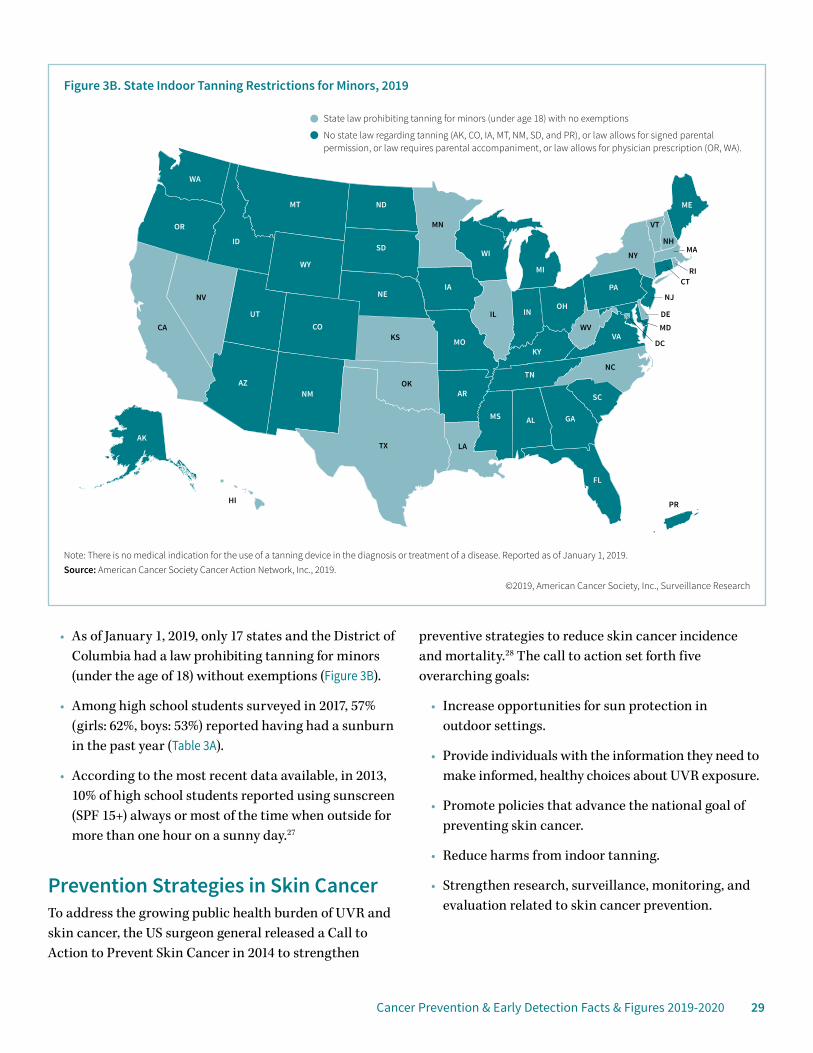
Cancer Prevention & Early Detection Facts & Figures 2019-2020 29
• As of January 1, 2019, only 17 states and the District of Columbia had a law prohibiting tanning for minors (under the age of 18) without exemptions (Figure 3B).
• Among high school students surveyed in 2017, 57% (girls: 62%, boys: 53%) reported having had a sunburn in the past year (Table 3A).
• According to the most recent data available, in 2013, 10% of high school students reported using sunscreen (SPF 15+) always or most of the time when outside for more than one hour on a sunny day.27
Prevention Strategies in Skin CancerTo address the growing public health burden of UVR and skin cancer, the US surgeon general released a Call to Action to Prevent Skin Cancer in 2014 to strengthen
preventive strategies to reduce skin cancer incidence and mortality.28 The call to action set forth five overarching goals:
• Increase opportunities for sun protection in outdoor settings.
• Provide individuals with the information they need to make informed, healthy choices about UVR exposure.
• Promote policies that advance the national goal of preventing skin cancer.
• Reduce harms from indoor tanning.
• Strengthen research, surveillance, monitoring, and evaluation related to skin cancer prevention.
Figure 3B. State Indoor Tanning Restrictions for Minors, 2019
AL
AZAR
CA CO
CT
DE
FL
GA
ID
IL IN
IA
KS
KY
LA
ME
MD
MA
MN
MS
MO
MT
NENV
NH
NJ
NM
NY
NC
PR
ND
OH
OK
OR
PA
RI
SC
SD
TN
TX
UT
VT
VA
WA
WV
WIWY
DC
AK
HI
MI
Note: There is no medical indication for the use of a tanning device in the diagnosis or treatment of a disease. Reported as of January 1, 2019.Source: American Cancer Society Cancer Action Network, Inc., 2019.
©2019, American Cancer Society, Inc., Surveillance Research
State law prohibiting tanning for minors (under age 18) with no exemptions
No state law regarding tanning (AK, CO, IA, MT, NM, SD, and PR), or law allows for signed parental permission, or law requires parental accompaniment, or law allows for physician prescription (OR, WA).
30 Cancer Prevention & Early Detection Facts & Figures 2019-2020
To help reach these goals, communities can increase shade in outdoor recreational settings by planting trees or building structures in frequently used areas. Additionally, skin cancer prevention can be included in school curricula, and implementing specific workplace policies can help reduce skin cancer by limiting or reducing UVR exposure while on the job. Better enforcement of existing laws that prohibit indoor tanning among minors would also help reduce use of indoor tanning.28 One study estimated that about 230,000 melanoma cases could be averted from 2020 to 2030 if a nationwide comprehensive skin cancer prevention program were implemented.29 To promote individual sun protective behaviors, the American Cancer Society supports several campaigns and initiatives (see sidebar above).
Health care professionals also play an important role in educating their patients on the importance of skin cancer prevention. In March 2018, the US Preventive Services Task Force (USPSTF) published updated recommendations
stating that to reduce skin cancer risk, young adults, adolescents, children, and parents of young children should be counseled about minimizing UVR exposure among those ages 6 months to 24 years with fair skin types.30 Social norms about tanned skin appearing healthy and attractive present barriers to sun protective behaviors. Therefore, another important approach to promoting individual protection against UVR exposure focuses on appearance, emphasizing the harms of sun exposure (i.e., age spots and wrinkles) to physical appearance and increasing the perceived attractiveness of untanned skin.28, 31
Early Detection of Skin CancerEarly detection of skin cancer may include an inspection by a clinician and/or self-examination. The American Cancer Society does not have a guideline on the early detection of skin cancer because there is uncertainty about whether routine skin examinations reduce skin cancer mortality. In 2016, the USPSTF concluded that there was insufficient evidence to recommend for or against visual skin examination by a clinician for people at average risk and without symptoms.32 The American Academy of Dermatology supports skin self-examinations for individuals with red or blond hair, blue or green eyes, or fair skin given their increased risk for skin cancer.33 In 2015, about 1 in 5 adults reported having had a total body skin examination by a clinician at least once in their lifetime, with a greater proportion among adults with higher-risk profiles.24, 34 Anyone with new, suspicious growths or anything changing, itching, or bleeding on the skin should be evaluated promptly by a physician. The ABCDE rule can serve as a helpful guide for the warning signs of the most common types of melanoma (see sidebar, page 31).
Visit cancer.org/cancer/skin-cancer/prevention-and-early-detection for guidance on how to perform a skin self-exam in addition to general information about skin cancer prevention. Visit fightcancer.org to learn more about skin cancer initiatives and to view the most recent edition of How Do You Measure Up? – a state-by-state assessment of cancer care and control efforts.
Skin Cancer Prevention InitiativesSince 2008, the American Cancer Society has collaborated with the National Council on Skin Cancer Prevention (NCSCP) to coordinate prevention activities and improve media relation efforts that promote and raise awareness about the importance of skin cancer prevention. In addition, the NCSCP has aggregated several sun safety resources targeting a variety of audiences such as health professionals, media, outdoor workers, parents, parks and recreation staff, policy makers, educators, and teenagers. Visit skincancerprevention.org to access these materials and to learn more about the initiatives listed below.
Don’t Fry Day: The NCSCP and its collaborators have designated the Friday before Memorial Day as Don’t Fry Day. This pre-Memorial Day awareness initiative uses key messages to ensure consistent communication about the individual steps people can take to prevent skin cancer.
Indoor Tan-Free Skin Smart Campus: The Indoor Tan-Free Skin Smart Campus initiative, sponsored by the NCSCP, was launched in 2016 in response to the 2014 US Surgeon General’s Call to Action to Prevent Skin Cancer. The initiative recognizes US universities and colleges that promote skin cancer prevention policies and education on campus.
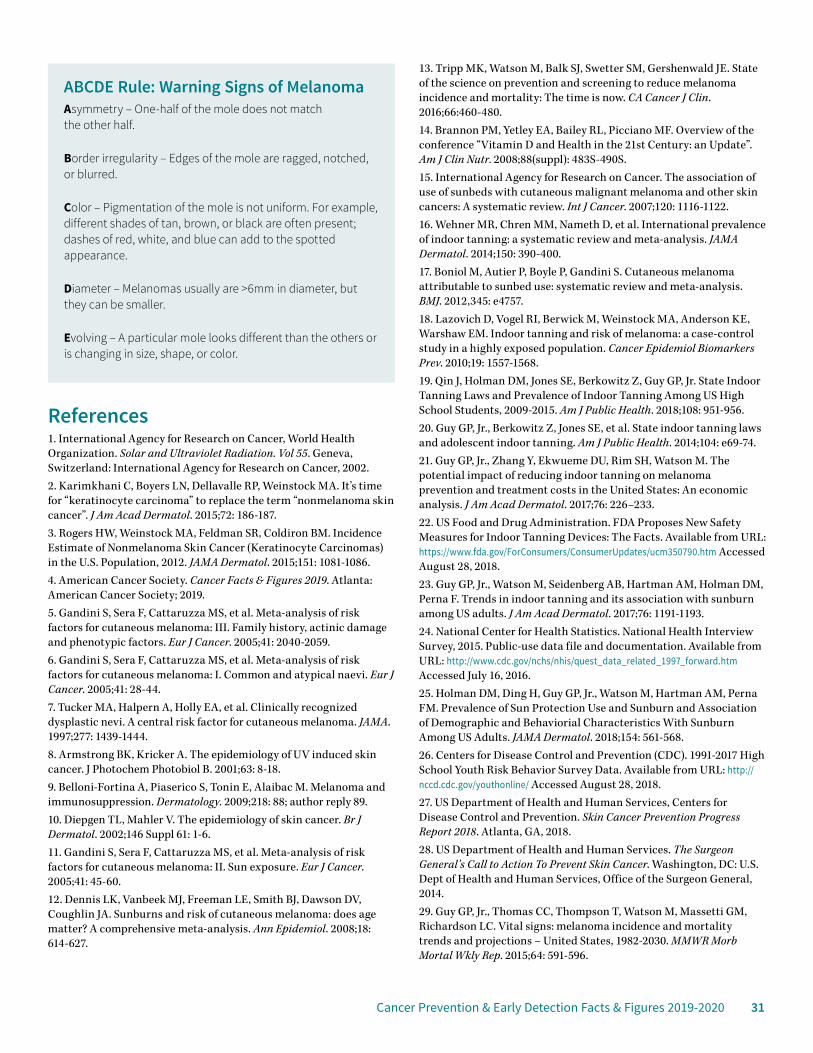
Cancer Prevention & Early Detection Facts & Figures 2019-2020 31
References1. International Agency for Research on Cancer, World Health Organization. Solar and Ultraviolet Radiation. Vol 55. Geneva, Switzerland: International Agency for Research on Cancer, 2002.2. Karimkhani C, Boyers LN, Dellavalle RP, Weinstock MA. It’s time for “keratinocyte carcinoma” to replace the term “nonmelanoma skin cancer”. J Am Acad Dermatol. 2015;72: 186-187.3. Rogers HW, Weinstock MA, Feldman SR, Coldiron BM. Incidence Estimate of Nonmelanoma Skin Cancer (Keratinocyte Carcinomas) in the U.S. Population, 2012. JAMA Dermatol. 2015;151: 1081-1086.4. American Cancer Society. Cancer Facts & Figures 2019. Atlanta: American Cancer Society; 2019.5. Gandini S, Sera F, Cattaruzza MS, et al. Meta-analysis of risk factors for cutaneous melanoma: III. Family history, actinic damage and phenotypic factors. Eur J Cancer. 2005;41: 2040-2059.6. Gandini S, Sera F, Cattaruzza MS, et al. Meta-analysis of risk factors for cutaneous melanoma: I. Common and atypical naevi. Eur J Cancer. 2005;41: 28-44.7. Tucker MA, Halpern A, Holly EA, et al. Clinically recognized dysplastic nevi. A central risk factor for cutaneous melanoma. JAMA. 1997;277: 1439-1444.8. Armstrong BK, Kricker A. The epidemiology of UV induced skin cancer. J Photochem Photobiol B. 2001;63: 8-18.9. Belloni-Fortina A, Piaserico S, Tonin E, Alaibac M. Melanoma and immunosuppression. Dermatology. 2009;218: 88; author reply 89.10. Diepgen TL, Mahler V. The epidemiology of skin cancer. Br J Dermatol. 2002;146 Suppl 61: 1-6.11. Gandini S, Sera F, Cattaruzza MS, et al. Meta-analysis of risk factors for cutaneous melanoma: II. Sun exposure. Eur J Cancer. 2005;41: 45-60.12. Dennis LK, Vanbeek MJ, Freeman LE, Smith BJ, Dawson DV, Coughlin JA. Sunburns and risk of cutaneous melanoma: does age matter? A comprehensive meta-analysis. Ann Epidemiol. 2008;18: 614-627.
13. Tripp MK, Watson M, Balk SJ, Swetter SM, Gershenwald JE. State of the science on prevention and screening to reduce melanoma incidence and mortality: The time is now. CA Cancer J Clin. 2016;66:460-480.14. Brannon PM, Yetley EA, Bailey RL, Picciano MF. Overview of the conference “Vitamin D and Health in the 21st Century: an Update”. Am J Clin Nutr. 2008;88(suppl): 483S-490S.15. International Agency for Research on Cancer. The association of use of sunbeds with cutaneous malignant melanoma and other skin cancers: A systematic review. Int J Cancer. 2007;120: 1116-1122.16. Wehner MR, Chren MM, Nameth D, et al. International prevalence of indoor tanning: a systematic review and meta-analysis. JAMA Dermatol. 2014;150: 390-400.17. Boniol M, Autier P, Boyle P, Gandini S. Cutaneous melanoma attributable to sunbed use: systematic review and meta-analysis. BMJ. 2012,345: e4757.18. Lazovich D, Vogel RI, Berwick M, Weinstock MA, Anderson KE, Warshaw EM. Indoor tanning and risk of melanoma: a case-control study in a highly exposed population. Cancer Epidemiol Biomarkers Prev. 2010;19: 1557-1568.19. Qin J, Holman DM, Jones SE, Berkowitz Z, Guy GP, Jr. State Indoor Tanning Laws and Prevalence of Indoor Tanning Among US High School Students, 2009-2015. Am J Public Health. 2018;108: 951-956.20. Guy GP, Jr., Berkowitz Z, Jones SE, et al. State indoor tanning laws and adolescent indoor tanning. Am J Public Health. 2014;104: e69-74.21. Guy GP, Jr., Zhang Y, Ekwueme DU, Rim SH, Watson M. The potential impact of reducing indoor tanning on melanoma prevention and treatment costs in the United States: An economic analysis. J Am Acad Dermatol. 2017;76: 226–233.22. US Food and Drug Administration. FDA Proposes New Safety Measures for Indoor Tanning Devices: The Facts. Available from URL: https://www.fda.gov/ForConsumers/ConsumerUpdates/ucm350790.htm Accessed August 28, 2018.23. Guy GP, Jr., Watson M, Seidenberg AB, Hartman AM, Holman DM, Perna F. Trends in indoor tanning and its association with sunburn among US adults. J Am Acad Dermatol. 2017;76: 1191-1193.24. National Center for Health Statistics. National Health Interview Survey, 2015. Public-use data file and documentation. Available from URL: http://www.cdc.gov/nchs/nhis/quest_data_related_1997_forward.htm Accessed July 16, 2016.25. Holman DM, Ding H, Guy GP, Jr., Watson M, Hartman AM, Perna FM. Prevalence of Sun Protection Use and Sunburn and Association of Demographic and Behaviorial Characteristics With Sunburn Among US Adults. JAMA Dermatol. 2018;154: 561-568.26. Centers for Disease Control and Prevention (CDC). 1991-2017 High School Youth Risk Behavior Survey Data. Available from URL: http://nccd.cdc.gov/youthonline/ Accessed August 28, 2018.27. US Department of Health and Human Services, Centers for Disease Control and Prevention. Skin Cancer Prevention Progress Report 2018. Atlanta, GA, 2018.28. US Department of Health and Human Services. The Surgeon General’s Call to Action To Prevent Skin Cancer. Washington, DC: U.S. Dept of Health and Human Services, Office of the Surgeon General, 2014.29. Guy GP, Jr., Thomas CC, Thompson T, Watson M, Massetti GM, Richardson LC. Vital signs: melanoma incidence and mortality trends and projections – United States, 1982-2030. MMWR Morb Mortal Wkly Rep. 2015;64: 591-596.
ABCDE Rule: Warning Signs of MelanomaAsymmetry – One-half of the mole does not match the other half.
Border irregularity – Edges of the mole are ragged, notched, or blurred.
Color – Pigmentation of the mole is not uniform. For example, different shades of tan, brown, or black are often present; dashes of red, white, and blue can add to the spotted appearance.
Diameter – Melanomas usually are >6mm in diameter, but they can be smaller.
Evolving – A particular mole looks different than the others or is changing in size, shape, or color.
32 Cancer Prevention & Early Detection Facts & Figures 2019-2020
30. Grossman DC, Curry SJ, Owens DK, et al. Behavioral Counseling to Prevent Skin Cancer: US Preventive Services Task Force Recommendation Statement. JAMA. 2018;319: 1134-1142.31. Lim HW, James WD, Rigel DS, Maloney ME, Spencer JM, Bhushan R. Adverse effects of ultraviolet radiation from the use of indoor tanning equipment: time to ban the tan. J Am Acad Dermatol. 2011;64: 893-902.
32. Bibbins-Domingo K, Grossman DC, Curry SJ, et al. Screening for Skin Cancer: US Preventive Services Task Force Recommendation Statement. JAMA. 2016;316: 429-435.33. American Academy of Dermatology. Melanoma. Available from URL: https://www.aad.org/media/stats/conditions Accessed August 28, 2018.34. Lakhani NA, Saraiya M, Thompson TD, King SC, Guy GP, Jr. Total body skin examination for skin cancer screening among U.S. adults from 2000 to 2010. Prev Med. 2014;61: 75-80.
Infectious AgentsThere are several infectious agents known to cause cancer, such as the human papillomavirus, Helicobacter pylori, the hepatitis B virus, and the hepatitis C virus. In the US, about 3% of all cancers are attributable to infections, accounting for an estimated 51,440 cases in 2014.1 Fortunately, there are opportunities to prevent and treat many of these infections.
Human PapillomavirusHuman papillomavirus (HPV) infection is very common, but usually is cleared by the body and does not cause cancer. However, persistent HPV infection causes almost all cervical cancers, 90% of anal cancers and 60%-70% of oropharyngeal, vaginal, vulvar, and penile cancers.2 Cervical cancer is the most common HPV-related cancer in women, and oropharyngeal cancer is the most common in men.3 Incidence rates for several HPV-related cancers, including oropharyngeal, anal, and vulvar, have increased in recent years; but, the overall cervical cancer incidence rate continues to decline because of widespread screening that can prevent this cancer.3 HPV vaccination may also be contributing to the decrease in cervical cancer incidence among young women in the US.4 The Centers for Disease Control and Prevention (CDC) estimates that 14 million Americans are newly infected annually with genital HPV.5 The virus is spread primarily through direct sexual contact and is usually asymptomatic.
There are more than 100 types of HPV, and only about 13 of which are known to cause cancer. The HPV vaccine currently used in the US protects against 9 HPV types and has the potential to avert 90% of HPV-related cancers.2
The American Cancer Society’s 2017 HPV vaccination guidelines recommend routine vaccination of both girls and boys beginning at age 11 or 12; the series can be started at age 9 (see sidebar, page 33).6 For persons initiating vaccination before their 15th birthday, the recommended immunization schedule consists of two doses. For those initiating the HPV vaccine on or after their 15th birthday, a three-dose series is recommended, in accordance with the Advisory Committee on Immunization Practices (ACIP) recommendation.7 Vaccination does not prevent established infections from progressing to precancer or cancer and does not prevent infection of all HPV types; therefore, women should receive appropriate cervical cancer screening (see page 48).
The promise of preventing multiple types of HPV-related cancers will be fully realized only if high coverage with HPV vaccine is achieved in adolescents. Recommended strategies for increasing rates of HPV vaccination in the US focus on improving provider recommendation, parental awareness, and access to vaccination in medical and non-medical settings (e.g., schools, pharmacies, health departments).8, 9 Research has shown that there are many missed opportunities within the health care system for children to be vaccinated.10 Proven strategies to improve vaccination coverage include reminder-recall systems and removal of administrative and financial barriers.11 In the US, the HPV vaccine costs approximately $170-$200 per dose, excluding the cost of administering the injections and provider charges.12 The Affordable Care Act (ACA) requires private insurance plans to cover HPV vaccination without cost sharing for eligible children, adolescents, and adults.13 Furthermore,

Cancer Prevention & Early Detection Facts & Figures 2019-2020 33
the federal Vaccines for Children program covers vaccine costs for children and teens who meet certain eligibility requirements (i.e., uninsured, underinsured, eligible for Medicaid, or of American Indian/Alaska Native descent).14
HPV Prevalence and Vaccination in the US• In 2011-2014, an estimated 4% of adults had high-risk
oral HPV and 23% had high-risk genital HPV infection. Prevalence of HPV infection was higher among men (oral: 7%, genital: 25%) than women (oral: 1%, genital: 20%).15
• High-risk oral HPV among adults was lower in Asians (1%) than whites (4%), blacks (4%), and Hispanics (3%). High-risk genital HPV prevalence ranged from 12% in Asians to 22% in whites and Hispanics to 34% in blacks.15
• The uptake of HPV vaccination is increasing among youth, though utilization still lags behind other recommended vaccines.16
• In 2017, 58% of girls and 51% of boys initiated (at least one dose) the HPV vaccine and 42% and 31%, respectively, received both doses before their 13th birthday (Table 4A).
• In 2017, 69% of girls and 63% of boys ages 13-17 years had initiated the HPV vaccine. The prevalence of up-to-date vaccination was markedly lower at 53% among girls and 44% among boys (Table 4A).
• Among girls ages 13-17 years, up-to-date HPV vaccination was lowest in whites (50%) and highest in Asians (60%). Among boys, vaccination was also lowest in whites (40%) but highest in Hispanics (55%) (Table 4A).
• Overall, up-to-date HPV vaccination ranged from 29% in Mississippi to 78% in the District of Columbia and Rhode Island (Figure 4A, Table 4B).
• In 2016, among adult women and men ages 19-26 years, 50% and 14%, respectively, reported ever having received at least one dose of HPV vaccine.17
American Cancer Society Recommendations for HPV Vaccine Use• Routine HPV vaccination for girls and boys should be
started at age 11 or 12. The vaccination series can be started at age 9.
• HPV vaccination is also recommended for females ages 13-26 years and for males ages 13-21 years who have not started the vaccines, or who have started but not completed the series. Males ages 22-26 years may also be vaccinated.*
• HPV vaccination is also recommended through age 26 for men who have sex with men and for people with weakened immune systems (including people with HIV infection), if they have not previously been vaccinated.
*For people ages 22-26 years who have not started the vaccines, or who have started but not completed the series, it is important to know that vaccination at older ages is less effective in lowering cancer risk.
The National HPV Vaccination RoundtableThe National HPV Vaccination Roundtable is a coalition of organizations working together nationwide to prevent HPV-associated cancers and precancers by increasing and sustaining HPV vaccination in the US. The HPV Roundtable strives to achieve this objective by:
• Promoting the use of evidence-based strategies to increase HPV vaccination
• Increasing the use of tools that facilitate effective provider recommendations for HPV vaccination with a focus on girls and boys ages 11-12 years
• Decreasing missed opportunities for administration of the HPV vaccine
• Increasing HPV vaccination rates over time, including rates of series completion by age 13
• Decreasing the gap between female and male HPV vaccination rates
To overcome barriers to HPV vaccination, the HPV Roundtable develops and implements projects focusing on providers, parents, systems, policies, and health disparities. Visit hpvroundtable.org for more information.
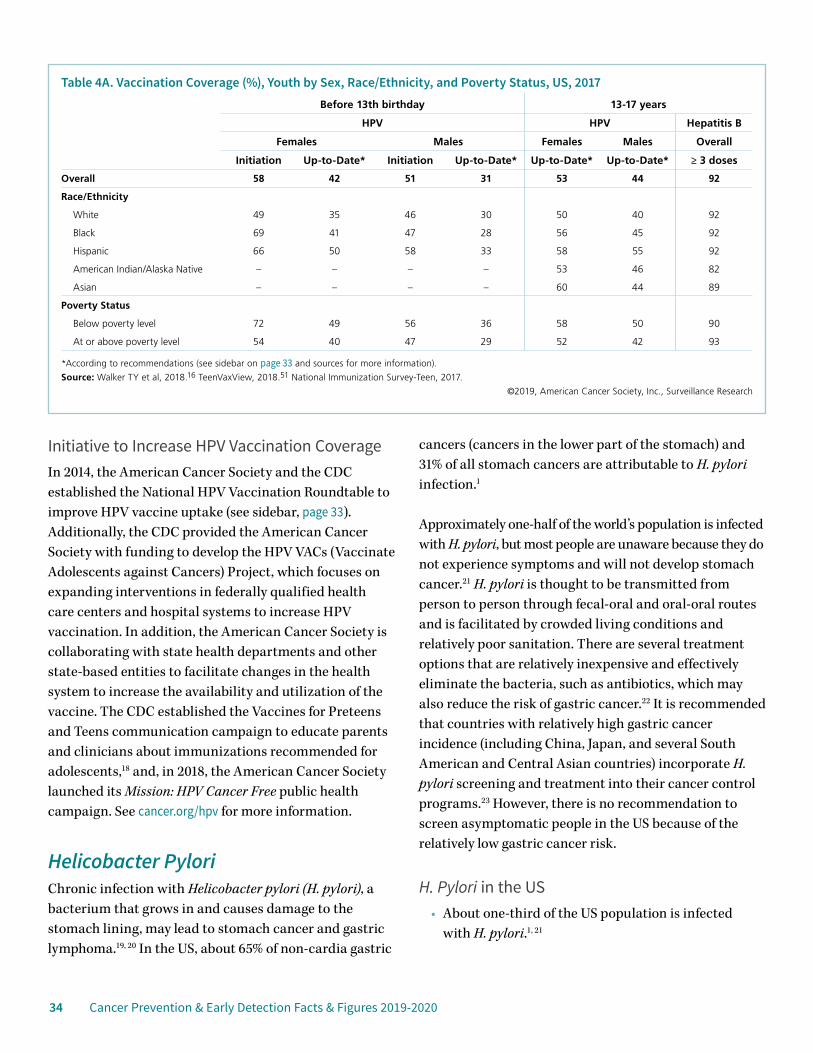
34 Cancer Prevention & Early Detection Facts & Figures 2019-2020
Initiative to Increase HPV Vaccination Coverage In 2014, the American Cancer Society and the CDC established the National HPV Vaccination Roundtable to improve HPV vaccine uptake (see sidebar, page 33). Additionally, the CDC provided the American Cancer Society with funding to develop the HPV VACs (Vaccinate Adolescents against Cancers) Project, which focuses on expanding interventions in federally qualified health care centers and hospital systems to increase HPV vaccination. In addition, the American Cancer Society is collaborating with state health departments and other state-based entities to facilitate changes in the health system to increase the availability and utilization of the vaccine. The CDC established the Vaccines for Preteens and Teens communication campaign to educate parents and clinicians about immunizations recommended for adolescents,18 and, in 2018, the American Cancer Society launched its Mission: HPV Cancer Free public health campaign. See cancer.org/hpv for more information.
Helicobacter PyloriChronic infection with Helicobacter pylori (H. pylori), a bacterium that grows in and causes damage to the stomach lining, may lead to stomach cancer and gastric lymphoma.19, 20 In the US, about 65% of non-cardia gastric
cancers (cancers in the lower part of the stomach) and 31% of all stomach cancers are attributable to H. pylori infection.1
Approximately one-half of the world’s population is infected with H. pylori, but most people are unaware because they do not experience symptoms and will not develop stomach cancer.21 H. pylori is thought to be transmitted from person to person through fecal-oral and oral-oral routes and is facilitated by crowded living conditions and relatively poor sanitation. There are several treatment options that are relatively inexpensive and effectively eliminate the bacteria, such as antibiotics, which may also reduce the risk of gastric cancer.22 It is recommended that countries with relatively high gastric cancer incidence (including China, Japan, and several South American and Central Asian countries) incorporate H. pylori screening and treatment into their cancer control programs.23 However, there is no recommendation to screen asymptomatic people in the US because of the relatively low gastric cancer risk.
H. Pylori in the US• About one-third of the US population is infected
with H. pylori.1, 21
Table 4A. Vaccination Coverage (%), Youth by Sex, Race/Ethnicity, and Poverty Status, US, 2017Before 13th birthday 13-17 years
HPV HPV Hepatitis B
Females Males Females Males Overall
Initiation Up-to-Date* Initiation Up-to-Date* Up-to-Date* Up-to-Date* ≥ 3 doses
Overall 58 42 51 31 53 44 92
Race/Ethnicity
White 49 35 46 30 50 40 92
Black 69 41 47 28 56 45 92
Hispanic 66 50 58 33 58 55 92
American Indian/Alaska Native – – – – 53 46 82
Asian – – – – 60 44 89
Poverty Status
Below poverty level 72 49 56 36 58 50 90
At or above poverty level 54 40 47 29 52 42 93
*According to recommendations (see sidebar on page 33 and sources for more information).
Source: Walker TY et al, 2018.16 TeenVaxView, 2018.51 National Immunization Survey-Teen, 2017.
©2019, American Cancer Society, Inc., Surveillance Research

Cancer Prevention & Early Detection Facts & Figures 2019-2020 35
• H. pylori prevalence is two to three times higher among Mexican Americans and blacks, compared to whites; prevalence is also greater among those who recently immigrated to the US.24, 25
• H. pylori prevalence is five to nine times higher in adults over the age of 50 compared to adults in their 20s.25
Hepatitis B VirusChronic infection with the hepatitis B virus (HBV) can cause liver cancer and is increasingly recognized as a risk factor for non-Hodgkin lymphoma.26, 27 In the US, about 7% of all liver cancers are attributable to HBV.1 The virus is transmitted through blood or mucosal contact with infectious blood or body fluids (e.g., semen, saliva). Most new HBV infections occur in unvaccinated adults who practice risky behaviors (e.g., injection drug users, men
who have unprotected sex with men, and adults who have numerous sex partners).28 About 95% of newly infected adults will clear the virus within six months of infection, whereas the majority of infected infants will become chronically infected.29
Vaccination against HBV has been available since 1982 and is the primary prevention strategy. In 1991, the CDC outlined a nationwide strategy aimed at reducing HBV, which included a three-dose HBV vaccination series for children.28 Most HBV vaccines are given during infancy, but the CDC also recommends that youth under the age of 19 who have not been vaccinated and unvaccinated adults who are at high risk for infection (e.g., health care workers, travelers to regions with HBV) receive the vaccine.28 There are several drugs that effectively treat HBV; if infection progresses to liver disease, liver transplantation is also a treatment option.
Figure 4A. Up-to-date* Human Papillomavirus Vaccination (%), Adolescents 13 to 17 Years by State, 2017
AL
AZAR
CA CO
CT
DE
FL
GA
ID
IL IN
IA
KS
KY
LA
ME
MD
MA
MN
MS
MO
MT
NENV
NH
NJ
NM
NY
NC
ND
OH
OK
OR
PA
RI
SC
SD
TN
TX
UT
VT
VA
WA
WV
WIWY
DC
AK
HI
MI
*According to recommendations (see sidebar on page 33 and sources for more information). Note: Data for Puerto Rico not available.Source: Walker TY et al, 2018.16 TeenVaxView, 2018.51
©2019, American Cancer Society, Inc., Surveillance Research
38% or less
39% to 49%
50% to 60%
61% or more
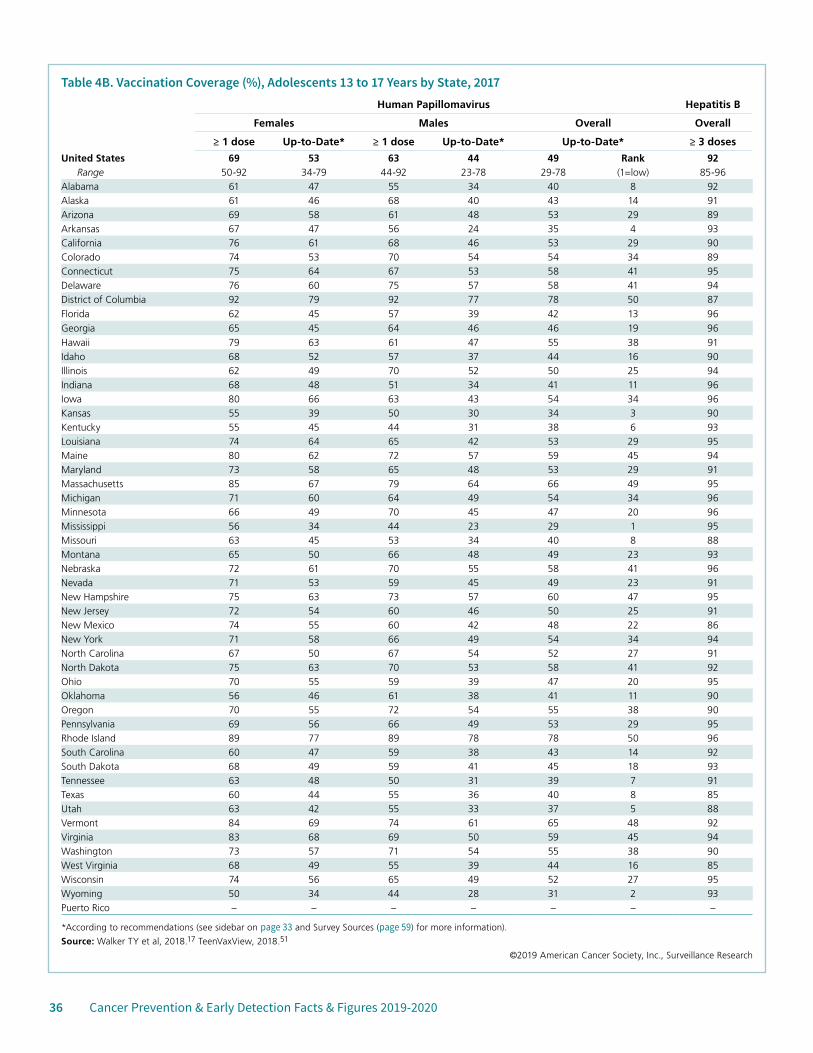
36 Cancer Prevention & Early Detection Facts & Figures 2019-2020
Table 4B. Vaccination Coverage (%), Adolescents 13 to 17 Years by State, 2017Human Papillomavirus Hepatitis B
Females Males Overall Overall
≥ 1 dose Up-to-Date* ≥ 1 dose Up-to-Date* Up-to-Date* ≥ 3 doses
United States 69 53 63 44 49 Rank 92Range 50-92 34-79 44-92 23-78 29-78 (1=low) 85-96
Alabama 61 47 55 34 40 8 92Alaska 61 46 68 40 43 14 91Arizona 69 58 61 48 53 29 89Arkansas 67 47 56 24 35 4 93California 76 61 68 46 53 29 90Colorado 74 53 70 54 54 34 89Connecticut 75 64 67 53 58 41 95Delaware 76 60 75 57 58 41 94District of Columbia 92 79 92 77 78 50 87Florida 62 45 57 39 42 13 96Georgia 65 45 64 46 46 19 96Hawaii 79 63 61 47 55 38 91Idaho 68 52 57 37 44 16 90Illinois 62 49 70 52 50 25 94Indiana 68 48 51 34 41 11 96Iowa 80 66 63 43 54 34 96Kansas 55 39 50 30 34 3 90Kentucky 55 45 44 31 38 6 93Louisiana 74 64 65 42 53 29 95Maine 80 62 72 57 59 45 94Maryland 73 58 65 48 53 29 91Massachusetts 85 67 79 64 66 49 95Michigan 71 60 64 49 54 34 96Minnesota 66 49 70 45 47 20 96Mississippi 56 34 44 23 29 1 95Missouri 63 45 53 34 40 8 88Montana 65 50 66 48 49 23 93Nebraska 72 61 70 55 58 41 96Nevada 71 53 59 45 49 23 91New Hampshire 75 63 73 57 60 47 95New Jersey 72 54 60 46 50 25 91New Mexico 74 55 60 42 48 22 86New York 71 58 66 49 54 34 94North Carolina 67 50 67 54 52 27 91North Dakota 75 63 70 53 58 41 92Ohio 70 55 59 39 47 20 95Oklahoma 56 46 61 38 41 11 90Oregon 70 55 72 54 55 38 90Pennsylvania 69 56 66 49 53 29 95Rhode Island 89 77 89 78 78 50 96South Carolina 60 47 59 38 43 14 92South Dakota 68 49 59 41 45 18 93Tennessee 63 48 50 31 39 7 91Texas 60 44 55 36 40 8 85Utah 63 42 55 33 37 5 88Vermont 84 69 74 61 65 48 92Virginia 83 68 69 50 59 45 94Washington 73 57 71 54 55 38 90West Virginia 68 49 55 39 44 16 85Wisconsin 74 56 65 49 52 27 95Wyoming 50 34 44 28 31 2 93Puerto Rico – – – – – – –
*According to recommendations (see sidebar on page 33 and Survey Sources (page 59) for more information).
Source: Walker TY et al, 2018.17 TeenVaxView, 2018.51
©2019 American Cancer Society, Inc., Surveillance Research
Cancer Prevention & Early Detection Facts & Figures 2019-2020 37
HBV Prevalence and Vaccination in the US• The overall prevalence of chronic HBV infection in
the US has remained unchanged since 1999 (0.3%). Approximately 850,000 to 2.2 million people are living with chronic HBV infection in the US.30, 31
• In 2007-2012, 3% of Asians had chronic HBV infection compared to an estimated <0.1% of whites and Mexican Americans.30
• HBV infection prevalence is generally higher in foreign-born Americans, particularly among those born in Asia.30, 31 In addition, HBV vaccination coverage is lower among foreign-born adolescents than their US-born counterparts.32
• In 2017, 92% of adolescents (ages 13-17 years) had received at least three HBV vaccine doses; vaccination was lowest among American Indians/Alaska Natives (82%) and highest among whites, blacks, and Hispanics (92%) (Table 4A).
• By state, adolescent HBV vaccination coverage in 2017 ranged from 85% in Texas and West Virginia to 96% in Florida, Georgia, Indiana, Iowa, Michigan, Minnesota, Nebraska, and Rhode Island (Table 4B).
Hepatitis C VirusChronic infection with the hepatitis C virus (HCV) can cause liver cancer, and has also been shown to increase the risk of non-Hodgkin lymphoma.26, 33 Liver cancer incidence and mortality rates have increased rapidly in the US for several decades, as has HCV-related mortality; these increases are thought to be, in part, due to the HCV epidemic that began in the late 1960s primarily through injection drug use.34, 35 Nearly one-quarter of liver cancers in the US are attributable to HCV infection.1
Most HCV is spread through injection drug use. Less common routes of transmission include needle stick injuries in health care settings, mother-to-child transmission during birth, and sexual contact with an infected individual. Prior to 1992, HCV was also transmitted through blood infusion and organ transplants, but since then, donated blood and tissues have been screened for the virus. Most people with HCV will become chronically
infected, regardless of age at infection, and are unaware of their infection until liver disease develops.
In contrast to HBV infection, there is no vaccine to protect against HCV infection. Primary prevention strategies include both educating uninfected individuals who are at high risk for infection about exposure prevention and counseling infected individuals about how to avoid transmission to others.
In 2013, the US Preventive Services Task Force updated its HCV guidelines, recommending one-time screening among men and women born between 1945 and 1965 because people born during this time period represent the majority of HCV infections and deaths in the US.36 Those who test positive for HCV are advised to begin antiviral treatment, which is very effective at eliminating HCV infection, but is also very expensive.36
HCV Prevalence and Testing in the US• The incidence of acute HCV infection, which will
become chronic in 75%-85% of those infected, was steady between 2005-2010, but tripled between 2010 and 2016 in both men and women.29
• In the US, approximately 3.5 million persons are living with chronic HCV infection.37
• In 2010, the estimated prevalence of HCV infection nationwide was about 2%, but varied across states from <1% in Illinois, North Dakota, Utah, and Wisconsin to about 3% in Oklahoma, Oregon, and the District of Columbia.38
• HCV infection is more common among men, blacks, and those with lower socioeconomic status.39
• The prevalence of HCV infection is particularly high in certain groups, including the homeless (22%-53%), the incarcerated (23%-41%), and veterans (5%-11%).40
• In 2015, approximately 14% of adults (men: 15%, women: 12%) born between 1945 and 1965 had ever been tested for HCV.41 Testing was least common among people who were uninsured (11%), Hispanic (11%), and did not have a high school degree (11%).41
38 Cancer Prevention & Early Detection Facts & Figures 2019-2020
Human Immunodeficiency VirusThe human immunodeficiency virus (HIV) may be present in the body for a long period of time without resulting in symptoms; however, as HIV progresses, the immune system is weakened, and acquired immunodeficiency syndrome (AIDS) develops. HIV is primarily transmitted through sexual intercourse, especially in men who have sex with men, and injection drug use, though other infection routes are possible. There are several AIDS-defining cancers, meaning that their occurrence in an HIV-infected individual indicates that the infection has progressed to AIDS. They include Kaposi sarcoma, high-grade non-Hodgkin lymphoma (NHL), and cervical cancer.42 HIV-infected individuals are at an increased risk of developing other cancers, often referred to as non-AIDS-defining cancers, including Hodgkin lymphoma, some head and neck cancers, anal cancer, and liver cancer. The weakened immune system, along with shared routes of transmission with other cancer-causing infectious agents (e.g., HPV, HCV), increases the risk of cancers in this population.43 Moreover, people infected with HIV also have higher rates of lung cancer, which is thought to be related to higher smoking prevalence as well as immunosuppression.44 Approximately 77%, 11%, 8%, 5%, and <1% of Kaposi sarcoma, anal cancer, non-Hodgkin and Hodgkin lymphomas, and cervical cancers in the US are attributed to HIV infection.1
There are several primary prevention strategies for HIV, such as safe sex practices and the use of sterile needles. There is no vaccine against HIV, but prophylaxis is available for those at risk for the disease. Among those infected with HIV, effective antiretroviral medications can suppress virus replication and boost the immune system, but these medication regimens must be taken throughout life. Furthermore, HIV-infected individuals are recommended to receive tailored screenings for certain cancers. Visit cdc.gov/hiv for more information.
HIV Prevalence and Trends in the US• Overall, HIV incidence declined between 2011-2015,
but has increased in some groups including those ages 25-29 years, American Indians/Alaska Natives, and Asians.45
• However, since the mid-1990s, the number of people living with HIV infection has increased due to improvements in survival.45, 46 As a result, there is an increased cumulative incidence and burden of cancer among persons living with HIV.46
• In 2015, nearly 1 million adults and adolescents were estimated to be living with HIV, many of whom were unaware of their infection. The majority of people living with HIV are men and men who have sex with men.45
• HIV infection is seven times higher in blacks and 2.5 times higher in Hispanics compared to whites.45
• HIV prevalence is higher in urban than rural areas, as well as in Northeastern than other states. However, the rate of newly acquired HIV is highest in Southern states, especially among men who have sex with men.45, 47
Epstein-Barr VirusThe Epstein-Barr virus (EBV) causes Hodgkin lymphoma, some types of nasopharyngeal carcinoma, and non-Hodgkin lymphomas, including Burkitt lymphoma and diffuse large B cell lymphoma.26 The vast majority of people with EBV do not develop cancer. People who are infected with HIV and immunosuppressed transplant recipients are at an increased risk of EBV-related lymphoma.43, 48 EBV is very common, infecting more than 90% of the world’s adult population. The virus is transmitted through body fluids, primarily saliva. People with EBV may develop mononucleosis or experience flu-like symptoms followed by a period of dormancy. Reactivation of EBV may be the crucial step in the link between EBV and cancer risk.49 Currently, there are no primary prevention strategies for EBV and no treatments to eradicate the virus.50
References 1. Islami F, Goding Sauer A, Miller KD, et al. Proportion and number of cancer cases and deaths attributable to potentially modifiable risk factors in the United States. CA Cancer J Clin. 2018;68: 31-54.2. Saraiya M, Unger ER, Thompson TD, et al. US assessment of HPV types in cancers: implications for current and 9-valent HPV vaccines. J Natl Cancer Inst. 2015;107: djv086.
Cancer Prevention & Early Detection Facts & Figures 2019-2020 39
3. Van Dyne EA, Henley SJ, Saraiya M, Thomas CC, Markowitz LE, Benard VB. Trends in Human Papillomavirus-Associated Cancers – United States, 1999-2015. MMWR Morb Mortal Wkly Rep. 2018;67: 918-924.4. Guo F, Cofie LE, Berenson AB. Cervical Cancer Incidence in Young U.S. Females After Human Papillomavirus Vaccine Introduction. Am J Prev Med. 2018;55: 197-204.5. Satterwhite CL, Torrone E, Meites E, Dunne EF, Mahajan R, Ocfemia MC, Su J, Weinstock H. Sexually transmitted infections among US women and Men: prevalence and incidence estimates, 2008. Sex Transm Dis. 2013; 40:187-93.6. Smith RA, Andrews K, Brooks D, et al. Cancer Screening in the United States, 2017: A Review of Current American Cancer Society Guidelines and Current Issues in Cancer Screening. CA Cancer J Clin. 2017;67: 100-121.7. Meites E, Kempe A, Markowitz LE. Use of a 2-Dose Schedule for Human Papillomavirus Vaccination – Updated Recommendations of the Advisory Committee on Immunization Practices. MMWR Morb Mortal Wkly Rep. 2016;65: 1405-1408.8. National Vaccine Advisory Committee. Overcoming Barriers to Low HPV Vaccine Uptake in the United States: Recommendations from the National Vaccine Advisory Committee: Approved by the National Vaccine Advisory Committee on June 9, 2015. Public Health Rep. 2016;131: 17-25.9. Accelerating HPV Vaccine Uptake: Urgency for Action to Prevent Cancer. A Report to the President of the United States from the President’s Cancer Panel. Bethesda, MD: National Cancer Institute 2014.10. Holman DM, Benard V, Roland KB, Watson M, Liddon N, Stokley S. Barriers to human papillomavirus vaccination among US adolescents: a systematic review of the literature. JAMA Pediatr. 2014;168: 76-82.11. Kessels SJ, Marshall HS, Watson M, Braunack-Mayer AJ, et al. Factors associated with HPV vaccine uptake in teenage girls: a systematic review. Vaccine. 2012 30(24): 3546-3556.12. Centers for Disease Control and Prevention. CDC Vaccine Price List. Available from URL: https://www.cdc.gov/vaccines/programs/vfc/awardees/vaccine-management/price-list/index.html Accessed 09/12/2018.13. Koh HK, Sebelius KG. Promoting prevention through the Affordable Care Act. N Engl J Med. 2010;363: 1296-1299.14. Centers for Disease Control and Prevention. Vaccines for Children Program (VFC). Available from URL: http://www.cdc.gov/vaccines/programs/vfc/providers/eligibility.html Accessed September 22, 2014.15. McQuillan G, Kruszon-Moran D, Markowitz LE, Unger ER, Paulose-Ram R. Prevalence of HPV in Adults Aged 18-69: United States, 2011-2014. NCHS Data Brief. 2017: 1-8.16. Walker TY, Elam-Evans LD, Yankey D, et al. National, Regional, State, and Selected Local Area Vaccination Coverage Among Adolescents Aged 13-17 Years – United States, 2017. MMWR Morb Mortal Wkly Rep. 2018;67: 909-917.17. Centers for Disease Control and Prevention. Vaccination Coverage Among Adults in the United States, National Health Interview Survey, 2016. Available from URL: https://www.cdc.gov/vaccines/imz-managers/coverage/adultvaxview/pubs-resources/NHIS-2016.html.18.Centers for Disease Control and Prevention. Preteen and Teen Immunization Resources. Available from URL: https://www.cdc.gov/vaccines/partners/teens/index.html Accessed February 1, 2019.
19. Wroblewski LE, Peek RM, Jr., Wilson KT. Helicobacter pylori and gastric cancer: factors that modulate disease risk. Clin Microbiol Rev. 2010;23: 713-739.20. Plummer M, Franceschi S, Vignat J, Forman D, de Martel C. Global burden of gastric cancer attributable to pylori. Int J Cancer. 2015;136: 487-490.21. Hooi JKY, Lai WY, Ng WK, et al. Global Prevalence of Helicobacter pylori Infection: Systematic Review and Meta-Analysis. Gastroenterology. 2017;153: 420-429.22. Ford AC, Forman D, Hunt RH, Yuan Y, Moayyedi P. Helicobacter pylori eradication therapy to prevent gastric cancer in healthy asymptomatic infected individuals: systematic review and meta-analysis of randomised controlled trials. BMJ. 2014;348: g3174.23. International Agency for Research on Cancer. Heliobacter pylori Eradication as a Strategy for Preventing Gastric Cancer IARC Workgroup Report. Lyon, France: IARC, 2013.24. Grad YH, Lipsitch M, Aiello AE. Secular trends in Helicobacter pylori seroprevalence in adults in the United States: evidence for sustained race/ethnic disparities. Am J Epidemiol. 2012;175: 54-59.25. Siao D, Somsouk M. Helicobacter pylori: evidence-based review with a focus on immigrant populations. J Gen Intern Med. 2014;29: 520-528.26. International Agency for Research on Cancer. IARC Monograph on Biological Agents: A Review of Human Carcinogens, 2012.27. Engels EA, Cho ER, Jee SH. Hepatitis B virus infection and risk of non-Hodgkin lymphoma in South Korea: a cohort study. Lancet Oncol. 2010;11: 827-834.28. Schillie S, Vellozzi C, Reingold A, et al. Prevention of Hepatitis B Virus Infection in the United States: Recommendations of the Advisory Committee on Immunization Practices. MMWR Recomm Rep. 2018;67: 1-31.29. Centers for Disease Control and Prevention. Viral Hepatitis Surveillance, United States, 2016. Atlanta, GA: Centers for Disease Control and Prevention, 2016 30. Roberts H, Kruszon-Moran D, Ly KN, et al. Prevalence of chronic hepatitis B virus (HBV) infection in U.S. households: National Health and Nutrition Examination Survey (NHANES), 1988-2012. Hepatology. 2016;63: 388-397.31. Kowdley KV, Wang CC, Welch S, Roberts H, Brosgart CL. Prevalence of chronic hepatitis B among foreign-born persons living in the United States by country of origin. Hepatology. 2012;56: 422-433.32. Healy J, Rodriguez-Lainz A, Elam-Evans LD, Hill HA, Reagan-Steiner S, Yankey D. Vaccination coverage among foreign-born and U.S.-born adolescents in the United States: Successes and gaps – National Immunization Survey-Teen, 2012-2014. Vaccine. 2018;36: 1743-1750.33. de Sanjose S, Benavente Y, Vajdic CM, et al. Hepatitis C and non-Hodgkin lymphoma among 4784 cases and 6269 controls from the International Lymphoma Epidemiology Consortium. Clin Gastroenterol Hepatol. 2008;6: 451-458.34. Ryerson AB, Eheman CR, Altekruse SF, et al. Annual Report to the Nation on the Status of Cancer, 1975-2012, featuring the increasing incidence of liver cancer. Cancer. 2016;122: 1312-1337.35. Ly KN, Xing J, Klevens RM, Jiles RB, Ward JW, Holmberg SD. The increasing burden of mortality from viral hepatitis in the United States between 1999 and 2007. Ann Intern Med. 2012;156: 271-278.
40 Cancer Prevention & Early Detection Facts & Figures 2019-2020
36. Moyer VA, US Preventive Services Task Force. Screening for hepatitis C virus infection in adults: U.S. Preventive Services Task Force recommendation statement. Ann Intern Med. 2013;159: 349-357.37. Edlin BR, Eckhardt BJ, Shu MA, Holmberg SD, Swan T. Toward a more accurate estimate of the prevalence of hepatitis C in the United States. Hepatology. 2015;62: 1353-1363.38. Rosenberg ES, Hall EW, Sullivan PS, et al. Estimation of State-Level Prevalence of Hepatitis C Virus Infection, US States and District of Columbia, 2010. Clin Infect Dis. 2017;64: 1573-1581.39. Denniston MM, Jiles RB, Drobeniuc J, et al. Chronic hepatitis C virus infection in the United States, National Health and Nutrition Examination Survey 2003 to 2010. Ann Intern Med. 2014;160: 293-300.40. Chak E, Talal AH, Sherman KE, Schiff ER, Saab S. Hepatitis C virus infection in USA: an estimate of true prevalence. Liver Int. 2011;31: 1090-1101.41. Jemal A, Fedewa SA. Recent Hepatitis C Virus Testing Patterns Among Baby Boomers. Am J Prev Med. 2017;53: e31-e33.42. Castro KG, Ward JW, Slutsker L, et al. 1993 revised classification system for HIV infection and expanded surveillance case definition for AIDS among adolescents and adults. MMWR Recomm Rep. 1992;41: 1-19.43. Shiels MS, Cole SR, Kirk GD, Poole C. A meta-analysis of the incidence of non-AIDS cancers in HIV-infected individuals. J Acquir Immune Defic Syndr. 2009;52: 611-622.44. Simard EP, Pfeiffer RM, Engels EA. Spectrum of cancer risk late after AIDS onset in the United States. Arch Intern Med. 2010;170: 1337-1345.
45. Centers for Disease Control and Prevention. HIV Surveillance Report, 2016. Available from URL: https://www.cdc.gov/hiv/pdf/library/reports/surveillance/cdc-hiv-surveillance-report-2016-vol-28.pdf. Accessed September 10, 2018.46. Shiels MS, Pfeiffer RM, Gail MH, et al. Cancer burden in the HIV-infected population in the United States. J Natl Cancer Inst. 2011;103: 753-762.47. Rosenberg ES, Grey JA, Sanchez TH, Sullivan PS. Rates of Prevalent HIV Infection, Prevalent Diagnoses, and New Diagnoses Among Men Who Have Sex With Men in US States, Metropolitan Statistical Areas, and Counties, 2012-2013. JMIR Public Health Surveill. 2016;2: e22.48. Clarke CA, Morton LM, Lynch C, et al. Risk of lymphoma subtypes after solid organ transplantation in the United States. Br J Cancer. 2013;109: 280-288.49. International Agency for Research on Cancer. IARC Monographs on the Evaluation of Carcinogenic Risks to Humans: Biological Agents. Lyon, France: International Agency for Cancer Research, 2012.50. Cohen JI, Mocarski ES, Raab-Traub N, Corey L, Nabel GJ. The need and challenges for development of an Epstein-Barr virus vaccine. Vaccine. 2013;31 Suppl 2: B194-196.51. Centers for Disease Control and Prevention, National Center for Immunization and Respiratory Diseases. TeenVaxView. Available from URL: https://www.cdc.gov/vaccines/imz-managers/coverage/teenvaxview/data-reports/index.html Accessed August 29, 2018.
Occupational and Environmental Cancer Risk FactorsCarcinogens are substances and exposures that can lead to cancer; they can be synthetic or naturally occurring and will not cause cancer in everyone who is exposed. An individual’s risk of cancer is dependent on numerous factors including the intensity and duration of exposure, other risk and biological factors.
The US National Toxicology Program (NTP) and the World Health Organization’s International Agency for Research on Cancer (IARC) are the primary agencies that evaluate and classify substances. The NTP’s 14th Report on Carcinogens, published in 2016, classifies 62 substances that are known to be, and 186 substances as reasonably anticipated to be human carcinogens.1 The IARC’s multidisciplinary scientific review groups have currently classified 120 agents as Group 1 carcinogens (i.e., carcinogenic to humans) and 82 agents as Group 2A carcinogens (i.e., probably carcinogenic to humans).2 The American Cancer Society does not classify carcinogens
but provides summary information for the public (cancer.org/cancer/cancer-causes.html), based on NTP and IARC reviews; the information is updated as needed with research published since the last reviews. The American Cancer Society also funds and manages the Cancer Prevention Studies, which are long-term epidemiological studies that examine the association between many exposures, including some occupational and environmental factors, and cancer risk.3, 4
Some cancer-causing exposures, such as tobacco smoke and certain infectious agents, have been detailed in other sections of this publication. This section describes environmental carcinogens found in the air, water, and soil, as well as occupational carcinogens. For more information about specific carcinogens and how they are identified, visit ntp.niehs.nih.gov/pubhealth/roc/index-1.html to see the NTP report and monographs.iarc.fr/ENG/Classification/ to review the IARC report.

Cancer Prevention & Early Detection Facts & Figures 2019-2020 41
Occupational Cancer Risk FactorsMany of the first substances found to be carcinogenic were discovered through observations and studies of workers or work environments. For example, a physician in the late 1700s observed higher incidence of testicular cancer among chimney sweeps and concluded that soot was associated with increased cancer risk. Since this time, additional exposures have been more formally examined through scientific studies comparing cancer occurrence among workers exposed to a potential carcinogen with that in the general population. Workers are often exposed to certain substances at higher levels and over a longer period of time than the general public, conferring greater cancer risk.
In 2017, 47 of the 120 IARC’s Group 1 carcinogens were classified as occupational, meaning contact typically occurs in a workplace setting, up from 28 in 2004, a trend that has been attributed to a growing body of research on occupational agents.5 Occupational exposures are known to cause many types of cancer, though the most common occupational-related cancers are those of the lung, skin, bone, and urinary bladder, as well as mesothelioma and leukemia.5, 6 Examples of occupational exposures and the cancers they cause include: diesel engine exhaust among workers in the trucking, mining, and railroad industries,7 and lung and possibly bladder cancers; coal tar products used in roofing and paving, and lung and skin cancers; leather dust exposure from the manufacturing and repair of leather footwear, and nasal cavity and paranasal sinus cancers.5, 6 Certain working conditions may also contribute to cancer risk. Outdoor workers with prolonged exposure to ultraviolet radiation have a higher risk for melanoma. Mounting evidence suggests a positive association between long-term night-shift work and breast, gastrointestinal, and skin cancers in women, though there was not sufficient evidence to classify it as a carcinogen in humans in the most recent IARC monograph, published in 2007.8, 9
Some carcinogens are now more tightly regulated than in the past, leading to declines in present-day exposure. One example is asbestos, a mineral fiber that causes cancers of the lung, larynx, ovary, peritoneum, and pleura.10 Beginning in the late 1800s, it was used in fire protection and insulation products in the US.10, 11 Its use increased
following World War II, peaked in the mid-1970s, then declined due to concerns over its harmful impacts on health and was classified as a carcinogen in 1980.11 While asbestos is rarely produced and consumed in the US today, it may exist in buildings constructed prior to modern regulations and is still regularly produced in other countries. Notably, like many other environmental carcinogens, asbestos-related cancer can occur many decades after exposures have ceased.
Despite dozens of identified occupation-related carcinogens, there are also many substances or working conditions whose impact on cancer and other outcomes are not fully known.12 Continued study of exposures in the midst of changing technology and standards are needed to inform workplace laws set forth by the Occupational Safety and Health Administration, the US agency primarily responsible for worker safety, as well as other federal regulatory agencies. Several large, ongoing cohort studies of workers exposed to potential and known carcinogens are being conducted by the National Cancer Institute (NCI), a government cancer research institution, and the National Institute for Occupational Safety and Health (NIOSH), the governmental institution responsible for ensuring workplace safety and health. As new substances are identified as carcinogenic, it will be important to put protections in place to maintain worker safety.
For more information regarding:
• Occupation/industry and cancer research: cdc.gov/niosh/topics/cancer/default.html
• Workplace standards and carcinogens: osha.gov/SLTC/carcinogens/index.html
Environmental Cancer Risk FactorsThere are also carcinogenic substances in the air, water, and soil. The risk of cancer associated with these types of exposures in typically small, though if the exposure is widespread, the impact on a population can be considerable. Socioeconomically deprived communities are disproportionately affected by exposure to environmental carcinogens, contributing to disparities in the cancer burden across the US. This section highlights a few carcinogens that people might be exposed to
42 Cancer Prevention & Early Detection Facts & Figures 2019-2020
outside the workplace. Visit cancer.org for more information on these and other carcinogens.
Ionizing RadiationIonizing radiation is causally linked to several solid tumors and leukemia.13 Everyone is exposed to some level of ionizing radiation, defined as a particle or electromagnetic wave strong enough to penetrate human skin and remove electrons from atoms. It is naturally present in cosmic rays and radon (discussed in further detail below) and is generated synthetically, such as in medical radiation. Additionally, atomic bombs (e.g, those dropped on Hiroshima and Nagasaki in World War II), nuclear weapons testing, and nuclear power accidents may be sources of synthetic radiation exposure in certain populations.
Background or natural radiation varies by altitude and latitude and on average, currently accounts for about half of all radiation exposure in the US. The other half comes from medical sources, up from 15% in the 1980s.14 The increase in exposure to medical radiation is mostly attributed to the growing use of computerized tomography (CT) scans, a type of x-ray used to diagnose and screen for an array of diseases and injuries.15 Therapeutic radiation used to treat medical conditions, such as certain nerve disorders and some cancers, may increase cancer risk, although the benefits of this treatment generally far exceed the harms. For example, breast cancer patients refusing radiation therapy have been shown to have poorer outcomes than those receiving guideline-recommended treatment.16
Efforts have been established to mitigate overuse of medical radiation, and various public health groups, including the American Cancer Society and the US Preventive Services Task Force, balance the benefits-to-risks when recommending the age to begin and frequency of cancer screening tests (e.g., low-dose CT scans for lung cancer screening and mammography screening for breast cancer) in adults. Youth are more sensitive to radiation than adults, and it is advised that x-rays, including CT scans, only be used when medically necessary. Medical workers (e.g., radiation technicians) should have their radiation levels regularly monitored because cancer risk increases with degree of exposure.
RadonRadon is a form of ionizing radiation that is of particular concern because it accounts for most naturally occurring radiation exposure and is estimated to be the second-leading cause of lung cancer death in the US, accounting for about 20,000 lung cancer cases annually.17 While radon-related lung cancers occur in both nonsmokers and smokers, approximately 85% develop in smokers due to the synergistic effect that radon and tobacco smoke have on lung cancer risk.18
Radon is a colorless and odorless gas that occurs from the breakdown of radioactive elements, including uranium, an element in the Earth’s crust. Virtually everyone is exposed to some level of radon; however, long-term and elevated exposure is of concern due to its negative impact on health. People are typically exposed to elevated levels by inhaling indoor air where radon gas has been trapped. This may occur in tightly sealed buildings or residences constructed in areas with relatively high levels of naturally occurring radon. Predicted radon levels vary widely by geographic location (Figure 5A). The Environmental Protection Agency (EPA) recommends that homeowners test for radon; for those with measured levels exceeding 4 pCi/L, remediation to reduce exposure is recommended. Visit the EPA’s Consumer’s Guide to Radon Reduction at epa.gov/radon/consumers-guide-radon-reduction-how-fix-your-home for more information on residential radon exposure.
Arsenic Arsenic is classified as a carcinogen by the IARC based on its causal association with bladder, lung, and skin cancer.19 It is a natural element found in rocks, soil, water, air, and plants and is also found in synthetic products including pressure-treated wood, cigarette smoke, and pesticides. Inorganic arsenic (unbound to carbon) is more toxic than organic arsenic (bonded to carbon) and has been the focus of most studies on cancer.
The general population is primarily exposed to arsenic by drinking water from aquifers with naturally high levels of inorganic arsenic and to a lesser extent, food, air, and tobacco smoke. The EPA regulates municipal water sources and in 2006, reduced the maximum contaminate

Cancer Prevention & Early Detection Facts & Figures 2019-2020 43
limit (MCL) for arsenic from 50 parts per billion (ppb) to 10, leading to declines in urinary arsenic levels among public water consumers.20 However, household wells are not regulated and may contain levels above the EPA’s MCL if they are drilled or dug into arsenic-containing soil/bedrock. Strong evidence linking arsenic and cancer risk are mostly from observational studies outside the US, where levels of arsenic in drinking water were greater than or equal to 100 ppb. Several regions in the US, including parts of New England, the Midwest, and the West, contain private wells with measurable or predicted levels above the EPA standard of 10 ppb, but below 100 ppb. Evidence for these low-to-moderate levels of arsenic (10-99 ppb) and cancer is mixed, with some research showing an increased risk of bladder cancer in exposed populations and others have not.21, 22 Visit epa.gov/privatewells for more information on arsenic in private drinking water sources and ways to mitigate exposure.
Outdoor Air PollutionIn 2013, the IARC classified outdoor air pollution as a carcinogen based on evidence that it causes lung cancer and increases the risk of bladder cancer.23 Outdoor air pollution contains a mixture of pollutants, such as particulate matter (solid particles and liquid droplets of varying sizes), sulfur dioxide, ozone, nitrogen dioxide, and many other substances. Particulate matter was separately classified as a carcinogen based on its association with lung cancer. Fine particulate matter, defined as particles <2.5 millionths of a meter across (a single human hair is about 30 times greater in width), also referred to as PM2.5, is particularly harmful to human health.
Exposure to outdoor air pollution varies by geographic location, season/temperature, and proximity to its source, which typically originates from transportation, power generation, manufacturing, and the burning of
Figure 5A. Predicted Levels of Naturally Occurring Radon by US County
Note: Zone designation for Puerto Rico is under development.Source: US Environmental Protection Agency.26
©2019, American Cancer Society, Inc, Surveillance Research
Predicted Levels of RadonZone 1 (>4pCi/L)Zone 2 (2 to 4 pCi/L)Zone 3 (<2 pCi/L)
44 Cancer Prevention & Early Detection Facts & Figures 2019-2020
biomass. In the US, several clean-air policies such as the EPA’s Clean Air Act have improved outdoor air quality and the concentration of pollutants has declined between 1990 and 2016.24 However, outdoor air pollution remains a concern because of the large number of people exposed to its deleterious effects, especially those with lower socioeconomic status.25
Visit epa.gov/outdoor-air-quality-data for more information on outdoor air quality.
ConclusionsThere has been significant progress in what is known about the relationship between occupational and environmental risk factors and cancer, although there is much more to be learned. There are several agents, including several types of pesticides (e.g., glyphosate), that have been recently classified as probably or possibly carcinogenic to humans, but there was not enough evidence to definitively classify them as carcinogenic in humans in the recent IARC evaluation. In addition, important questions remain about the amount of pollutant exposure needed to cause cancer, how they can cause cancer, operate together in mixtures, and how other lifestyle factors interact with pollutants. The relationships between cancer and environmental exposures, including drinking water contaminants, electromagnetic fields, ionizing radiation, and endocrine disruptors are still being studied.
References1. National Toxicology Program. Report on Carcinogens, Fourteenth Edition. Research Triangle Park, NC: US Department of Health and Human Services, Public Health Service, 2016.2. International Agency for Research on Cancer. IARC Monographs on the Evaluation of Carcinogenic Risks to Humans. Available from URL: https://monographs.iarc.fr/agents-classified-by-the-iarc/.3. Teras LR, Diver WR, Turner MC, et al. Residential radon exposure and risk of incident hematologic malignancies in the Cancer Prevention Study-II Nutrition Cohort. Environ Res. 2016;148: 46-54.4. Turner MC, Krewski D, Diver WR, et al. Ambient Air Pollution and Cancer Mortality in the Cancer Prevention Study II. Environ Health Perspect. 2017;125: 087013.5. Loomis D, Guha N, Hall AL, Straif K. Identifying occupational carcinogens: an update from the IARC Monographs. Occup Environ Med. 2018;75: 593-603.6. Steenland K, Burnett C, Lalich N, Ward E, Hurrell J. Dying for work: The magnitude of US mortality from selected causes of death associated with occupation. Am J Ind Med. 2003;43: 461-482.
7. Benbrahim-Tallaa L, Baan RA, Grosse Y, et al. Carcinogenicity of diesel-engine and gasoline-engine exhausts and some nitroarenes. Lancet Oncol. 2012;13: 663-664.8. Yuan X, Zhu C, Wang M, Mo F, Du W, Ma X. Night Shift Work Increases the Risks of Multiple Primary Cancers in Women: A Systematic Review and Meta-analysis of 61 Articles. Cancer Epidemiol Biomarkers Prev. 2018;27: 25-40.9. Straif K, Baan R, Grosse Y, et al. Carcinogenicity of shift-work, painting, and fire-fighting. Lancet Oncol. 2007;8: 1065-1066.10. International Agency for Research on Cancer. IARC Working Group on the Evaluation of Carcinogenic Risk to Humans. Lyon, France: International Agency for Research on Cancer, 2012.11. United States Geological Survey. Worldwide Asbestos Supply and Consumption Trends from 1990 and 2003. Reston, Virginia: US Geological Survey, 2006.12. Straif K. The burden of occupational cancer. Occup Environ Med. 2008;65: 787-788.13. International Agency for Research on Cancer. Radiation Volume 100D: A Review of Human Carcinogens. Lyon, France: International Agency for Research on Cancer, 2012.14. National Council on Radiation Protection and Meaurements. NCRP Report No. 160, Ionizing Radiation Exposure of the Population of the United States. Bethesda, MD, 2009.15. Fazel R, Krumholz HM, Wang Y, et al. Exposure to low-dose ionizing radiation from medical imaging procedures. N Engl J Med. 2009;361: 849-857.16. Hamidi M, Moody JS, Kozak KR. Refusal of radiation therapy and its associated impact on survival. Am J Clin Oncol. 2010;33: 629-632.17. Environmental Protection Agency. Assessments of Risks from Radon in Homes. Washington DC: Office of Radiation and Indoor Air, 2003.18. Lubin JH, Boice JD, Jr. Lung cancer risk from residential radon: meta-analysis of eight epidemiologic studies. J Natl Cancer Inst. 1997;89: 49-57.19. Straif K, Benbrahim-Tallaa L, Baan R, et al. A review of human carcinogens – Part C: metals, arsenic, dusts, and fibres. Lancet Oncol. 2009;10: 453-454.20. Nigra AE, Sanchez TR, Nachman KE, et al. The effect of the Environmental Protection Agency maximum contaminant level on arsenic exposure in the USA from 2003 to 2014: an analysis of the National Health and Nutrition Examination Survey (NHANES). Lancet Public Health. 2017;2: e513-e521.21. Meliker JR, Goovaerts P, Jacquez GM, Nriagu JO. Incorporating individual-level distributions of exposure error in epidemiologic analyses: an example using arsenic in drinking water and bladder cancer. Ann Epidemiol. 2010;20: 750-758.22. Baris D, Waddell R, Beane Freeman LE, et al. Elevated Bladder Cancer in Northern New England: The Role of Drinking Water and Arsenic. J Natl Cancer Inst. 2016;108.23. Loomis D, Grosse Y, Lauby-Secretan B, et al. The carcinogenicity of outdoor air pollution. Lancet Oncol. 2013;14: 1262-1263.24. Environmental Protection Agency. Our Nation’s Air. Available from URL: https://gispub.epa.gov/air/trendsreport/2018/#welcome Accessed 12/04/2018.25. Kioumourtzoglou MA, Schwartz J, James P, Dominici F, Zanobetti A. PM2.5 and Mortality in 207 US Cities: Modification by Temperature and City Characteristics. Epidemiology. 2016;27: 221-227.26. US Environmental Protection Agency. Data available at: https://www.epa.gov/radon/find-information-about-local-radon-zones-and-state-contact-information#radonmap. Accessed: February 19, 2019.
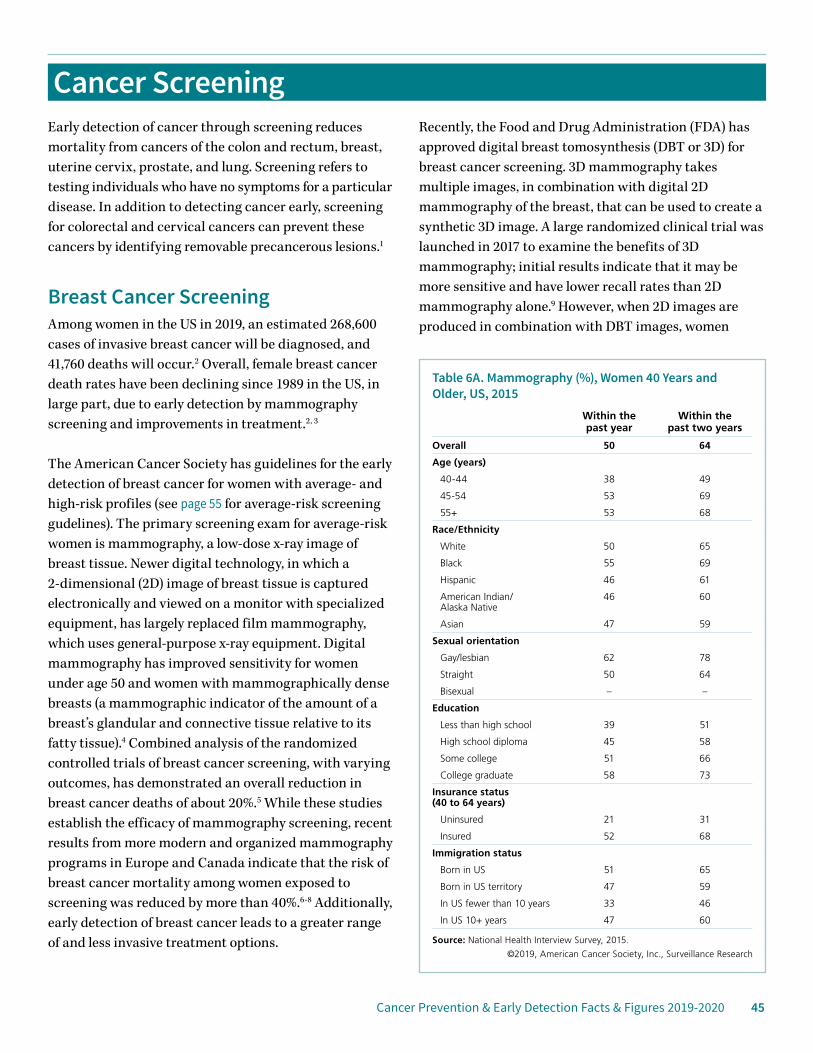
Cancer Prevention & Early Detection Facts & Figures 2019-2020 45
Cancer ScreeningEarly detection of cancer through screening reduces mortality from cancers of the colon and rectum, breast, uterine cervix, prostate, and lung. Screening refers to testing individuals who have no symptoms for a particular disease. In addition to detecting cancer early, screening for colorectal and cervical cancers can prevent these cancers by identifying removable precancerous lesions.1
Breast Cancer ScreeningAmong women in the US in 2019, an estimated 268,600 cases of invasive breast cancer will be diagnosed, and 41,760 deaths will occur.2 Overall, female breast cancer death rates have been declining since 1989 in the US, in large part, due to early detection by mammography screening and improvements in treatment.2, 3
The American Cancer Society has guidelines for the early detection of breast cancer for women with average- and high-risk profiles (see page 55 for average-risk screening gudelines). The primary screening exam for average-risk women is mammography, a low-dose x-ray image of breast tissue. Newer digital technology, in which a 2-dimensional (2D) image of breast tissue is captured electronically and viewed on a monitor with specialized equipment, has largely replaced film mammography, which uses general-purpose x-ray equipment. Digital mammography has improved sensitivity for women under age 50 and women with mammographically dense breasts (a mammographic indicator of the amount of a breast’s glandular and connective tissue relative to its fatty tissue).4 Combined analysis of the randomized controlled trials of breast cancer screening, with varying outcomes, has demonstrated an overall reduction in breast cancer deaths of about 20%.5 While these studies establish the efficacy of mammography screening, recent results from more modern and organized mammography programs in Europe and Canada indicate that the risk of breast cancer mortality among women exposed to screening was reduced by more than 40%.6-8 Additionally, early detection of breast cancer leads to a greater range of and less invasive treatment options.
Recently, the Food and Drug Administration (FDA) has approved digital breast tomosynthesis (DBT or 3D) for breast cancer screening. 3D mammography takes multiple images, in combination with digital 2D mammography of the breast, that can be used to create a synthetic 3D image. A large randomized clinical trial was launched in 2017 to examine the benefits of 3D mammography; initial results indicate that it may be more sensitive and have lower recall rates than 2D mammography alone.9 However, when 2D images are produced in combination with DBT images, women
Table 6A. Mammography (%), Women 40 Years and Older, US, 2015
Within the past year
Within the past two years
Overall 50 64
Age (years)
40-44 38 49
45-54 53 69
55+ 53 68
Race/Ethnicity
White 50 65
Black 55 69
Hispanic 46 61
American Indian/ Alaska Native
46 60
Asian 47 59
Sexual orientation
Gay/lesbian 62 78
Straight 50 64
Bisexual – –
Education
Less than high school 39 51
High school diploma 45 58
Some college 51 66
College graduate 58 73
Insurance status (40 to 64 years)
Uninsured 21 31
Insured 52 68
Immigration status
Born in US 51 65
Born in US territory 47 59
In US fewer than 10 years 33 46
In US 10+ years 47 60
Source: National Health Interview Survey, 2015.
©2019, American Cancer Society, Inc., Surveillance Research
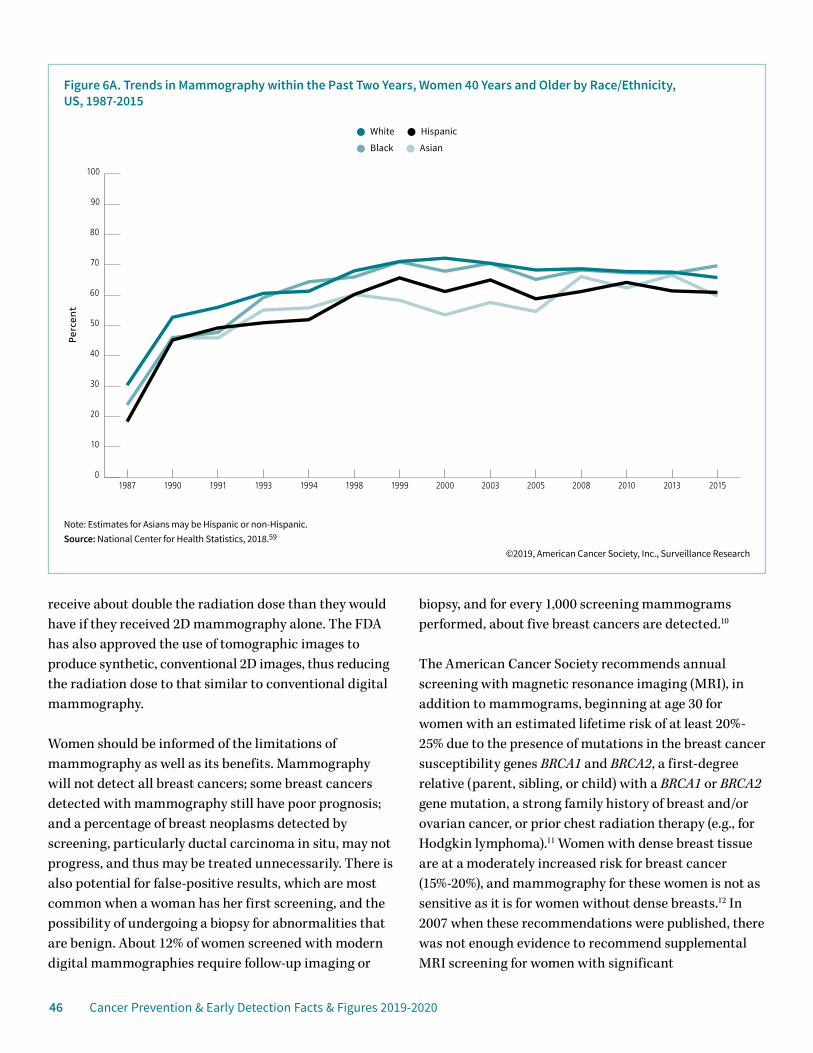
46 Cancer Prevention & Early Detection Facts & Figures 2019-2020
receive about double the radiation dose than they would have if they received 2D mammography alone. The FDA has also approved the use of tomographic images to produce synthetic, conventional 2D images, thus reducing the radiation dose to that similar to conventional digital mammography.
Women should be informed of the limitations of mammography as well as its benefits. Mammography will not detect all breast cancers; some breast cancers detected with mammography still have poor prognosis; and a percentage of breast neoplasms detected by screening, particularly ductal carcinoma in situ, may not progress, and thus may be treated unnecessarily. There is also potential for false-positive results, which are most common when a woman has her first screening, and the possibility of undergoing a biopsy for abnormalities that are benign. About 12% of women screened with modern digital mammographies require follow-up imaging or
biopsy, and for every 1,000 screening mammograms performed, about five breast cancers are detected.10
The American Cancer Society recommends annual screening with magnetic resonance imaging (MRI), in addition to mammograms, beginning at age 30 for women with an estimated lifetime risk of at least 20%-25% due to the presence of mutations in the breast cancer susceptibility genes BRCA1 and BRCA2, a first-degree relative (parent, sibling, or child) with a BRCA1 or BRCA2 gene mutation, a strong family history of breast and/or ovarian cancer, or prior chest radiation therapy (e.g., for Hodgkin lymphoma).11 Women with dense breast tissue are at a moderately increased risk for breast cancer (15%-20%), and mammography for these women is not as sensitive as it is for women without dense breasts.12 In 2007 when these recommendations were published, there was not enough evidence to recommend supplemental MRI screening for women with significant
Note: Estimates for Asians may be Hispanic or non-Hispanic.Source: National Center for Health Statistics, 2018.59
©2019, American Cancer Society, Inc., Surveillance Research
Perc
ent
Figure 6A. Trends in Mammography within the Past Two Years, Women 40 Years and Older by Race/Ethnicity, US, 1987-2015
White Hispanic
Black Asian
0
10
20
30
40
50
60
70
80
90
100
20152013201020082005200320001999199819941993199119901987
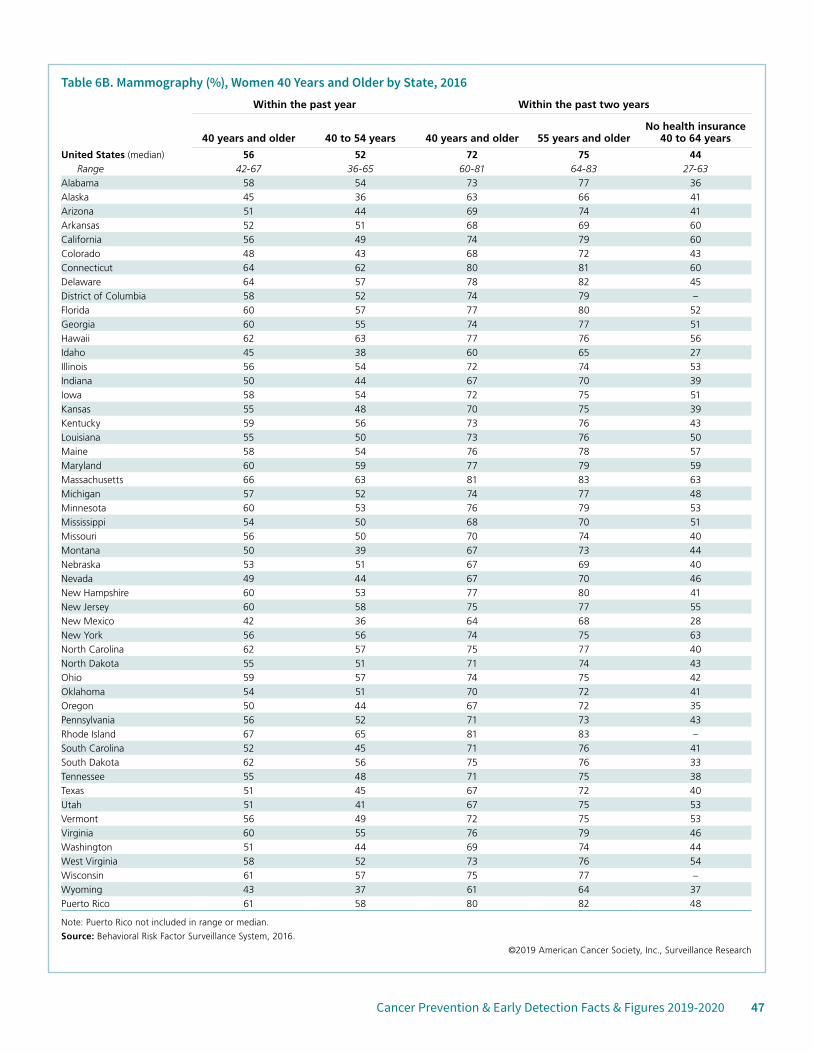
Cancer Prevention & Early Detection Facts & Figures 2019-2020 47
Table 6B. Mammography (%), Women 40 Years and Older by State, 2016Within the past year Within the past two years
40 years and older 40 to 54 years 40 years and older 55 years and olderNo health insurance
40 to 64 years
United States (median) 56 52 72 75 44Range 42-67 36-65 60-81 64-83 27-63
Alabama 58 54 73 77 36Alaska 45 36 63 66 41Arizona 51 44 69 74 41Arkansas 52 51 68 69 60California 56 49 74 79 60Colorado 48 43 68 72 43Connecticut 64 62 80 81 60Delaware 64 57 78 82 45District of Columbia 58 52 74 79 –Florida 60 57 77 80 52Georgia 60 55 74 77 51Hawaii 62 63 77 76 56Idaho 45 38 60 65 27Illinois 56 54 72 74 53Indiana 50 44 67 70 39Iowa 58 54 72 75 51Kansas 55 48 70 75 39Kentucky 59 56 73 76 43Louisiana 55 50 73 76 50Maine 58 54 76 78 57Maryland 60 59 77 79 59Massachusetts 66 63 81 83 63Michigan 57 52 74 77 48Minnesota 60 53 76 79 53Mississippi 54 50 68 70 51Missouri 56 50 70 74 40Montana 50 39 67 73 44Nebraska 53 51 67 69 40Nevada 49 44 67 70 46New Hampshire 60 53 77 80 41New Jersey 60 58 75 77 55New Mexico 42 36 64 68 28New York 56 56 74 75 63North Carolina 62 57 75 77 40North Dakota 55 51 71 74 43Ohio 59 57 74 75 42Oklahoma 54 51 70 72 41Oregon 50 44 67 72 35Pennsylvania 56 52 71 73 43Rhode Island 67 65 81 83 –South Carolina 52 45 71 76 41South Dakota 62 56 75 76 33Tennessee 55 48 71 75 38Texas 51 45 67 72 40Utah 51 41 67 75 53Vermont 56 49 72 75 53Virginia 60 55 76 79 46Washington 51 44 69 74 44West Virginia 58 52 73 76 54Wisconsin 61 57 75 77 –Wyoming 43 37 61 64 37Puerto Rico 61 58 80 82 48
Note: Puerto Rico not included in range or median.
Source: Behavioral Risk Factor Surveillance System, 2016.
©2019 American Cancer Society, Inc., Surveillance Research
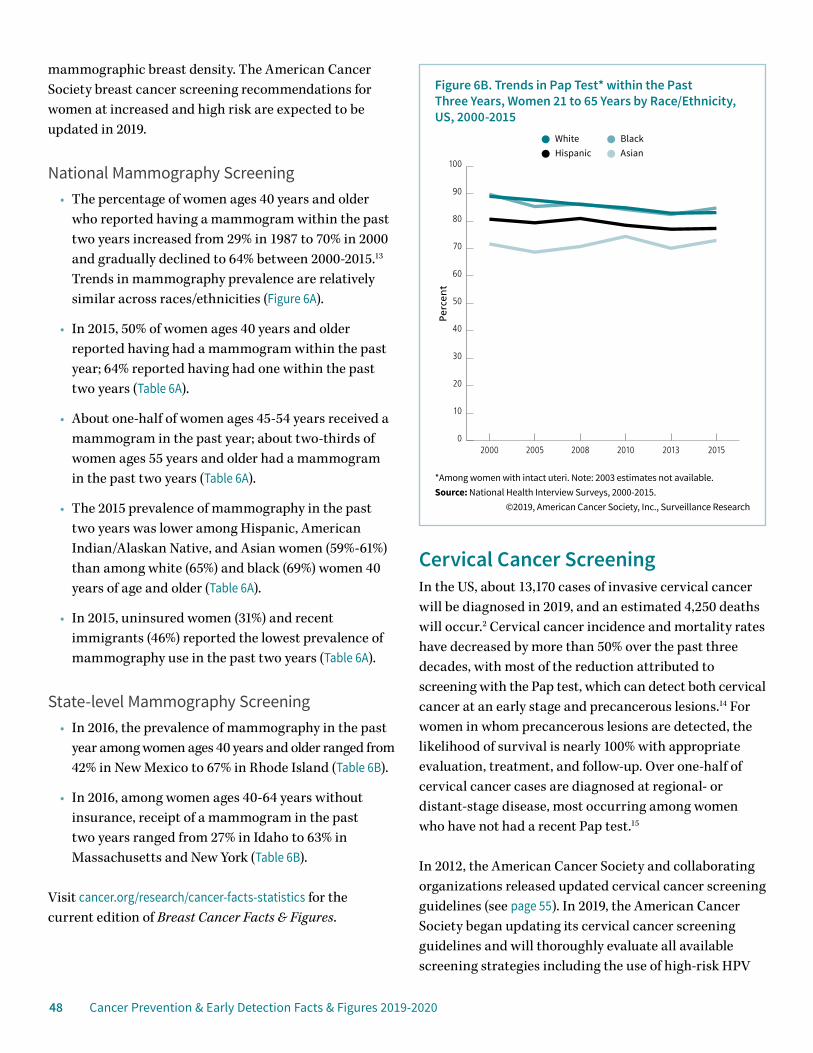
48 Cancer Prevention & Early Detection Facts & Figures 2019-2020
mammographic breast density. The American Cancer Society breast cancer screening recommendations for women at increased and high risk are expected to be updated in 2019.
National Mammography Screening • The percentage of women ages 40 years and older
who reported having a mammogram within the past two years increased from 29% in 1987 to 70% in 2000 and gradually declined to 64% between 2000-2015.13 Trends in mammography prevalence are relatively similar across races/ethnicities (Figure 6A).
• In 2015, 50% of women ages 40 years and older reported having had a mammogram within the past year; 64% reported having had one within the past two years (Table 6A).
• About one-half of women ages 45-54 years received a mammogram in the past year; about two-thirds of women ages 55 years and older had a mammogram in the past two years (Table 6A).
• The 2015 prevalence of mammography in the past two years was lower among Hispanic, American Indian/Alaskan Native, and Asian women (59%-61%) than among white (65%) and black (69%) women 40 years of age and older (Table 6A).
• In 2015, uninsured women (31%) and recent immigrants (46%) reported the lowest prevalence of mammography use in the past two years (Table 6A).
State-level Mammography Screening• In 2016, the prevalence of mammography in the past
year among women ages 40 years and older ranged from 42% in New Mexico to 67% in Rhode Island (Table 6B).
• In 2016, among women ages 40-64 years without insurance, receipt of a mammogram in the past two years ranged from 27% in Idaho to 63% in Massachusetts and New York (Table 6B).
Visit cancer.org/research/cancer-facts-statistics for the current edition of Breast Cancer Facts & Figures.
Cervical Cancer ScreeningIn the US, about 13,170 cases of invasive cervical cancer will be diagnosed in 2019, and an estimated 4,250 deaths will occur.2 Cervical cancer incidence and mortality rates have decreased by more than 50% over the past three decades, with most of the reduction attributed to screening with the Pap test, which can detect both cervical cancer at an early stage and precancerous lesions.14 For women in whom precancerous lesions are detected, the likelihood of survival is nearly 100% with appropriate evaluation, treatment, and follow-up. Over one-half of cervical cancer cases are diagnosed at regional- or distant-stage disease, most occurring among women who have not had a recent Pap test.15
In 2012, the American Cancer Society and collaborating organizations released updated cervical cancer screening guidelines (see page 55). In 2019, the American Cancer Society began updating its cervical cancer screening guidelines and will thoroughly evaluate all available screening strategies including the use of high-risk HPV
*Among women with intact uteri. Note: 2003 estimates not available.Source: National Health Interview Surveys, 2000-2015.
©2019, American Cancer Society, Inc., Surveillance Research
Perc
ent
Figure 6B. Trends in Pap Test* within the Past Three Years, Women 21 to 65 Years by Race/Ethnicity, US, 2000-2015
WhiteAsianHispanicBlack
0
10
20
30
40
50
60
70
80
90
100
201520132010200820052000
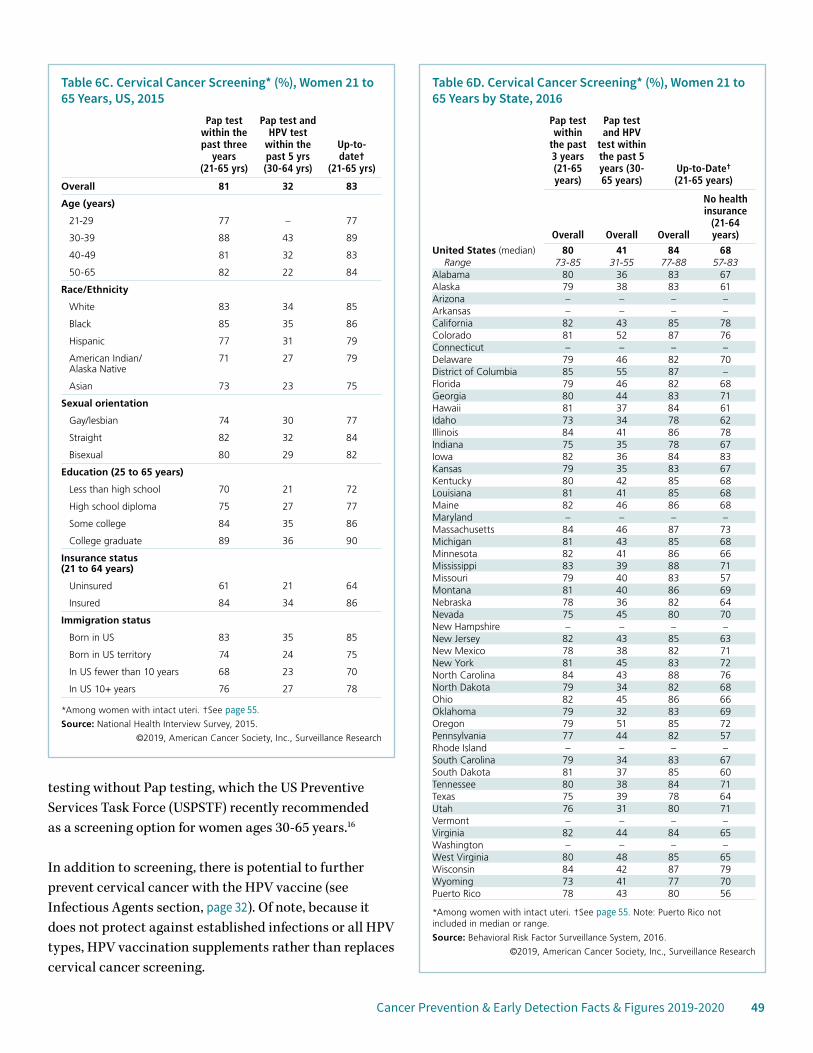
Cancer Prevention & Early Detection Facts & Figures 2019-2020 49
testing without Pap testing, which the US Preventive Services Task Force (USPSTF) recently recommended as a screening option for women ages 30-65 years.16
In addition to screening, there is potential to further prevent cervical cancer with the HPV vaccine (see Infectious Agents section, page 32). Of note, because it does not protect against established infections or all HPV types, HPV vaccination supplements rather than replaces cervical cancer screening.
Table 6C. Cervical Cancer Screening* (%), Women 21 to 65 Years, US, 2015
Pap test within the past three
years (21-65 yrs)
Pap test and HPV test
within the past 5 yrs (30-64 yrs)
Up-to-date†
(21-65 yrs)
Overall 81 32 83
Age (years)
21-29 77 – 77
30-39 88 43 89
40-49 81 32 83
50-65 82 22 84
Race/Ethnicity
White 83 34 85
Black 85 35 86
Hispanic 77 31 79
American Indian/ Alaska Native
71 27 79
Asian 73 23 75
Sexual orientation
Gay/lesbian 74 30 77
Straight 82 32 84
Bisexual 80 29 82
Education (25 to 65 years)
Less than high school 70 21 72
High school diploma 75 27 77
Some college 84 35 86
College graduate 89 36 90
Insurance status (21 to 64 years)
Uninsured 61 21 64
Insured 84 34 86
Immigration status
Born in US 83 35 85
Born in US territory 74 24 75
In US fewer than 10 years 68 23 70
In US 10+ years 76 27 78
*Among women with intact uteri. †See page 55.
Source: National Health Interview Survey, 2015.
©2019, American Cancer Society, Inc., Surveillance Research
Table 6D. Cervical Cancer Screening* (%), Women 21 to 65 Years by State, 2016
Pap test within
the past 3 years (21-65 years)
Pap test and HPV
test within the past 5 years (30-65 years)
Up-to-Date† (21-65 years)
Overall Overall Overall
No health insurance
(21-64 years)
United States (median) 80 41 84 68Range 73-85 31-55 77-88 57-83
Alabama 80 36 83 67Alaska 79 38 83 61Arizona – – – –Arkansas – – – –California 82 43 85 78Colorado 81 52 87 76Connecticut – – – –Delaware 79 46 82 70District of Columbia 85 55 87 –Florida 79 46 82 68Georgia 80 44 83 71Hawaii 81 37 84 61Idaho 73 34 78 62Illinois 84 41 86 78Indiana 75 35 78 67Iowa 82 36 84 83Kansas 79 35 83 67Kentucky 80 42 85 68Louisiana 81 41 85 68Maine 82 46 86 68Maryland – – – –Massachusetts 84 46 87 73Michigan 81 43 85 68Minnesota 82 41 86 66Mississippi 83 39 88 71Missouri 79 40 83 57Montana 81 40 86 69Nebraska 78 36 82 64Nevada 75 45 80 70New Hampshire – – – –New Jersey 82 43 85 63New Mexico 78 38 82 71New York 81 45 83 72North Carolina 84 43 88 76North Dakota 79 34 82 68Ohio 82 45 86 66Oklahoma 79 32 83 69Oregon 79 51 85 72Pennsylvania 77 44 82 57Rhode Island – – – –South Carolina 79 34 83 67South Dakota 81 37 85 60Tennessee 80 38 84 71Texas 75 39 78 64Utah 76 31 80 71Vermont – – – –Virginia 82 44 84 65Washington – – – –West Virginia 80 48 85 65Wisconsin 84 42 87 79Wyoming 73 41 77 70Puerto Rico 78 43 80 56
*Among women with intact uteri. †See page 55. Note: Puerto Rico not included in median or range.
Source: Behavioral Risk Factor Surveillance System, 2016.
©2019, American Cancer Society, Inc., Surveillance Research
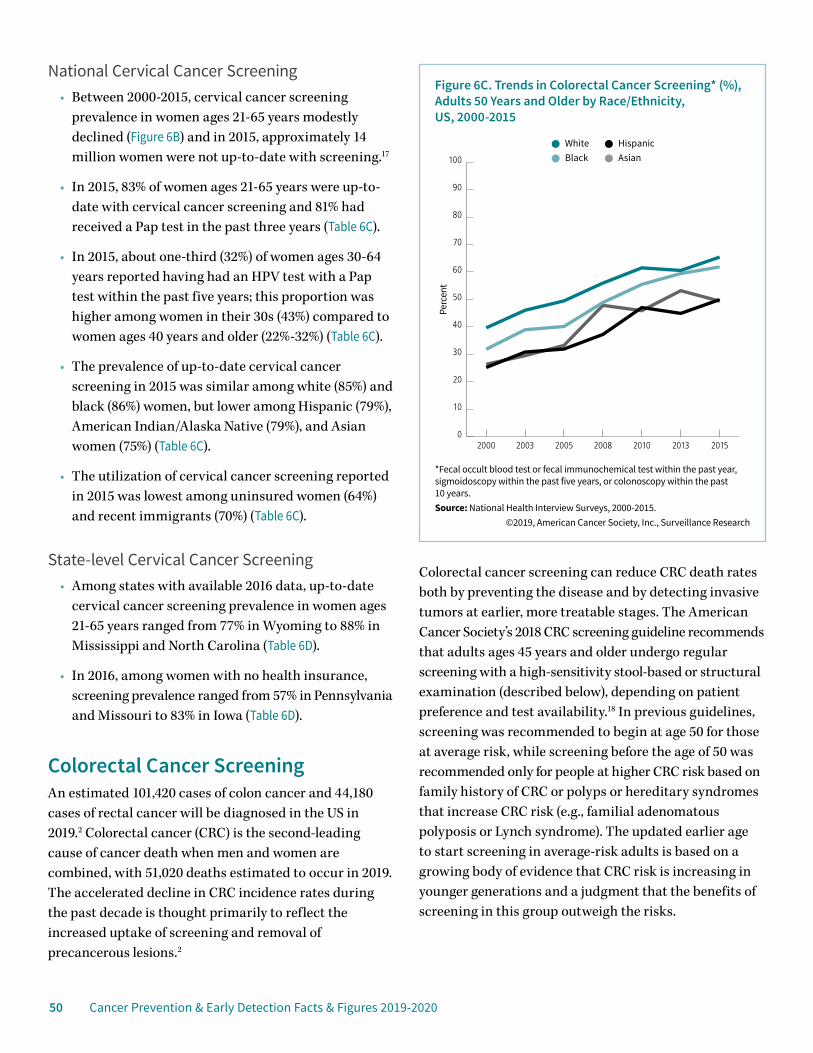
50 Cancer Prevention & Early Detection Facts & Figures 2019-2020
National Cervical Cancer Screening • Between 2000-2015, cervical cancer screening
prevalence in women ages 21-65 years modestly declined (Figure 6B) and in 2015, approximately 14 million women were not up-to-date with screening.17
• In 2015, 83% of women ages 21-65 years were up-to-date with cervical cancer screening and 81% had received a Pap test in the past three years (Table 6C).
• In 2015, about one-third (32%) of women ages 30-64 years reported having had an HPV test with a Pap test within the past five years; this proportion was higher among women in their 30s (43%) compared to women ages 40 years and older (22%-32%) (Table 6C).
• The prevalence of up-to-date cervical cancer screening in 2015 was similar among white (85%) and black (86%) women, but lower among Hispanic (79%), American Indian/Alaska Native (79%), and Asian women (75%) (Table 6C).
• The utilization of cervical cancer screening reported in 2015 was lowest among uninsured women (64%) and recent immigrants (70%) (Table 6C).
State-level Cervical Cancer Screening• Among states with available 2016 data, up-to-date
cervical cancer screening prevalence in women ages 21-65 years ranged from 77% in Wyoming to 88% in Mississippi and North Carolina (Table 6D).
• In 2016, among women with no health insurance, screening prevalence ranged from 57% in Pennsylvania and Missouri to 83% in Iowa (Table 6D).
Colorectal Cancer ScreeningAn estimated 101,420 cases of colon cancer and 44,180 cases of rectal cancer will be diagnosed in the US in 2019.2 Colorectal cancer (CRC) is the second-leading cause of cancer death when men and women are combined, with 51,020 deaths estimated to occur in 2019. The accelerated decline in CRC incidence rates during the past decade is thought primarily to reflect the increased uptake of screening and removal of precancerous lesions.2
Colorectal cancer screening can reduce CRC death rates both by preventing the disease and by detecting invasive tumors at earlier, more treatable stages. The American Cancer Society’s 2018 CRC screening guideline recommends that adults ages 45 years and older undergo regular screening with a high-sensitivity stool-based or structural examination (described below), depending on patient preference and test availability.18 In previous guidelines, screening was recommended to begin at age 50 for those at average risk, while screening before the age of 50 was recommended only for people at higher CRC risk based on family history of CRC or polyps or hereditary syndromes that increase CRC risk (e.g., familial adenomatous polyposis or Lynch syndrome). The updated earlier age to start screening in average-risk adults is based on a growing body of evidence that CRC risk is increasing in younger generations and a judgment that the benefits of screening in this group outweigh the risks.
*Fecal occult blood test or fecal immunochemical test within the past year, sigmoidoscopy within the past five years, or colonoscopy within the past 10 years.Source: National Health Interview Surveys, 2000-2015.
©2019, American Cancer Society, Inc., Surveillance Research
Perc
ent
Figure 6C. Trends in Colorectal Cancer Screening* (%), Adults 50 Years and Older by Race/Ethnicity, US, 2000-2015
WhiteAsianBlackHispanic
0
10
20
30
40
50
60
70
80
90
100
2015201320102008200520032000
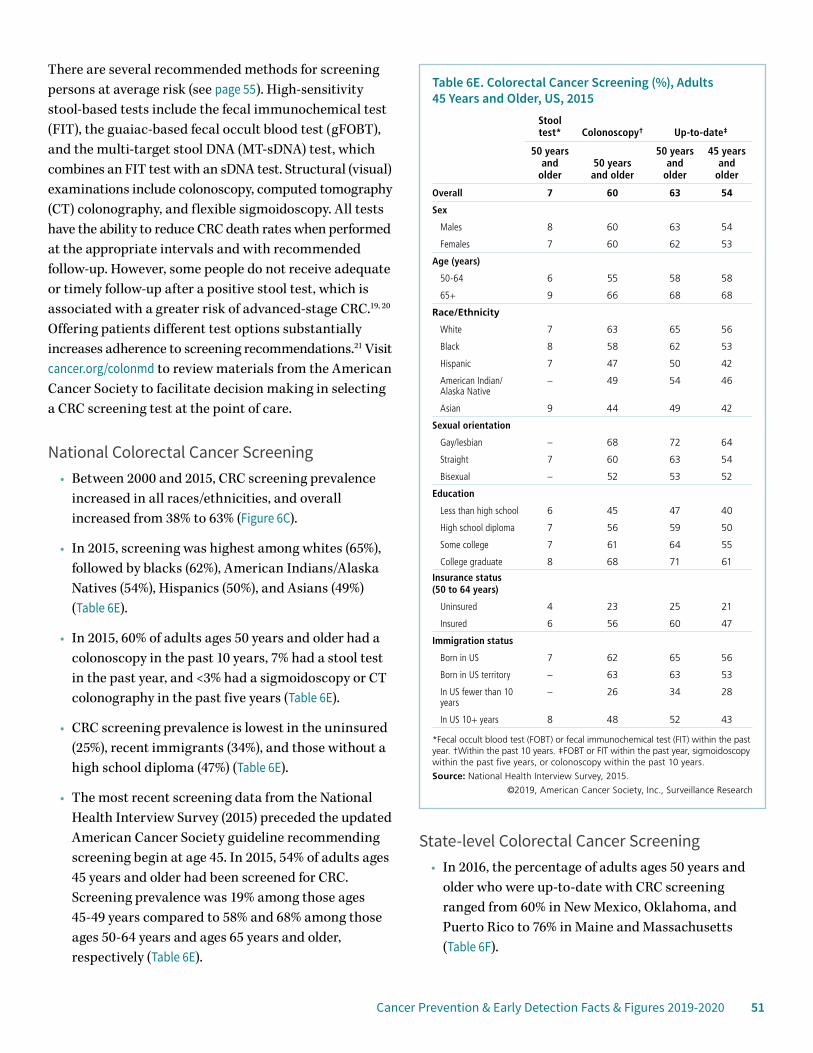
Cancer Prevention & Early Detection Facts & Figures 2019-2020 51
There are several recommended methods for screening persons at average risk (see page 55). High-sensitivity stool-based tests include the fecal immunochemical test (FIT), the guaiac-based fecal occult blood test (gFOBT), and the multi-target stool DNA (MT-sDNA) test, which combines an FIT test with an sDNA test. Structural (visual) examinations include colonoscopy, computed tomography (CT) colonography, and flexible sigmoidoscopy. All tests have the ability to reduce CRC death rates when performed at the appropriate intervals and with recommended follow-up. However, some people do not receive adequate or timely follow-up after a positive stool test, which is associated with a greater risk of advanced-stage CRC.19, 20 Offering patients different test options substantially increases adherence to screening recommendations.21 Visit cancer.org/colonmd to review materials from the American Cancer Society to facilitate decision making in selecting a CRC screening test at the point of care.
National Colorectal Cancer Screening• Between 2000 and 2015, CRC screening prevalence
increased in all races/ethnicities, and overall increased from 38% to 63% (Figure 6C).
• In 2015, screening was highest among whites (65%), followed by blacks (62%), American Indians/Alaska Natives (54%), Hispanics (50%), and Asians (49%) (Table 6E).
• In 2015, 60% of adults ages 50 years and older had a colonoscopy in the past 10 years, 7% had a stool test in the past year, and <3% had a sigmoidoscopy or CT colonography in the past five years (Table 6E).
• CRC screening prevalence is lowest in the uninsured (25%), recent immigrants (34%), and those without a high school diploma (47%) (Table 6E).
• The most recent screening data from the National Health Interview Survey (2015) preceded the updated American Cancer Society guideline recommending screening begin at age 45. In 2015, 54% of adults ages 45 years and older had been screened for CRC. Screening prevalence was 19% among those ages 45-49 years compared to 58% and 68% among those ages 50-64 years and ages 65 years and older, respectively (Table 6E).
State-level Colorectal Cancer Screening• In 2016, the percentage of adults ages 50 years and
older who were up-to-date with CRC screening ranged from 60% in New Mexico, Oklahoma, and Puerto Rico to 76% in Maine and Massachusetts (Table 6F).
Table 6E. Colorectal Cancer Screening (%), Adults 45 Years and Older, US, 2015
Stool test* Colonoscopy† Up-to-date‡
50 years and
older50 years and older
50 years and
older
45 years and
older
Overall 7 60 63 54
Sex
Males 8 60 63 54
Females 7 60 62 53
Age (years)
50-64 6 55 58 58
65+ 9 66 68 68
Race/Ethnicity
White 7 63 65 56
Black 8 58 62 53
Hispanic 7 47 50 42
American Indian/ Alaska Native
– 49 54 46
Asian 9 44 49 42
Sexual orientation
Gay/lesbian – 68 72 64
Straight 7 60 63 54
Bisexual – 52 53 52
Education
Less than high school 6 45 47 40
High school diploma 7 56 59 50
Some college 7 61 64 55
College graduate 8 68 71 61
Insurance status (50 to 64 years)
Uninsured 4 23 25 21
Insured 6 56 60 47
Immigration status
Born in US 7 62 65 56
Born in US territory – 63 63 53
In US fewer than 10 years
– 26 34 28
In US 10+ years 8 48 52 43
*Fecal occult blood test (FOBT) or fecal immunochemical test (FIT) within the past year. †Within the past 10 years. ‡FOBT or FIT within the past year, sigmoidoscopy within the past five years, or colonoscopy within the past 10 years.
Source: National Health Interview Survey, 2015.
©2019, American Cancer Society, Inc., Surveillance Research
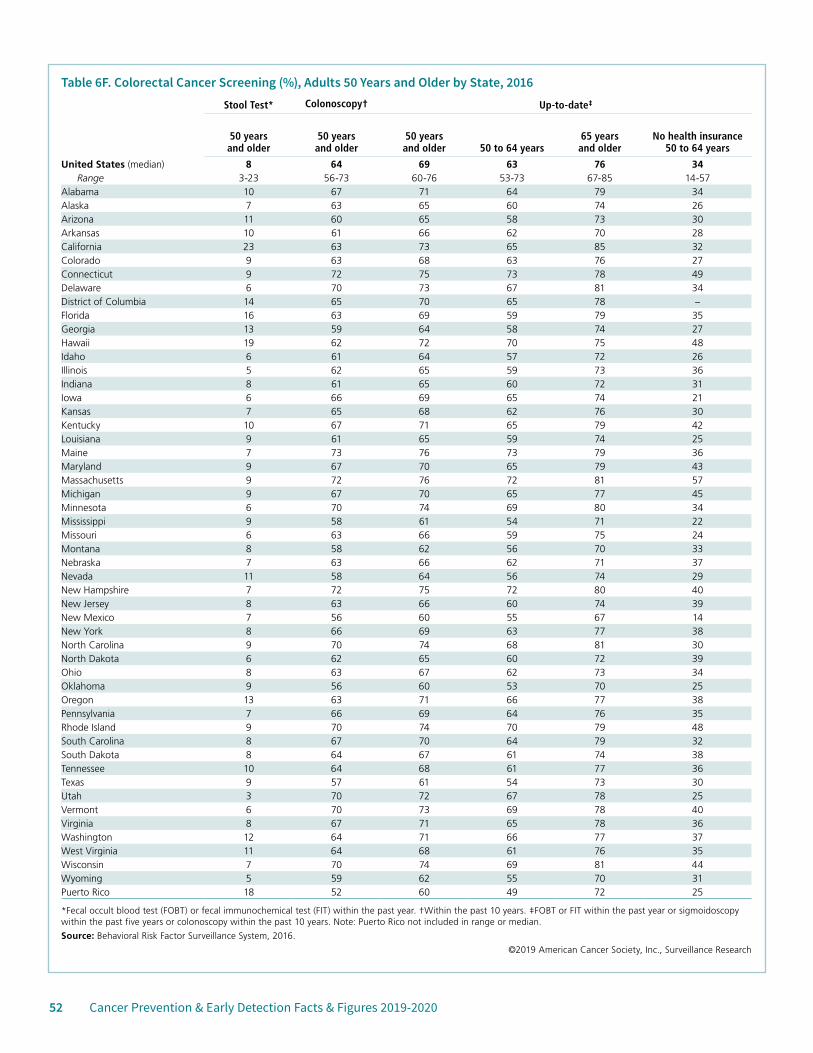
52 Cancer Prevention & Early Detection Facts & Figures 2019-2020
Table 6F. Colorectal Cancer Screening (%), Adults 50 Years and Older by State, 2016Stool Test* Colonoscopy† Up-to-date‡
50 years and older
50 years and older
50 years and older 50 to 64 years
65 years and older
No health insurance 50 to 64 years
United States (median) 8 64 69 63 76 34Range 3-23 56-73 60-76 53-73 67-85 14-57
Alabama 10 67 71 64 79 34Alaska 7 63 65 60 74 26Arizona 11 60 65 58 73 30Arkansas 10 61 66 62 70 28California 23 63 73 65 85 32Colorado 9 63 68 63 76 27Connecticut 9 72 75 73 78 49Delaware 6 70 73 67 81 34District of Columbia 14 65 70 65 78 –Florida 16 63 69 59 79 35Georgia 13 59 64 58 74 27Hawaii 19 62 72 70 75 48Idaho 6 61 64 57 72 26Illinois 5 62 65 59 73 36Indiana 8 61 65 60 72 31Iowa 6 66 69 65 74 21Kansas 7 65 68 62 76 30Kentucky 10 67 71 65 79 42Louisiana 9 61 65 59 74 25Maine 7 73 76 73 79 36Maryland 9 67 70 65 79 43Massachusetts 9 72 76 72 81 57Michigan 9 67 70 65 77 45Minnesota 6 70 74 69 80 34Mississippi 9 58 61 54 71 22Missouri 6 63 66 59 75 24Montana 8 58 62 56 70 33Nebraska 7 63 66 62 71 37Nevada 11 58 64 56 74 29New Hampshire 7 72 75 72 80 40New Jersey 8 63 66 60 74 39New Mexico 7 56 60 55 67 14New York 8 66 69 63 77 38North Carolina 9 70 74 68 81 30North Dakota 6 62 65 60 72 39Ohio 8 63 67 62 73 34Oklahoma 9 56 60 53 70 25Oregon 13 63 71 66 77 38Pennsylvania 7 66 69 64 76 35Rhode Island 9 70 74 70 79 48South Carolina 8 67 70 64 79 32South Dakota 8 64 67 61 74 38Tennessee 10 64 68 61 77 36Texas 9 57 61 54 73 30Utah 3 70 72 67 78 25Vermont 6 70 73 69 78 40Virginia 8 67 71 65 78 36Washington 12 64 71 66 77 37West Virginia 11 64 68 61 76 35Wisconsin 7 70 74 69 81 44Wyoming 5 59 62 55 70 31Puerto Rico 18 52 60 49 72 25
*Fecal occult blood test (FOBT) or fecal immunochemical test (FIT) within the past year. †Within the past 10 years. ‡FOBT or FIT within the past year or sigmoidoscopy within the past five years or colonoscopy within the past 10 years. Note: Puerto Rico not included in range or median.
Source: Behavioral Risk Factor Surveillance System, 2016.
©2019 American Cancer Society, Inc., Surveillance Research
Cancer Prevention & Early Detection Facts & Figures 2019-2020 53
• Stool testing use ranged from 3% in Utah to 23% in California in 2016. CRC screening with colonoscopy ranged from 56% in New Mexico to 73% in Maine (Table 6F).
• In 2016, among uninsured adults ages 50-64 years, only 14% in New Mexico reported up-to-date CRC screening compared to 57% in Massachusetts (Table 6F).
Visit cancer.org/research/cancer-facts-statistics for the current edition of Colorectal Cancer Facts & Figures.
Lung Cancer ScreeningAmong men and women in the US, an estimated 228,150 new cases of lung cancer will be diagnosed in 2019. Lung cancer is the leading cause of cancer death for both men and women; about 142,670 deaths are expected in 2019.2 The overall five-year relative survival rate for lung cancer is low – 16% for men and 22% for women as a result of the large proportion of cases diagnosed with advanced-stage disease.2
The American Cancer Society issued guidelines for lung cancer screening in 2013 (see page 55) after a randomized clinical trial showed that 20% fewer lung cancer deaths occurred in the group that received an invitation to annual low-dose computed tomography (LDCT) screening compared to the group invited to receive annual chest x-rays. Other public health organizations have issued recommendations as well.
Current evidence suggests that screening for lung cancer is most beneficial among people at highest risk for the disease. It is unclear whether the benefits of lung cancer screening for adults with lighter smoking history outweigh the harms, though one model-based study found that some ever smokers not meeting current screening eligibility may benefit from LDCT.22 The risks associated with LDCT screening include cumulative radiation exposure from multiple scans and unnecessary biopsy and surgery in individuals who do not have lung cancer (false positives). Another concern is that some smokers might use LDCT imaging as a reason to continue smoking. Although based on current evidence,
receipt of screening does not appear to influence smoking cessation, but a positive finding from a screening test may be related to smoking abstinence.23
National Lung Cancer Screening• The proportion of eligible current and former smokers
who reported LDCT screening in the past 12 months remained low and constant, from 3.3% in 2010 to 3.9% in 2015.24
• In 2015, of the estimated 6.8 million eligible current and former smokers, only 262,700 received screening.24
Prostate Cancer ScreeningIn 2019, an estimated 174,650 new cases of prostate cancer will be diagnosed in the US; approximately 31,620 men will die of the disease.2 In the US, cancer of the prostate is the most common type of cancer among men (other than skin cancer) and the third-leading cause of cancer death. Mortality rates for prostate cancer have been declining, in part, due to improvements in treatment, management of recurrent disease, and early detection with the prostate-specific antigen (PSA) test (a blood test to assess the levels of a protein made by the prostate).25
The American Cancer Society recommends that asymptomatic men who have a life expectancy of at least 10 years have an opportunity to make an informed decision with their health care provider about whether to be screened for prostate cancer (see page 55). This guideline generally aligns with other groups’ recommendations, including those from the USPSTF, which endorses shared decision making (SDM) for PSA-testing among men ages 55-69 years after a brief period (2012-2016) when they did not recommend routine screening.
Studies have shown that informed and SDM measures are inconsistently utilized in clinical practice and that when such discussions do take place, the content varies widely and frequently falls short of accepted standards.26, 27 To help address this issue, the American Cancer Society provides clinicians with tools to facilitate SDM; visit cancer.org/health-care-professionals/prostate-md.html to access the resources.
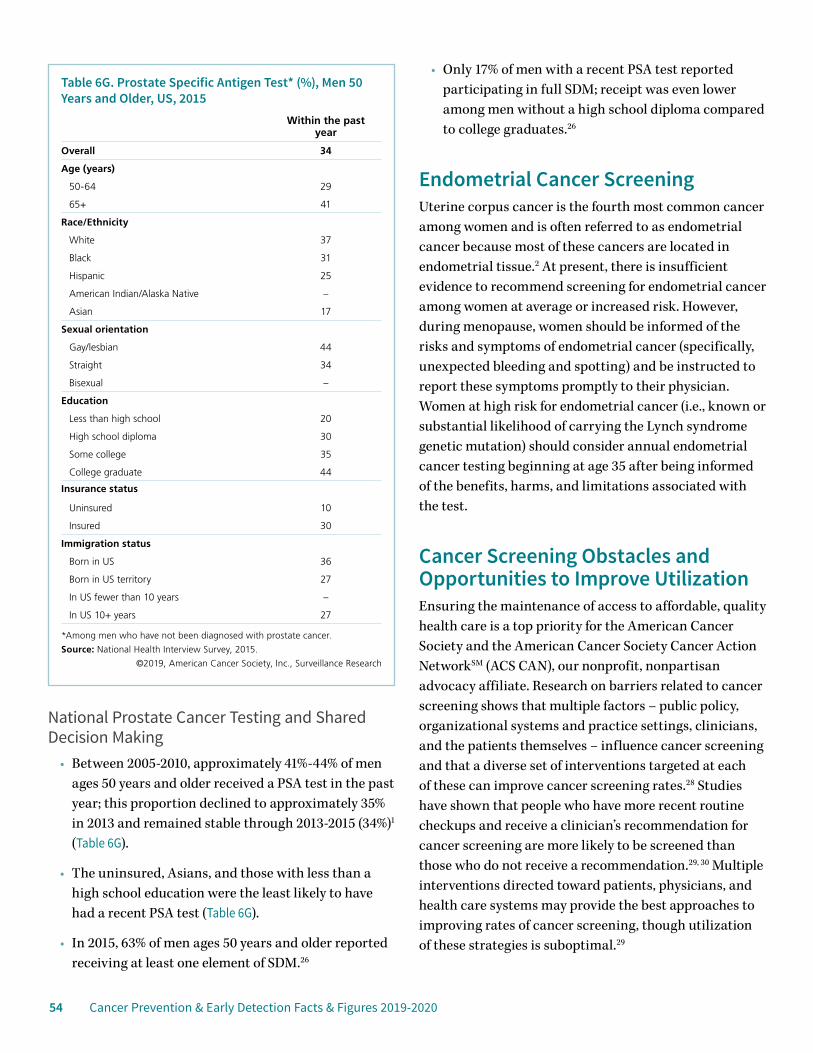
54 Cancer Prevention & Early Detection Facts & Figures 2019-2020
National Prostate Cancer Testing and Shared Decision Making
• Between 2005-2010, approximately 41%-44% of men ages 50 years and older received a PSA test in the past year; this proportion declined to approximately 35% in 2013 and remained stable through 2013-2015 (34%)1 (Table 6G).
• The uninsured, Asians, and those with less than a high school education were the least likely to have had a recent PSA test (Table 6G).
• In 2015, 63% of men ages 50 years and older reported receiving at least one element of SDM.26
• Only 17% of men with a recent PSA test reported participating in full SDM; receipt was even lower among men without a high school diploma compared to college graduates.26
Endometrial Cancer ScreeningUterine corpus cancer is the fourth most common cancer among women and is often referred to as endometrial cancer because most of these cancers are located in endometrial tissue.2 At present, there is insufficient evidence to recommend screening for endometrial cancer among women at average or increased risk. However, during menopause, women should be informed of the risks and symptoms of endometrial cancer (specifically, unexpected bleeding and spotting) and be instructed to report these symptoms promptly to their physician. Women at high risk for endometrial cancer (i.e., known or substantial likelihood of carrying the Lynch syndrome genetic mutation) should consider annual endometrial cancer testing beginning at age 35 after being informed of the benefits, harms, and limitations associated with the test.
Cancer Screening Obstacles and Opportunities to Improve UtilizationEnsuring the maintenance of access to affordable, quality health care is a top priority for the American Cancer Society and the American Cancer Society Cancer Action NetworkSM (ACS CAN), our nonprofit, nonpartisan advocacy affiliate. Research on barriers related to cancer screening shows that multiple factors – public policy, organizational systems and practice settings, clinicians, and the patients themselves – influence cancer screening and that a diverse set of interventions targeted at each of these can improve cancer screening rates.28 Studies have shown that people who have more recent routine checkups and receive a clinician’s recommendation for cancer screening are more likely to be screened than those who do not receive a recommendation.29, 30 Multiple interventions directed toward patients, physicians, and health care systems may provide the best approaches to improving rates of cancer screening, though utilization of these strategies is suboptimal.29
Table 6G. Prostate Specific Antigen Test* (%), Men 50 Years and Older, US, 2015
Within the past year
Overall 34
Age (years)
50-64 29
65+ 41
Race/Ethnicity
White 37
Black 31
Hispanic 25
American Indian/Alaska Native –
Asian 17
Sexual orientation
Gay/lesbian 44
Straight 34
Bisexual –
Education
Less than high school 20
High school diploma 30
Some college 35
College graduate 44
Insurance status
Uninsured 10
Insured 30
Immigration status
Born in US 36
Born in US territory 27
In US fewer than 10 years –
In US 10+ years 27
*Among men who have not been diagnosed with prostate cancer.
Source: National Health Interview Survey, 2015.
©2019, American Cancer Society, Inc., Surveillance Research
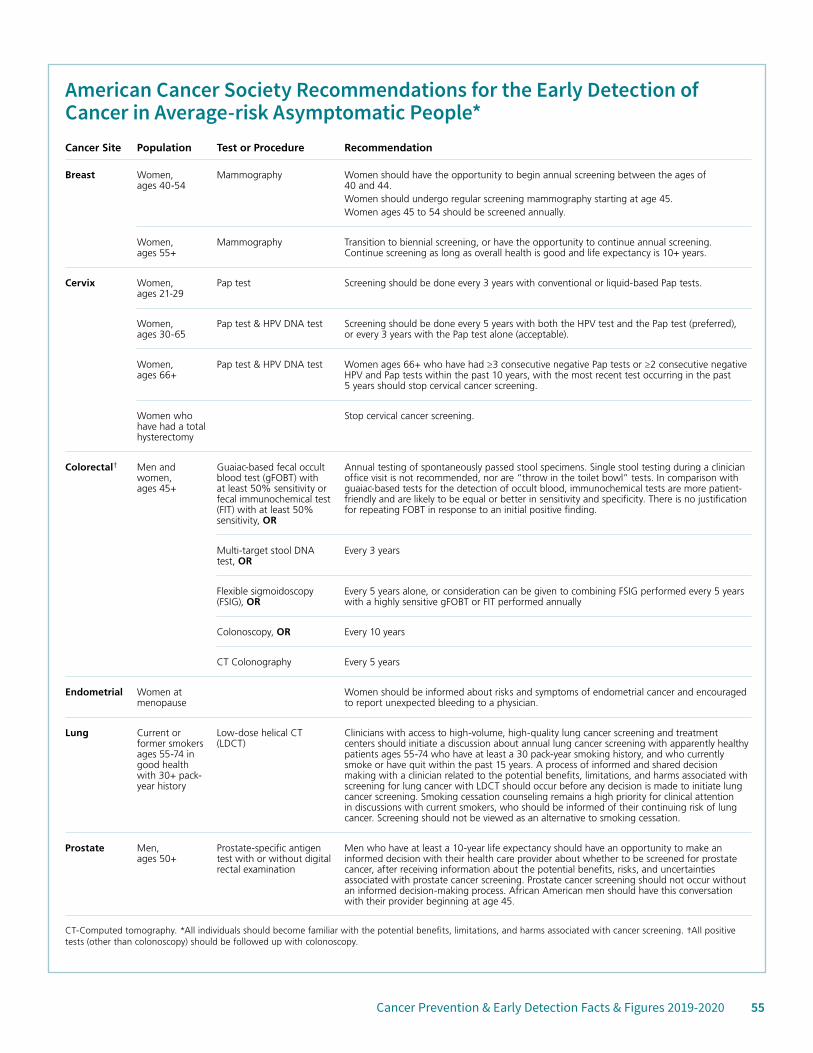
Cancer Prevention & Early Detection Facts & Figures 2019-2020 55
American Cancer Society Recommendations for the Early Detection of Cancer in Average-risk Asymptomatic People* Cancer Site Population Test or Procedure Recommendation
Breast Women, ages 40-54
Mammography Women should have the opportunity to begin annual screening between the ages of 40 and 44.Women should undergo regular screening mammography starting at age 45.Women ages 45 to 54 should be screened annually.
Women, ages 55+
Mammography Transition to biennial screening, or have the opportunity to continue annual screening. Continue screening as long as overall health is good and life expectancy is 10+ years.
Cervix Women, ages 21-29
Pap test Screening should be done every 3 years with conventional or liquid-based Pap tests.
Women, ages 30-65
Pap test & HPV DNA test Screening should be done every 5 years with both the HPV test and the Pap test (preferred), or every 3 years with the Pap test alone (acceptable).
Women, ages 66+
Pap test & HPV DNA test Women ages 66+ who have had ≥3 consecutive negative Pap tests or ≥2 consecutive negative HPV and Pap tests within the past 10 years, with the most recent test occurring in the past 5 years should stop cervical cancer screening.
Women who have had a total hysterectomy
Stop cervical cancer screening.
Colorectal† Men and women, ages 45+
Guaiac-based fecal occult blood test (gFOBT) with at least 50% sensitivity or fecal immunochemical test (FIT) with at least 50% sensitivity, OR
Annual testing of spontaneously passed stool specimens. Single stool testing during a clinician office visit is not recommended, nor are “throw in the toilet bowl” tests. In comparison with guaiac-based tests for the detection of occult blood, immunochemical tests are more patient-friendly and are likely to be equal or better in sensitivity and specificity. There is no justification for repeating FOBT in response to an initial positive finding.
Multi-target stool DNA test, OR
Every 3 years
Flexible sigmoidoscopy (FSIG), OR
Every 5 years alone, or consideration can be given to combining FSIG performed every 5 years with a highly sensitive gFOBT or FIT performed annually
Colonoscopy, OR Every 10 years
CT Colonography Every 5 years
Endometrial Women at menopause
Women should be informed about risks and symptoms of endometrial cancer and encouraged to report unexpected bleeding to a physician.
Lung Current or former smokers ages 55-74 in good health with 30+ pack-year history
Low-dose helical CT (LDCT)
Clinicians with access to high-volume, high-quality lung cancer screening and treatment centers should initiate a discussion about annual lung cancer screening with apparently healthy patients ages 55-74 who have at least a 30 pack-year smoking history, and who currently smoke or have quit within the past 15 years. A process of informed and shared decision making with a clinician related to the potential benefits, limitations, and harms associated with screening for lung cancer with LDCT should occur before any decision is made to initiate lung cancer screening. Smoking cessation counseling remains a high priority for clinical attention in discussions with current smokers, who should be informed of their continuing risk of lung cancer. Screening should not be viewed as an alternative to smoking cessation.
Prostate Men, ages 50+
Prostate-specific antigen test with or without digital rectal examination
Men who have at least a 10-year life expectancy should have an opportunity to make an informed decision with their health care provider about whether to be screened for prostate cancer, after receiving information about the potential benefits, risks, and uncertainties associated with prostate cancer screening. Prostate cancer screening should not occur without an informed decision-making process. African American men should have this conversation with their provider beginning at age 45.
CT-Computed tomography. *All individuals should become familiar with the potential benefits, limitations, and harms associated with cancer screening. †All positive tests (other than colonoscopy) should be followed up with colonoscopy.
56 Cancer Prevention & Early Detection Facts & Figures 2019-2020
Breast and Cervical Cancer Screening Programs and Initiatives The Centers for Disease Control and Prevention’s (CDC) National Breast and Cervical Cancer Early Detection Program (NBCCEDP) provides low-income, uninsured, and underinsured women with access to exams for breast and cervical cancers, as well as diagnostic and follow-up services. Since 1991, the NBCCEDP has served more than 5 million women, provided nearly 13 million screening examinations, and diagnosed more than 64,500 breast cancers and 20,800 lesions; 204,400 precancerous cervical lesions; and 4,500 cases of invasive cervical cancers.31 Among women with abnormal screening results, 90% receive complete diagnostic evaluation.32
Colorectal Cancer Screening Programs and InitiativesThe American Cancer Society, along with the CDC, and many other organizations forming the National Colorectal Cancer Roundtable (NCCRT), launched an initiative in 2014 to raise CRC screening rates to 80% by 2018 (see sidebar, right).
In 2009, the CDC launched the Colorectal Cancer Control Program (CRCCP), which uses a variety of evidence-based strategies aimed at increasing CRC screening rates, especially in lower socioeconomic groups. In July 2015, the CRCCP awarded $23 million in grants to 30 state, university, and tribal grantees to increase CRC screening.33 In the initial two years of the program, CRC screening rates have improved in partnering clinics.
Lung Cancer Screening Programs and InitiativesIn 2017, the American Cancer Society launched the National Lung Cancer Roundtable (NLCRT) to engage key organizations in the common mission of reducing incidence, morbidity, and mortality from lung cancer (see sidebar, page 57).
Healthcare Policy and Cancer ScreeningThe Affordable Care Act (ACA) aims to improve health delivery systems, prevention efforts, and access to care.
More than 20 million uninsured adults gained health insurance coverage as a result of the ACA;34 however, 25 million (12%-13%) adults under the age of 65 remained uninsured as of 2017.35 Gains in insurance coverage among low-income adults have led to improvements in earlier stage at diagnosis for several screen-detected cancers (e.g., breast and colorectal) in states that expanded Medicaid eligibility.36 Provisions of the ACA have helped reduce or eliminate out-of-pocket costs for breast, cervical, colorectal, and lung cancer screening for those Medicare- or privately insured. Researchers have documented increases in CRC screening in the period following implementation of the ACA, particularly among the economically disadvantaged.37
The American Cancer Society and ACS CAN, as well as other organizations, have raised concerns about the cost imposed on Medicare beneficiaries who had a polyp removed during their screening colonoscopy. As of December 2018, legislation was pending before Congress
The National Colorectal Cancer RoundtableThe National Colorectal Cancer Roundtable (NCCRT), established in 1997 by the American Cancer Society and the CDC, is a coalition of more than 100 member organizations and individual experts dedicated to reducing CRC incidence and mortality in the US through coordinated leadership, strategic planning, and advocacy.
The ultimate goal of the NCCRT is to increase the use of recommended CRC screening tests among appropriate populations. In March 2014, the NCCRT launched the 80% by 2018 initiative, an ambitious goal to reach an 80% CRC screening rate among adults ages 50 years and older by 2018. Over 1,700 organizations – including health plans, medical professional societies, hospitals, systems, survivor groups, government agencies, and cancer coalitions – pledged to make this goal a priority. In 2019, the NCCRT’s efforts to reach an 80% nationwide screening rate was renamed 80% In Every Community, with a renewed focus on addressing persistent screening rate disparities so that every community can benefit from lifesaving CRC screening. Visit nccrt.org for more information.
Cancer Prevention & Early Detection Facts & Figures 2019-2020 57
to ensure that Medicare beneficiaries are not assessed cost sharing in connection with a colonoscopy screening regardless of whether a polyp is removed.
With regards to breast cancer screening, some insurance companies may not reimburse physicians for the DBT or 3D mammography. While several states have recently mandated that insurance companies cover 3D mammography, other states have not. Women should have access to 2D or 3D mammography, but with the rapid introduction of DBT, it may be the only mammography exam available.
Visit fightcancer.org for resources related to health insurance and the work of ACS CAN.
References1. Smith RA, Andrews KS, Brooks D, et al. Cancer screening in the United States, 2018: A review of current American Cancer Society guidelines and current issues in cancer screening. CA Cancer J Clin. 2018;68: 297-316.2. Siegel RL, Miller KD, Jemal A. Cancer Statistics, 2019. CA Cancer J Clin. 2019;69: 7-34.3. Plevritis SK, Munoz D, Kurian AW, et al. Association of Screening and Treatment With Breast Cancer Mortality by Molecular Subtype in US Women, 2000-2012. JAMA. 2018;319: 154-164.4. Souza FH, Wendland EM, Rosa MI, Polanczyk CA. Is full-field digital mammography more accurate than screen-film mammography in overall population screening? A systematic review and meta-analysis. Breast (Edinburgh, Scotland). 2013;22: 217-224.5. Marmot MG, Altman DG, Cameron DA, Dewar JA, Thompson SG, Wilcox M. The benefits and harms of breast cancer screening: an independent review. Br J Cancer. 2013;108: 2205-2240.6. Coldman A, Phillips N, Wilson C, et al. Pan-Canadian study of mammography screening and mortality from breast cancer. J Natl Cancer Inst. 2014;106(11). pii: dju261.7. Paci E, Broeders M, Hofvind S, Puliti D, Duffy SW, Group EW. European breast cancer service screening outcomes: a first balance sheet of the benefits and harms. Cancer Epidemiol Biomarkers Prev. 2014;23: 1159-1163.8. Tabar L, Dean PB, Chen TH, et al. The incidence of fatal breast cancer measures the increased effectiveness of therapy in women participating in mammography screening. Cancer. 2019;125: 515-523.9. Marinovich ML, Hunter KE, Macaskill P, Houssami N. Breast Cancer Screening Using Tomosynthesis or Mammography: A Meta-analysis of Cancer Detection and Recall. J Natl Cancer Inst. 2018;110: 942-949.10. Lehman CD, Arao RF, Sprague BL, et al. National Performance Benchmarks for Modern Screening Digital Mammography: Update from the Breast Cancer Surveillance Consortium. Radiology. 2017;283: 49-58.11. Saslow D, Boetes C, Burke W, et al. American Cancer Society Guidelines for Breast Screening with MRI as an Adjunct to Mammography. CA Cancer J Clin. 2007;57: 75–89.12. Kerlikowske K, Hubbard R, Miglioretti D, et al. Comparative-effectiveness of digital vs. film-screen mammography in community practice in the U.S. Ann Intern Med. 2011;155(8):493–502.13. Breen N, Gentleman JF, Schiller JS. Update on mammography trends: comparisons of rates in 2000, 2005, and 2008. Cancer. 2011;117: 2209-2218.14. IARC Working Group on the Evaluation of Cancer Preventive Strategies. IARC Handbooks of Cancer Prevention: Cervix Cancer Screening. Lyon, France: International Agency for Research on Cancer, 2005.15. Leyden WA, Manos MM, Geiger AM, et al. Cervical cancer in women with comprehensive health care access: attributable factors in the screening process. J Natl Cancer Inst. 2005;97: 675-683.16. Curry SJ, Krist AH, Owens DK, et al. Screening for Cervical Cancer: US Preventive Services Task Force Recommendation Statement. JAMA. 2018;320: 674-686.17. Watson M, Benard V, King J, Crawford A, Saraiya M. National assessment of HPV and Pap tests: Changes in cervical cancer screening, National Health Interview Survey. Prev Med. 2017;100: 243-247.
The National Lung Cancer RoundtableIn 2017, the American Cancer Society launched the National Lung Cancer Roundtable (NLCRT) to engage key organizations in the common mission of reducing incidence, morbidity, and mortality from lung cancer among current and former smokers through age- and risk-appropriate high-quality screening, follow-up, and treatment as well as smoking cessation. The NLCRT currently includes more than 80 member organizations across the country. Goals of the roundtable are to:
• Improve awareness in the population at risk for lung cancer
• Improve identification of adults at risk and referral for screening by providers, including risk assessment, competent conversations about lung cancer screening with eligible adults, and follow-up after screening tests
• Increase enrollment and participation in American College of Radiology-designated lung screening center program and lung cancer screening registry, and improve lung screening and diagnosis technology and interpretative skills
• Improve treatment for tobacco cessation and abstinence
• Address special topics such as treatment planning, lung cancer in women, policy issues, survivorship, stigma, and support for state-based programs
Visit nlcrt.org for more information.
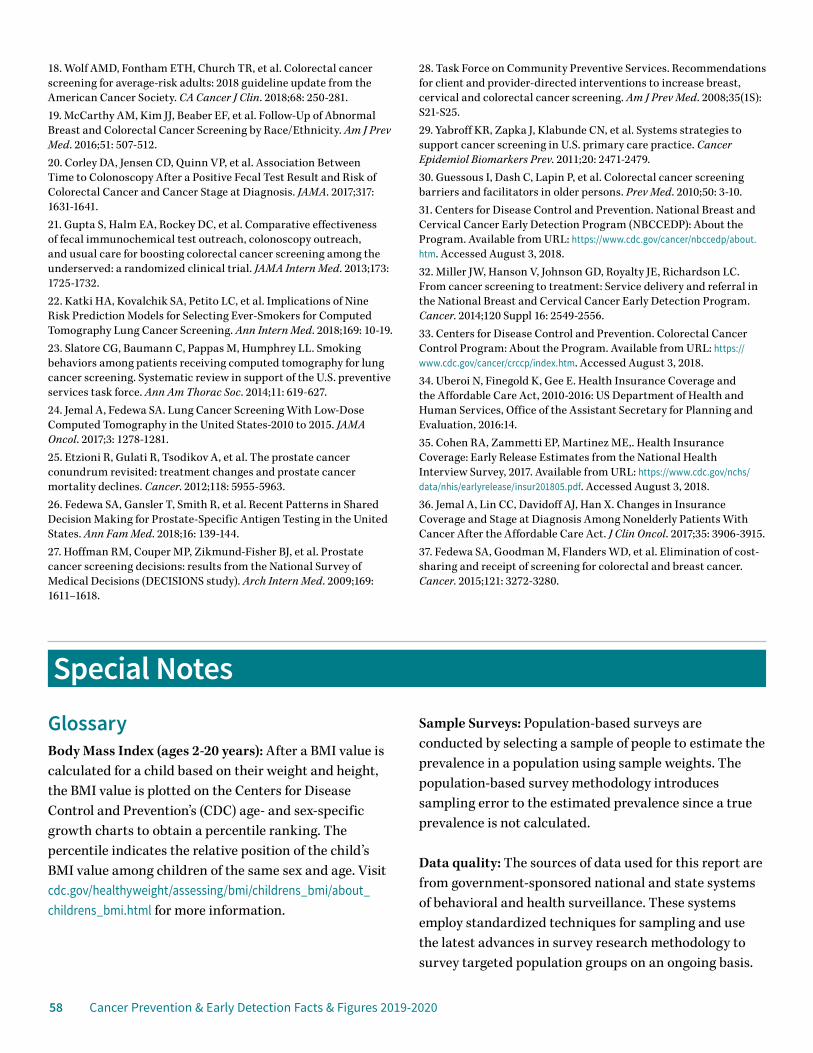
58 Cancer Prevention & Early Detection Facts & Figures 2019-2020
18. Wolf AMD, Fontham ETH, Church TR, et al. Colorectal cancer screening for average-risk adults: 2018 guideline update from the American Cancer Society. CA Cancer J Clin. 2018;68: 250-281.19. McCarthy AM, Kim JJ, Beaber EF, et al. Follow-Up of Abnormal Breast and Colorectal Cancer Screening by Race/Ethnicity. Am J Prev Med. 2016;51: 507-512.20. Corley DA, Jensen CD, Quinn VP, et al. Association Between Time to Colonoscopy After a Positive Fecal Test Result and Risk of Colorectal Cancer and Cancer Stage at Diagnosis. JAMA. 2017;317: 1631-1641.21. Gupta S, Halm EA, Rockey DC, et al. Comparative effectiveness of fecal immunochemical test outreach, colonoscopy outreach, and usual care for boosting colorectal cancer screening among the underserved: a randomized clinical trial. JAMA Intern Med. 2013;173: 1725-1732.22. Katki HA, Kovalchik SA, Petito LC, et al. Implications of Nine Risk Prediction Models for Selecting Ever-Smokers for Computed Tomography Lung Cancer Screening. Ann Intern Med. 2018;169: 10-19.23. Slatore CG, Baumann C, Pappas M, Humphrey LL. Smoking behaviors among patients receiving computed tomography for lung cancer screening. Systematic review in support of the U.S. preventive services task force. Ann Am Thorac Soc. 2014;11: 619-627.24. Jemal A, Fedewa SA. Lung Cancer Screening With Low-Dose Computed Tomography in the United States-2010 to 2015. JAMA Oncol. 2017;3: 1278-1281.25. Etzioni R, Gulati R, Tsodikov A, et al. The prostate cancer conundrum revisited: treatment changes and prostate cancer mortality declines. Cancer. 2012;118: 5955-5963.26. Fedewa SA, Gansler T, Smith R, et al. Recent Patterns in Shared Decision Making for Prostate-Specific Antigen Testing in the United States. Ann Fam Med. 2018;16: 139-144.27. Hoffman RM, Couper MP, Zikmund-Fisher BJ, et al. Prostate cancer screening decisions: results from the National Survey of Medical Decisions (DECISIONS study). Arch Intern Med. 2009;169: 1611–1618.
28. Task Force on Community Preventive Services. Recommendations for client and provider-directed interventions to increase breast, cervical and colorectal cancer screening. Am J Prev Med. 2008;35(1S): S21-S25.29. Yabroff KR, Zapka J, Klabunde CN, et al. Systems strategies to support cancer screening in U.S. primary care practice. Cancer Epidemiol Biomarkers Prev. 2011;20: 2471-2479.30. Guessous I, Dash C, Lapin P, et al. Colorectal cancer screening barriers and facilitators in older persons. Prev Med. 2010;50: 3-10.31. Centers for Disease Control and Prevention. National Breast and Cervical Cancer Early Detection Program (NBCCEDP): About the Program. Available from URL: https://www.cdc.gov/cancer/nbccedp/about.htm. Accessed August 3, 2018.32. Miller JW, Hanson V, Johnson GD, Royalty JE, Richardson LC. From cancer screening to treatment: Service delivery and referral in the National Breast and Cervical Cancer Early Detection Program. Cancer. 2014;120 Suppl 16: 2549-2556.33. Centers for Disease Control and Prevention. Colorectal Cancer Control Program: About the Program. Available from URL: https://www.cdc.gov/cancer/crccp/index.htm. Accessed August 3, 2018.34. Uberoi N, Finegold K, Gee E. Health Insurance Coverage and the Affordable Care Act, 2010-2016: US Department of Health and Human Services, Office of the Assistant Secretary for Planning and Evaluation, 2016:14.35. Cohen RA, Zammetti EP, Martinez ME,. Health Insurance Coverage: Early Release Estimates from the National Health Interview Survey, 2017. Available from URL: https://www.cdc.gov/nchs/data/nhis/earlyrelease/insur201805.pdf. Accessed August 3, 2018.36. Jemal A, Lin CC, Davidoff AJ, Han X. Changes in Insurance Coverage and Stage at Diagnosis Among Nonelderly Patients With Cancer After the Affordable Care Act. J Clin Oncol. 2017;35: 3906-3915.37. Fedewa SA, Goodman M, Flanders WD, et al. Elimination of cost-sharing and receipt of screening for colorectal and breast cancer. Cancer. 2015;121: 3272-3280.
Special NotesGlossaryBody Mass Index (ages 2-20 years): After a BMI value is calculated for a child based on their weight and height, the BMI value is plotted on the Centers for Disease Control and Prevention’s (CDC) age- and sex-specific growth charts to obtain a percentile ranking. The percentile indicates the relative position of the child’s BMI value among children of the same sex and age. Visit cdc.gov/healthyweight/assessing/bmi/childrens_bmi/about_childrens_bmi.html for more information.
Sample Surveys: Population-based surveys are conducted by selecting a sample of people to estimate the prevalence in a population using sample weights. The population-based survey methodology introduces sampling error to the estimated prevalence since a true prevalence is not calculated.
Data quality: The sources of data used for this report are from government-sponsored national and state systems of behavioral and health surveillance. These systems employ standardized techniques for sampling and use the latest advances in survey research methodology to survey targeted population groups on an ongoing basis.
Cancer Prevention & Early Detection Facts & Figures 2019-2020 59
The design and administration of these surveillance systems can provide sources of good-quality data from which to derive population estimates of specific behaviors in a targeted population. The data included in this report are subject to at least three limitations. First, with regards to phone-based surveys such as the Behavioral Risk Factor Surveillance System, the participants are from households with either a landline telephone or cell phone. Second, both in-person and phone surveys have varying proportions of individuals who do not participate for a variety of reasons (e.g., cannot be reached during the time of data collection or refused to participate). Third, most estimates presented herein are based on self-reported data, which may be subject to bias.
Age-adjusted prevalence: A statistical method used to adjust prevalence estimates to allow for valid comparisons between populations with different age compositions
Range: The lowest and highest values of a group of prevalence estimates
Median: Middle value in a range of prevalence estimates. Estimates are arranged from smallest to largest values; the median is the middle value.
Survey SourcesBehavioral Risk Factor Surveillance System (BRFSS): This survey of the US states and territories is conducted by the CDC and the National Center for Chronic Disease Prevention and Health Promotion. Since 1996, all 50 states, the District of Columbia, and Puerto Rico have participated in this annual survey. Data are gathered through monthly computer-assisted telephone interviews with adults ages 18 years and older living in households in a state or US territory. The methods are generally comparable from state to state. Due to methodological changes, BRFSS results within this publication are not directly comparable to BRFSS data prior to 2011. Estimates are not presented if statistically unstable, and screening estimates do not distinguish between examinations for screening and diagnosis.
BRFSS website: cdc.gov/brfss/
Complete citation: Centers for Disease Control and Prevention (CDC). Behavioral Risk Factor Surveillance System Survey Data. Atlanta, Georgia: U.S. Department of Health and Human Services, Centers for Disease Control and Prevention, 2016 and 2017.
National Health and Nutrition Examination Survey (NHANES): Three cycles of this US national survey were conducted between 1971 and 1994. Beginning in 1999, the NHANES was implemented as a continuous annual survey. Data are gathered through in-person interviews and direct physical exams in mobile examination centers.
For NHANES data presented herein, persons of Mexican origin may be of any race. Estimates for whites, blacks, and Asians are among non-Hispanics. Estimates for adults are age adjusted to the 2000 US standard population.
NHANES website: cdc.gov/nchs/nhanes.htm
Complete citation: National Center for Health Statistics. National Health and Nutrition Examination Survey, 2015-2016. Public-use data file and documentation. https://wwwn.cdc.gov/nchs/nhanes/Default.aspx. 2017.
National Health Interview Survey (NHIS): The CDC’s NHIS has monitored the health of the nation since 1957 and is designed to provide national estimates. Data are gathered through a computer-assisted personal interview of adults ages 18 years and older living in households in the US.
For NHIS data presented herein, estimates for white, black, American Indian/Alaska Native, and Asian are among non-Hispanics unless otherwise noted. The Asian group does not include Native Hawaiians or other Pacific Islanders. Estimates for people born in US territories include those who have been in the US for any length of time. Unless otherwise noted, estimates for high school diploma include GED, and some college includes those with an associate’s degree Screening estimates do not distinguish between examinations for screening and diagnosis. Estimates are age adjusted to the 2000
60 Cancer Prevention & Early Detection Facts & Figures 2019-2020
standard US population and are not presented if statistically unstable.
NHIS website: cdc.gov/nchs/nhis/index.htm
Complete citation: National Center for Health Statistics. National Health Interview Surveys, 2000-2017. Public-use data files and documentation. https://www.cdc.gov/nchs/nhis/index.htm
National Immunization Survey-Teen (NIS-Teen): This survey is sponsored and conducted by the National Center for Immunizations and Respiratory Diseases, the National Center for Health Statistics, and the CDC. It is designed to monitor national, state, and selected local area vaccination coverage among children ages 13-17 years in the US. Telephone (landline and cellular) interviews of adolescents’ parents/guardians are conducted in all 50 states and the District of Columbia. Immunization data for surveyed adolescents are also collected through a mail survey of their pediatricians, family physicians, and other health care providers. Race/ethnicity is reported by parent or guardian. Estimates for white, black, American Indian/Alaska Native, and Asian are among non-Hispanics. Those identified as Hispanic might be of any race. Native Hawaiians or other Pacific Islanders and persons of multiple races were not included due to small sample sizes. Adolescents were classified as below poverty if their total family income was less than the federal poverty level. Methods for calculating HPV initiation before the age of 13 are described here: Fedewa et al, Cancer 2018. https://www.ncbi.nlm.nih.gov/m/pubmed/30257056/
NIS-Teen website: cdc.gov/vaccines/imz-managers/nis/ about.html
Complete citation: U.S. Department of Health and Human Services (DHHS). National Center for Immunization and Respiratory Diseases. The 2017 National Immunization Survey - Teen. Hyattsville, MD: Centers for Disease Control and Prevention, 2018. https://www.cdc.gov/vaccines/imz-managers/nis/datasets-teen.html
National Youth Tobacco Survey (NYTS): This national survey was first conducted in fall 1999. Beginning in 2011, the CDC’s Office on Smoking and Health and the US Food and Drug Administration’s Center for Tobacco Products began collaborating on the NYTS. Now an annual survey, it is designed to provide national data for public and private students in grades six through 12. Data are gathered through a self-administered questionnaire completed during a required subject or class period. For NYTS data presented herein, estimates for white, black, American Indian/Alaska Native, and Asian are among non-Hispanics unless otherwise noted.
NYTS website: cdc.gov/TOBACCO/data_statistics/surveys/NYTS/
Complete citation: Office on Smoking and Health, National Center for Chronic Disease Prevention and Health Promotion. National Youth Tobacco Survey data. Available from: https://www.cdc.gov/tobacco/data_statistics/surveys/nyts/data/index.html
Youth Risk Behavior Surveillance System (YRBSS): This biennial survey of the CDC’s National Center for Chronic Disease Prevention and Health Promotion began in 1991. It is designed to provide national, state, and local prevalence estimates. Data are gathered through a self-administered questionnaire completed during a required subject or class period. The state and local surveys are of variable data quality, and caution should be used when comparing data among them. Data from states and local areas with an overall response rate of 60% and appropriate documentation are considered weighted and are generalized to all public and private high school students in grades nine through 12 in the respective jurisdiction. Data that do not meet the weighting requirements are not publicly available. Weighted data for 2017 were not available for Alabama, Georgia, Indiana, Mississippi, New Jersey, Ohio, or South Dakota. Additionally, participation in YRBSS is a voluntary collaboration between a state’s departments of health and education; Minnesota, Oregon, Washington, and Wyoming did not participate in the 2017 YRBSS survey. Participating states may not have data for all measures on a given topic.
YRBSS website: cdc.gov/HealthyYouth/yrbs/index.htm
Cancer Prevention & Early Detection Facts & Figures 2019-2020 61
List of Tables and FiguresTables1A. Current Cigarette Smoking (%), Adults 18 Years and Older, US, 2017
1B. Current Tobacco Use (%), Adults 18 Years and Older by State, 2017
1C. Current Tobacco Use (%), High School Students, US, 2018
1D. Current Tobacco Use (%), High School Students by State, 2017
1E. Comprehensive Tobacco Control Measures by State, 2018-2019
2A. Overweight and Obesity (%), Adults 18 Years and Older by State, 2017
2B. Overweight and Obesity (%), High School Students by State, 2017
2C. Alcohol, Diet, and Physical Activity (%), Adults 18 Years and Older by State, 2017
2D. Diet and Physical Activity (%), High School Students by State, 2017
2E. Physical Activity (%), Adults 18 Years and Older, US, 2017
3A. Sunburn and Use of an Indoor Tanning Device (%), High School Students, US, 2017
4A. Vaccination Coverage (%), Youth by Sex, Race/Ethnicity, and Poverty Status, US, 2017
4B. Vaccination Coverage (%), Adolescents 13 to 17 Years by State, 2017
6A. Mammography (%), Women 40 Years and Older, US, 2015
6B. Mammography (%), Women 40 Years and Older by State, 2016
6C. Cervical Cancer Screening (%), Women 21 to 65 Years, US, 2015
6D. Cervical Cancer Screening (%), Women 21 to 65 Years by State, 2016
6E. Colorectal Cancer Screening (%), Adults 45 Years and Older, US, 2015
6F. Colorectal Cancer Screening (%), Adults 50 Years and Older by State, 2016
6G. Prostate Specific Antigen Test (%), Men 50 Years and Older, US, 2015
Figures
1A. Proportion of Cancer Cases and Deaths Attributable to Cigarette Smoking, Adults 30 Years and Older, US, 2014
1B. Current Cigarette Smoking Trends (%), Adults 18 Years and Older by Sex and Race/Ethnicity, US, 1990-2017
1C. Current Cigarette Smoking (%) Trends, 12th-graders by Race/Ethnicity, US, 1977-2018
1D. State Funding for Tobacco Control, Fiscal Year 2019
1E. Tobacco Product Marketing Exposure Trends (%), Middle and High School Students, US, 2014-2017
2A. Excess Body Weight (%), Youth and Adults, US, 2015-2016
2B. Obesity Trends, Adults 20-74 Years by Sex and Race/Ethnicity, US, 1976-2016
2C. Obesity Trends, Adolescents 12-19 Years by Sex and Race/Ethnicity, US, 1976-2016
2D. No Leisure-time Physical Activity and Excess Body Weight (%), Adults 18 Years and Older by State, 2017
3A. Sun Protective Behaviors (%), Adults 18 Years and Older, US, 2015
3B. State Indoor Tanning Restrictions for Minors, 2019
4A. Up-to-date Human Papillomavirus Vaccination (%), Adolescents 13 to 17 Years by State, 2017
5A. Predicted Levels of Naturally Occurring Radon by US County
6A. Trends in Mammography within the Past Two Years, Women 40 Years and Older by Race/Ethnicity, US, 1987-2015
6B. Trends in Pap Test within the Past Three Years, Women 21 to 65 Years by Race/Ethnicity, US, 2000-2015
6C. Trends in Colorectal Cancer Screening (%), Adults 50 Years and Older by Race/Ethnicity, US, 2000-2015
AcknowledgmentsThe production of this report would not have been possible without the efforts of: Kim Andrews; Cammie Barnes, MBA; Emily Butler Bell, MPH; Zach Cahn, PhD; Cathy Callaway; Michelle DelFavero, MOT, MPH; Carol DeSantis, MPH; Ryan Diver, MSPH; Colleen Doyle, MS, RD; Jeffrey Drope, PhD; Eric Engels, MD, MPH; MaryBeth Freeman, MPH; Susan Gapstur, PhD, MPH; Dawn Holman, MPH; Farhad Islami Gomeshtapeh, MD, PhD; Eric Jacobs, PhD; Ahmedin Jemal, DVM, PhD; Rabia Khan, MPH; Len Lichtenfeld, MD, MACP; Lauri Markowitz, MD; Marji McCullough, ScD, RD; Catherine McMahon, MPH; Alpa Patel, PhD; David Sampson; Debbie Saslow, PhD; Rebecca Siegel, MPH; Scott Simpson; Robert Smith, PhD; Hyuna Sung, PhD; Lauren Teras, PhD; Margaret Tucker, MD; Michelle Turner, PhD; Dana Wagner; Elizabeth Ward, PhD; J. Lee Westmaas, PhD.
Cancer Prevention & Early Detection Facts & Figures is a biannual publication of the American Cancer Society, Atlanta, Georgia. Updated tables and figures are available online at cancer.org/research/cancer-facts-statistics.html in years for which a complete edition is not produced.
For more information, contact: Stacey Fedewa, MPH, PhD; Ann Goding Sauer, MSPH
©2019, American Cancer Society, Inc.No. 860019Models used for illustrative purposes only.
The American Cancer Society’s mission is to save lives, celebrate lives, and lead the fight for a world without cancer.
cancer.org | 1-800-227-2345