cancer in the philippines vol. iv part 2
TRANSCRIPT
32
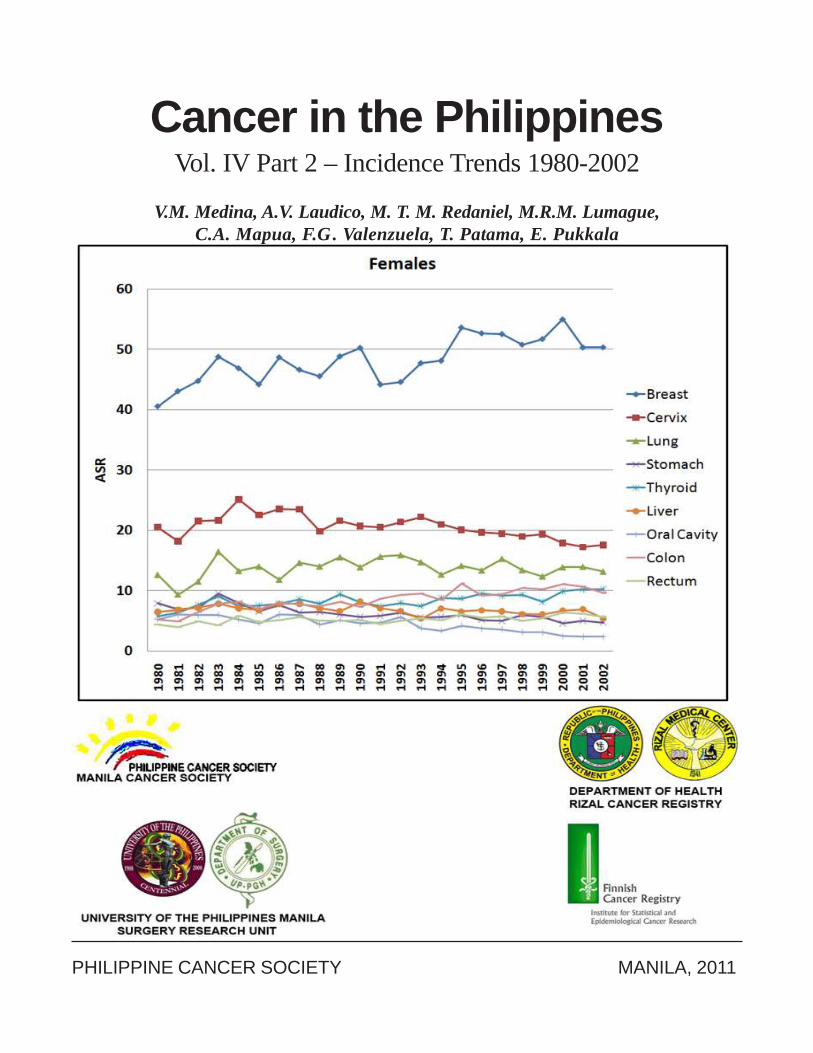
Cancer in the PhilippinesVol. IV Part 2 – Incidence Trends 1980-2002
V.M. Medina, A.V. Laudico, M. T. M. Redaniel, M.R.M. Lumague,C.A. Mapua, F.G . Valenzuela, T. Patama, E. Pukkala
PHILIPPINE CANCER SOCIETY MANILA, 2011
34
Cancer in the PhilippinesVol. IV Part 2 – Incidence Trends 1980-2002
V.M. Medina, A.V. Laudico, M.T.M. Redaniel, M.R.M. Lumague,C.A. Mapua, F.G . Valenzuela, T. Patama, E. Pukkala
PHILIPPINE CANCER SOCIETY - MANILA CANCER REGISTRY DEPARTMENT OF HEALTH – RIZAL CANCER REGISTRY
UNIVERSITY OF THE PHILIPPINES MANILA – SURGERY RESEARCH UNIT FINNISH CANCER REGISTRY
PHILIPPINE CANCER SOCIETY MANILA, 2011

33
Table of Contents
FOREWORD ................................................................................................................................ iii
I. INTRODUCTION ......................................................................................................................... 1
II. METHODS ..................................................................................................................................... 1
III. RESULTS AND DISCUSSION .................................................................................................... 4
3.1 All Sites ................................................................................................................................... 4
3.2 Oral Cancer .............................................................................................................................. 5
3.3 Stomach Cancer ........................................................................................................................ 7
3.4 Colon Cancer ............................................................................................................................ 9
3.5 Rectum Cancer ...................................................................................................................... 11
3.6 Lung Cancer ........................................................................................................................... 13
3.7 Liver Cancer ........................................................................................................................... 15
3.8 Breast Cancer ......................................................................................................................... 17
3.9 Cervical Cancer ...................................................................................................................... 19
3.10 Prostate Cancer ...................................................................................................................... 20
3.11 Thyroid Cancer ...................................................................................................................... 22
References ..................................................................................................................................... 24
Appendices .................................................................................................................................... 26
Contributors ................................................................................................................................. 28
Philippine Cancer Society Board of TrusteesPhilippine Cancer Society-Manila Cancer Registry Staff &Department of Health-Rizal Cancer Registry Staff ............................................................... 29

31
FOREWORD
This monograph presents the second part of the fourth volume of the analysis of the incidence ofcancer in the populations of Metro Manila and Rizal Province, in the Republic of the Philippines. Theanalysis made use of databases from two population-based cancer registries, namely the Department ofHealth-Rizal Cancer Registry and the Philippine Cancer Society-Manila Cancer Registry. Presentedhere are cancer incidence trends from 1980 to 2002, which were determined using joinpoint regressionand time-space maps.
iii
1
IINTRODUCTION
This is the second part of the fourth volume of the Cancer in the Philippines series, and it presents cancerincidence trends for Metro Manila and Rizal Province from 1980 to 2002.
Cancer incidence has been reported for the Metro Manila and Rizal Province areas in the Cancer in thePhilippines monographs1-4 and, Philippine Cancer Facts and Estimates5-9 of the Philippine Cancer Society(PCS) as well as the Cancer Incidence in Five Continents series of the International Agency for Research onCancer (IARC)10. However, trends have only been described in general detail and with less imprecise methodsthan what are currently available.
Incidence trends reflect changing exposures to cancer risk factors and, if present, the effects of interventionsor programs aimed to control or minimize such exposures. They provide information on the effects of riskfactors, and help monitor and evaluate cancer control programs.
IIMETHODS
Data Gathering
Case finding, abstracting, data management and quality control have been described in detail in Cancer inthe Philippines Vol. IV Part 1. 4
Data Analysis
Data analysis was done in three phases: 1) computation of age-standardized rates (ASR); 2) determiningtrends and annual percent change in ASRs using joinpoint regression; 3) illustrating and describing spatio-temporal trends as maps.
Computation of Age-standardized Rates
The computation of incidence rates was based on the number of new cases registered by the DOH-RCR andthe PCS-MCR from 1 January 1980 to 31 December 2002. ASRs were computed for each year of study. Datawere summarized and grouped into 5-year age groups and the age-standardized rates were computed usingthe World Standard Population. The ASRs in Part 1 were computed using an earlier version of the datasetwhile the ASRs for the spatial maps in Part 2 were computed using an updated version of the dataset.
Joinpoint Regression
Joinpoint regression analysis11 was done to determine changes in the trend, using the joinpoint software12
downloaded from the website of the Surveillance Research program of the USA National Cancer Institute.

2
This method gives a more proper description of the patterns than linear regression and is useful in monitoringchanges in cancer incidence.
The joinpoint regression determines a series of lines that are connected by a joinpoint, which indicates astatistically significant change in the trend. Trends were assessed by identifying the best-fitting points where asignificant change in the slope occurred. The analysis began with the minimum number of joinpoints, a zero,representing a straight line. The presence of additional joinpoints was assessed and these were retained ifthey denoted a significant change in the trend.
The estimated annual percentage change (APC) was computed for each of the periods to describe the lineartrends. The annual percentage change assumed that the rates changed at a constant percentage of the rate ofthe preceding year.
The following model was used to compute for the annual percentage change.
Cancer Maps
To produce maps on cancer incidence, ASRs (World Standard Population) were calculated for eachmunicipality for 7-year periods 1980-1986, 1988-1994 and 1996-2002. For a given municipality, the observationswere assigned to geographical central points; other geographical data needed in the map production includedgeographical data such as coordinates of national borders (using Alber’s equal area projection). Threeadministrative regions were located in two separate geographical locations. For these regions, the incidencerate was also located to two separate map coordinates with weights to correspond to sizes of populationsliving in those regions. We used the mapping method developed by the Finnish Cancer Registry13. For six major cities with morethan 100,000 inhabitants per sex, the rates were presented as coloured circles on the maps. The radius of thecircle indicates the size of the population and the colour the ASR. The rates for the remaining municipalitieswere smoothed to decrease visibility of change variation. For each 2km by 2km grid, a weighted average ofthe ASRs of the neighbouring municipalities within a 60 km radius was calculated to define the colour of thatgrid. The rates were directly weighted with the population size of the municipality and inversely weighted inrelation to the distance. Each step on the colour scale of the maps corresponded to a 10% increase in the ASR.
log (Ry) = b0 + b1y where log (Ry) is the natural log of the rate in year y
The APC from year y to year y + 1 = [Ry+1 – Ry) / Ry] x 100
= [eb0+b1(y+1) – eb0+b1(y)] / eb0+b1(y) x 100,
= (eb1 – 1) x 100
3
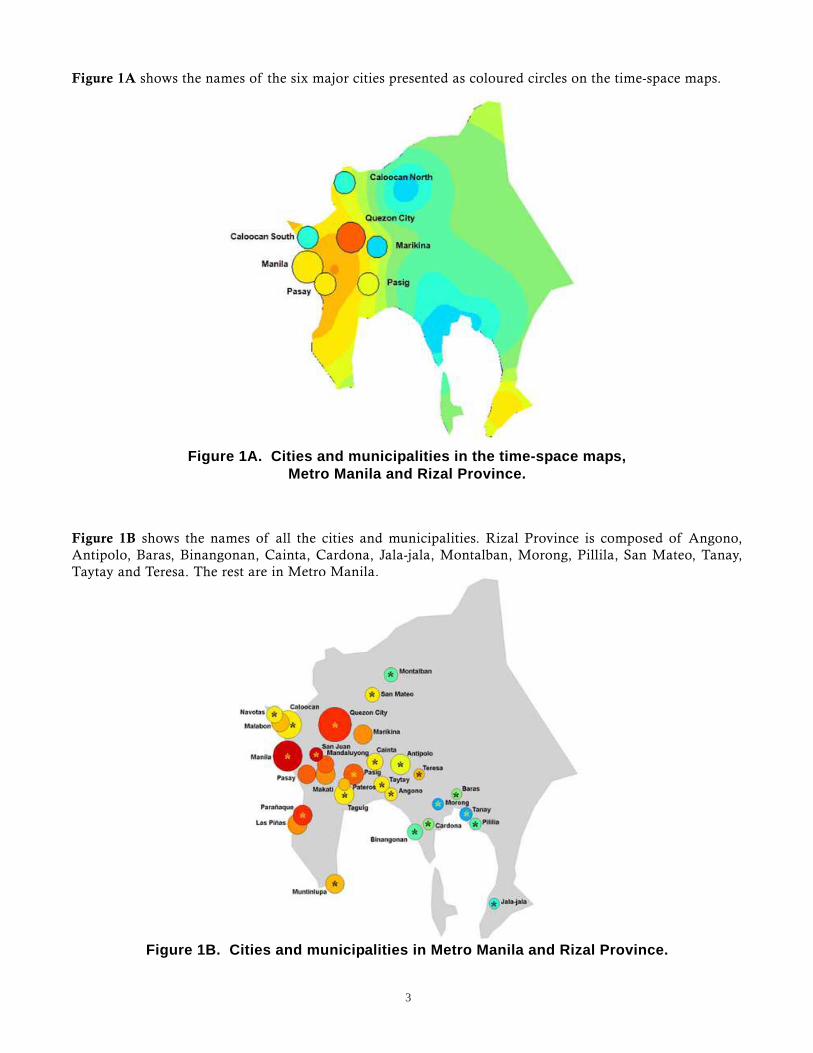
Figure 1A shows the names of the six major cities presented as coloured circles on the time-space maps.
Figure 1B shows the names of all the cities and municipalities. Rizal Province is composed of Angono,Antipolo, Baras, Binangonan, Cainta, Cardona, Jala-jala, Montalban, Morong, Pillila, San Mateo, Tanay,Taytay and Teresa. The rest are in Metro Manila.
Figure 1A. Cities and municipalities in the time-space maps,Metro Manila and Rizal Province.
Figure 1B. Cities and municipalities in Metro Manila and Rizal Province.
4
IIIRESULTS AND DISCUSSION
Declining cancer incidence trends were observed in some sites, particularly in the infection-related cancers(stomach, liver, and cervix). On the other hand, incidence trends for cancers related to modern lifestylecontinued to increase. Such increase might be attributed to the rapid urbanization and the consequent adoptionof unhealthy lifestyle factors that included smoking, unhealthy diet, alcohol consumption, and low physicalactivity. 14,15
3.1 All Sites
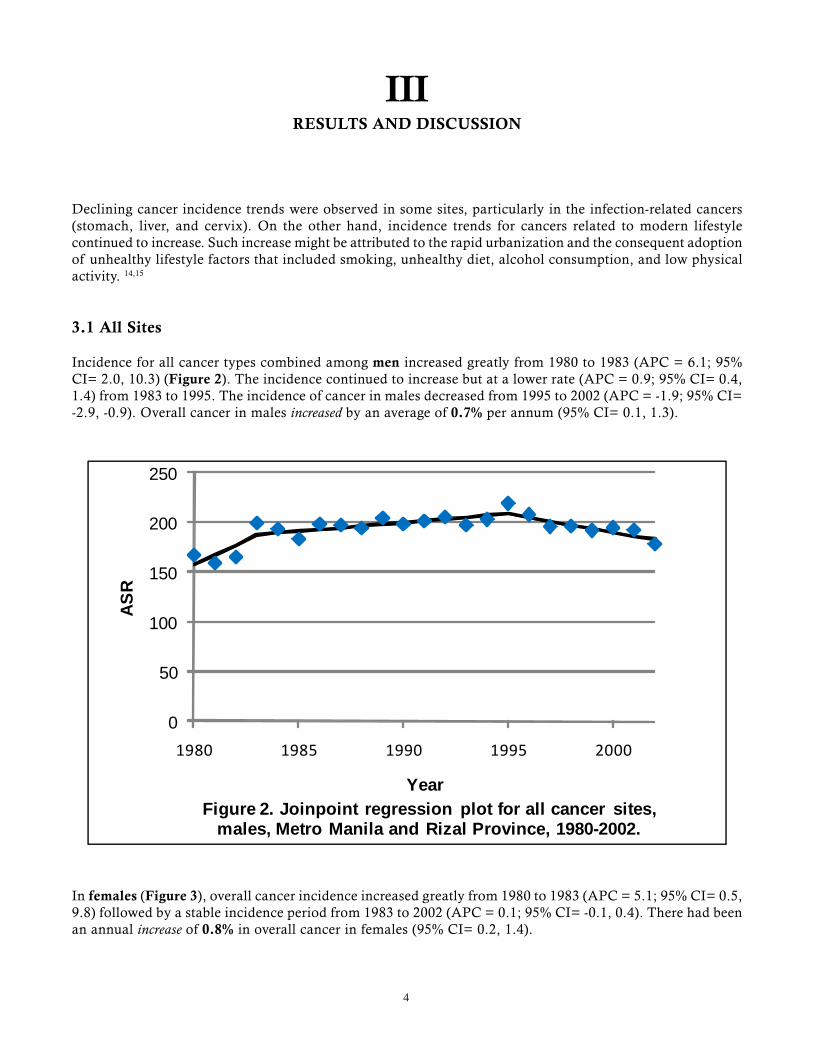
Incidence for all cancer types combined among men increased greatly from 1980 to 1983 (APC = 6.1; 95%CI= 2.0, 10.3) (Figure 2). The incidence continued to increase but at a lower rate (APC = 0.9; 95% CI= 0.4,1.4) from 1983 to 1995. The incidence of cancer in males decreased from 1995 to 2002 (APC = -1.9; 95% CI=-2.9, -0.9). Overall cancer in males increased by an average of 0.7% per annum (95% CI= 0.1, 1.3).
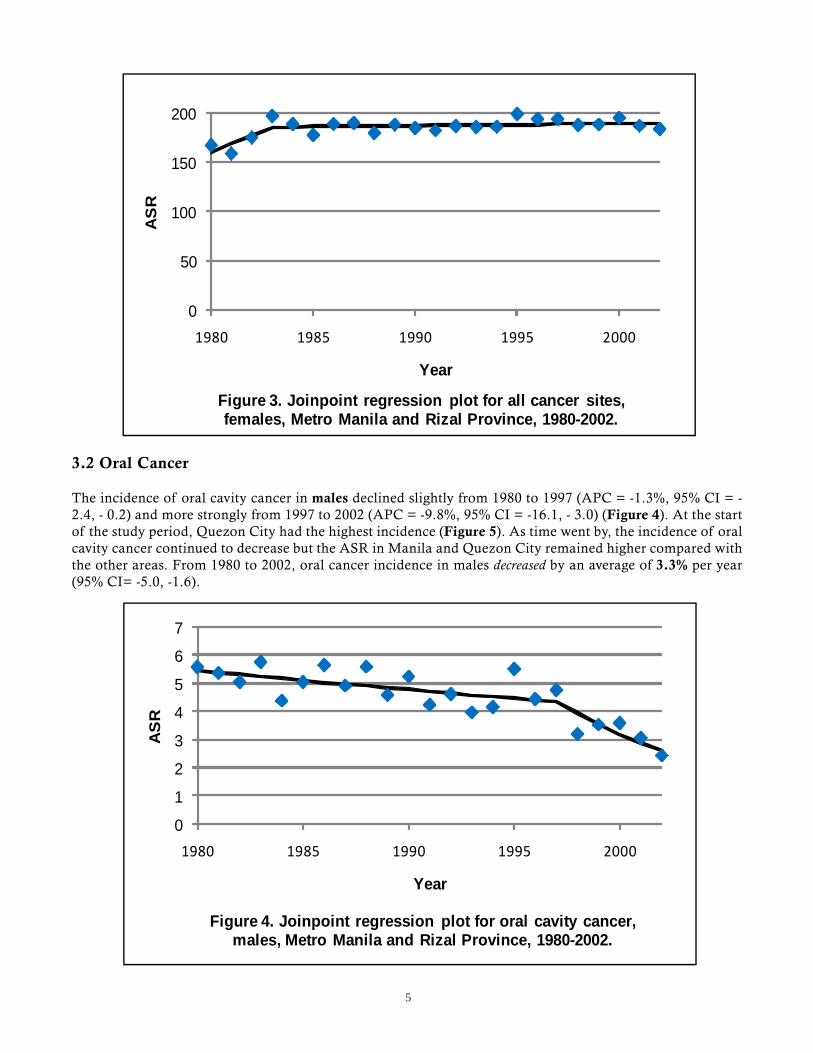
In females (Figure 3), overall cancer incidence increased greatly from 1980 to 1983 (APC = 5.1; 95% CI= 0.5,9.8) followed by a stable incidence period from 1983 to 2002 (APC = 0.1; 95% CI= -0.1, 0.4). There had beenan annual increase of 0.8% in overall cancer in females (95% CI= 0.2, 1.4).
0
50
100
150
200
250
1980 1985 1990 1995 2000
ASR
YearFigure 2. Joinpoint regression plot for all cancer sites,
males, Metro Manila and Rizal Province, 1980-2002.
5
3.2 Oral Cancer
The incidence of oral cavity cancer in males declined slightly from 1980 to 1997 (APC = -1.3%, 95% CI = -2.4, - 0.2) and more strongly from 1997 to 2002 (APC = -9.8%, 95% CI = -16.1, - 3.0) (Figure 4). At the startof the study period, Quezon City had the highest incidence (Figure 5). As time went by, the incidence of oralcavity cancer continued to decrease but the ASR in Manila and Quezon City remained higher compared withthe other areas. From 1980 to 2002, oral cancer incidence in males decreased by an average of 3.3% per year(95% CI= -5.0, -1.6).
0
50
100
150
200
1980 1985 1990 1995 2000
AS
R
Year
Figure 3. Joinpoint regression plot for all cancer sites, females, Metro Manila and Rizal Province, 1980-2002.
0
1
2
3
4
5
6
7
1980 1985 1990 1995 2000
AS
R
Year
Figure 4. Joinpoint regression plot for oral cavity cancer, males, Metro Manila and Rizal Province, 1980-2002.
6
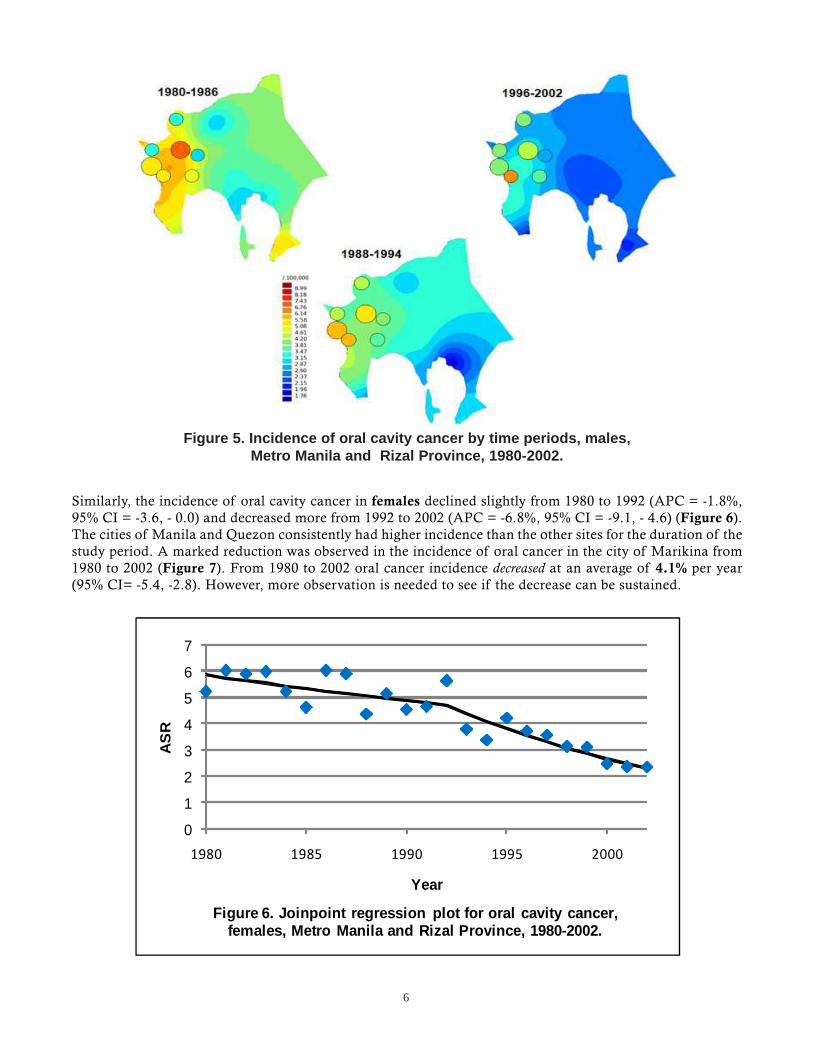
Similarly, the incidence of oral cavity cancer in females declined slightly from 1980 to 1992 (APC = -1.8%,95% CI = -3.6, - 0.0) and decreased more from 1992 to 2002 (APC = -6.8%, 95% CI = -9.1, - 4.6) (Figure 6).The cities of Manila and Quezon consistently had higher incidence than the other sites for the duration of thestudy period. A marked reduction was observed in the incidence of oral cancer in the city of Marikina from1980 to 2002 (Figure 7). From 1980 to 2002 oral cancer incidence decreased at an average of 4.1% per year(95% CI= -5.4, -2.8). However, more observation is needed to see if the decrease can be sustained.
Figure 5. Incidence of oral cavity cancer by time periods, males,Metro Manila and Rizal Province, 1980-2002.
0
1
2
3
4
5
6
7
1980 1985 1990 1995 2000
AS
R
Year
Figure 6. Joinpoint regression plot for oral cavity cancer, females, Metro Manila and Rizal Province, 1980-2002.

7
3.3 Stomach Cancer
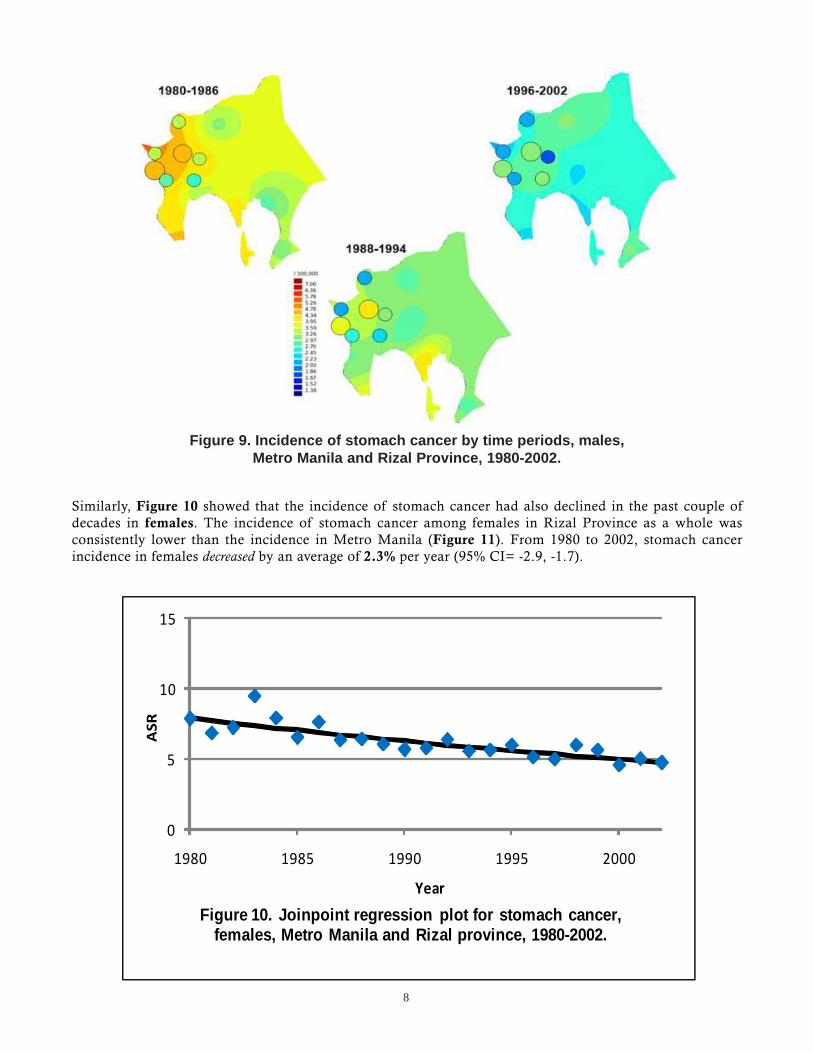
The incidence of stomach cancer among males has declined consistently in the past couple of decades (Figure8). At the start of the study period, markedly higher rates were observed in Metro Manila than in RizalProvince (Figure 9). The rates for the cities of Metro Manila appeared to decline with time. On the otherhand, fluctuating but decreasing rates for Rizal Province could be observed. Manila and Quezon City registeredthe highest ASRs throughout the study period. From 1980 to 2002, stomach cancer incidence in males decreasedby an average of 2.7% per year (95% CI= -3.5, -1.9).
Figure 7. Incidence of oral cavity cancer by time periods, females,Metro Manila and Rizal Province, 1980-2002.
0
5
10
15
20
1980 1985 1990 1995 2000
AS
R
Year
Figure 8. Joinpoint regression plot for stomach cancer, males, Metro Manila and Rizal Province, 1980-2002.
8
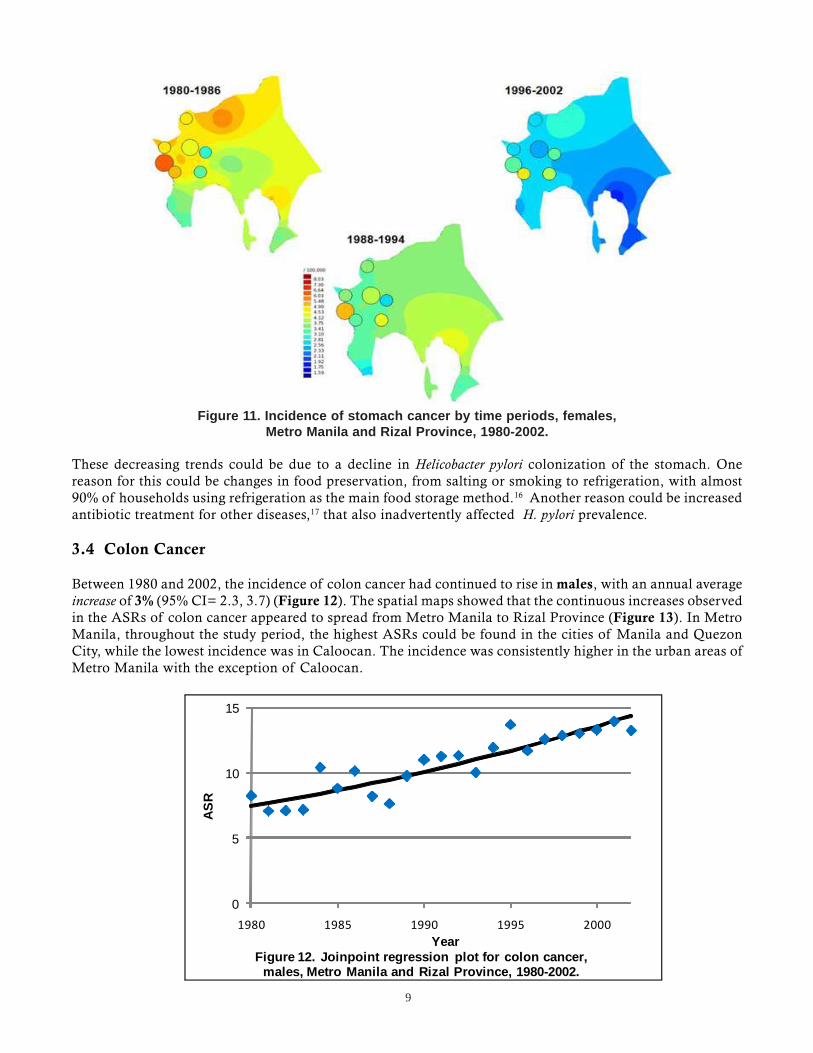
Similarly, Figure 10 showed that the incidence of stomach cancer had also declined in the past couple ofdecades in females. The incidence of stomach cancer among females in Rizal Province as a whole wasconsistently lower than the incidence in Metro Manila (Figure 11). From 1980 to 2002, stomach cancerincidence in females decreased by an average of 2.3% per year (95% CI= -2.9, -1.7).
Figure 9. Incidence of stomach cancer by time periods, males,Metro Manila and Rizal Province, 1980-2002.
0
5
10
15
1980 1985 1990 1995 2000
ASR
Year
Figure 10. Joinpoint regression plot for stomach cancer, females, Metro Manila and Rizal province, 1980-2002.
9
These decreasing trends could be due to a decline in Helicobacter pylori colonization of the stomach. Onereason for this could be changes in food preservation, from salting or smoking to refrigeration, with almost90% of households using refrigeration as the main food storage method.16 Another reason could be increasedantibiotic treatment for other diseases,17 that also inadvertently affected H. pylori prevalence.
3.4 Colon Cancer
Between 1980 and 2002, the incidence of colon cancer had continued to rise in males, with an annual averageincrease of 3% (95% CI= 2.3, 3.7) (Figure 12). The spatial maps showed that the continuous increases observedin the ASRs of colon cancer appeared to spread from Metro Manila to Rizal Province (Figure 13). In MetroManila, throughout the study period, the highest ASRs could be found in the cities of Manila and QuezonCity, while the lowest incidence was in Caloocan. The incidence was consistently higher in the urban areas ofMetro Manila with the exception of Caloocan.
Figure 11. Incidence of stomach cancer by time periods, females,Metro Manila and Rizal Province, 1980-2002.
0
5
10
15
1980 1985 1990 1995 2000
ASR
YearFigure 12. Joinpoint regression plot for colon cancer,
males, Metro Manila and Rizal Province, 1980-2002.

10
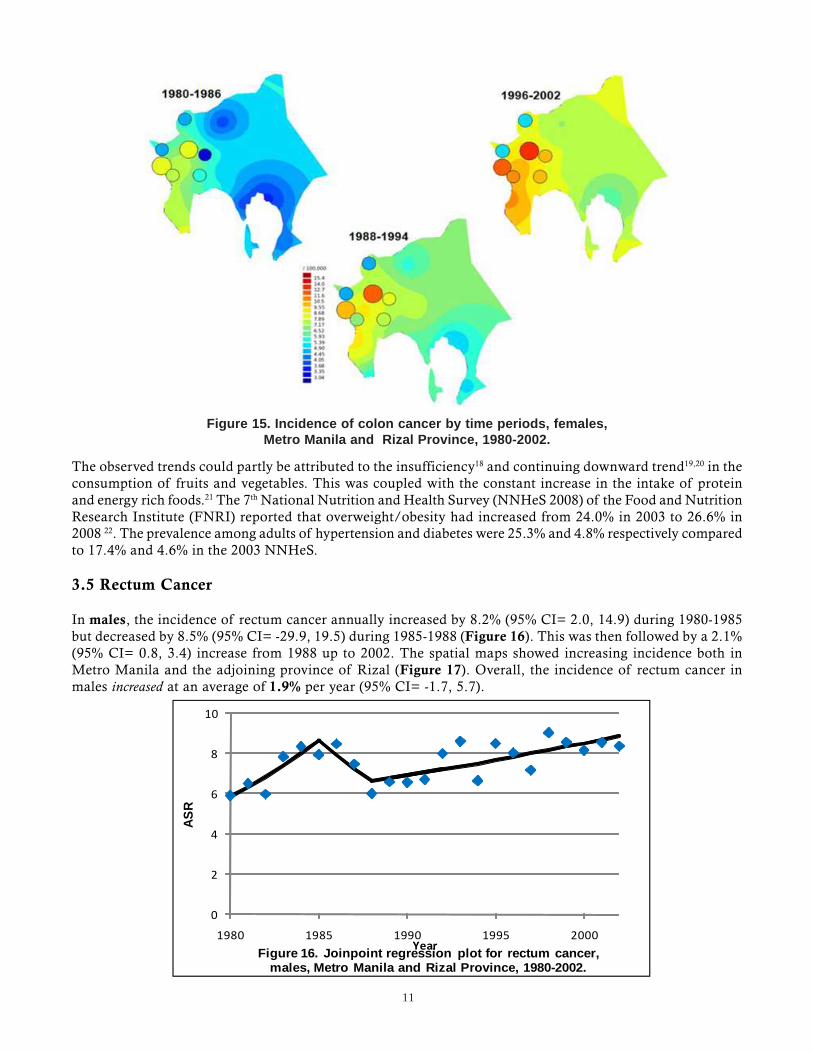
Increases were also noted in the incidence of colon cancer in females, 14% (95% CI= 0.6, 29.9) in 1980-1983and 2.1% (95% CI= 1.3, 2.9) in 1983-2002 (Figure 14). The spatial trend for females (Figure 15) was verymuch similar to the trend seen in men. From 1980 to 2002, the incidence of colon cancer increased at anaverage of 3.7% per year (95% CI= 1.9, 5.5).
Figure 13. Incidence of colon cancer by time periods, males,Metro Manila and Rizal Province, 1980-2002.
0
5
10
15
1980 1985 1990 1995 2000
AS
R
YearFigure 14. Joinpoint regression plot for colon cancer, females, Metro Manila and Rizal Province, 1980-2002.
11
The observed trends could partly be attributed to the insufficiency18 and continuing downward trend19,20 in theconsumption of fruits and vegetables. This was coupled with the constant increase in the intake of proteinand energy rich foods.21 The 7th National Nutrition and Health Survey (NNHeS 2008) of the Food and NutritionResearch Institute (FNRI) reported that overweight/obesity had increased from 24.0% in 2003 to 26.6% in2008 22. The prevalence among adults of hypertension and diabetes were 25.3% and 4.8% respectively comparedto 17.4% and 4.6% in the 2003 NNHeS.
3.5 Rectum Cancer
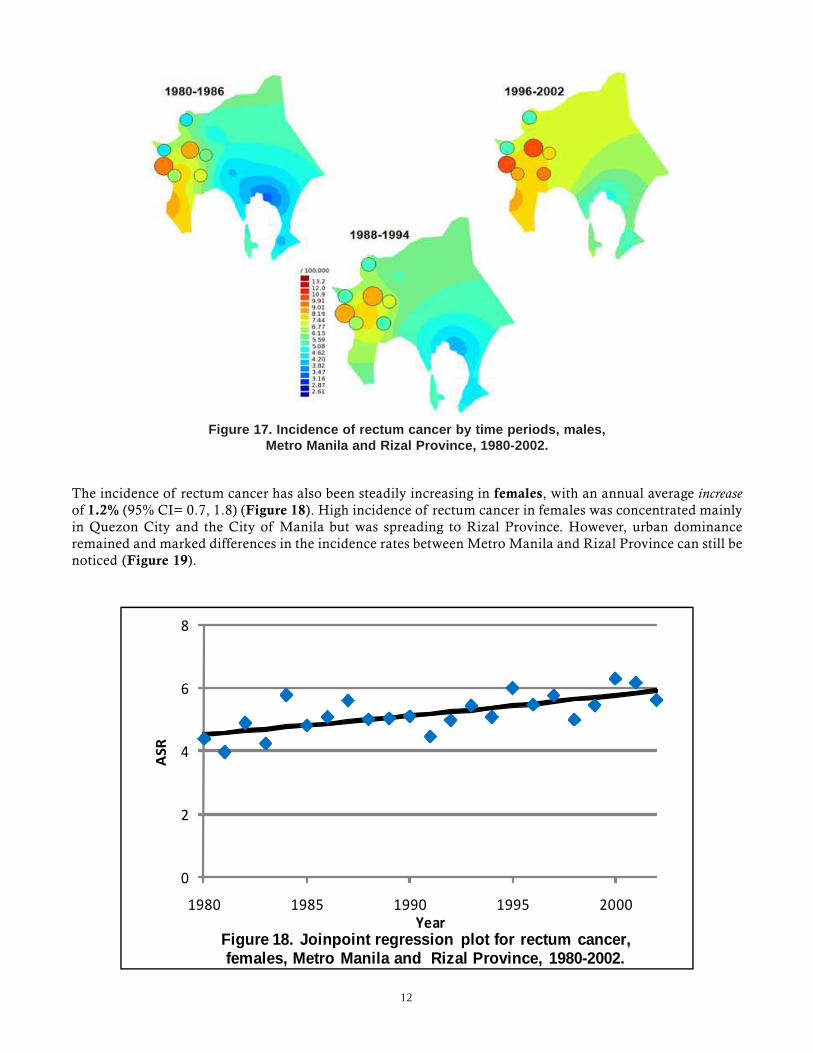
In males, the incidence of rectum cancer annually increased by 8.2% (95% CI= 2.0, 14.9) during 1980-1985but decreased by 8.5% (95% CI= -29.9, 19.5) during 1985-1988 (Figure 16). This was then followed by a 2.1%(95% CI= 0.8, 3.4) increase from 1988 up to 2002. The spatial maps showed increasing incidence both inMetro Manila and the adjoining province of Rizal (Figure 17). Overall, the incidence of rectum cancer inmales increased at an average of 1.9% per year (95% CI= -1.7, 5.7).
Figure 15. Incidence of colon cancer by time periods, females,Metro Manila and Rizal Province, 1980-2002.
0
2
4
6
8
10
1980 1985 1990 1995 2000
ASR
YearFigure 16. Joinpoint regression plot for rectum cancer, males, Metro Manila and Rizal Province, 1980-2002.
12
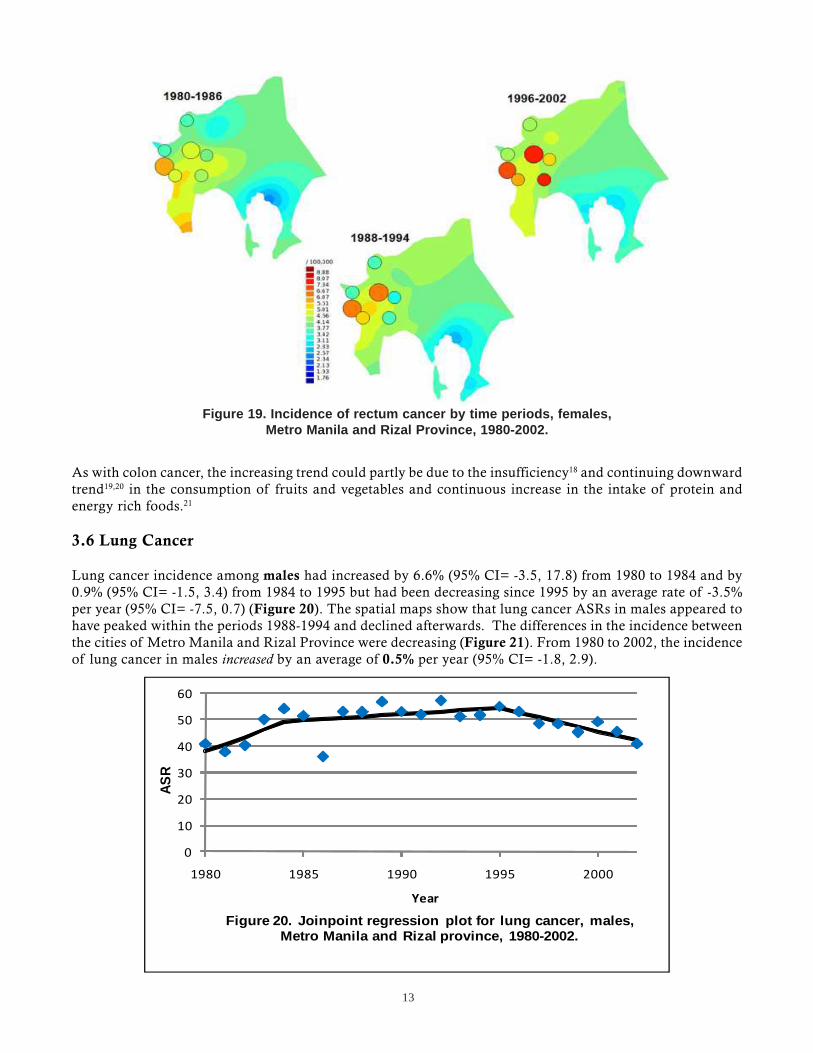
The incidence of rectum cancer has also been steadily increasing in females, with an annual average increaseof 1.2% (95% CI= 0.7, 1.8) (Figure 18). High incidence of rectum cancer in females was concentrated mainlyin Quezon City and the City of Manila but was spreading to Rizal Province. However, urban dominanceremained and marked differences in the incidence rates between Metro Manila and Rizal Province can still benoticed (Figure 19).
Figure 17. Incidence of rectum cancer by time periods, males,Metro Manila and Rizal Province, 1980-2002.
0
2
4
6
8
1980 1985 1990 1995 2000
ASR
YearFigure 18. Joinpoint regression plot for rectum cancer, females, Metro Manila and Rizal Province, 1980-2002.
13
As with colon cancer, the increasing trend could partly be due to the insufficiency18 and continuing downwardtrend19,20 in the consumption of fruits and vegetables and continuous increase in the intake of protein andenergy rich foods.21
3.6 Lung Cancer
Lung cancer incidence among males had increased by 6.6% (95% CI= -3.5, 17.8) from 1980 to 1984 and by0.9% (95% CI= -1.5, 3.4) from 1984 to 1995 but had been decreasing since 1995 by an average rate of -3.5%per year (95% CI= -7.5, 0.7) (Figure 20). The spatial maps show that lung cancer ASRs in males appeared tohave peaked within the periods 1988-1994 and declined afterwards. The differences in the incidence betweenthe cities of Metro Manila and Rizal Province were decreasing (Figure 21). From 1980 to 2002, the incidenceof lung cancer in males increased by an average of 0.5% per year (95% CI= -1.8, 2.9).
Figure 19. Incidence of rectum cancer by time periods, females,Metro Manila and Rizal Province, 1980-2002.
0
10
20
30
40
50
60
1980 1985 1990 1995 2000
ASR
Year
Figure 20. Joinpoint regression plot for lung cancer, males, Metro Manila and Rizal province, 1980-2002.

14
Among females the trend was increasing by 3% per year from 1980 to 1989 (95% CI= -0.1, 6.2) but decreasedby 1% per year from 1989 to 2002 (95% CI= -2.7, 0.7) (Figure 22). Slow increases in the ASRs were observeduntil the period 1988-1994, after which a decline was noted (Figure 23). The highest incidence was observedin Quezon City for the entire study period. As time went by, the differences in incidence between Rizal Provinceand the semi-urban cities of Manila decreased. In females, the incidence of lung cancer increased by an averageof 0.6% per year (95% CI= -0.9, 2.1).
Figure 21. Incidence of lung cancer by time periods, males,Metro Manila and Rizal Province, 1980-2002.
0
5
10
15
20
1980 1985 1990 1995 2000
AS
R
Year
Figure 22. Joinpoint regression plot for lung cancer, females, Metro Manila and Rizal province, 1980-2002.

15
These trends were consistent with reported tobacco consumption, which had been decreasing for males.19,21 Asimilar decrease was seen among females20,23. The first Philippine Global Adult Tobacco Survey 24 showed thatalthough more than 90% were aware that smoking causes serious illness, 28.3% were current tobacco smokers,and 48.8% were exposed to cigarette smoke in their homes. Similar to cancer of the oral cavity, more observationis needed to see if the decrease can be sustained.
3.7 Liver Cancer
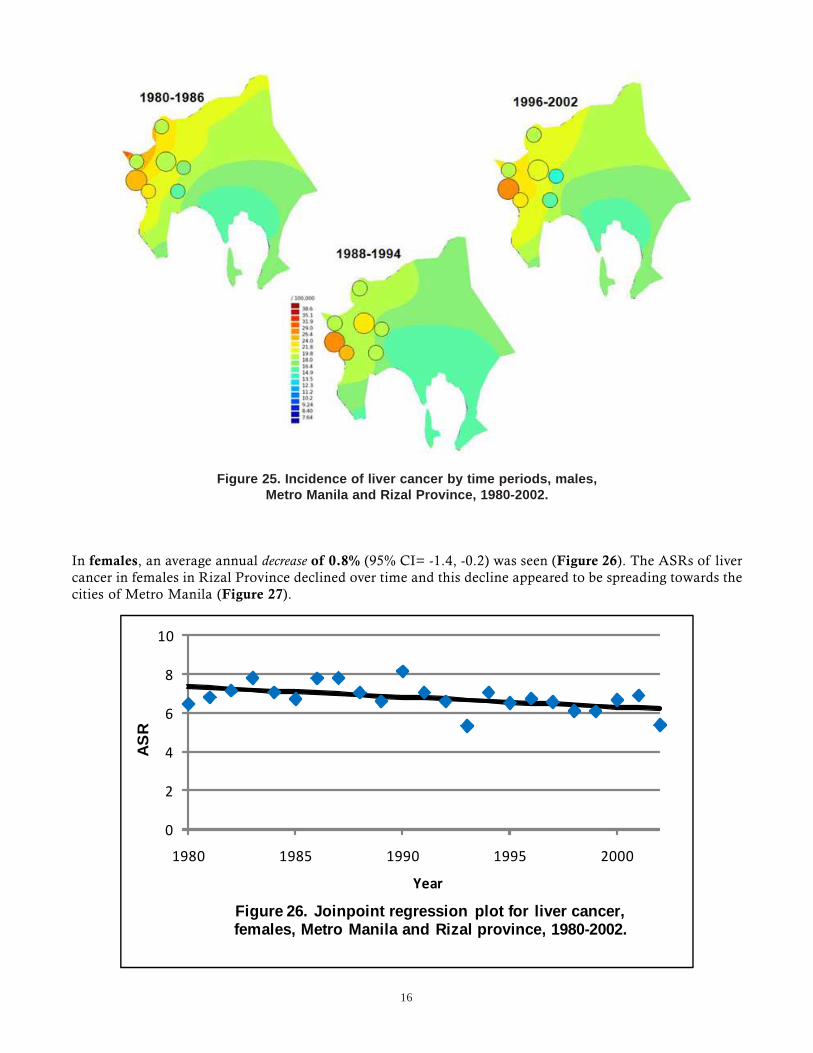
In males, an annual decrease of 0.1% (95% CI= -0.6, 0.5) in the period 1980-2000, and a sharp decrease of11.5% per year (95% CI= -26.8, 7.0) in 2000-2002 were observed (Figure 24). While the incidence of livercancer in Rizal Province was essentially stable, a fluctuation was noted in Metro Manila (Figure 25). Overall,the incidence of liver cancer in males decreased by an average of 1.2% per year (95% CI= -2.8, 0.5).
Figure 23. Incidence of lung cancer by time periods, females,Metro Manila and Rizal Province, 1980-2002.
0
5
10
15
20
25
1980 1985 1990 1995 2000
AS
R
YearFigure 24. Joinpoint regression plot for liver cancer, males,
Metro Manila and Rizal province, 1980-2002.
16
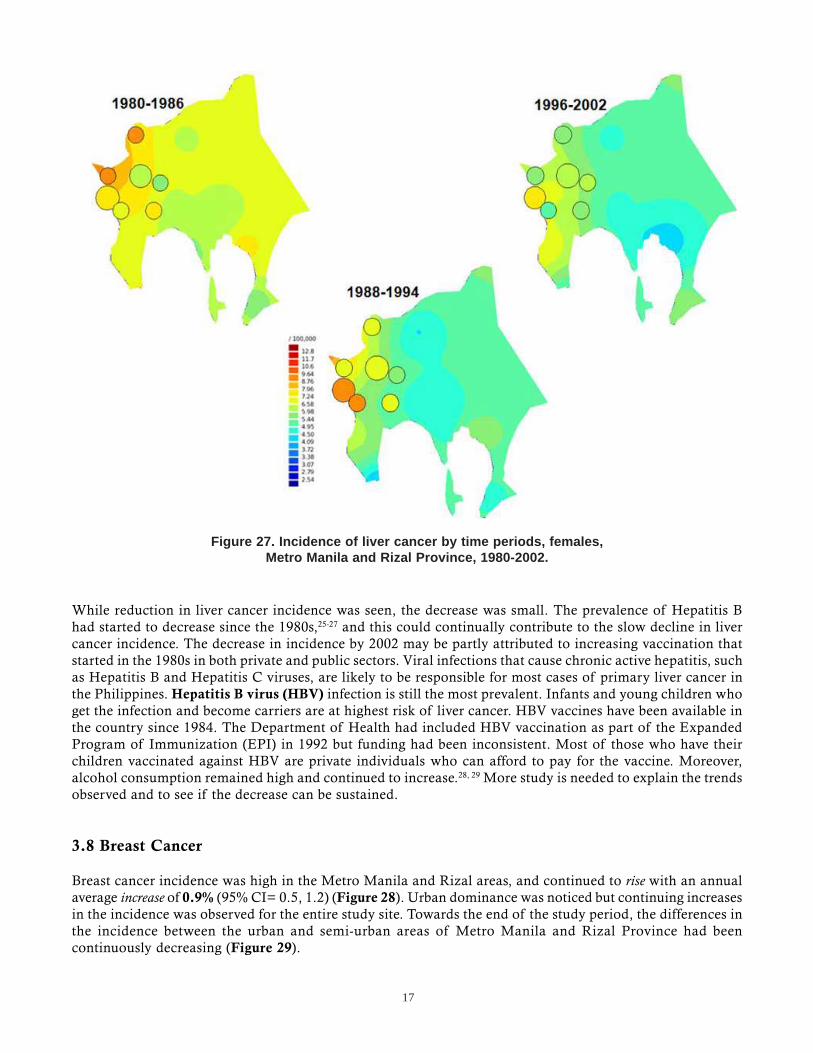
In females, an average annual decrease of 0.8% (95% CI= -1.4, -0.2) was seen (Figure 26). The ASRs of livercancer in females in Rizal Province declined over time and this decline appeared to be spreading towards thecities of Metro Manila (Figure 27).
Figure 25. Incidence of liver cancer by time periods, males,Metro Manila and Rizal Province, 1980-2002.
0
2
4
6
8
10
1980 1985 1990 1995 2000
AS
R
Year
Figure 26. Joinpoint regression plot for liver cancer, females, Metro Manila and Rizal province, 1980-2002.
17
While reduction in liver cancer incidence was seen, the decrease was small. The prevalence of Hepatitis Bhad started to decrease since the 1980s,25-27 and this could continually contribute to the slow decline in livercancer incidence. The decrease in incidence by 2002 may be partly attributed to increasing vaccination thatstarted in the 1980s in both private and public sectors. Viral infections that cause chronic active hepatitis, suchas Hepatitis B and Hepatitis C viruses, are likely to be responsible for most cases of primary liver cancer inthe Philippines. Hepatitis B virus (HBV) infection is still the most prevalent. Infants and young children whoget the infection and become carriers are at highest risk of liver cancer. HBV vaccines have been available inthe country since 1984. The Department of Health had included HBV vaccination as part of the ExpandedProgram of Immunization (EPI) in 1992 but funding had been inconsistent. Most of those who have theirchildren vaccinated against HBV are private individuals who can afford to pay for the vaccine. Moreover,alcohol consumption remained high and continued to increase.28, 29 More study is needed to explain the trendsobserved and to see if the decrease can be sustained.
3.8 Breast Cancer
Breast cancer incidence was high in the Metro Manila and Rizal areas, and continued to rise with an annualaverage increase of 0.9% (95% CI= 0.5, 1.2) (Figure 28). Urban dominance was noticed but continuing increasesin the incidence was observed for the entire study site. Towards the end of the study period, the differences inthe incidence between the urban and semi-urban areas of Metro Manila and Rizal Province had beencontinuously decreasing (Figure 29).
Figure 27. Incidence of liver cancer by time periods, females,Metro Manila and Rizal Province, 1980-2002.

18
Figure 29. Incidence of female breast cancer by time periods,Metro Manila and Rizal Province, 1980-2002.
0
10
20
30
40
50
60
1980 1985 1990 1995 2000
ASR
Year
Figure 28. Joinpoint regression plot for female breast cancer, Metro Manila and Rizal province, 1980-2002.

19
Increase in breast cancer incidence could be highly due to various lifestyle factors such as diet, physicalinactivity and alcohol drinking. Consumption of energy and protein rich foods was high,21 and was reflectedby the high and increasing proportion of the population who were overweight and obese.19, 20, 30 Furthermore,57.0% of women were reported to be physically inactive.31 Alcohol consumption among women was reportedto be moderate but was increasing.
The prevalence of oral contraceptive use and hormone replacement therapy can likewise have an effect onbreast cancer incidence. However, there are no estimates available for this population, and more research isneeded to determine the actual roles of these factors into breast cancer risk in the Philippines.
A study done in the Philippines found that the risk of Filipino women who had never been pregnant was 5times that of women with >5 pregnancies, while those whose age at first birth was >30 years had 3.3 timeshigher risk than women whose age at first birth was <20 years32. The significantly highest rates were seenonly in the seven cities of Metro Manila where large-scale housing developments had occurred starting in the1950’s.4 This had resulted in large scale internal migration of middle and high income families from all overthe country, families who could have been already more susceptible to lifestyle changes, including reproductivebehavior. As economic development has consistently been associated with a fall in birth rates, it is expectedthat breast cancer incidence will continue to rise.
3.9 Cervical Cancer
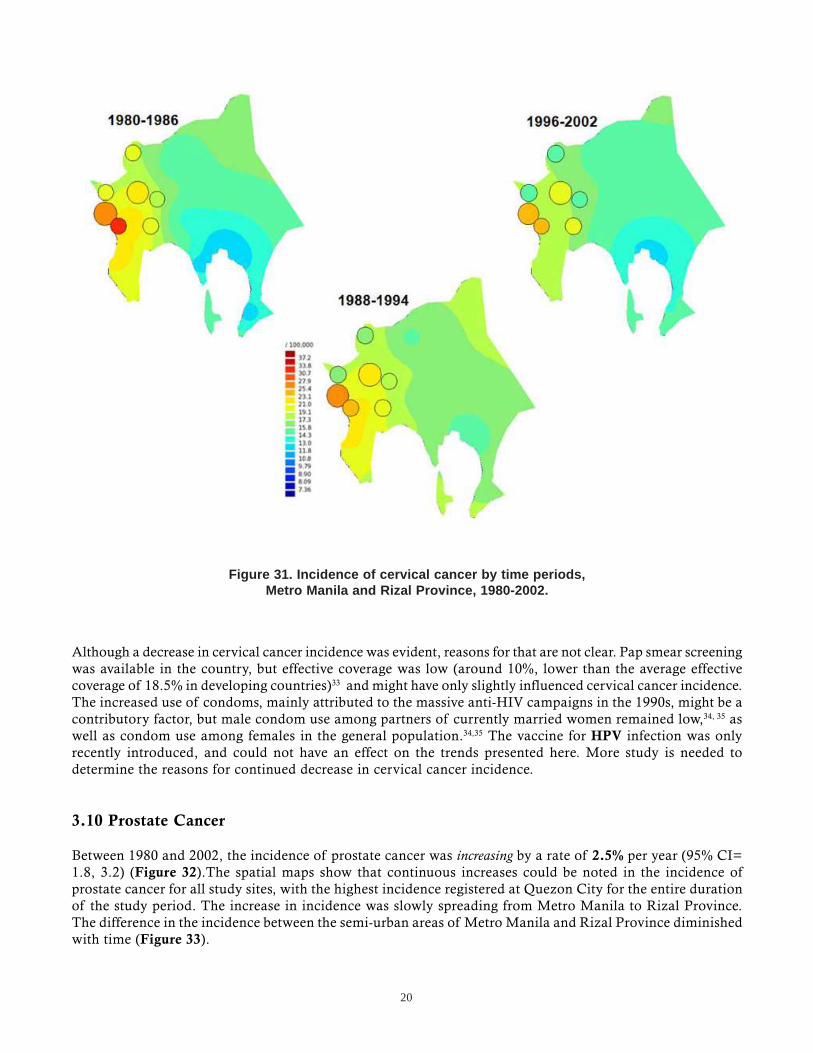
The incidence of cervical cancer was rising until 1984, with an annual increase of 5.5% (95% CI= 0.6, 10.6).Since then, it had decreased by a rate of 1.6% per year (95% CI= -2.0, -1.1) (Figure 30). Declining incidencewas observed in all of the study regions, with the highest reduction noticed in the city of Pasay (Figure 31).From 1980 to 2002, the incidence of cancer of the cervix decreased by an average of 0.3% per year (95% CI=-1.2, 0.6).
0
5
10
15
20
25
30
1980 1985 1990 1995 2000
ASR
Year
Figure 30. Joinpoint regression plot for cervical cancer, Metro Manila and Rizal province, 1980-2002.
20
Although a decrease in cervical cancer incidence was evident, reasons for that are not clear. Pap smear screeningwas available in the country, but effective coverage was low (around 10%, lower than the average effectivecoverage of 18.5% in developing countries)33 and might have only slightly influenced cervical cancer incidence.The increased use of condoms, mainly attributed to the massive anti-HIV campaigns in the 1990s, might be acontributory factor, but male condom use among partners of currently married women remained low,34, 35 aswell as condom use among females in the general population.34,35 The vaccine for HPV infection was onlyrecently introduced, and could not have an effect on the trends presented here. More study is needed todetermine the reasons for continued decrease in cervical cancer incidence.
3.10 Prostate Cancer
Between 1980 and 2002, the incidence of prostate cancer was increasing by a rate of 2.5% per year (95% CI=1.8, 3.2) (Figure 32).The spatial maps show that continuous increases could be noted in the incidence ofprostate cancer for all study sites, with the highest incidence registered at Quezon City for the entire durationof the study period. The increase in incidence was slowly spreading from Metro Manila to Rizal Province.The difference in the incidence between the semi-urban areas of Metro Manila and Rizal Province diminishedwith time (Figure 33).
Figure 31. Incidence of cervical cancer by time periods,Metro Manila and Rizal Province, 1980-2002.

21
Current evidence on the etiology of prostate cancer is very limited, and the roles of various risk factors, suchas tobacco smoking, alcohol drinking, diet and hormones, are still under debate. While increasing evidencepoint to the absence of an association of smoking and alcohol drinking with prostate cancer risk, more definitiveresults remain elusive. Incidence of diagnosed prostate cancer cases in the developed countries has been verystrongly related to frequency of PSA tests done among asymptomatic men or on autopsies rates. There hadbeen no PSA population screening in the Philippines. There is also no data on prostate cancer autopsy rates.
Figure 33. Incidence of prostate cancer by time periods,Metro Manila and Rizal Province, 1980-2002.
0
10
20
30
40
1980 1985 1990 1995 2000
AS
R
Year
Figure 32. Joinpoint regression plot for prostate cancer, Metro Manila and Rizal province, 1980-2002.

22
3.11 Thyroid Cancer
The incidence of thyroid cancer in males has been almost stable, with an annual average increase of 0.4%(95% CI= -0.7, 1.6) (Figure 34). High incidence of thyroid cancer in males was concentrated in Metro Manilabut was spreading to Rizal Province. The difference in the incidence rates between Metro Manila and RizalProvince diminished with time (Figure 35).
Figure 35. Incidence of thyroid cancer by time periods, males,Metro Manila and Rizal Province, 1980-2002.
0
2
4
6
1980 1985 1990 1995 2000
AS
R
Year
Figure 34. Joinpoint regression plot for thyroid cancer, males, Metro Manila and Rizal province, 1980-2002.
23
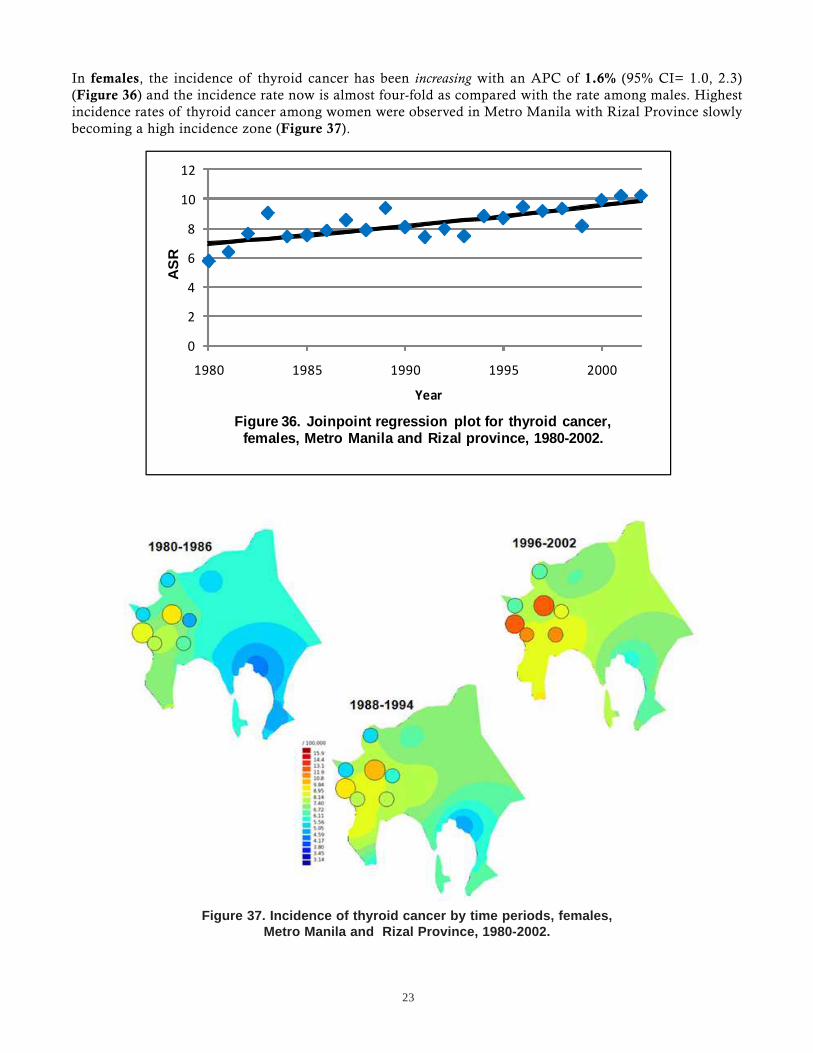
In females, the incidence of thyroid cancer has been increasing with an APC of 1.6% (95% CI= 1.0, 2.3)(Figure 36) and the incidence rate now is almost four-fold as compared with the rate among males. Highestincidence rates of thyroid cancer among women were observed in Metro Manila with Rizal Province slowlybecoming a high incidence zone (Figure 37).
Figure 37. Incidence of thyroid cancer by time periods, females,Metro Manila and Rizal Province, 1980-2002.
0
2
4
6
8
10
12
1980 1985 1990 1995 2000
AS
R
Year
Figure 36. Joinpoint regression plot for thyroid cancer, females, Metro Manila and Rizal province, 1980-2002.
24
While a small increase in the incidence of thyroid cancer was seen for both sexes, its etiology in the Philippinepopulation needs further investigation. Ionizing radiation, which is the main established risk factor for thedisease is uncommon in the country. The prevalence of familial benign thyroid disease, which is anotherknown risk factor, is unknown, but is unlikely to be high. A recent study showed that 63.4% of cases withnodular goiter in PGH had iodine deficiency and a higher proportion of malignant thyroid nodules wasfound among those with iodine deficiency (55.8%) than those who were iodine sufficient (40.0%)36. Differencesin diagnostic activity may also explain temporal and spatial variation.
References
1. Laudico AV, Esteban DB, Parkin DM, Baltazar JC, Bustamante GM, Eufemio GG, Maramba TP. Cancer in thePhilippines. IARC Technical Report No. 5; International Agency for Research on Cancer, Lyon, 1989.
2. Laudico AV, Esteban DB, Ngelangel CA, Reyes LM, Parkin DM, Olivier S. Cancer in the Philippines, Vol. II.Manila: Philippine Cancer Society, 1993.
3. Redaniel MTM, Laudico AV, Esteban DB, Reyes LM. Cancer in the Philippines, Vol. III. Manila: Philippine CancerSociety, 2002.
4. Redaniel MTM, Laudico AV, Lumague MRM, Mapua CA, Patama T, Pukkala E. Cancer in the Philippines, Vol IVPart 1 Cancer Incidence 1998-2002. Manila: Philippine Cancer Society, 2008.
5. Laudico AV, Ngelangel CA, de la Peòa A, Sibug ME, Gatchalian ER, Esteban D, Baltazar JC. 1988 PhilippineCancer Facts and Estimates. Manila: Philippine Cancer Society, 1988.
6. Laudico AV,Esteban DB, Ngelangel CA, Reyes LM. 1993 Philippine Cancer Facts and Estimates. Manila: PhilippineCancer Society, 1993.
7. Laudico AV, Esteban DB, Reyes LM, Liquido J. 1998 Philippine Cancer Facts and Estimates. Manila: PhilippineCancer Society, 1998.
8. Laudico AV, Esteban DB, Redaniel MTM, Mapua CA, Reyes LM. 2005 Philippine Cancer Facts and Estimates.Manila: Philippine Cancer Society, 2005.
9. Laudico AV, Medina VM, Lumague MRM, Mapua CA, Redaniel MTM, Valenzuela FG, Pukkala E. 2010 PhilippineCancer Facts and Estimates, Manila: Philipppine Cancer Society 2010.
10. Cancer Mondial. Cancer Information Section. International Agency for Research Against Cancer. Available from:http://www-dep.iarc.fr/.
11. Kim HJ, Fay M, Feuer E, Midthune D. Permutation tests for joinpoint regression with applications to cancerrates. Stat Med 2000; 19: 335-351.
12. National Cancer Institute. Joinpoint Regression Program version 3.3. 2008; Available from: <http://srab.cancer.gov/joinpoint/>
13. Pukkala E, Söderman B, Okeanov A, Storm H, Rahu M, Hakulinen T, Becker N, Stabenow R, Bjarnadottir K,Stengrevics A, Gurevicius R, Glattre E, Zatonski W, Men T, Barlow L. Cancer Atlas of Northern Europe. 2001,Helsinki: Cancer Society of Finland Publication No. 62
14. Harpham T and Stephens C. Urbanization and health in developing countries. World Health Stat Q 1991; 44(2):62-69.
15. Japan Bank for International Cooperation, Asian Development Bank, and World Bank, Infrastructure in EastAsia: The Way Forward. 2004: Japan Bank for International Cooperation, Asian Development Bank, World BankJoint Study. 4-8.
25
16. Food and Nutrition Research Institute, Urban Health and Nutrition Project Baseline Studies 1995 Manila: Foodand Nutrition Research Institute. 113.
17. Tomatis L (ed.): Cancer: Causes, Occurrence and Control. IARC Scientific Publications, Volume 100. 1990Lyon: International Agency for Research on Cancer. 56, 298.
18. Food and Nutrition Research Institute, National Nutrition Survey. 1978, Manila: Food and Nutrition ResearchInstitute. 1.
19. Food and Nutrition Research Institute, National Nutrition Survey. 1993, Manila: Food and Nutrition ResearchInstitute. 20.
20. Dans A, Morales D, Velandria F, Abola T, Roxas Jr A, Punzalan FE. National Nutrition and Health Survey (NNHeS):Atherosclerosis-related diseases and risk factors. Philipp J Int Med 2005; 43: 103-115.
21. Food and Agriculture Organization, United Nations. Compendium of food and agriculture indicators - 2006. 19June 2009; Available from: http://www.fao.org/statistics/compendium_2006/list.asp.
22. Food and Nutrition Research Institute, National Nutrition and Health Survey 2008, Manila Food and NutritionResearch Institute
23. Lung Center of the Philippines, National Smoking Prevalence Survey. Philipp J Int Med 1989; 27: 133-156.
24. Department of Health (DOH), National Statistics Office (NSO), World Health Organization (WHO), U.S. Centersfor Disease Control (CDC), Bloomberg Initiative to Reduce Tobacco Use. 2009 Philippine Global Adult TobaccoSurvey(GATS). http://www.wpro.who.int/internet/resources.ashx/TFI/2009GATSCountryReport_FinalPhilippines.pdf
25. Lingao AL, Domingo EO, West S, Reyes CM, Gazmen S, Viterbo G. Seroepidemiology of hepatitis B virus in thePhilippines. Am J Epidemiol 1986; 123(3): 473-480.
26. West SK, Lingao AL, Domingo EO, Raymundo D, Caragay B. Incidence and prevalence of hepatitis B. Acommunity-based survey in the Philippines. Am J Epidemiol 1986; 123(4): 681-689.
27. Dalmacio LM, Evangelista KV, Kemp K, Campos JR, Kron MA. Prevalence of hepatitis B virus infection amonghealthy adults and high-risk groups. Philipp J Int Med 2005; 43: 301-306.
28. World Health Organization. Global Status Report on Alcohol 1999 Geneva: World Health Organization, 13.
29. Tiglao TV, Baltazar JC, and Baquilod MM. Baseline Behavioral Risk Factor Survey Philippines. 2001
30. Adair LS. Dramatic rise in overweight and obesity in adult Filipino women and risk of hypertension. Obes Res2004; 12(8): 1335-1341.
31. Baltazar JC, Ancheta CA, Aban IB, Fernando RE, Baquilod MM. Prevalence and correlates of diabetes mellitusand impaired glucose tolerance among adults in Luzon, Philippines. Diabetes Res Clin Pract 2004; 64(2): 107-115.
32. Gibson LJ, Héry C, Mitton M, Gines-Bautista A, Parkin DM, Ngelangel C. Risk factors for breast cancer amongFilipino women in Manila. Int J Cancer 2010; 126 (2) : 515-521.
33. Gakidou E, Nordhagen S, and Obermeyer Z. Coverage of cervical cancer screening in 57 countries: Low averagelevels and large inequalities. PLoS Med 2008; 5(6): 132.
34. National Statistics Office, National Demographic and Health Survey 2003, Manila: National Statistics Office, 54.
35. National Statistics Office, National Demographic and Health Survey 1998, Manila: National Statistics Office, 54,155.
36. Ejercito-de Jesus RE, Fojas MC, and Buenaluz-Sedurente M. Association between iodine deficiency and thyroidcarcinoma among adult Filipino patients at the Philippine General Hospital. Philipp J Int Med 2008; 46: 27-34.

26
Appendix
0
10
20
30
40
50
60
1980
1981
1982
1983
1984
1985
1986
1987
1988
1989
1990
1991
1992
1993
1994
1995
1996
1997
1998
1999
2000
2001
2002
ASR
Appendix I. Trends in the incidence of selected cancers in males in Metro Manila and Rizal Province, 1980‐2002.
Lung
Liver
Prostate
Stomach
Colon
Rectum
Oral Cavity
Thyroid

27
0
10
20
30
40
50
60
1980
1981
1982
1983
1984
1985
1986
1987
1988
1989
1990
1991
1992
1993
1994
1995
1996
1997
1998
1999
2000
2001
2002
ASR
Appendix II. Trends in the incidence of selected cancers in females in Metro Manila and Rizal Province, 1980‐2002.
Breast
Cervix
Lung
Stomach
Thyroid
Liver
Oral Cavity
Colon
Rectum

28
Contributors
Victoria M. Medina is currently working on her Master of Science in Epidemiology fromthe College of Public Health, University of the Philippines Manila. Vicky’s thesis is on theburden of disease of breast cancer and has co-authored several publications with the registry.
Adriano V. Laudico is a surgical oncologist and Professor Emeritus of Surgery at theUniversity of the Philippines Manila. He was the former head of the Department of Health-Rizal Cancer Registry, and currently heads the Philippine Cancer Society-Manila Cancer Reg-istry. He was a Past President of the Philippine College of Surgeons, and the Founding Presi-dent of the Surgical Oncology Society of the Philippines. Yago was also a Short Term Consult-ant on Cancer of the World Health Organization Western Pacific Region to several counties inSoutheast Asia and the Pacific.
Maria Theresa M. Redaniel finished her PhD at the Ruprecht-Karls-Universität Heidelberg,Germany, working on cancer survival comparisons in the Philippines and the US. Her associationwith the Philippine Cancer Society-Manila Cancer Registry started with her Masteral thesiswhich was on population-based survival of cervix cancer, and has subsequently co-authoredseveral publications with the registry. Tere is currently working in the School of Social andCommunity Medicine, University of Bristol, UK.
Maria Rica Mirasol-Lumague is a general surgeon, and is the current head of theDepartment of Health – Rizal Cancer Society. Rica is the Chief Training Officer of Rizal MedicalCenter, where she also supervises the Tumor Clinic. She underwent training on CancerRegistration Methods and Cancer Epidemiology at the International Agency for Research onCancer in Lyon, France.
Cynthia A. Mapua holds a Master of Science in Epidemiology from the College of PublicHealth, University of the Philippines Manila, and is at present working for a Doctor of PublicHealth in Epidemiology at the same institution. Her association with the Philippine CancerSociety – Manila Cancer Registry began with her Masteral thesis which was on population-based survival of breast cancer. Cyndi had undergone training on cancer registration methodsand cancer epidemiology at the International Agency for Research on Cancer in Lyon, France.Cyndi is currently a Scientist/Epidemiologist at the Center for Biostatistics and MolecularEpidemiology, Research and Biotechnology Division, St. Luke’s Medical Center.
Toni Patama holds a degree of Master of Science (Environmental Sciences) from theUniversity of Kuopio and specializes on geographical information systems and spatialepidemiology. Toni is currently an Assistant Researcher at the Finnish Cancer Registry.
Eero Pukkala obtained his M.A. from the University of Helsinki, and his Ph.D. from theUniversity of Tampere. He is currently Director of Statistics and an epidemiologist at the Finn-ish Cancer Registry, Institute for Statistical and Epidemiological Cancer Research, Helsinki.Eero is also Professor of Public Health and Epidemiology at Tampere School of Public Health,University of Tampere, chairman of the national Epidemiological Society and leader of severalnational and international research programs.
29
Philippine Cancer Society Board of Trustees
Tomas V. ApacibleAngela U. Crisostomo, MDFrancisco G. Dizon, MDSec. Albert F. del RosarioFrancisco C. Eizmendi Jr. Jaime Z. Galvez-Tan, MDCorazon A. Ngelangel, MDTomas M. Realiza, MD Alberto B. Roxas, MD
Chairman Roberto Paterno, PhDVice Chairman Antonio Ma. GuerreroPresident Conrado Lorenzo Jr., MDVice President Usec. Enrique PerezTreasurer Don Ferry, JsDAsst. Treasurer Jose Sandejas, PhD
Philippine Cancer Society - Manila Cancer Registry
Ellen Nora S. MesinaZolia F. BautistaMelinda S. Visoria
Siony P. AlcosLydia T. Navarro
Glenda Q. PalomaresBlessa M. Huerto
Department of Health - Rizal Cancer Registry
Wilma M. GrafiloElena DC. Marquez
Herly S. MencoMaria Teresa M. Medes
Josephine R. IslaPortia E. De Guzman
Arlene T. Sasot
The publication of this monograph was generouslysupported by the Degenerative Disease Office-
National Center for Disease Prevention andControl of the Department of Health, under
Dr. Yolanda E. Oliveros.
The preparation of the manuscript was assisted by FranciscoG. Valenzuela Surgery Research Unit of the University ofthe Philippines Manila.

30