cancer in new zealand - medicines nz · pdf filecancer in new zealand to innovative medicines...
TRANSCRIPT
Better Health Outcomes for New Zealanders
Epidemiology, Survival
Rates and Access to
Medicines
Cancer in
New Zealand
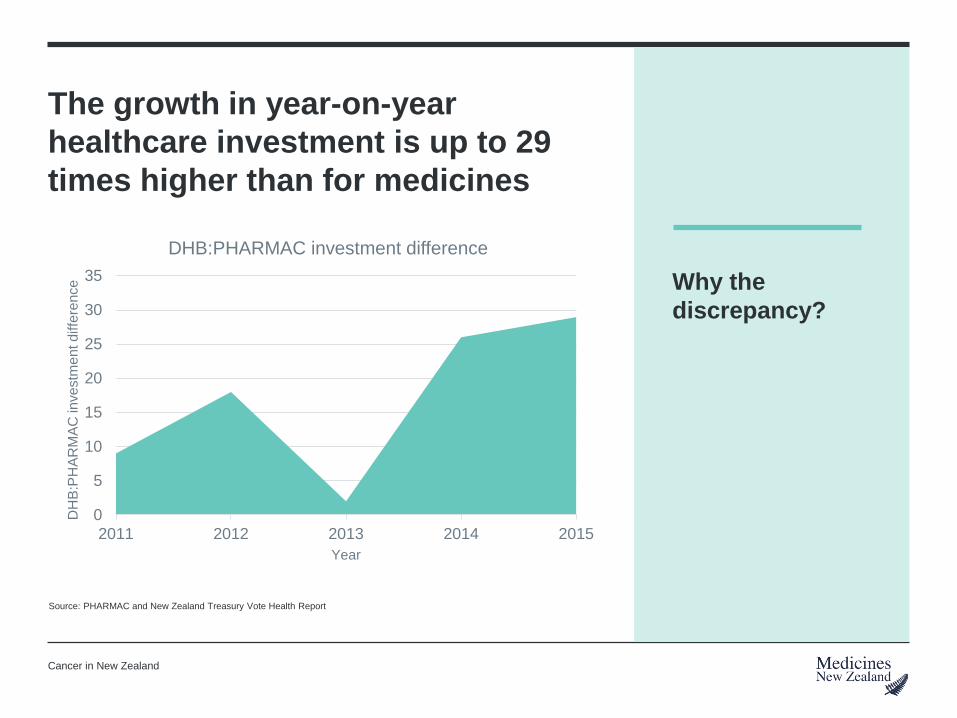
The growth in year-on-year
healthcare investment is up to 29
times higher than for medicines
0
5
10
15
20
25
30
35
2011 2012 2013 2014 2015
DH
B:P
HA
RM
AC
inve
stm
en
t d
iffe
ren
ce
Year
DHB:PHARMAC investment difference
Why the
discrepancy?
Source: PHARMAC and New Zealand Treasury Vote Health Report
Cancer in New Zealand
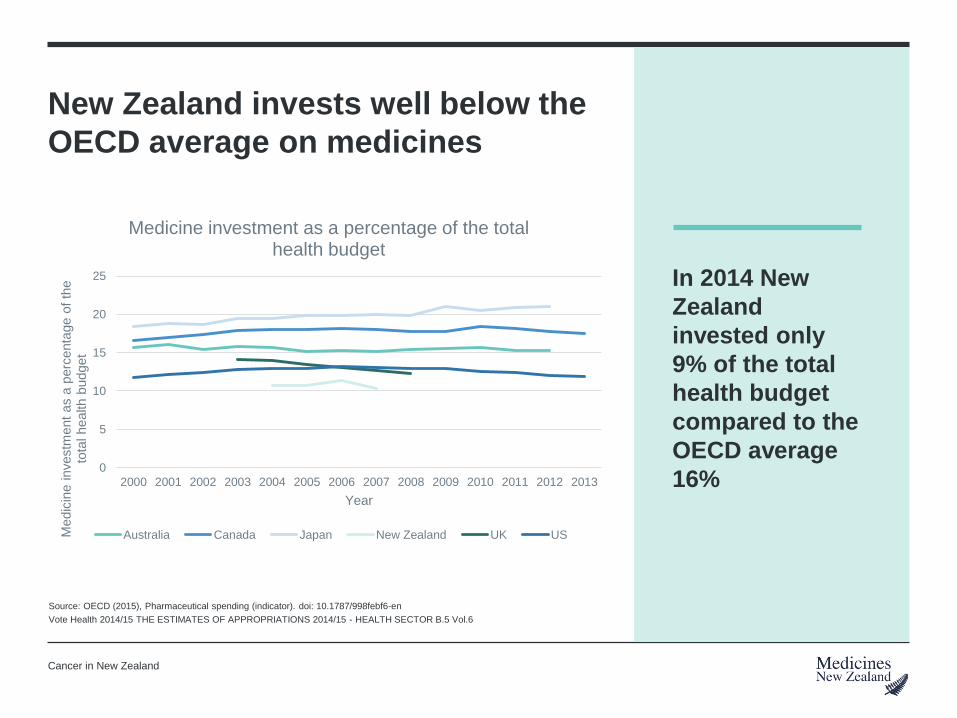
New Zealand invests well below the
OECD average on medicines
In 2014 New
Zealand
invested only
9% of the total
health budget
compared to the
OECD average
16%
Source: OECD (2015), Pharmaceutical spending (indicator). doi: 10.1787/998febf6-en
Vote Health 2014/15 THE ESTIMATES OF APPROPRIATIONS 2014/15 - HEALTH SECTOR B.5 Vol.6
Cancer in New Zealand
0
5
10
15
20
25
2000 2001 2002 2003 2004 2005 2006 2007 2008 2009 2010 2011 2012 2013
Medic
ine investm
ent
as a
perc
enta
ge o
f th
e
tota
l health b
udget
Year
Medicine investment as a percentage of the total health budget
Australia Canada Japan New Zealand UK US

New Zealand’s medicines
investment per person is decreasing
New Zealand
invested 15% less
per person on
funded medicines in
2013 than in 2000
1. In 2013 dollars. Excluding ~NZD 45M on vaccines for 2013 onwards 2. Excluding inflation (CAGR: 2.5%), indexed to 2013
Source: PHARMAC Annual Reviews; Statistics New Zealand
Cancer in New Zealand
185 179 167 163 165 168
160 164 166 164 169 164 177
158
0
50
100
150
200
250
Year
-1.2% p.a.
CAGR
Overall, 2000 – 2013:
-15% per capita
$714 m1 budget
3.86m popn
$733 m1 budget
4.63m popn
PH
AR
MA
C r
ea
l in
ve
stm
en
t p
er
ca
pita
(N
ZD
; re
al te
rms in
de
x t
o 2
01
3)
2000 2005 2010 2013
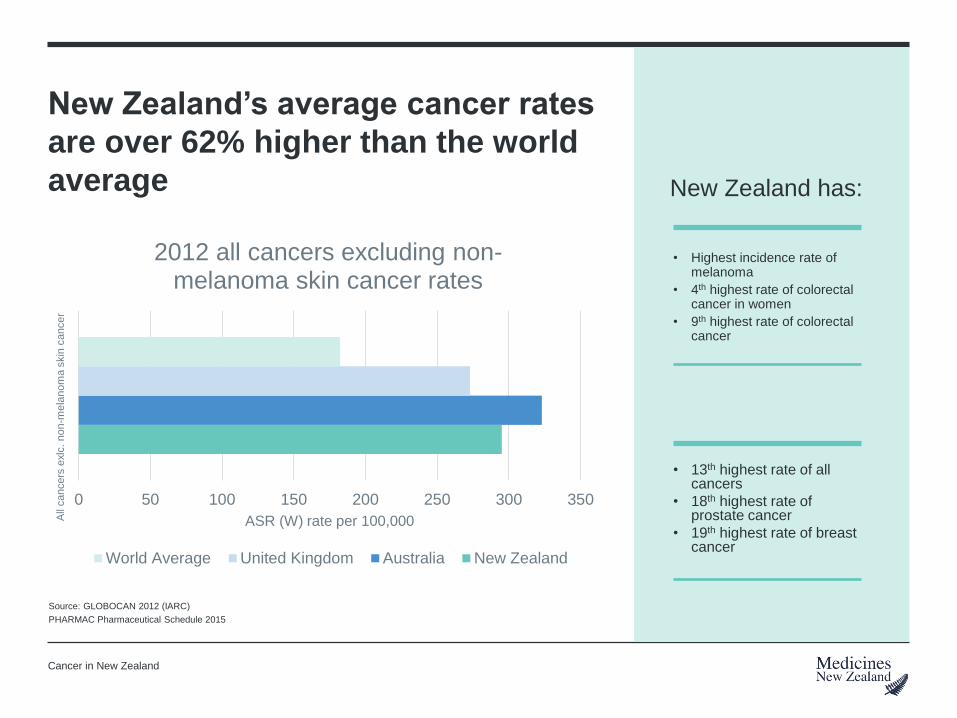
New Zealand’s average cancer rates
are over 62% higher than the world
average
0 50 100 150 200 250 300 350
ASR (W) rate per 100,000All
cancers
exlc
. non-m
ela
nom
a s
kin
cancer
2012 all cancers excluding non-melanoma skin cancer rates
World Average United Kingdom Australia New Zealand
• Highest incidence rate of melanoma
• 4th highest rate of colorectal cancer in women
• 9th highest rate of colorectal cancer
• 13th highest rate of all cancers
• 18th highest rate of prostate cancer
• 19th highest rate of breast cancer
Source: GLOBOCAN 2012 (IARC)
PHARMAC Pharmaceutical Schedule 2015
Cancer in New Zealand
New Zealand has:
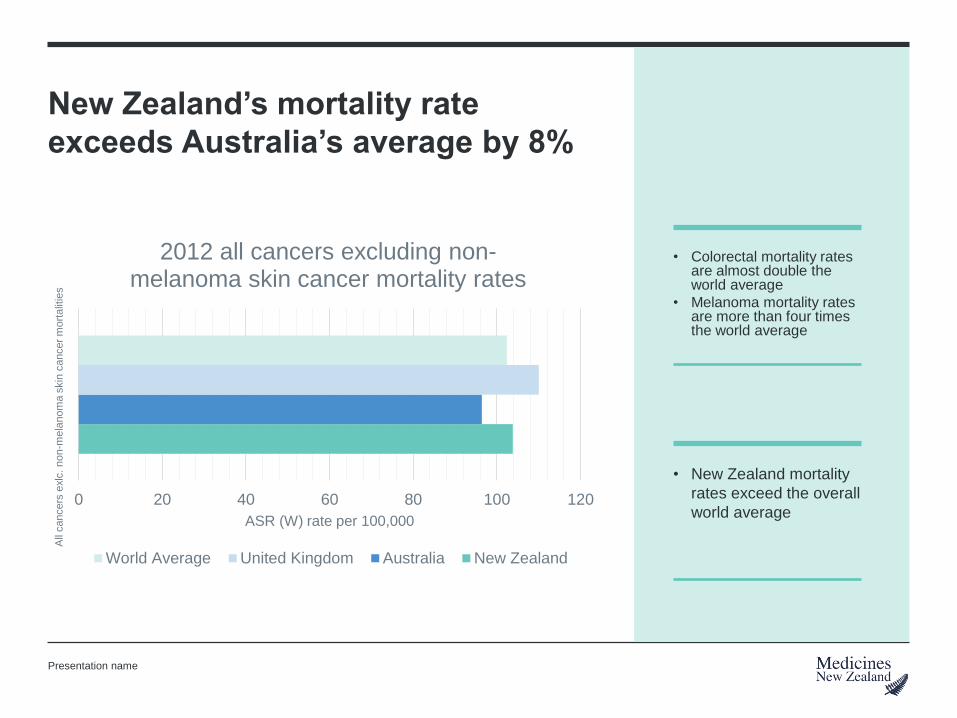
New Zealand’s mortality rate
exceeds Australia’s average by 8%
0 20 40 60 80 100 120
ASR (W) rate per 100,000
All
cancers
exlc
. non-m
ela
nom
a s
kin
cancer
mort
alit
ies
2012 all cancers excluding non-melanoma skin cancer mortality rates
World Average United Kingdom Australia New Zealand
• Colorectal mortality rates are almost double the world average
• Melanoma mortality rates are more than four times the world average
• New Zealand mortality
rates exceed the overall
world average
Presentation name

While survival is improving, New
Zealand’s survival rates are less
than Australia and US
75
76 76
77 77
78 78
1998-1999 2000-2001 2002-2003 2004-2005 2006-2007 2008-2009 2010-2011
One-year relative survival %
• Australia’s one-year
relative survival rate is
4.5% higher than New
Zealand
• Australia’s five-year relative survival rate is 4% higher than New Zealand
• US’ five-year survival rate is 5.6% higher than New Zealand
Source: Ministry of Health. 2015. Cancer patient survival 1994–2011. Wellington: Ministry of Health.
Aye et al, NZMJ, 2014
US Cancer Society, Facts and Figures, 2014
Cancer in New Zealand
57.7
60 60.461.1 61
6263.3
1998-1999 2000-2001 2002-2003 2004-2005 2006-2007 2008-2009 2010-2011
Five-year relative survival %
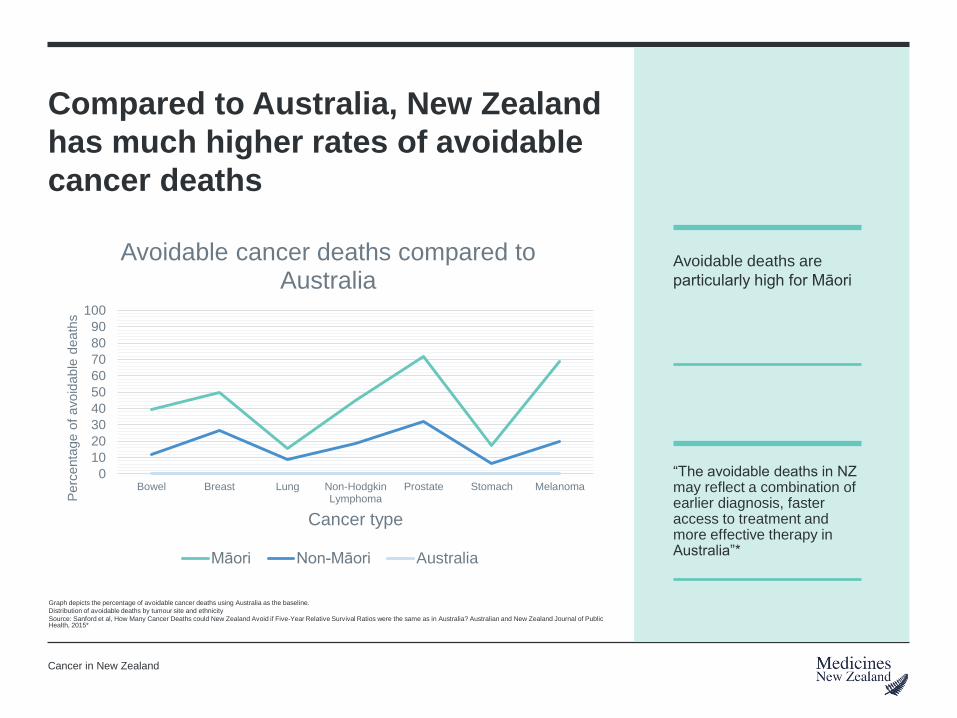
Compared to Australia, New Zealand
has much higher rates of avoidable
cancer deaths
0
10
20
30
40
50
60
70
80
90
100
Bowel Breast Lung Non-HodgkinLymphoma
Prostate Stomach Melanoma
Perc
enta
ge o
f avoid
able
death
s
Cancer type
Avoidable cancer deaths compared to Australia
Māori Non-Māori Australia
Avoidable deaths are
particularly high for Māori
“The avoidable deaths in NZ may reflect a combination of earlier diagnosis, faster access to treatment and more effective therapy in Australia”*
Graph depicts the percentage of avoidable cancer deaths using Australia as the baseline.
Distribution of avoidable deaths by tumour site and ethnicity
Source: Sanford et al, How Many Cancer Deaths could New Zealand Avoid if Five-Year Relative Survival Ratios were the same as in Australia? Australian and New Zealand Journal of Public Health, 2015*
Cancer in New Zealand

Out of 13 countries, New Zealand has the lowest ranking
for access to cancer medicines
Canada Switzerland Australia UK Germany Norway Sweden New Zealand
2009 2013 2009 2013 2009 2013 2009 2013 2009 2013 2009 2013 2009 2013 2009 2013
12 9 6 2 10 12 11 7 4 3 9 4 7 6 13 13
11 10 2 7 9 9 8 12 6 5 12 11 10 8 13 13
10 10 5 11 12 6 9 4 4 9 11 13 8 5 13 8
10 12 9 13 11 11 5 9 3 8 8 4 7 3 13 6
Comparison of cancer medicines access for 13 countries – 2008/09 and 2012/13 ranked 6 to 13
Source: Office of Health Economics, Richards Report 2014
Cancer in New Zealand
Access to medicines
post-diagnosis
Cancer <5 years
Cancer 6-10 years
Cancer >10 years
Cancer hormones

New Zealand only funds 14% of
highly effective available medicines
for the 8 most prevalent cancer
types
05
101520253035
Num
ber
of m
edic
ines
Cancer type
Number of cancer specific medicines vs medicines funded in NZ
Number of available medicines Number of funded medicines in New Zealand
In some cases NO cancer
specific medicines are
funded in New Zealand
Data is not inclusive of chemotherapy and radiotherapy treatment
Source: GoodRx Inc 2015, PHARMAC
Cancer in New Zealand

Better Health Outcomes for New Zealanders
Research and
Cancer Costs
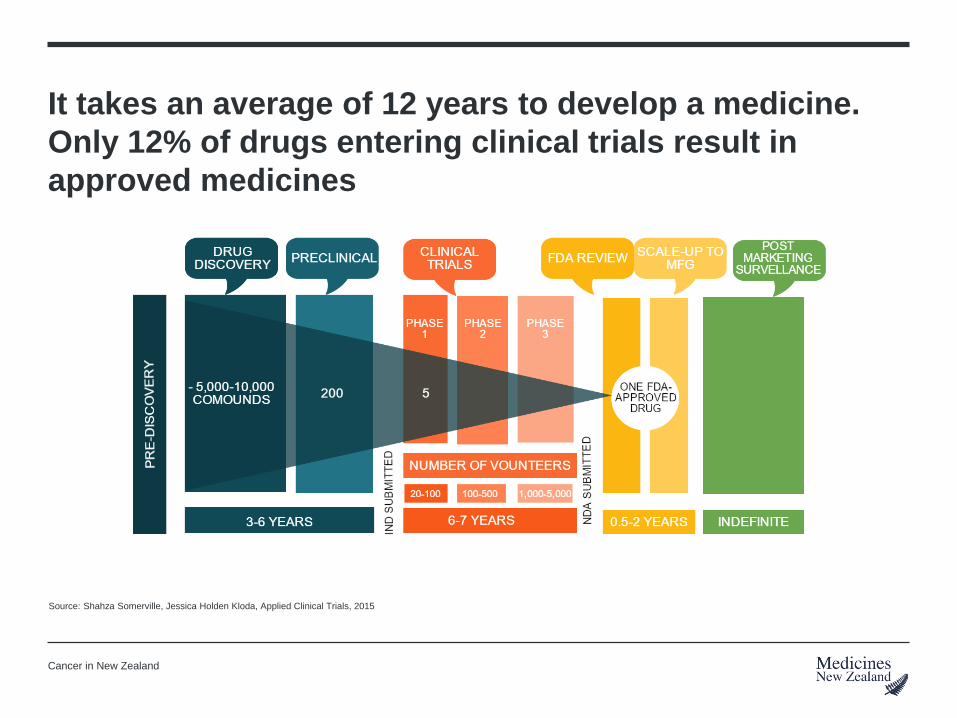
It takes an average of 12 years to develop a medicine.
Only 12% of drugs entering clinical trials result in
approved medicines
Source: Shahza Somerville, Jessica Holden Kloda, Applied Clinical Trials, 2015
Cancer in New Zealand

It now costs an average $3.8 billion to develop a
medicine
Source: 2010 Scientific American
DiMasi JA, Grabowski, HG. The cost of biopharmaceutical R&D: is biotech different? Manage Decis Econ. 2007;28:469-479
Cancer in New Zealand
$201 million
$464 million
$802 million
$1.2 billion
$3.8 billion
$0
$500
$1,000
$1,500
$2,000
$2,500
$3,000
$3,500
$4,000
1975 1987 2001 2006 2015
De
velo
pm
en
t co
st 1
,00
0s
Year
Development cost of an average drug over time
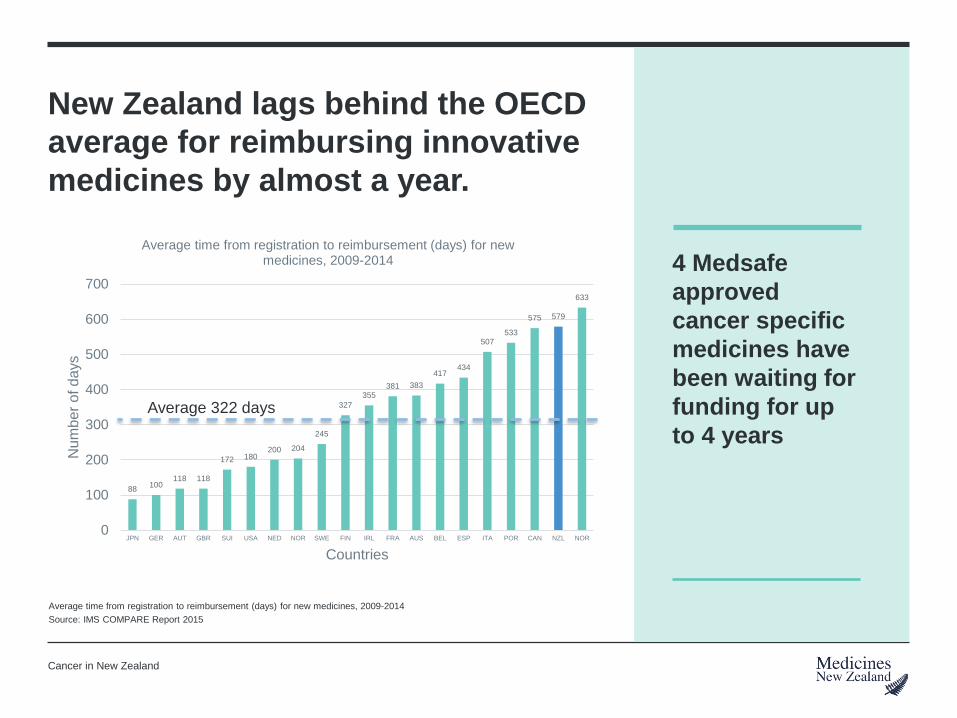
New Zealand lags behind the OECD
average for reimbursing innovative
medicines by almost a year.
4 Medsafe
approved
cancer specific
medicines have
been waiting for
funding for up
to 4 years
Average time from registration to reimbursement (days) for new medicines, 2009-2014
Source: IMS COMPARE Report 2015
Cancer in New Zealand
88100
118 118
172 180200 204
245
327
355381 383
417434
507533
575 579
633
0
100
200
300
400
500
600
700
JPN GER AUT GBR SUI USA NED NOR SWE FIN IRL FRA AUS BEL ESP ITA POR CAN NZL NOR
Nu
mb
er
of d
ays
Countries
Average time from registration to reimbursement (days) for new medicines, 2009-2014
Average 322 days

New Zealand ranks last out of 20 comparable OECD
countries for access to innovative medicines
Source: IMS COMPARE Report 2015
Cancer in New Zealand
0
10
20
30
40
50
60
70
80
90
100
Perc
enta
ge o
f re
imburs
es a
ccess to n
ew
regis
tere
d m
edic
ines
Country
Percentage of reimbursed access to new registered medicines
Average 54%

There are over 800 innovative medicines in clinical
testing for cancers
Source: American Cancer Society 2015
Cancer in New Zealand
2358
8235
2184
30106
35123
9238
514950
1753
22729
5627
0 50 100 150 200 250
Bladder
Brain
Breast
Colorectal
Head & Neck
Hematological Maglignacncies
Kidney
Leukemia
Liver
Lung
Lymphoma
Multiple Myeloma
Ovarian
Pancreatic
Prostate
Sarcoma
Skin
Solid Tumors
Stomach
Other
Unspecified
Number of medicines in development for cancers
Ca
nce
r ty
pe
Medicines in development for cancers

As an example, innovative medicines have
decreased the level of deaths from cancer by 22%
in the USA since the 1990s
23 MILLION
Years of life saved due to
cancer treatment
advances, 1988 - 2000
$1.9 TRILLION
Value of improved cancer
treatment to society based
on improved productivity,
extended life and other
factors, 1988-2000
Better access
Source: DN Lakdawala, et al. “An economic evaluation of the war on cancer” Journal of Health Economics 2015
National Cancer Institute. Surveillance, Epidemiology, and End Results Program 2015
Cancer in New Zealand
to innovative medicines will
have a positive effect in
New Zealand

Better Health Outcomes for New Zealanders
Cancer in New
Zealand
Medicines New Zealand is the industry association representing
companies engaged in the research, development, manufacture and
marketing of prescription medicines.