cancer among current and former workers at national semiconductor (uk) ltd, greenock · ·...
TRANSCRIPT

CANCER AMONG CURRENT
AND FORMER WORKERS AT
NATIONAL SEMICONDUCTOR
(UK) LTD, GREENOCK:
Results of an investigation by
the Health and Safety Executive
HSE Health & Safety
Executive
CANCER AMONG CURRENT
AND FORMER WORKERS AT
NATIONAL SEMICONDUCTOR
(UK) LTD, GREENOCK:
Results of an investigation by
the Health and Safety Executive
Damien M. McElvenny, MSc Andrew J. Darnton, BSc
John T. Hodgson, MSc Simon D. Clarke, PhD
Richard C. Elliott, BSc, FRCSEd John Osman, MRCP, FFOM (Hon)
HSE BOOKS

© Crown copyright 2001 Applications for reproduction should be made in writing to: Copyright Unit, Her Majesty’s Stationery Office, St Clements House, 2-16 Colegate, Norwich NR3 1BQ
First published 2001
ISBN 0 7176 2144 8
All rights reserved. No part of this publication may be reproduced, stored in a retrieval system, or transmitted in any form or by any means (electronic, mechanical, photocopying, recording or otherwise) without the prior written permission of the copyright owner.
ACKNOWLEDGEMENTS
Management and workers at NSUK Greenock without whom this investigation could not have been completed, especially Susan Seutter, Bob Steel, Etta Gaughan and Sharon McEachran.
Steering Committee Members, Raymond Agius, Freda Alexander and Lewis Reay.
Roger Black, David Brewster, Charles Gillis, Veronica Harris, David Hole and Diane Stockton for information and advice on Scottish cancer registration data.
Sandra Ferguson for information on cancer registration and cancer mortality rates in Inverclyde compared with Scotland.
Staff at the National Health Service Central Registers in Edinburgh and Southport
Bernie Good, Jan Harding, Phil Irwin, Valerie Clayton and Andrea Grainger for administrative support.
Suzi Curtis for her independent audit of study method and its implementation.
Many other HSE colleagues who have provided advice and support.
ii

FOREWORD
This report describes an investigation into the possible occurrence of work-related cancers at the National Semiconductor (UK) Ltd facility in Greenock. It is limited by the available information in the extent to which it could pursue this possibility. The study provides evidence of an excess of certain cancers within the workforce and further work needs to be undertaken urgently. This cannot be taken forward without knowledge of HSE's findings by both the management and workforce of this Company. Consequently, this report has been made available at the earliest opportunity to alert everyone to the key findings.
iii

iv

CONTENTS
Executive summary vii
1
6
15
30
37
38
39
1 Introduction
2 Methods
3 Results
4 Discussion
5 Conclusions
6 Recommendations
7 References
Appendix 1: Protocol for the investigation 41
Committee
surrogate for potential exposure to known or suspected carcinogens
occupational health records
methodology
Appendix 2: Worker leaflet announcing the investigation 48
Appendix 3: Terms of reference for independent scientific Steering 51
Appendix 4: Results of the exercise to validate fab/non-fab variable as a 52
Appendix 5: Results of the exercise to validate fab/non-fab status from 54
Appendix 6: Results of the 10% sample check of personnel records 58
Appendix 7: Finalisation of data set sent to the NHSCR- 67
Appendix 8: Statistical analysis plan for the investigation 71
Appendix 9: Methodology for Carstairs adjusted analysis 77
Appendix 10: Independent verification and implementation of study 85
Appendix 11: Worker results leaflet 88
v

vi

EXECUTIVE SUMMARY
Introduction
The Health and Safety Executive (HSE) responded in late 1998 to developing concerns about cancer among current and former workers at the Greenock plant of National Semiconductor (UK), Ltd. (NSUK), particularly as expressed by Phase Two, a local worker support group.
The aim of this investigation was to determine the cancer incidence and mortality of current and former NSUK workers to follow up the concerns that had been expressed, and to assess the need for further investigation. This focus implied that the current investigation would use only readily available information on worker histories and exposures, and would not seek data on non-work factors.
Methods
A study protocol was prepared for the investigation. This was presented to the management and workforce of NSUK and agreed by an independent scientific Steering Committee. Appropriate ethical clearances were obtained for the investigation.
HSE had hoped to meet with the Phase Two campaign group at the outset of the investigation primarily to ensure that this investigation addressed their specific concerns. To our regret, Phase Two declined to meet with us mainly, we believe, because they and their scientific advisers felt that a full-scale industry study was required. We were however able to consult information contained on their website before the launch of the investigation.
Personnel data supplied by NSUK were validated and queries returned to NSUK for a response. We also carried out a sample check of the completeness and accuracy of the personnel information. Further checks were applied as part of the process of tracing the cohort on the National Health Service Central Register (NHSCR). Some of the personnel sources used to identify NSUK Greenock workers included employees based at other sites. The study was limited to individuals who could be confirmed as having worked for NSUK at Greenock.
Although detailed occupational histories of all current and former workers were not collected as part of this investigation, it was possible to use a classification from the NSUK occupational health records which identified individuals assigned to work in the fabrication areas. These are the areas of the plant where the semiconductor chips are made, and where the exposures characteristic of this industry are found.
The main statistics used in the analysis were Standardised Mortality Ratios (SMRs) and Standardised Registration Ratios (SRRs). These statistics (together with their associated 95% confidence intervals (CIs)) provide an indication of whether or not the cancer rates in NSUK workers are different to those of the comparison population. They are calculated as a ratio (expressed as a percentage) of the observed number of cases to the number expected given the size and age and sex distribution of the study population, and appropriate reference rates for the diseases of interest.
The SMRs and SRRs have been calculated in two ways, first using Scottish national rates and then using rates derived from Scottish national data in a way designed to reflect the socioeconomic profile of the area from which the NSUK workers were drawn. The reason for taking
vii

the second approach is that it is known that different area socio-economic profiles are associated with different area health profiles. The conclusions of the study were not qualitatively affected by the adjustment.
Cancer registration analyses were calculated up to the end of 1998, since this is the latest year for which cancer registration was thought to be essentially complete. The mortality analyses ran to the end of 2000.
A list of known or suspected carcinogens that had been used at the factory and the known concerns of the local worker support group Phase Two were used to select the cancers to be examined in this investigation.
Main findings and conclusions
The mortality analyses included 4388 workers who where traced at the NHSCR. The cancer registration analyses include five fewer, 4883. The average length of follow up was 12.5 years.
All-cause mortality for women in the NSUK workforce is slightly below expected levels, mortality for men was substantially below expected levels. Total cancer registrations are close to expected levels for men and for women. Four specific cancers show findings which raised concern, and which will require further investigation.
There are approximately two to three times more cases than expected of female lung cancer, based on 11 cases, a finding that is statistically significant. Some aspects of the data, such as the tendency to a higher excess in cancer incidence less than 10 years from dates of start of employment, raise questions about the likelihood that the observed excess is due to workplace factors. More detailed information is required to clarify this key question. The present data suggest the possibility, but do not prove, that some of this excess may be related to work at the NSUK plant at Greenock.
There are approximately four to five times more cases than expected of female stomach cancers. This is based on only three cases. Although based on small numbers this finding is of borderline statistical significance. As for the lung cancer finding, there is some evidence that argues against a workplace explanation for this finding, but the evidence is inconclusive. Therefore there remains the possibility of some of this excess being related to work at the NSUK plant at Greenock.
The female breast cancer excess of approximately 30% above expected is much smaller than that for lung and stomach cancer, although based on a larger number of cases (20). However this moderate overall excess is concentrated in women first employed in 1982 or later, among whom there were twice as many cases observed as expected, a result which is just statistically significant. More detailed examination of the cases’ work histories is required before more definite conclusions can be drawn.
There are approximately four times as many male brain cancers as expected, based on three fatal cases. There was also an additional non-fatal case. In view of the fact that brain cancer was not of specific interest at the outset of the investigation and the short latency for three of the four cases, it is most probably not work-related. However, the lack of knowledge in relation to the causes of brain cancer, means that the possibility of a work-related explanation cannot be entirely ruled out.
viii

None of the other cancers of interest at the outset of the investigation, either because of the known or suspected carcinogens that are or have been present at the Greenock factory or because of the known concerns of the worker support group Phase Two, have so far shown any evidence of excesses that might be associated with work at the factory.
Our results, though inconclusive, reinforce the concerns that prompted our investigation. The findings, particularly those relating to lung cancer, need to be treated very seriously. They raise the possibility of a work-related risk of cancer, but more detailed studies will be needed to clarify this.
ix

x

1. INTRODUCTION
1.1 REASONS FOR THE INVESTIGATION
Concern that there might be a cluster of cancers in the semiconductor industry in Great Britain first came to the attention of the Health and Safety Executive (HSE) in late 1998. The concern was almost exclusively centred on the Greenock Plant of National Semiconductor (UK) Ltd. (NSUK), and was expressed in the form of workers’ support group actions, media coverage and parliamentary activity.
In response to this worker, public and political concern HSE determined that it should seek as quickly as possible to move beyond the existing anecdotal information and establish the actual level of cancer incidence in the NSUK workforce thus providing evidence on which to base consideration of any further action.
1.2 EXISTING EVIDENCE FOR RISK OF CANCER IN THE SEMICONDUCTOR INDUSTRY
The majority of epidemiological reports referring to the semiconductor industry are, in reality, based on studies of the electronic equipment manufacturing and servicing industries in a much broader sense and the study populations contain few, if any, semiconductor manufacturing workers. Many of the occupational exposures prevalent in electronic assembly work are not common to semiconductor manufacture, and vice versa, so it would be unwise to draw any conclusions about the semiconductor industry from more broadly based studies. We have identified only two epidemiological studies specific to cancer risk in semiconductor manufacturing, both conducted on the same cohort of workers at a semiconductor factory in the West Midlands region of England.
A report of a small cohort of 1807 workers was published in 1985 (Sorahan et al., 1985) and updated in 1992 (Sorahan et al., 1992). The study was carried out because astute observers had noticed several instances of skin cancers among the workers. It was hypothesised that this might be due to exposure to ultraviolet radiation used in the photolithography process. The mortality experience for the cohort was compared with that expected on the basis of mortality rates for England and Wales and cancer registration experience was compared with that expected on the basis of cancer incidence rates for the West Midlands region of England. For the total study cohort, observed numbers of deaths and incident cases for all cancers were close to expectation. However, for melanoma incidence, for the whole study population, three cases (all in women) were observed with an expected number of 0.68, a finding that was of borderline statistical significance. A small nested case-control study failed to establish a relationship between duration of employment in the workplace and the risk of developing a melanoma. The update, Sorahan et al. (1992), concluded that there was no new evidence for any excess risk of melanoma in the study population.
1.3 CHOICE OF APPROACH
In addition to the considerations set out in Section 1.1, the exact nature of the investigation undertaken was dependent on the personnel information held by NSUK. It was hoped that these data were of sufficient quality and completeness to enable current and former employees to be traced at the National Health Service Central Register (NHSCR) in Edinburgh and the Scottish
1

Cancer Registry held at the Information at Statistics Division (ISD) of the Scottish Health Service’s Common Services Agency. If this was the case, obtaining information on the cancers and deaths that had occurred among workers ever employed at the Greenock factory would enable cancer rates in the Greenock workforce to be compared with those that would be expected on the basis of appropriate comparison populations.
HSE established early on that personnel information held by NSUK was of sufficient quality and completeness to enable current and former employees to be traced at the NHSCR. This meant that it would be possible to generate cancer rates for the Greenock workforce. However, job history information at a level which would be meaningful in terms of potential exposures was not generally available.
Although the scope of this initial investigation was therefore limited to establishing levels of cancer in the workforce, this was approached in such a way that it would form a sound basis for further, more detailed investigation, should that prove necessary. In addition, if any other readily available information that might contribute to HSE’s assessment could be identified, then it would be used in this investigation.
In summary, the aims of this investigation were limited to establishing the level of cancer incidence and mortality in the workforce of NSUK compared to an appropriate reference, population, and relating this incidence to any readily available information on individuals’ histories of work in the plant. The aim was to establish some basic facts relatively quickly, and decide whether more extensive investigation would be justified.
1.4 THE SEMICONDUCTOR MANUFACTURING FACILITY AT GREENOCK
The manufacture of semiconductor devices is a highly complex process whereby numerous complete electronic devices are created on and within the surface of a thin circular disc of highly purified silicon, known as a wafer. The basic principles of silicon-based semiconductor technology have not changed during the lifetime of the Greenock facility but there has been progressive miniaturisation of the individual circuit components with a concomitant increase in the complexity of the devices that can be produced as a single silicon “chip”. The manufacturing process has evolved over the years to accommodate this progress, with general trends towards reduction in particulate contamination in air in the manufacturing areas, increasing process enclosure, and increasing automation.
There are several steps in the manufacturing process, all of which may be repeated many times on each wafer. One such step is the addition of small quantities of other elements such as arsenic, antimony, phosphorus or boron to the silicon to alter its electrical properties. The process is generically known as doping and the added elements are referred to as dopants. This may be done by a variety of methods, such as heating the wafer in a furnace containing a small quantity of vaporised dopant (diffusion) or by subjecting the wafer to a beam of electrically accelerated ions in a vacuum chamber (ion implantation). There has been a progressive move from diffusion to ion implantation over time because ion implantation allows more precise control of the doping process. As a result of this trend the doping process has become more enclosed and more automated.
Another common process, called etching, involves the removal of areas of unwanted material between components created by the doping process. This can be done using mixtures of corrosive acids, often including hydrofluoric acid (wet etching) or by placing the wafer in an enclosed chamber containing a gaseous plasma of a halogen such as chlorine (dry etching). The use of dry etching has increased over the years because it can achieve higher resolutions. There
2
has been a concomitant reduction in wet etching though it remains in use and is still superior in a variety of specific applications.
Other processes involve the growth of a fresh layer of silicon on the surface of the wafer (epitaxy), the production of protective or insulating layers of silicon oxide or silicon nitride and the deposition of metallic connections between components (metallisation). At the heart of the whole manufacturing operations is, however, the process known as photolithography.
The various films described above can have patterns defined in them by creating a mask which is resistant to etching. This mask is created by coating the wafer with a solution of photosensitive resin in an organic solvent. The mixture is known as photoresist. When it has dried on the surface of the wafer, the microscopic circuit patterns are projected onto the surface using ultraviolet light passed through a master mask representing the required pattern. The wafer is then treated with a developer to enhance the effect of the exposure. This has the effect of either hardening the exposed areas, allowing the remainder to be removed (negative photoresist) or causing the exposed areas to degenerate leaving the remainder to harden and produce the required masking pattern (positive photoresist).
Photoresists and photoresist developers are dissolved in mixtures of organic solvents. These are usually based on xylene for negative photoresists and glycol ethers and alkyl esters for positive photoresists. There was extensive substitution of the ethylene glycol ethers with propylene glycol ethers during the early to mid 1990s because of concerns about possible effects on reproductive health.
The photolithography process may be repeated many times as the circuits are built up in very thin layers.
The separation of components and the width of connections in many modern semiconductor devices is less than one micron so it is essential that the processes are carried out in a particle free area. All the manufacturing processes described above are therefore carried out in clean rooms with highly efficient filtration systems. These are known as fabrication rooms or ‘fabs’. Once the process of fabrication is complete, the circuits are complete and are much less susceptible to damage by airborne contamination. The remaining manufacturing processes include cutting the wafer into individual circuits (“dies” or “chips”), testing the chips, attaching them to metal connecting leads and encapsulating the finished device in a plastic resin or ceramic case, can be undertaken in less clean areas. The whole manufacturing process can therefore be divided into fab and non-fab areas, with quite different chemical and other exposures.
1.5 KNOWN OR SUSPECTED CARCINOGENS USED AT NSUK
We attempted to identify any generally recognised carcinogenic substances or agents which had been in use at the factory to assist us in compiling a list of cancer sites and types which might be of particular a priori interest. NSUK supplied a list of known or suspected carcinogens that had been used or present at the Greenock plant since operations began in 1970. These are listed in Table 1. The definition of “known or suspected carcinogens” was based on the legal classification of the substances under either UK or US health and safety legislation. We reviewed the NSUK list against a list of designated carcinogenic substances that we extracted from the Corporate Chemical and Radiation Safety Handbook (National Semiconductor, 1995) to check for possible omissions from the NSUK list. A number of additional carcinogenic agents were included in the Corporate Chemical and Radiation Safety Handbook, but these were known to not have been used in processes at the Greenock site. These additional agents include:
3

hexavalent chromium compounds other than chromium trioxide and chromic acid, nickel compounds, methylene chloride, methyl chloride, styrene, and dioxane. We therefore concluded that the list supplied by NSUK was an accurate reflection of the recognised carcinogens used or present at NSUK. We appreciate that neither the NSUK list nor the Corporate Chemical and Radiation Safety Handbook can be considered as exhaustive lists of all the potential carcinogens which may be used in the industry. This is partly because not all chemicals in industrial use have been reviewed or classified with respect to carcinogenicity and partly because preparations containing carcinogenic substances below defined concentration limits are not classified as carcinogenic.
We sought advice of HSE toxicologists on the carcinogenic potential of the list of agents and substances supplied by NSUK. From the list, the only cancer sites for which there is human evidence for carcinogenicity are the lung, pleura, respiratory tract and skin. In addition, ionising radiation in general is thought to cause almost all cancers in humans, with some exceptions including chronic lymphatic leukaemia (CLL), Hodgkin’s disease and malignant melanoma. Certain types of cancer are more radiosensitive to ionising radiation and these are lung cancer, female breast cancer, leukaemia (except CLL), thyroid cancer and multiple myeloma.
In this way, a reasoned list of cancers to be examined was constructed in order to minimise the risk of ascribing spurious statistical significance to post hoc, data driven findings.
1.6 ETHICAL CONSIDERATIONS
Applications based on the protocol for the investigation (see Appendix 1) were submitted to the Medical and Research Ethics Committee of the Argyll and Clyde Health Board and to the Privacy Advisory Committee of ISD and the General Register Office for Scotland (GRO(S)) who maintain the NHSCR for Scotland. These were approved.
The investigation is registered under the Data Protection Act (1998) and has been undertaken in accordance with the requirements of the Act.
It was not practicable to seek the explicit consent of individual subjects in the investigation but a leaflet (see Appendix 2) was sent to their last known address (based on NSUK information) setting out the purpose and nature of the investigation and explaining how they could opt out if they so wished. The number for a confidential freephone telephone line was given in the leaflet. Presentations to the workforce and to the media were used to convey the same messages including the availability of the helpline.
A meeting was held with NSUK management before the launch of the investigation in order to gain a mutual understanding of the processes involved in getting this investigation underway. Additionally, it provided an opportunity for NSUK management to resolve any queries that they may have had about the proposed investigation. Five presentations were given to NSUK staff over a three day period. This gave the workforce the opportunity to question the HSE team about the investigation.
4
Table 1 - List of known or suspected carcinogens used at NSUK
Listed below are the known or suspected carcinogens (in practice those classified in the EU or USA) obtained from NSUK.
Antimony trioxide Arsenic and arsenical compounds Arsine Asbestos (in buildings) Chromium trioxide Kaowool Highly refined mineral oil Arsine/arsenical compound contaminated oil Sulphuric acid mists Ionising radiation UV radiation Krypton 85 Carbon tetrachloride Chromic acid Trichloroethane Trichloroethylene
5

2. METHODS
2.1 INVESTIGATION PROTOCOL
The protocol for the investigation is set out in Appendix 1. It was endorsed by the Independent Steering Committee (see Section 2.2). All deviations from the protocol are mentioned in this report. They were felt to be too minor to require formal documentation as protocol amendments.
The protocol covers:
• reasons for the investigation • data sought from NSUK • role of the Independent Steering Committee • communication with the management and workforce of NSUK • role of Phase Two in the investigation • disease groups to be investigated • statistical comparisons to be made, including adjustments for an index of deprivation • undertaking to make the results of the investigation available to NSUK management
and workforce in advance of publication
2.2 INDEPENDENT STEERING COMMITTEE
The HSE investigation team decided at the outset of the investigation to appoint an Independent Steering Committee to oversee the scientific aspect of the investigation. Their terms of reference, which they agreed at the outset of the investigation are set out in Appendix 3. In appointing the committee, we felt it important that in addition to having relevant expertise, that the committee members should be based in Scotland. The committee members were:
Prof. Freda Alexander (Statistics and Epidemiology) – University of Edinburgh Dr. Raymond Agius1 (Occupational Medicine) – University of Edinburgh Dr. Lewis Reay (Public Health Medicine) – Argyll & Clyde Health Board
As well as endorsing the protocol for the investigation and their terms of reference, the Independent Steering Committee: agreed the worker leaflet announcing the investigation; received monthly progress reports; agreed the statistical analysis plan for the investigation; received the results of the exercise to find an easily extractable variable to act as a surrogate for potential exposure to known or suspected carcinogens; received the results of the exercise to validate this data source; and received a report on the results of the 10% sample check on completeness of NSUK personnel data; and endorsed our results, conclusions and recommendations.
2.3 PHASE TWO CAMPAIGN GROUP
The investigation plan set out in our protocol was criticised by a group of academics coordinated by Dr Joseph LaDou, an occupational physician with a long-standing interest in the
1Dr. Agius has since become Professor of Occupational and Environmental Medicine at the University of Manchester.
6

semiconductor industry, and editor of the International Journal of Occupational and Environmental Health. This group's objections centred on the size of the study, arguing that a detailed large-scale industry-wide study was required. In correspondence with Dr LaDou's Journal (Bailar et al., 2000a and 2000b, McElvenny et al., 2000 – a further HSE response was not published), we argued that the existing evidence for concern did not justify the commitment of resources implied by such a study. We considered that the concerns expressed in relation to the cancer experience of current and former workers at NSUK could usefully be addressed initially by a study at this plant, followed up if necessary by a wider study. Had we been attempting a definitive study of health effects in the industry the criticisms would have been justified, but this was not our aim.
We had hoped at the outset of the investigation that we would have a face-to-face meeting with Phase Two, the campaign group local to the NSUK plant at Greenock. The purpose of the meeting would have been to allow Phase Two the opportunity to explain their concerns to us first hand. In particular, we were interested in knowing which cancers they were particularly concerned about and whether there were any particular processes or parts of the factory (including those no longer operational) which were of special concern to them. Additionally, we wished to obtain a list of cancer cases known to Phase Two that could be used as an informal check on the completeness of our case ascertainment.
To our regret, Phase Two declined to meet us, and set out their objections to the study, echoing those expressed by the academic group referred to above, in a letter published in Dr LaDou's Journal (McCourt and Morrison 2001 - again an HSE response was not published). We were therefore unable to take account of this group's specific concerns. We nevertheless took advantage of the information available from their website just before the launch of the investigation.
2.4 DISEASE GROUPS EXAMINED IN THE INVESTIGATION
The disease groups chosen in this investigation were a prudent balancing of the need to avoid examining every single possible type of cancer and the need to have a focused set of specific cancers to examine (thus reducing the potential for spuriously positive findings).
9
The following cancers were examined on the basis of the known or suspected carcinogens that have been used or have been present at the factory. The codes in parentheses are based on the
th revision of the International Classification of Diseases (ICD9) (World Health Organisation, 1977).
Cancer group (ICD9)
Malignant neoplasms of the trachea, bronchus and lung (162) Malignant neoplasms of the pleura (163) Malignant melanomas of the skin (172) Other malignant neoplasms of the skin (173) Malignant neoplasms of the female breast (174) Malignant neoplasms of the thyroid gland (193) Multiple myeloma (203) Leukaemia except chronic lymphatic leukaemia (204.0, 204.2-208)
7

The following cancers were examined on the basis of their being listed on the Phase Two website before the launch of the investigation:
Cancer group (ICD 9)
Malignant neoplasms of the stomach (151) Malignant neoplasms of the female breast (174) Malignant neoplasms of the uterus (179, 182) Leukaemia (204-208)
The following broad cancer groups were examined to help characterise the overall cancer experience of the NSUK workforce:
Cancer Group (ICD 9)
All malignant neoplasms (140-208) Malignant neoplasms of the lip, oral cavity and pharynx (140-149) Malignant neoplasms of the digestive organs and peritoneum (150-159) Malignant neoplasms of the respiratory and intrathoracic organs (160-165) Malignant neoplasms of the genitourinary organs (179-189) Malignant neoplasms of the lymphatic and haematopoietic tissue (200-208) In situ neoplasms (230-234)
Additionally, mortality from the following causes was examined to help inform the cancer registrations analyses:
Disease group (ICD 9)
All causes (001-999) Diseases of the blood and blood forming organs (280-289) Diseases of the circulatory system (390-459) Diseases of the respiratory system (460-519) Diseases of the genitourinary system (580-629)
Each of the disease groups (where applicable) were examined separately for males and females.
2.5 MARKERS OF EXPOSURE
An investigation of possible work-related health effects can be made much more informative where comparisons can be made between subgroups with different exposures, or different levels of exposure. We therefore looked for means to distinguish such groups within the NSUK population. Since the essence of the current exercise was to work from readily available existing data sources, the kinds of information of this sort were always likely to be limited.
8

Data sources that were examined were Human Resources, Payroll, Pensions and Occupational Health. Full details of the methods employed and the results of the exercise to assess what exposure markers could be extracted from NSUK records is set out in Appendix 4. It was concluded that the only possible source of data that could practically be used was assignment to work area as recorded by the occupational health department. The work areas were classified for analysis as fabrication (fab) or non-fabrication (non-fab).
The methods employed to validate and extract these data are set out in Appendix 5. Fab/non-fab status was extracted by HSE staff, with the assistance of NSUK occupational health staff from the medical records held in the Occupational Health Department, under the supervision of a medically qualified member of the investigation team (RCE). These data were double entered and merged with the finalised personnel data (see next section).
2.6 CONSTRUCTION OF COHORT DATA
A data set was provided by NSUK that contained data on surname, maiden name (if applicable), forename(s), date of birth, national insurance number, start date, leave date, and whether known to the company to have died. Workers had a record on the file for each distinct employment episode at the Greenock site.
A unique identification number was created for each record supplied. The data were checked for missing information and validated for internal consistency. Missing or inconsistent data items and potential duplicate records were queried with NSUK and data amendments made on the basis of their response. Information was combined so there was a single record for each individual in the dataset.
An approximate 10% sample check on the completeness and accuracy of the data supplied was carried out by HSE staff against the original sources. A possible discrepancy in the logic used by NSUK to derive the data file was identified. In essence, only personnel and occupational health records had been used to create the dataset. This was checked for accuracy against other sources at NSUK but not completeness. Thus any NSUK workers not listed in personnel and occupational health records but on other sources were not identified. The checking exercise was modified so that all payroll and pension records were checked for additional workers. This resulted in the identification of 425 additional workers potentially employed by NSUK at Greenock. However, NSUK were unable to confirm that any of these had worked at the Greenock site. The most likely explanation is that these workers were employed in the NSUK sales office in Swindon, or that they were foreign nationals on secondment from other parts of National Semiconductors. The additional workers were added to the data file but marked as unconfirmed Greenock workers. Full details of the checking exercise are set out in Appendix 6.
A number of discrepancies were identified between the data file and the original source data during the checking exercise, and a further small number of discrepancies were identified between the data file and the occupational health records during the extraction of the fab/non-fab status. Amendments or possible alternatives (where it wasn’t clear which information was correct) were recorded in the data set.
A consolidated data set was created incorporating the results of the validation checks and the accuracy/completeness checks, address information (provided separately by NSUK), fab status, and any other amendments to the data file. This was sent to the NHSCR to enable workers to be flagged on their computer system for death and cancer. This consolidation is described in more detail in Appendix 7.
9

2.7 TRACING OF CURRENT AND FORMER WORKERS
It was intended that all current and former workers be flagged for death and cancer registration information at the NHSCR in Edinburgh.
There were three stages to the tracing exercise, with those left untraced progressing to the next stage:
1. Matching our data file to that held by NHSCR electronically. 2. Manual matching of records not matched electronically. 3. Matching records held at Scottish health boards.
Details of workers traced by GRO(S) to England and Wales or Northern Ireland (i.e. workers who had moved there from Scotland) were sent to Southport or Belfast for flagging on the respective systems.
Details of any workers who were not traced at the NHSCR were sent to the Department for Work and Pensions in Newcastle upon Tyne to enable National Insurance number to be used as a means of obtaining fact and date of death information where applicable, or of confirming/correcting personnel information. In particular, for untraced records with alternative information resulting from the validation exercise, the aim was to identify the correct information. Any records where new information was obtained via this method were then retraced at the NHSCR.
In order to check that cancer registration data supplied by GRO(S) were complete, the data file was sent to ISD and traced against the Scottish Cancer Registry database.
The workers have been flagged at the NHSCR and the HSE investigation team continues to receive quarterly notifications of deaths, cancer registrations, emigrations and name changes (mainly women who get married).
2.8 STATISTICAL METHODS
Before any data were sought from the NHSCR a statistical analysis plan was produced that met with the approval of the Independent Steering Committee. The plan is reproduced in full in Appendix 8.
2.8.1 Data reconciliation for analysis
Any workers flagged as unconfirmed Greenock workers, after carrying out the check of completeness and accuracy of NSUK personnel data, were excluded from the analysis data file. We had intended to include these workers as part of a sensitivity analysis, but the small proportion traced at the NHSCR argued against this.
For two workers who had no start date but a leave date, their start dates were imputed based on mean employment duration for workers born in the same year and month and subtracting the result from the leave date. There were five workers with no start or leave dates who could not be assumed to be current employees at 30 April 1999. However, a leave date was required by the analysis software and hence 30 April 1999 was used. Start dates for these records were imputed by calculating the mean starting age of workers born in the same year and month. None of the subjects with imputed dates had died or been registered with a cancer.
10

Members and postings lists were obtained from the NHSCRs at Southport and Edinburgh. These are lists of all records flagged on the NHSCR systems. These lists were used to confirm names, dates of birth, and sex for workers with alternative or missing information that had not been resolved during validation.
People who were recorded as having emigrated were assumed at risk up to their emigration date for mortality and cancer registration analyses, but ceased accumulating person years of experience from date of emigration.
For the mortality analysis the end of follow up was 31 December 1998. At the time of the analysis Scottish cancer registration data for 1998 from ISD were 96% complete and England and Wales data from NHSCR 99% complete.
A database of addresses was maintained, and kept as up-to date as possible. In particular, an up-to-date list was provided by NSUK to ensure latest address information could be used and to ensure workers who joined after 30 April 1999 received details of the investigation’s results.
2.8.2 Calculation of unadjusted SMRs and SRRs
An SMR (or Standardised Mortality Ratio) is a ratio of an observed (O) number of deaths to that expected (E), based on age and sex specific rates from a standard population (in this case Scotland) as applied to the population of interest (in this case current and former NSUK workers). The O to E ratio is conventionally multiplied by 100.
An SRR (or Standardised Registration Ratio) is an analogous ratio based on cancer registration data.
An SMR or SRR greater than 100 therefore signifies a ratio where the observed number of deaths or registrations is greater than that expected.
The 95% confidence interval (CI) associated with an SMR or SRR is a measure of the precision with which the SMR or SRR is known. There is a 95% chance that the true O to E ratio is contained within the confidence interval. A 95% CI in which the lower 95% confidence limit (bottom end of the interval) is above 100 is said to be statistically significantly above 100 (at the 2-sided 5% level) i.e. the observed number of deaths or cancer registrations is statistically significantly higher than expected.
Scottish death and population data for 1970 to 1999 obtained from GRO(S) were used to calculate death rates by five-year age group and calendar time period for the disease groups given in the statistical analysis plan (see Appendix 8). Cancer registration data for 1970 to 1997 obtained from ISD were used with the Scottish population data to calculate cancer registration rates in the same format. Mortality and cancer registration data were validated by comparing aggregated data with published figures.
Event data supplied by GRO(S) were coded to ICD8 (World Health Organisation, 1967) to 1978 and ICD9 for 1979 onwards. Cancer registrations supplied by ISD were coded to ICD10 (World Health Oganisation, 1992). All deaths and cancer registrations were recoded to ICD9 before analysis.
At the time of analysis, more recent event data were available than comparison data. Complete event data were available until the end of 2000 for deaths and 1998 for cancer registrations. However, the latest complete years of Scottish death and cancer registration data were 1999 and
11

1998. Therefore, in the mortality analyses, expected values for the period 1995 to 2000 were computed using rates for 1995 to 1999, and cancer registration analyses for 1995 to 1998 used the rates for 1995 to 1997.
2.8.3 Carstairs deprivation index and adjusted SMRs and SRRs
Background information on cancer and mortality in the Greenock and Inverclyde area for some of the diseases of interest in this investigation was obtained from the Argyll and Clyde Health Board. The SMRs and their 95% confidence intervals for Inverclyde Council compared with Scotland for 1991 to 1999 for all ages were:
Sex Cause of death Male Female
SMR (95% CI) SMR (95% CI) All causes 120 (117 to 123) 110 (107 to 113) All malignant neoplasms 118 (112 to 124) 107 (102 to 113) Stomach Cancer 165 (136 to 200) 148 (117 to 185) Lung cancer 127 (117 to 139) 116 (103 to 129) Breast cancer 93 (80 to 108) Circulatory disease 117 (113 to 122) 110 (106 to 114) Respiratory diseases 118 (109 to 127) 112 (105 to 121)
SRRs and 95% confidence intervals for both sexes combined for the periods 1981 to 1999 for Inverclyde council compared to the rest of Scotland were:
Cancer registrations SRR 95% CI (both sexes)
All malignant neoplasms 123 (121 to 126) Stomach cancer 125 (113 to 137) Lung cancer 118 (113 to 124) Female breast cancer 97 (91 to 104)
As for the mortality data, cancer registration rates are higher for all malignant neoplasms, stomach cancer and lung cancer for Inverclyde compared with Scotland, but the female breast cancer rate is slightly lower.
Several approaches can be taken to estimate the expected level of mortality or cancer incidence in a study population. The choice of method is a question of balancing two conflicting criteria. First, the reference population should resemble the study population as closely as possible: second, it should be large enough to give statistically stable rates for all disease categories of interest. The choice typically comes down to one between the use of National, Regional or Local rates. National level rates will be statistically stable, but may be less representative of the study population. Local or regional rates will better represent the study population, but may have considerable statistical instability (see, for example, the confidence limits around the regional SRRs given in the previous paragraph).
We therefore consulted the Scottish Cancer Intelligence Unit (SCIU) for their view on the choice of reference population for this investigation. The SCIU recommendation was to use the data from the Scottish population as a whole but with an adjustment based on the Carstairs index (Carstairs and Morris, 1991) to match the national data to the Carstairs index profile of the areas from which the NSUK cohort is drawn. In this method areas (postcode sectors) of Scotland are divided into five bands of broadly similar socio-economic character. Disease rates for these bands are recorded separately, and an average of these five bands rates, weighted to
12
reflect the socio-economic profile of the areas from which the NSUK workers are drawn, is then calculated. These weighted average rates provide the basis for comparisons adjusted (broadly) for local socio-economic and lifestyle factors (including smoking).
As well as the distribution of places of residence of the NSUK workforce, the adjustment varies in size and direction depending on the type of cancer being investigated. Most previous uses of the Carstairs deprivation index (e.g. Black et al., 1994) made use of the index by weighting person-years at the individual level when calculating risks. However, for the NSUK investigation population, we were not confident of having complete addresses for all current and former employees. We therefore adopted a modified approach.
The distribution of postcode sectors by sex for current NSUK employees was sent to the SCIU in order to obtain the sex-specific deprivation distributions according to deprivation quintiles. Mortality and cancer registration data, for the 5-year periods centred on the 1981 and 1991 Censuses, were obtained by 5-year age group, sex and deprivation quintile for each of the disease groups. Additionally we obtained Scottish population data from the 1981 and 1991 census by 5-year age group, sex and deprivation quintile. These data were then used to calculate disease, sex, age group and time period specific weights. The weights were then applied to the unadjusted Scottish death or cancer registration comparison rates to produce “Carstairs” adjusted rates. See Appendix 9 for more information.
2.8.4 Subgroup analyses
A 10-year cutpoint was used for latency analyses, latency being defined as the length of time (in years) from start of employment at the plant. The relatively short length of follow-up prohibited use of a longer e.g. 15-year cutpoint, or more than two latency analysis categories.
Analyses by date of start were run using two groups divided at 1982, the year which gave approximately equal numbers of all malignant neoplasm cancer registrations in the two date of start subgroups. Similarly, analyses by age were divided at age 50, the 5-year point giving approximately equal numbers of expected all malignant neoplasms in the two age subgroups.
The software used to calculate both SMRs and SRRs was OCMAP-PLUS v3.09 (Beta v1.0) (Marsh et al., 1998), a program specially designed for occupational mortality analyses. When used to analyse cancer registrations, a difficulty was presented where an individual has more than one registered cancer. A minor inaccuracy was also produced in the calculation of expected values, since person-years after the date of the first cancer registration are not counted. The first difficulty was addressed by including a duplicate person record for each of the individuals with more than one registered cancer. The inflation of expected values from these additional records was estimated to be trivial. The understatement of expected values due to the loss of post registration person-years was assessed by doing a second analysis with the event date set to the end of follow-up. Again, the change in expected values was trivial.
2.9 INDEPENDENT VERIFICATION OF THE INVESTIGATION METHODOLOGY
The logic and implementation of the validation checks carried out on the data supplied by and obtained from NSUK was checked by an HSE statistician independent of the investigation team. The statistician also checked the computerisation of the event data, the preparation of the computer files for statistical analysis, and the calculations made using OCMAP-PLUS. Some minor changes to the data were made as a result of these checks and no errors in the statistical
13

calculations were found. More details of the independent verification are included in Appendix 10.
2.10 DISSEMINATION OF THE FINDINGS OF THE INVESTIGATION
We undertook to ensure that the NSUK management and workforce would hear the results of this investigation before they were made public, and our main means of doing this was to produce a results leaflet mailed to each current and former worker. In addition we undertook to give presentations to all shifts of workers the same day as, or shortly after, receipt of the leaflet. We also undertook to provide a confidential freephone telephone line to deal with any concerns that individuals may have about the findings of the investigation.
We also provided monthly progress reports to NSUK management and these were posted on a notice board, and a communication was sent to all personnel on site to bring this to their attention. These reports were also sent to Phase Two and the Scottish Executive.
14

3. RESULTS
3.1 FINALISATION OF INVESTIGATION DATA SENT TO NHSCR
The revised data set received from NSUK contained 4814 records. Some 425 extra records were identified as a result of the check on completeness of the personnel data (see Appendix 6 for further details of this). Some 256 records were deleted as a result of validation checks and queries with NSUK. Therefore, a total of 4983 records were submitted to the NHSCR for tracing (see Appendix 7 for more details of this).
3.2 TRACING OF THE CURRENT AND FORMER WORKERS
Of the 4983 records sent to the NHSCR for tracing, a further 33 were identified as duplicates resulting in a final data set of 4950 records. Of the traced records, 4067 (93%) were traced in Scotland, 318 (7%) in England and Wales and 3 (less than 1%) in Northern Ireland (Table 2). Some 2146 (49%) of the traced workers were males. Some 562 (11%) of the 4950 records were excluded from the main mortality analysis, 257 (46%) of whom were males. Using the Department for Work and Pensions tracing facility based on NI number resulted in a further 72 records being re-submitted to the NHSCR. Of these 62 were traced.
The reasons for the exclusions from the main mortality analysis are set out in Table 3. Some 403 records, 193 (48%) of which were males, were associated with workers who could not be confirmed by NSUK as having been employed by the company at Greenock. Our understanding is that this group of workers is most likely to consist of a mixture of workers who were at one time employed in the NSUK sales office in Swindon and non-UK nationals. This view is supported by the low proportion traced: only 146 (36%) of these were traced, of whom 89 were males. A further 159 (64 males) records contained individuals who could not be uniquely traced at the NHSCR. After exclusion of the workers that could not be confirmed as NSUK Greenock employees, the proportion of workers untraced at the NHSCR was 3.5%.
The distribution of the vital status of the 4388 traced workers at the end of 2000 who were included in the mortality analyses is set out in Table 4. Eighteen (less than 1%) of the workforce had emigrated from the UK and 71 (2%) of the workers had died.
Five of the 146 excluded workers who were traced but not confirmed as NSUK Greenock employees were known to have died at the time of the analysis. Four deaths occurred in males (acute myocardial infarction, malignant neoplasm of the rectum, other malignant neoplasm without specification of site and alcoholic liver cirrhosis), the female death was from the late effects of an accidental injury.
Therefore, 27 out of 2126 male workers had died (1.3%) and 44 out of 2262 female workers (1.9%). At the time of the analysis a further five deaths had occurred in 2001. There were two male deaths, one from acute myocardial infarction, the other as a result of a road traffic accident. Of the three female deaths, one was from chronic ischaemic heart disease and two were from malignant neoplasm of the breast. Of the workers flagged by NSUK as deceased, one was not verified as such after being traced at the NHSCR.
Note a further five workers were excluded from the cancer registration analyses, due to start of employment after cut-off for cancer registration analysis of 31 December 1998, or being traced in Northern Ireland, for which cancer registration data were not available.
15

There were 10 cancer registrations among the 146 traced workers excluded from the analysis: six among males and four among females. Two of the male cancers (non-melanotic skin cancer affecting the lip and non-melanotic skin cancer affecting other unspecified parts of the face) were primary cancer registrations for the same individual. The other male cancers were malignant neoplasm of the floor of the mouth, reticulosarcoma, carcinoma in situ of the skin, and a malignant neoplasm of the rectum. The female cancers were malignant melanoma of the skin, malignant neoplasm of the breast, benign neoplasm of the major salivary glands, and carcinoma in situ of the cervix uteri.
There were 149 cancer registrations among workers included in the study cohort. Of these 21 (7 males, 14 female) occurred prior to start of employment and hence were excluded. The male cancers excluded for this reason were malignant neoplasm of the bone, malignant melanoma of the skin (two), malignant neoplasm of the testis (two), and Hodgkin’s disease (two). The female cancers excluded were malignant neoplasm of the rectum, malignant melanoma of the skin, other malignant neoplasm of the skin, malignant neoplasm of the breast, malignant neoplasm of the bladder, lymphoid leukaemia, carcinoma in situ of the cervix uteri (six), malignant neoplasm of uncertain behaviour of the ovary, and neurofibromatosis. An additional cancer was excluded because it occurred after 31 December 1998, a male malignant neoplasm of the rectum. Thus 125 cohort members had cancer registrations included in the analysis. Of these, two were associated with more than one primary cancer registration.
3.3 DESCRIPTIVE STATISTICS
The distribution of age at first hire by sex is set out in Table 5. Nearly half the workforce was aged under 25 at hire. There is some evidence that women on average tend to be slightly younger than men when hired.
The distribution of length of service in years by sex is set out in Table 6. Around 20% of men and women have less than 12 months employment, 37% of men have more than one and less than five years’ service, the equivalent percentage for women being 33%. 20% of men have more than 10 years’ service and 25% of women. Thus, females tend to work slightly longer at the factory than males. The overall mean length of follow up for the mortality analysis was 12.5-years.
The distribution of work area according to NSUK’s occupational health records by sex is set out in Table 7. Of interest is that 1081 out of 2126 (51%) of males were recorded as working in fab areas whereas 1793 out of 2262 females (79%) were recorded as working in fab areas.
Figure 1 contains the distribution of the number of NSUK workers employed on 30 April each year during the investigation period as implied by the start and leave dates of the cohort studied.
16

0
500
1000
1500
2000
2500
1970 1975 1980 1985 1990 1995
Year
Number employed Males Females
Figure 1 Number of workers included in the analyses employed at NSUK Greenock on 30 April in each year from 1970 to 1999
Figure 1 shows the number of workers employed at the Greenock plant increased steadily from the mid-1970s to 1995, passing 500 in 1981, 1000 in 1984 and reached around 2000 in 1994. The number has decreased steadily from a peak of over 2000 in 1995 to around 1250 by April 1999.
The distribution of deaths and cancer registrations for those events included in the main analysis is set out in Table 8. The category of other malignant neoplasms includes four brain cancer registrations, three of which were fatal.
3.4 MORTALITY ANALYSES
There is clear evidence of a strong healthy worker effect in the male workers (see Table 9), which is slightly more evident when adjusted for deprivation, and it persists when the analysis is restricted to a latency of 10 years or more.
The unadjusted SMR for the three fatal brain cancers was 401 (95% CI 83 to 1172). The adjusted SMR was not calculated, as brain cancer was not one of the cause groups initially chosen for analysis, and the data required to apply the adjustment were not available.
17

There is some evidence of a small healthy worker effect for females (see Table 10), which is slightly more evident after adjustment for deprivation. A stronger healthy worker effect may be being obscured by the small excess of cancer mortality within 10 years of start of employment. Overall, the male mortality from all causes and all malignant neoplasms is lower than that for females, but these differences were not statistically significant.
3.5 CANCER REGISTRATION ANALYSES
Overall SRRs for all malignant neoplasms for males (see Table 11) and females (see Table 12) are in line with those expected from national rates, with or without adjustment for deprivation. This is in contrast to the mortality results where there is a deficit of male deaths from all malignant neoplasms.
High rates of malignant neoplasms of the trachea, bronchus and lung and stomach cancer in women were identified. There was also an excess of breast cancer (where there is an absolute excess of around five cases (approximately 30%) above that expected on the basis of national rates.
Of the 11 female lung cancers, five had a latency of less than 10 years, with ages at diagnosis ranging from 46 to 55. Five female cases had a latency of 10 to 20 years with a range of ages at diagnosis of 44 to 61. One woman had a latency of over 20 years and was aged 60 at diagnosis. One of the female lung cancers was non-fatal. One of the two male lung cancers was non-fatal, the other case was a death from myocardial infarction.
All the women with stomach cancer were diagnosed between five and 10-years after first starting work at the factory and all were aged less than 45 at diagnosis. Two of the cancers were fatal. The rate for digestive cancers as a whole is broadly as expected (adjusted SRR = 86, 95% CI 23 to 220, Table 10).
Four of the 20 breast cancers cases had died by the end of 2000. Ten of the cases had a latency of less than 10-years, with ages at diagnosis ranging from 31 to 60. For the eight cases with a latency between 10 and 20 years, the ages at diagnosis ranged from 35 to 57. For the two cases with latency of over 20-years, both were aged over 50 at diagnosis. Three of the four male brain cancers had died by end of 2000. Three cases had a latency of less than 10 years with ages at diagnosis of 23, 35 and 56 respectively. The non-fatal case was aged 32 at diagnosis.
Detailed lung cancer registration results for female lung cancers are set out in Table 13. There are approximately three to four times more lung cancer registrations than expected among women who have worked at the factory. This excess is reduced but persists after an adjustment is made for deprivation. The excess also remains, again with a slight reduction, after exclusion of workers employed for less than 12 months. The excess is more pronounced for a latency of less than 10 years, than for 10 years or more. The excess is similar in observations on women aged 50 or over compared to women aged under 50. The excess is more pronounced in women first employed in 1982 or later than those first employed before 1982. The excess is higher in women who work in fab areas than compared to those who do not. In common with all the internal comparisons made on these relatively small numbers, this difference in not statistically significant.
Detailed female stomach cancer results are set out in Table 14. There are approximately four to five times more stomach cancers than expected, based on only three cases. The excess is reduced slightly but persists after adjustment for deprivation. The excess remains after
18
exclusion of workers employed for less than 12 months, and is increased slightly. The excess is restricted to a latency of less than 10 years and observations on women aged less than 50. The excess is similar for women first employed before 1982 compared to those first employed after 1982 and also for those working in the fab compared to other women. These informal comparisons should be interpreted cautiously because of the small number of cases involved.
Detailed female breast cancer results are set out in Table 15. Although the breast cancer result is not as striking as those for lung and stomach cancers it represent an approximate 30% excess of observed over expected cases, and is based on 20 cases. The excess is increased slightly as expected when an adjustment is made for deprivation. However, the excess is substantially reduced when the analysis is restricted to women employed for 12 months or more. The excess is slightly higher for latency less than 10 years compared with a latency of 10 years or more. The excess is higher for observations on women aged 50 or over than for those aged less than 50. The excess is markedly higher for those women first employed in 1982 or later compared with those first employed before 1982. Within those women first employed after 1982, there seems little difference between the analysis based on latency less than 10 years compared with that based on a latency of 10 years or more. There is also some evidence that the excess is higher in women recorded as working in fab areas compared with other workers.
For women, apart from the cancers discussed in the previous paragraphs, there were no findings of note. For men, none of the cancer groupings selected for analysis produced statistically significant results. The highest SRR was produced by two cases of malignant melanoma, nearly twice the expected level (on an adjusted basis).
19
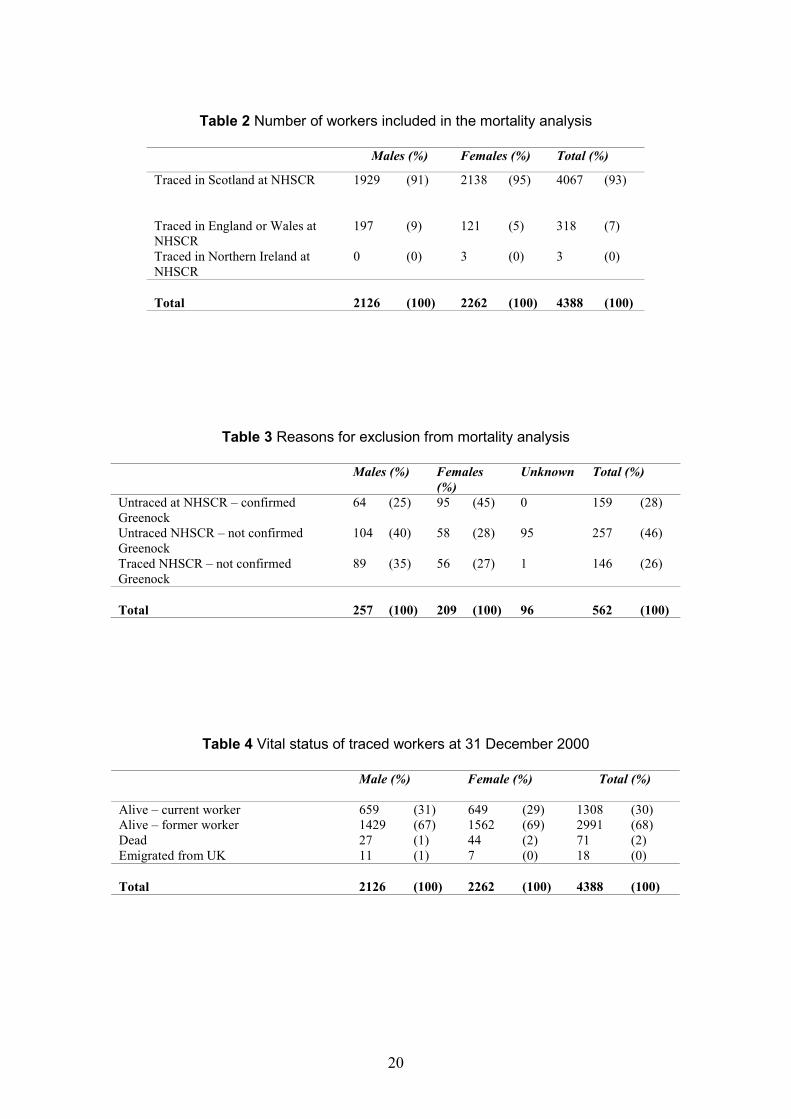
Table 2 Number of workers included in the mortality analysis
Males (%) Females (%) Total (%)
Traced in Scotland at NHSCR 1929 (91) 2138 (95) 4067 (93)
Traced in England or Wales at 197 (9) 121 (5) 318 (7) NHSCRTraced in Northern Ireland at 0 (0) 3 (0) 3 (0) NHSCR
Total 2126 (100) 2262 (100) 4388 (100)
Table 3 Reasons for exclusion from mortality analysis
Males (%) Females Unknown Total (%) (%)
Untraced at NHSCR – confirmed 64 (25) 95 (45) 0 159 (28) GreenockUntraced NHSCR – not confirmed 104 (40) 58 (28) 95 257 (46) GreenockTraced NHSCR – not confirmed 89 (35) 56 (27) 1 146 (26) Greenock
Total 257 (100) 209 (100) 96 562 (100)
Table 4 Vital status of traced workers at 31 December 2000
Male (%) Female (%) Total (%)
Alive – current worker 659 (31) 649 (29) 1308 (30) Alive – former worker 1429 (67) 1562 (69) 2991 (68) Dead 27 (1) 44 (2) 71 (2) Emigrated from UK 11 (1) 7 (0) 18 (0)
Total 2126 (100) 2262 (100) 4388 (100)
20

Table 5 Distribution of age at first hire by sex
Age Group Male (%) Female (%) Total (%)
15-19 401 (19) 404 (18) 805 (18) 20-24 723 (34) 624 (28) 1347 (31) 25-29 434 (20) 505 (22) 939 (21) 30-34 273 (13) 324 (14) 597 (14) 35-39 137 (6) 218 (10) 355 (8) 40-44 85 (4) 125 (6) 210 (5) 45-49 41 (2) 48 (2) 89 (2) 50-54 21 (1) 13 (1) 34 (1) 55-59 10 (0) 1 (1) 11 (0) 60-64 1 (0) 0 (0) 1 (0)
Total 2126 (100) 2262 (100) 4388 (100)
Table 6 Distribution of length of service in years by sex
Length of service (years) Male(%) Female (%) Total (%)
Less than 1 412 (19) 453 (20) 865 (20) 1 to 3 471 (22) 473 (21) 944 (22) 3 to 5 323 (15) 264 (12) 587 (13) 5 to 10 498 (23) 505 (22) 1003 (23) 10 to 20 382 (18) 482 (21) 864 (20) 20 years or more 40 (2) 85 (4) 125 (3)
Total 2126 (100) 2262 (100) 4388 (100)
Table 7 Distribution of work area according to records of pre-employment medical records by sex
Work Area Male (%) Female (%) Total (%)
Fabrication 1081 (51) 1793 (79) 2874 (66)
Non-fabrication 1045 (49) 469 (21) 1514 (34)
Total 2126 (100) 2262 (100) 4388 (100)
21

Table 8 Distribution of deaths and cancers registrations for those events included in the main analyses
Deaths Cancer Registrations Disease Group (ICD9) Male Female Total Male Female Total
All malignant neoplasms (140-208) - Malignant neoplasms of the lip, oral cavity and pharynx (140-149)
- Malignant neoplasms of the digestive organs and peritoneum (150-159)
- Malignant neoplasm of the stomach (151)
- Malignant neoplasms of the respiratory and intrathoracic organs (160-165)
- Malignant neoplasm of the trachea, bronchus and lung (162)
- Malignant neoplasm of the pleura (163)
- Malignant melanomas of the skin (172)
- Other malignant neoplasms of the skin (173)
- Malignant neoplasms of the female breast (174)
- Malignant neoplasms of genitourinary organs (179-189) - Malignant neoplasms of uterus (179, 182)
- Malignant neoplasms of lymphatic and haemotopoietic tissue (200-208)
- Multiple myeloma (203) - Leukaemia (204-208)
- Leukaemia except chronic lymphatic leukaemia (204.0, 204.2-208)
- Other malignant neoplasms (170-171, 175, 190-192, 194199)
Benign neoplasms (210-229)
Carcinomas in situ (230-234)
Neoplasms of uncertain behaviour or unspecified nature(235-239)
Diseases of the blood or blood forming organs (280-289)
Diseases of the circulatory system (390-459)
Diseases of the respiratory system (460-519)
Diseases of the genitourinary system (580-629)
Other Causes (001-139, 240-279, 290-389, 520-579, 630
6 23 29 25 54 79
0 0 0 0 1 1
2 3 5 3 4 7 0 2 2 0 3 3
0 10 10 3 11 14
0 10 10 2 11 13 0 0 0 0 0 0
0 1 1 2 2 4
0 0 0 4 6 10
- 4 4 - 20 20
0 2 2 5 7 12 - 0 0 - 1 1
1 2 3 3 3 6 0 0 0 0 1 1
0 1 1
0 0 0 0 1 1
0 1 1
3 1 4 5 0 5
0 0 0 0 0 0
0 0 0 0 47 47
0 0 0
0 0 0
10 5 15
1 4 5
0 1 1
0 1 1
- - -
- - -
- - -
- - -
10 11 21 - - -999)
ALL CAUSES (001-999) 27 44 71 25 102 127
22

Table 9 Male mortality by disease group: numbers of deaths and SMRs with and without Carstairs adjustment
Disease group Total No Unadjusted Adjusted (a) of Cases SMR (95% CI) SMR (95% CI)
All causes 27 46** (30 to 67) 40** (27 to 59)
All malignant neoplasms 6 51 (19 to 111) 47 (17 to 102)
Malignant neoplasms of the lip, oral cavity and pharynx 0 0 (0 to 880) 0 (0 to 682)
Malignant neoplasms of the digestive organs and peritoneum 2 60 (7 to 218) 57 (7 to 205) - Malignant neoplasms of the stomach 0 0 (0 to 608) 0 (0 to 550)
Malignant neoplasms of respiratory and intrathoracic organs 0 0 (0 to 106) 0* (0 to 90) - Malignant neoplasm of the trachea, bronchus and lung 0 0 (0 to 114) 0* (0 to 97) - Malignant neoplasms of the pleura 0 0 (0 to 4622) 0 (0 to 4464)
Malignant neoplasms of the genitourinary organs 0 0 (0 to 333) 0 (0 to 327)
Malignant melanoma of the skin 0 0 (0 to 1384) 0 (0 to 1488)
Other malignant neoplasms of the skin 0 0 (0 to 9862) 0 (0 to 8039)
Malignant neoplasm of the thyroid gland 0 0 (0 to 16143) 0 (0 to 16712)
Malignant neoplasms of the lymphatic and haematopoietic tissue 1 81 (2 to 453) 82 (2 to 459) - Multiple myeloma 0 0 (0 to 3576) 0 (0 to 3756) - Leukaemia 0 0 (0 to 824) 0 (0 to 812) - Leukaemia excluding chronic lymphatic leukaemia 0 0 (0 to 919) 0 (0 to 900)
Benign neoplasms 0 0 (0 to 8474) 0 (0 to 8797)
Neoplasms of uncertain or unspecified behaviour neoplasms 0 0 (0 to 3411 0 (0 to 3722)
Diseases of the blood and blood-forming organs 0 0 (0 to 3159) 0 (0 to 2828)
Diseases of the circulatory system 10 62 (30 to 114) 55 (26 to 101)
Diseases of the respiratory system 1 35 (1 to 196) 29 (1 to 160)
Diseases of the genitourinary system 0 0 (0 to 1248) 0 (0 to 1116)
Footnotes: (a) Adjusted results are those adjusted according to the Carstairs index of deprivation, as described in Appendix 9. ** indicates statistical significance at the 2-sided 1% level of significance * indicates statistical significance at the 2-sided 5% level of significance
23

Table 10 Female mortality by disease group: numbers of deaths and SMRs with and without Carstairs adjustment
Disease group Total No Unadjusted SMR Adjusted(a) of Cases (95% CI) SMR (95% CI)
All causes 44 92 (67 to 123) 75 (54 to 101)
All malignant neoplasms 23 120 (76 to 180) 110 (69 to 164)
Malignant neoplasms of the lip, oral cavity and pharynx 0 0 (0 to 1722) 0 (0 to 1677)
Malignant neoplasms of the digestive organs and peritoneum 3 92 (19 to 268) 88 (18 to 256) - Malignant neoplasms of the stomach 2 371 (45 to 1342) 327 (40 to 1181)
Malignant neoplasms of respiratory and intrathoracic organs 10 313** (150 to 575) 231* (111 to 425) - Malignant neoplasm of the trachea, bronchus and lung 10 325** (156 to 598) 241* (116 to 444) - Malignant neoplasms of the pleura 0 0 (0 to 17453) 0 (0 to 20449)
Malignant neoplasms of the genitourinary organs 2 60 (7 to 218) 54 (7 to 196)
Malignant melanoma of the skin 1 304 (8 to 1696) 354 (9 to 1973)
Other malignant neoplasms of the skin 0 0 (0 to 11384) 0 (0 to 11993)
Malignant neoplasms of the female breast 4 74 (20 to 191) 74 (20 to 190)
Malignant neoplasms of the uterus 0 0 (0 to 1659) 0 (0 to 1686)
Malignant neoplasm of the thyroid gland 0 0 (0 to 11172) 0 (0 to 8981)
Malignant neoplasms of the lymphatic and haematopoietic tissue 2 150 (18 to 543) 140 (17 to 506) - Multiple myeloma 0 0 (0 to 2647) 0 (0 to 2345) - Leukaemia 1 199 (5 to 1109) 172 (4 to 961) - Leukaemia excl. chronic lymphatic leukaemia 1 207 (5 to 1156) 180 (5 to 1005)
Benign neoplasms 0 0 (0 to 6390) 0 (0 to 5312)
Neoplasms of uncertain or unspecified 0 0 (0 to 3211) 0 (0 to 3042) behaviour neoplasms
Diseases of the blood and blood-forming organs 0 0 (0 to 2652) 0 (0 to 2325)
Diseases of the circulatory system 5 46 (15 to 108) 35** (11 to 81)
Diseases of the respiratory system 4 132 (36 to 337) 94 (26 to 241)
Diseases of the genitourinary system 1 237 (6 to 1321) 182 (5 to 1012) Footnotes: (a) Adjusted results are those adjusted according to the Carstairs index of deprivation, as described in Appendix 9. ** indicates statistical significance at the 2-sided 1% level of significance * indicates statistical significance at the 2-sided 5% level of significance
24
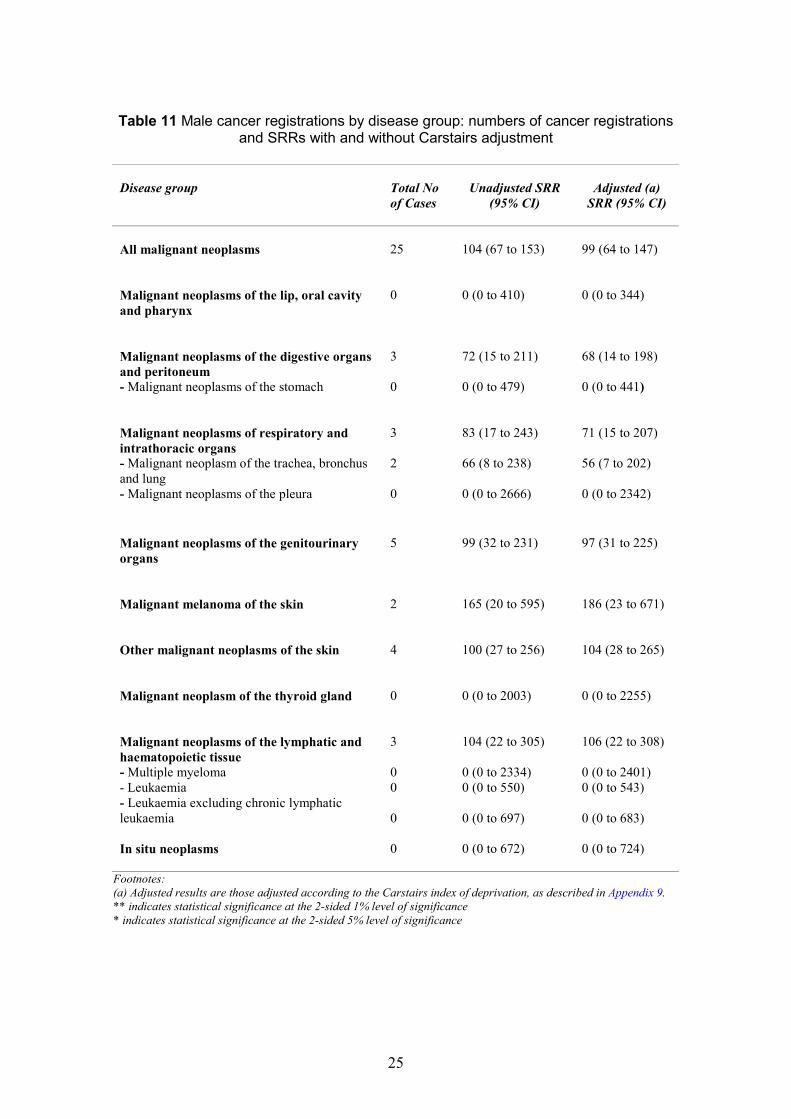
Table 11 Male cancer registrations by disease group: numbers of cancer registrations and SRRs with and without Carstairs adjustment
Disease group Total No Unadjusted SRR Adjusted (a) of Cases (95% CI) SRR (95% CI)
All malignant neoplasms 25 104 (67 to 153) 99 (64 to 147)
Malignant neoplasms of the lip, oral cavity 0 0 (0 to 410) 0 (0 to 344) and pharynx
Malignant neoplasms of the digestive organs 3 72 (15 to 211) 68 (14 to 198) and peritoneum - Malignant neoplasms of the stomach 0 0 (0 to 479) 0 (0 to 441)
Malignant neoplasms of respiratory and 3 83 (17 to 243) 71 (15 to 207) intrathoracic organs - Malignant neoplasm of the trachea, bronchus 2 66 (8 to 238) 56 (7 to 202) and lung - Malignant neoplasms of the pleura 0 0 (0 to 2666) 0 (0 to 2342)
Malignant neoplasms of the genitourinary 5 99 (32 to 231) 97 (31 to 225) organs
Malignant melanoma of the skin 2 165 (20 to 595) 186 (23 to 671)
Other malignant neoplasms of the skin 4 100 (27 to 256) 104 (28 to 265)
Malignant neoplasm of the thyroid gland 0 0 (0 to 2003) 0 (0 to 2255)
Malignant neoplasms of the lymphatic and 3 104 (22 to 305) 106 (22 to 308) haematopoietic tissue - Multiple myeloma 0 0 (0 to 2334) 0 (0 to 2401) - Leukaemia 0 0 (0 to 550) 0 (0 to 543) - Leukaemia excluding chronic lymphatic leukaemia 0 0 (0 to 697) 0 (0 to 683)
In situ neoplasms 0 0 (0 to 672) 0 (0 to 724)
Footnotes: (a) Adjusted results are those adjusted according to the Carstairs index of deprivation, as described in Appendix 9. ** indicates statistical significance at the 2-sided 1% level of significance * indicates statistical significance at the 2-sided 5% level of significance
25

Table 12 Female cancer registrations by disease group: numbers of cancer registrations and SRRs with and without Carstairs adjustment
Disease group Total No Unadjusted SRR Adjusted (a) of Cases (95% CI) SRR (95% CI)
All malignant neoplasms 54
Malignant neoplasms of the lip, oral cavity 1 and pharynx
Malignant neoplasms of the digestive organs 4 and peritoneum - Malignant neoplasms of the stomach
3
Malignant neoplasms of respiratory and 11 intrathoracic organs - Malignant neoplasm of the trachea, bronchus and lung 11 - Malignant neoplasms of the pleura 0
Malignant neoplasms of the genitourinary 7 organs
Malignant melanoma of the skin 2
Other malignant neoplasms of the skin 6
Malignant neoplasms of the female breast 20
Malignant neoplasms of the uterus 1
Malignant neoplasm of the thyroid gland 0
Malignant neoplasms of the lymphatic and 3 haematopoietic tissue - Multiple myeloma 0 - Leukaemia 1 - Leukaemia excluding chronic lymphatic 1 leukaemia
In situ neoplasms 47
111 (84 to 145) 111 (83 to 145)
160 (4 to 890) 143 (4 to 799)
88 (24 to 225) 86 (23 to 220)
491* (101 to 1435) 438 (90 to 1281)
339** (169 to 606) 245* (122 to 438)
373** (186 to 668) 273** (136 to 488) 0 (0 to 10097) 0 (0 to 6809)
72 (29 to 149) 66 (27 to 136)
70 (9 to 253) 88 (11 to 319)
108 (40 to 235) 125 (46 to 272)
125 (76 to 193) 134 (82 to 206)
76 (2 to 426) 74 (2 to 410)
0 (0 to 447) 0 (0 to 577)
107 (22 to 314) 110 (23 to 322)
0 (0 to 1872) 0 (0 to 1795) 139 (4 to 776) 145 (4 to 806) 161 (4 to 899) 167 (4 to 933)
86 (63 to 114) 94 (69 to 125)
Footnotes: (a) Adjusted results are those adjusted according to the Carstairs index of deprivation, as described in Appendix 9. ** indicates statistical significance at the 2-sided 1% level of significance *indicates statistical significance at the 2-sided 5% level of significance
26

��
1982
Table 13 Female lung cancer registrations: numbers and SRRs by latency for selected subgroups
Analysis type Total Latency < 10 years ��Latency 10 years
Total females Unadjusted SRR (95% CI) 373** (186 to 668) 544** (177 to 1270) 296* (109 to 644) No. cases 11 5 6 Adjusted (a) SRR (95% CI) 273** (136 to 488) 390* (127 to 911) 218 (80 to 475)
Females employed < 12 months excluded Unadjusted SRR (95% CI) 325** (148 to 616) 381 (79 to 1113) 302* (111 to 658) No. cases 9 3 6 Adjusted SRR (95% CI) 238* (109 to 451) 273 (56 to 798) 223 (82 to 485)
Females aged < 50 Unadjusted SRR (95% CI) 370* (101 to 946) 500* (103 to 1462) 207 (5 to 1154) No. cases 4 3 1 Adjusted SRR (95% CI) 262 (71 to 671) 355 (73 to 1038) 146 (4 to 816)
Females aged 50 or over Unadjusted SRR (95% CI) 376** (151 to 774) 627 (76 to 2264) 324* (105 to 755) No. cases 7 2 5 Adjusted SRR (95% CI) 279 *(112 to 576) 458 (55 to 1654) 242 (79 to 564)
Females first employed before
Unadjusted SRR (95% CI) 299* (110 to 650) 0 (0 to 963) 369* (135 to 803) No. cases 6 0 6 Adjusted SRR (95% CI) 220 (81 to 479) 0 (0 to 688) 274* (101 to 596)
Females first employed 1982or later Unadjusted SRR (95% CI) 533** (173 to 1244) 933** (303 to 2177) 0 (0 to 918) No. cases 5 5 0 Adjusted SRR (95% CI) 383* (124 to 894) 671** (218 to 1567) 0 (0 to 658)
Females working in fab areas Unadjusted SRR (95% CI) 436** (199 to 827) 743** (241 to 1733) 287 (78 to 735) No. cases 9 5 4 Adjusted SRR (95% CI) 317** (145 to 602) 532** (173 to 1242) 211 (57 to 540)
Females working in non-fab areasUnadjusted SRR (95% CI) 227 (28 to 821) 0 (0 to 1502) 315 (38 to 1139) No. cases 2 0 2 Adjusted SRR (95% CI) 167 (20 to 605) 0 (0 to 1080) 235 (28 to 847)
Footnotes: (a) Adjusted results are those adjusted according to the Carstairs index of deprivation, as described in Appendix 9. * Indicates statistical significance at the (2-sided) 5% level of significance. ** Indicates statistical significance at the (2-sided) 1% level of significance
27

Table 14 Female stomach cancer registrations: numbers and SRRs by latency for selected subgroups
Analysis type Total Latency < 10 years ��Latency �� 10 years
Total females Unadjusted SRR (95% CI) 491* (101 to 1435) 1213**(250 to 3545) 0 (0 to 1015) No. cases 3 3 0 Adjusted (a) SRR (95% CI) 438 (90 to 1281) 1093**(225 to 3193) 0 (0 to 900)
Females employed < 12 months excluded Unadjusted SRR (95% CI) 528* (109 to 1543) 1402**(289 to 4096) 0 (0 to 1041) No. cases 3 3 0 Adjusted SRR (95% CI) 469 (97 to 1371) 1251**(258 to 3657) 0 (0 to 923)
Females aged < 50 Unadjusted SRR (95% CI) 957** (198 to 2797) 1560**(322 to 4560) 0 (0 to 3043) No. cases 3 3 0 Adjusted SRR (95% CI) 884* (182 to 2582) 1416**(292 to 4139) 0 (0 to 2889)
Females aged 50 or over Unadjusted SRR (95% CI) 0 (0 to 1241) 0 (0 to 6698) 0 (0 to 1523) No. cases 0 0 0 Adjusted SRR (95% CI) 0 (0 to 1070) 0 (0 to 5879) 0 (0 to 1308)
Females first employed before 1982 Unadjusted SRR (95% CI) 532 (64 to 1921) 2009**(243 to 7258) 0 (0 to 1334) No. cases 2 2 0 Adjusted SRR (95% CI) 459 (56 to 1657) 1671* (202 to 6038) 0 (0 to 1166)
Females first employed 1982 or later Unadjusted SRR (95% CI) 426 (11 to 2375) 677 (17 to 3770) 0 (0 to 4246) No. cases 1 1 0 Adjusted SRR (95% CI) 403 (10 to 2244) 646 (16 to 3597) 0 (0 to 3949)
Females working in fab areas Unadjusted SRR (95% CI) 457 (55 to 1649) 1076* (130 to 3888) 0 (0 to 1462) No. cases 2 2 0 Adjusted SRR (95% CI) 410 (50 to 1483) 977* (118 to 3530) 0 (0 to 1305)
Females working in non-fab areas Unadjusted SRR (95% CI) 579 (15 to 3226) 1626 (41 to 9060) 0 (0 to 3317) No. cases 1 1 0 Adjusted SRR (95% CI) 508 (13 to 2828) 1431 (36 to 7973) 0 (0 to 2901)
Footnotes: (a) Adjusted results are those adjusted according to the Carstairs index of deprivation, as described in Appendix 9. ** indicates statistical significance at the 2-sided 1% level of significance * indicates statistical significance at the 2-sided 5% level of significance
28

1982
Table 15 Female breast cancer registrations: numbers and SRRs by latency for selected subgroups
Analysis type Total Latency < 10 years Latency ���� 10 years
Total females Unadjusted SRR (95% CI) 125 (76 to 193) 137 (65 to 251) 116 (55 to 212) No. cases 20 10 10 Adjusted (a) SRR (95% CI) 134 (82 to 206) 145 (70 to 267) 124 (59 to 228)
Females employed < 12 months excluded Unadjusted SRR (95% CI) 109 (63 to 178) 96 (35 to 210) 119 (57 to 219) No. cases 16 6 10 Adjusted SRR (95% CI) 117 (67 to 190) 102 (38 to 223) 128 (61 to 235)
Females aged < 50 Unadjusted SRR (95% CI) No. casesAdjusted SRR (95% CI)
Females aged 50 or over Unadjusted SRR (95% CI) No. casesAdjusted SRR (95% CI)
93 (45 to 171) 10 99 (48 to 182)
191 (92 to 351) 10 204 (98 to 375)
112 (45 to 230) 7 118 (48 to 244)
286 (59 to 836) 3 304 (63 to 888)
67 (14 to 196) 3 72 (15 to 210)
167 (67 to 344) 7 179 (72 to 368)
Females first employed before
Unadjusted SRR (95% CI) No. casesAdjusted SRR (95% CI)
Females first employed 1982 or later Unadjusted SRR (95% CI) No. casesAdjusted SRR (95% CI) 206* (115 to 339)
61 (20 to 143) 5 65 (21 to 152)
192* (108 to 317) 15
43 (1 to 239) 1 45 (1 to 251)
180 (82 to 342) 9 192 (88 to 365)
68 (19 to 175) 4 73 (20 to 188)
213 (78 to 465) 6 229 (84 to 498)
Females working in fab areas Unadjusted SRR (95% CI) No. casesAdjusted SRR (95% CI)
Females working in non-fab areas Unadjusted SRR (95% CI) No. casesAdjusted SRR (95% CI)
141 (82 to 226) 17 150 (88 to 241)
77 (16 to 224) 3
139 (60 to 275) 8 148 (64 to 292)
126 (15 to 455) 2
142 (65 to 270) 9 153 (70 to 289)
43 (1 to 239) 1
82 (17 to 238) 134 (16 to 482) 46 (1 to 256) Footnotes: (a) Adjusted results are those adjusted according to the Carstairs index of deprivation, as described in Appendix 9. ** indicates statistical significance at the 2-sided 1% level of significance * indicates statistical significance at the 2-sided 5% level of significance
29

4. DISCUSSION
As stated in the Introduction, the aims of this investigation were limited to establishing the cancer incidence in the workforce of NSUK compared to an appropriate reference population and relating this incidence to any readily available information on individuals’ histories of work in the plant. The aim was to establish some basic facts relatively quickly, and decide whether more extensive investigation would be justified.
This is only the second formal study of mortality or cancer incidence in a semiconductor plant (the other being a study by Sorahan et al., (1985 and 1992)). Despite its limited aims and moderate size, it therefore represents a substantial addition to the available evidence.
4.1 METHODOLOGICAL ISSUES
4.1.1 Lack of information on occupational exposures
In the current investigation, only data readily available on the whole population was used. The only exposure indicator available on this basis was a flag identifying individuals who worked in the fabrication areas. This marker was part of the occupational health records, and was initially created at pre-employment medical on the basis of the individual's initial work assignment. The marker would be updated opportunistically on subsequent contacts with the occupational health department. This is not therefore a completely accurate indicator of fab work, however we understand that it will identify such workers with a fairly high degree of accuracy. Virtually all workers with this marker will have had a period of employment on fabrication work, and most will have spent all their NSUK employment there.
The marker does not of course give specific information about exposure, but does mark those with potential exposure to the wide range of agents characteristic of semiconductor fabrication. On this basis, most women in the cohort (79%) worked in fabrication, and around half (51%) the men. It was accepted that the fab/non-fab classification was not a definitive division into exposed or unexposed to known or suspected carcinogens nor, indeed, into exposed or unexposed to chemicals in general. However the fab group would be expected to have greater potential for exposure to all the chemicals characteristic of the semiconductor manufacturing industry, particularly the photolithography chemicals, the etching agents and the dopants. It would also include those with greater potential for exposure to physical agents such as ultra violet or ionising radiations. Conversely the non-fab group would include all the office or laboratory based staff with little or no potential for chemical exposures.
4.1.2 Lack of information on other factors affecting cancer
As a result of the purposely limited aims of the investigation, it was not possible to acquire data on other possible risk factors, for example, smoking (lung cancer) or age at first pregnancy (breast cancer). This limits what can be concluded on the present data alone. Further investigation via a case control study will be required to clarify any findings of concern.
30
4.1.3 Completeness of and accuracy of personnel data
The completeness and accuracy of personnel data were assessed through internal comparison and by comparing the different sources (see Appendix 6 for details). Briefly, lists of current and past employees were generated from a variety of sources which were then cross-checked with each other. One of the secondary sources identified several hundred individuals who did not appear in the main sources. After investigation it was concluded that these were NSUK workers based at a sales office in Swindon or non-UK nationals who spent some time at the plant on secondment. Only 36% of this group could be traced at the National Health Service Central Register in Edinburgh, and this low trace rate is consistent with there being a high proportion of foreign nationals among them, and implies that the mortality and cancer incidence of the workforce would be more accurately reflected by excluding this group.
4.1.4 Completeness of mortality and cancer registration data
Staff at NSUK have the option of utilising private health care. We made enquiries about the possible effect that such an arrangement might have on the completeness of cancer registration for members of this investigation cohort. We contacted the four hospitals involved in order to clarify their cancer registration policies. We also sought the advice of the SCIU and the former West of Scotland cancer registry. The advice we received suggested that the use of private health care by NSUK staff would be unlikely to affect cancer registration in the cohort, due to the role of the private hospitals in the treatment of cancer (mainly palliative care) (Gillis C and Hole D, personal communications).
It did emerge that there were doubts about the completeness of cancer registration in the Argyll and Inverclyde area compared with the rest of Scotland in the early years of operation of the Greenock factory (Gillis C and Hole D, personal communications). However, most of the cancers in this workforce would be expected after the 1970s and it was concluded that although a potential problem, that this was unlikely to mask any excesses that would otherwise have been found.
At the time of the analyses cancer registrations in England and Wales were complete to the end of 1998 (Quinn M, personal communication) and so for the subjects traced in England and Wales cancer registrations to the end of 1998 were included in the analyses.
Registrations of non-malignant neoplasms (including in situ neoplasms and neoplasms of uncertain behaviour) have not been consistent over time (Brewster D, personal communication). Hence our investigation findings in relation to non-malignant neoplasms should be treated more tentatively that other results relating to malignant neoplasms.
4.1.5 Cohort size and length of follow-up
The investigation cohort is limited in size, and since the factory only began operations in 1970 and did not recruit large numbers until the early 1980s (see Figure 1), the average length of follow-up of 12.5 years is relatively short for a statistical analysis of the type undertaken here. However, our starting point was the concerns about cancer cases expressed by current and former workers at the Greenock factory and our aim was, in the first instance, to establish the facts about cancer incidence in this workforce. The limitations of cohort size and follow-up are unavoidable in this context. It is worth noting that the initial report by Sorahan et al., in 1985 was based on a total expected cancer mortality of 18, compared to the current investigation's 31.
31

4.1.6 Use of Carstairs deprivation index and the Healthy worker effect
The calculation of an expected number of deaths or cancer registrations for a given population must be based on some assumption on what source of baseline reference rates is appropriate. If the National Semiconductor workforce was drawn from across Scotland, and from the full range of socio-economic categories, it would clearly be appropriate to use national Scottish rates to develop the expected values. However, this is not the case. The workforce comes very largely from a particular geographical area, and is likely to have a different socio-economic distribution from that of Scotland as a whole. Mortality and cancer registrations rates are known to vary by area and by socio-economic group. This variation is stronger for some diseases than others. In general, rates are higher in poorer areas and for lower income socio-economic groups, but this tendency is reversed for some diseases (e.g. breast cancer).
The expected numbers in the present analyses have been calculated on two different bases. Firstly, simply using national Scottish rates, and secondly using rates based on the national Scottish data but adjusted to reflect the socio-economic profile of the local area (strictly, the areas of residence of current employees).
The Carstairs index based adjustment does not directly adjust for variation in potential confounding factors such as smoking, diet or reproductive history. However, health outcomes correlate strongly with the index, and although the reasons for this are not fully known, established risk factors such as smoking and diet are known to play an important role. In the original analyses of Carstairs and Morris (1991) the disease group with the strongest correlation with the index was that for smoking related diseases. It is therefore reasonable to consider the adjustment as controlling for the important socio-economic and lifestyle factors, including smoking.
A further advantage of the Carstairs adjustment approach as compared with the use of local rates is that account can be taken of the geographical distribution of the workforce at a more detailed level. The data on the distribution of workforce home addresses by postcode sector shown in appendix 9 show a distinct difference between the women and the men. This difference is reflected in the adjustments applied to the expected values for men and women in this analysis. Use of local rates (say, for Inverclyde), would lose this distinction by implicitly assuming that the men and women in the workforce were drawn equally across the whole of Inverclyde.
A priori therefore, the adjusted data should provide a better basis for assessing the presence of workplace risk, though this still has to be interpreted with the possibility of further distortion from the "Healthy Worker Effect" (HWE – see below) (e.g. Li et al., 1999). Also there remains a possible issue in relation to how appropriate the adjustments made in this investigation are since it is not clear whether the background rate of cancer in this workforce should be thought of as being the same as in the local population. Furthermore, the extent of this could be different for men and women. In any case the adjustment for deprivation does not materially change our conclusions.
A further general tendency that complicates interpretation of mortality or cancer incidence data from working populations is that such populations generally suffer lower disease rates than the population as a whole. There is no mystery in this: people in work are by definition healthy enough to hold a job, while the population as a whole contains people who are not. An effect of the HWE is a tendency for working populations to record lower than average mortality. It is at its strongest in current workers. As time passes, a cohort who all started as current workers will gradually lose their healthy worker advantage and their average health status will tend towards that of the general population. It follows that lower than "expected" mortality will be most
32

clearly seen in the early years of follow up of a working cohort, for example in observations arising within the first ten years from workers' start dates. The HWE is generally most marked for circulatory and respiratory diseases, and has a limited impact on cancer.
The identification of 21 cases of cancer registered before the affected individuals' start dates at NSUK might seem surprising. However, the cancers involved all have good survival rates, and would be compatible with continued employability after diagnosis.
4.2 THE FINDINGS OF THE INVESTIGATION
4.2.1 Overall mortality
Mortality from all causes shows a marked deficit for men, and a lesser deficit for women. The pattern of these deficits by latency is consistent with a healthy worker effect, being rather stronger in observations with a latency less than 10 years than in observations beyond 10 years latency. This healthy worker effect pattern is seen even more clearly in the results for circulatory disease and respiratory disease. There are no indications of concern for nonmalignant causes of death. Since cancer registration gives a more complete picture of cancer incidence than cancer mortality, the rest of this discussion will concentrate on the cancer registration data.
4.2.2 Overall cancer registration
For the purposes of the discussion the findings presented are based on the adjusted SRRs. Both for men and women, the total number of cancers registered was close to the expected number (SRRs of 99 and 111 respectively). Two of the cancer types which were known to be of concern to Phase Two, uterine cancer and leukaemia, were each represented by a single case. The single case of uterine cancer is in line with the 1.4 expected for total uterine cancer. This case was a cancer of the body of the uterus and since such cases form less than half the total of uterine cancer would represent no more than a nominal excess. The leukaemia case was female, and is statistically consistent with the 0.7 expected. There were no leukaemia cases among the men, compared to 0.7 expected. It would therefore seem that concerns about uterine cancer and leukaemia are not borne out by the data.
For five of the eight cancer groups examined because a relevant carcinogen was known to have been present in the workplace (pleura, skin (excluding melanoma), thyroid, multiple myeloma and leukaemia (excluding chronic lymphatic)) there were no findings of note.
4.2.3 Female lung cancer
The excess of lung cancer in women in the cohort is the most striking finding from this investigation. The 11 cases observed are 2.7 times as many as expected, an excess with around a 1 in 300 chance of occurring if the underlying risk for this population was in fact as expected.
In contrast to the raised risk in women, there were only two cases in men, around half as many as expected. To the extent that men and women have distinct occupational profiles in the plant, this difference could indicate a risk arising from work largely occupied by women. We know that around 80% of the women work in fabrication areas, which might suggest a source of risk present in these areas. On the other hand, a substantial proportion of men also work in the
33

fabrication areas, and if this was the source of exposure to a lung carcinogen that generated the excess in the women, one might expect to see at least some sign of an excess in men.
Some of the known carcinogens in use at NSUK are associated with an increased risk of lung cancer in other occupational settings. Further investigation will be needed to assess the extent to which exposure to any of these carcinogens at NSUK is comparable to that in these other settings. In this investigation we have not assessed the extent to which exposures for males and females in fabrication might differ.
It is generally accepted that there is a period of time, usually measured in years, from first exposure to a carcinogenic hazard and the development of clinical disease. This latency period is typically 10 years or more for solid tumours such as lung cancer, though individual cases may arise earlier than this. It is therefore usual to place much more emphasis on observations more than 10 years following first exposure. In this investigation the excess was higher in those cases with less than 10 years latency, which might suggest that the cause of these tumours is more likely to pre-date employment at the plant. Moreover, the observed excess in the observation period beyond 10 years is about half that seen in the shorter latency observations. This is the reverse of the pattern normally expected in the presence of an occupational carcinogen. However, the NSUK plant at Greenock has only been in existence since 1970 and the workforce has expanded considerably from the small numbers present in the earlier years. This means that there is limited potential for observations with a long latency period, particularly in the more recently employed. Furthermore, if a potent carcinogen had been recently introduced into this working environment an effect could only be evident in short latency observations. It is also worth noting that within the group of women who were first employed before 1982 there are no cases of lung cancer with less than 10 year’s latency, and an excess which is just significant for longer latency observations.
Other factors complicate the interpretation of these findings. For example, the relatively high age at hire of the lung cancer cases raises the possibility of relevant exposures prior to employment at NSUK. We have not collected information on smoking habits although smoking behaviour in the cohort would have to be substantially higher than the comparison population to account for a relative risk of the size observed (Axelson, 1989). Part of the socio-economic differentials in health referred to earlier is due to differences in smoking habits, but the lung cancer excess in women persists after adjustment for socio-economic factors.
The interpretation of the lung cancer findings is therefore complex. After careful consideration, we have concluded that we cannot exclude the possibility of some of the observed excess being related to work at the NSUK plant at Greenock.
4.2.4 Female stomach cancer
There is an excess of stomach cancer in this cohort. The three cases observed are 4.4 times as many as expected, an excess with around a 1 in 30 chance of occurring if the underlying stomach cancer risk for this population was in fact as expected.
All three cases occurred in women aged less than fifty and were associated with a latency of between 5 and 10 years. There were no stomach cancer cases in men (0.8 expected). Similar lines of argument based on the contrast between the findings in men and women, and the observation of higher risk at shorter latencies apply to these stomach cancer findings as to the lung cancer findings discussed above. Stomach cancer was selected for study at the outset of the investigation because it was of concern to Phase Two. In this situation where cases have been identified prior to formal investigation statistical significance will tend to be overstated and
34

findings must be interpreted more cautiously. No excess of overall digestive cancer in women was observed.
4.2.5 Female breast cancer
There is a moderate (34 percent, adjusted) excess of breast cancer in the cohort as a whole. The excess is similar in observations within and beyond 10 years latency, and is not statistically significant (p = 0.24); it is reduced when women with less than 12 months’ employment are excluded. The excess appears to be stronger (roughly a doubling) among women aged 50 or over, and those first employed in 1982 or later. The only statistically significant finding is the observation of approximately twice as many cases as expected among women first employed in 1982 or later (SRR = 206, 95% CI 115 to 339, p = 0.016). The SMR for female breast cancer was 74 (4 deaths, 95% CI 20 to 190). There were two further deaths in 2001, after the end of the mortality follow up period.
Breast cancer was selected for study at the outset of the investigation both because it was of concern to Phase Two, and because it is associated with ionising radiation. Therefore the reservations about statistical significance in the previous section still apply, although to a lesser extent. The NSUK occupational health service has on occasions organised breast cancer awareness sessions, and the workforce may have a higher than average level of participation in breast cancer screening. This raises the possibility of a slightly raised SRR due to earlier detection. Levels of risk in the small number of women not employed in fabrication are consistent with expected numbers.
Breast cancer risk is strongly modified by hormonal factors and by reproductive history. Early pregnancy and breast feeding are associated with lower risk; early menarche, late menopause and not having children higher risk. The influence of these factors on the breast cancer findings in this investigation are unknown.
Several recent papers have suggested a role for shiftwork in breast cancer (Davis et al., 2001, Schernhammer et al., 2001, Hansen 2001). The proposed mechanism is the suppression of melatonin levels produced by exposure to light at night. This hypothesis has not been fully evaluated, but has some biological plausibility, and epidemiological support. Since shiftwork is widespread in the NSUK workforce, it is possible that this is relevant to the observed excess. If shiftworking was less common before 1982, the contrast in risk by date of start could be explained.
4.2.6 Brain cancer
Brain cancer was not one of the cancer categories selected for study in this investigation. However, tabulation of all the ascertained cases (Table 8) revealed four such cases among men, which from an informal assessment of expected numbers seemed to be clearly excessive. We had not requested brain cancer registration data from ISD, and were therefore not able to calculate an exact SRR, however we already had the relevant mortality data and the three fatal brain cancer cases represented an observed number of cases approximate four times that expected (p = 0.08).
The cases had latencies of 2, 3, 6 and 11 years respectively. There were no cases of brain cancer among women (approximately 0.7 expected).
35

In the context of a moderately large number of different end points examined in this investigation, the post hoc nature of the finding together with the short latencies of three of the four cases it seems reasonable to see this result as more likely to be due to chance than a consequence of work at the plant.
4.2.7 Malignant melanoma
One final point worth noting from the male cancer registration analysis is a small nonsignificant excess of skin melanoma (2 observed, 1.1 expected, p > 0.5). Although this is far from statistically significant, it reflects the results from the initial investigation by Sorahan at a factory in the West Midlands (Sorahan et al., 1985 and 1992), which was motivated by the investigation of a cluster of melanoma at the factory. The excess was close to statistically significant in the initial study (3 observed, 0.68 expected, p = 0.064), but had reduced substantially with further follow up (3 observed, 1.5 expected, p > 0.5).
Cancer registrations for melanoma in women are in line with expected values (2 observed, 2.3 expected, p = 0.39). On the basis of these data, melanoma does not appear to be a concern.
36

5. CONCLUSIONS
All-cause mortality for women in the NSUK workforce was slightly below expected levels, mortality for men was substantially below expected levels. Total cancer registrations were close to expected levels for men and for women. Four specific cancers showed findings which raised concern, and which will require further investigation.
There are approximately 2 to 3 times more cases than expected of female lung cancer, based on 11 cases, a finding that is statistically significant. Some aspects of the data, such as the marked excess in observations less than 10 years from dates of start, raise questions about the likelihood that the observed excess is due to workplace factors. More detailed information is required to clarify this key question. The present data suggest the possibility, but do not prove, that some of the excess may be related to work at the NSUK plant at Greenock.
There are approximately four to five times more cases than expected of female stomach cancers. This is based on only three cases. Although based on small numbers this finding is of borderline statistical significance. As for the lung cancer finding, there is some evidence that argues against a workplace explanation for this finding, but the evidence is inconclusive. Therefore there remains the possibility of some of this excess being related to work at the NSUK plant at Greenock.
The female breast cancer excess of approximately 30% above expected is much smaller than that for lung and stomach cancer, although based on a larger number of cases (20). However this moderate overall excess is concentrated in women first employed in 1982 or later, among whom there were twice as many cases observed as expected, a result which is just statistically significant. More detailed examination of the cases’ work histories is required before more definite conclusions can be drawn.
There are approximately four times as many male brain cancers as expected, based on three fatal cases. There was also an additional non-fatal case. In view of the fact that brain cancer was not of specific interest at the outset of the investigation and the short latency for three of the four cases, it is most probably not work-related. However, the lack of knowledge in relation to the causes of brain cancer, means that the possibility of a work-related explanation cannot be entirely ruled out.
None of the other cancers of interest at the outset of the investigation, either because of the known or suspected carcinogens that are or have been present at the Greenock factory or because of the known concerns of the local worker support group Phase Two have so far shown any evidence of important excesses that might be associated with work at the factory.
These findings, though inconclusive, reinforce the concerns that prompted our investigation. The findings, particularly those relating to lung cancer, need to be treated very seriously. They raise the possibility of a work-related risk of cancer, but more detailed studies will be needed to clarify this.
37
6. RECOMMENDATIONS FOR FURTHER INVESTIGATION AND RESEARCH
Case ascertainment for the present investigation should be kept open, and a further examination of the cancer experience of current and former NSUK workers should be conducted at an appropriate point in the future when the mean length of follow-up allows a better assessment of overall cancer experience, particularly for some of the longer latency cancers.
An NSUK plant based case-control study should be urgently established which examines historical exposures of the cases and their associated controls (including an in-depth assessment of past occupational exposures to known or suspected carcinogens) together with such assessments as are possible of alternative explanations (e.g. lifestyle factors). The primary focus should be lung and stomach cancer (both sexes), but female breast cancer and brain cancer could be conveniently examined at the same time and it is recommended that this be done.
There is a need for a wider industry investigation along the lines of the present investigation, so that the overall cancer experience of all workers in the industry can be characterised.
The need for further study thereafter will depend on the outcomes of the NSUK based case-control study, and any industry-wide cohort studies that are undertaken.
38

7. REFERENCES
Axelson O (1989). ‘Confounding from smoking in occupational epidemiology’ [editorial]. British Journal of Industrial Medicine 46: 505-507.
Bailar JC III, Bobak M, Fowler B, Harris JA, Hay A, LaDou J, Maltoni C, Silberschmidt M, Teitelbaum D, Watterson A, Woolfson C, and Wright W (2000a). ‘Reply to: rebuttal from the Health and Safety Executive’ [letter]. International Journal of Occupational and Environmental Health 6: 262.
Bailar JC III, Bobak M, Fowler B, Hay A, LaDou J, Maltoni C, Teitelbaum DT, Watterson A, and Woolfson (2000b). ‘Open letter to the Health and Safety Executive’ [Editorial]. International Journal of Occupational and Environmental Health 6: 71-2.
Black RJ, Sharp L, Finlayson AR and Harkness EF (1994). ‘Cancer incidence in a population potentially exposed to radium-226 at Dalgety Bay, Scotland.’ British Journal of Cancer 69: 140-143.
Carstairs V and Morris R (1991). ‘Deprivation and Health in Scotland’. Aberdeen University Press, Aberdeen.
Davis S, Mirch DK and Stevens RG (2001). ‘Shift work, light at night and risk of breast cancer’. Journal of the National Cancer Institute 93: 1557-1562.
Elliott RC, Jones JR, McElvenny DM, Pennington MJ, Northage C, Clegg TA, Clarke SD, Hodgson JT and Osman J (1999). ‘Spontaneous abortion in the British semiconductor industry: an HSE investigation’. American Journal of Industrial Medicine 36: 557-572.
Hansen J (2001). ‘Increased breast cancer risk among women who work predominantly at night’. Epidemiology 12: 74-77.
Li CY and Sung FC (1999). ‘A review of the healthy worker effect in occupational epidemiology’. Occupational Medicine 49: 225-229.
Marsh GM, Youk AO, Sefcik ST and Alcorn CW (1998). ‘OCMAP-PLUS v3.09 (Beta v1.0) Technical Notes. Draft July 6, 1999. University of Pittsburgh , Pittsburgh, PA, USA.
McCourt J and Morrison G (2001). ‘Phase Two responds to the HSE request’ [letter]. International Journal of Occupational and Environmental Health 7: 73-74.
McElvenny DM, Osman J, Hodgson JT and Elliott RC (2000). ‘Rebuttal from the Health and Safety Executive’. International Journal of Occupational and Environmental Health 6: 261-2.
National Semiconductor (1995). Chemical & Radiation Safety handbook. Employee Safety Series (5th Edition). National Semiconductor, Sunnyvale, CA, USA.
Schernhammer ES, Laden F, Sperzer FE, Willett WC, Hunter DJ, Kawachi I and Colditz GA (2001). ‘Rotating night shifts and risk of breast cancer in women participating in the Nurses’ Health Study’. Journal of the National Cancer Institute 93: 1563-1568.
39

Sorahan T, Waterhouse JAH, McKiernen MJ, and Aston RHR (1985). ‘Cancer incidence and cancer mortality in a cohort of semiconductor workers’. British Journal of Industrial Medicine 42: 546-550.
Sorahan T, Pope DJ, and McKiernen MJ (1992). ‘Cancer incidence and cancer mortality in a cohort of semiconductor workers: an update’. British Journal of Industrial Medicine 49: 215216.
SPSS (1999). SPSS Base 10.0 User’s Guide. SPSS Inc, Chicago, IL, USA.
Swerdlow AJ, dos Santos Silva I, Reid A, Brewster DH and Arrundale J (1998). ‘Trends in cancer incidence and mortality in Scotland: description and possible explanations’. British Journal of Cancer 77 (Supplement 3): 1-16.
World Health Organisation (1967). Manual of the International Statistical Classification of Diseases, Injuries and Causes of Death, Eighth Revision. World Health Organisation, Geneva, Switzerland.
World Health Organisation (1977). Manual of the International Statistical Classification of Diseases, Injuries and Causes of Death, Ninth Revision. World Health Organisation, Geneva, Switzerland.
World Health Organisation (1992). Manual of the International Statistical Classification of Diseases, Injuries and Causes of Death, Tenth Revision. World Health Organisation, Geneva, Switzerland.
40
APPENDIX 1 – PROTOCOL FOR THE INVESTIGATION
PROTOCOL FOR THE INVESTIGATION OF CANCER AMONG THE CURRENT AND FORMER EMPLOYEES OF NATIONAL SEMICONDUCTORS (UK) LTD.,
GREENOCK
Epidemiology and Medical Statistics Unit Health and Safety Executive
United Kingdom
November 1999
41

1. INTRODUCTION AND MOTIVATION
Concerns have been voiced by local campaigners about the possibility of cancers arising from employment in current and former employees at National Semiconductor (UK) Ltd., Greenock (NSUK).
Although the Health and Safety Executive (HSE) has no epidemiological evidence for the existence of an increased risk of cancer incidence or mortality in the semiconductor industry or at NSUK, these concerns have prompted HSE to investigate the cancer experience of the NSUK workforce. The investigation will be carried out by the staff of HSE's Epidemiology and Medical Statistics Unit (EMSU).
2. OVERVIEW OF THE INVESTIGATION
HSE has formed an Independent Steering Committee to oversee the investigation. The Committee will act as scientific peer-reviewers for the investigation. They will agree the protocol at the outset of the investigation, oversee the scientific conduct of the investigation by receiving regular progress and other reports, and will comment on the final report and conclusions of the investigation, before it is finalised.
Personnel information will be obtained from NSUK, for all current and former employees who have ever worked at the site. This information will be used to obtain information on the cancer registration and mortality experience of the employees. Therefore the investigation will be a cohort mortality and morbidity investigation.
In addition to the personnel information, the possibility of employing a crude classification of workers as a surrogate for possible carcinogenic exposures (e.g. office versus factory workers, or work with a particular product) will be further explored with NSUK.
This protocol will be presented to workforce representatives in order to seek the agreement of the workforce for the investigation to proceed. At this point, HSE will issue a press release announcing the intent to undertake the investigation, subject to worker and ethical approval. Coincident with this, a letter will be sent to the campaign group Phase Two requesting a meeting to hear their concerns about cancer in workers at the factory.
A set of a priori hypotheses will be derived at the outset of the investigation. These will be determined from the use of known or suspected carcinogens at NSUK and the concerns of the local campaigners. Groupings based on broad categorisations of cancers will also be examined for evidence of excess cancer mortality or incidence in the cohort.
Standardised Mortality Ratios (SMRs) and Standardised Registration Ratios (SRRs) will be derived from the personnel, cancer registration and mortality data. These statistics essentially provide a measure of the rate of cancer incidence and mortality in the workforce compared with that of a comparison population. Comparisons will be made on two bases: first using the national Scottish rates and secondly using rates adjusted to allow for differences in cancer rates between the Greenock area and Scotland as a whole.
Some excesses may occur due to chance. If any epidemiological important findings based on investigation outcomes and work histories are identified recommendations will be made about their further assessment in relation to possible occupational exposures. This could involve for example clarification of further information about the cancer cases, further analysis by the conduct of further epidemiological investigation of workers at the Greenock site, or possibly a
42

full-scale epidemiological investigation of the whole of the UK industry. What constitutes an "epidemiologically important" finding cannot be exactly defined in advance. It involves a judgment based on the findings as a whole. Aspects of the results which will tend to increase epidemiological importance are: size of excess (relative risk); number of cases; adequate latency; similarity of cancer types and similarity of exposure potential.
Any results and recommendations for further investigation will be presented to the workforce in advance of any press announcements or publications in relation to the investigation.
3. ACQUISITION OF PERSONNEL DATA
A computer spreadsheet was received from NSUK in early May 1999 (covering letter dated 30 April 1999). The file contained 4857 records of information relating to current and former employees. Employees began working on the site in 1970. The data items supplied comprised surname, maiden name (where known), date of birth, start date, leave date, National Insurance (NI) number and whether deceased (where known) from employee records. A code relating to the sex of the employee will be added to the data set.
These data contain some information for all workers who have worked at the site and was compiled from records contained in the Occupational Health, Human Resources and Payroll departments. The data were validated by EMSU staff and a set of queries relating to invalidly formatted, missing and inconsistent data items was sent to NSUK on 8 July 1999. The results of these queries were received on 9 September 1999 and are in the processed of being assessed. Any outstanding queries will be referred back to NSUK, if appropriate, as soon as possible.
The intention is that the personnel data be collected as rigorously as possible. Thus if the outcome of this investigation indicated a more detailed epidemiological investigation was required, then the data collection exercise for the personnel data (that allow the determination of person-years at risk and the flagging of workers for death and cancer registration data) should not need to be repeated. The number of individuals on the data set is now confirmed by NSUK as being complete back to the beginning of operations on the Greenock site. NSUK have confirmed that information from the occupational pension scheme was also used to confirm the completeness of the data set in terms of personnel. Additional validation of the completeness of the personnel data will be made by HSE in conjunction with NSUK. Included within this will be a 10% check of the NSUK sources of personnel data against the data set supplied. The results of this check will be made available to the Steering Committee.
4. OTHER INFORMATION TO BE OBTAINED FROM NSUK AT THE OUTSET OF THE INVESTIGATION
Information has been received from NSUK about use of known or suspected carcinogens at the Greenock site since 1970. If feasible, additional information will be sought by HSE in relation to how workers could potentially be classified as possibly exposed or not to these carcinogens (e.g. office worker versus production worker, product production, cost centre etc.), although it is understood that this may not be possible for all employees. With the agreement of NSUK, EMSU staff will examine records held by NSUK to the extent that they can be used as a crude surrogate of potential exposure to known or suspected carcinogens which have been used at the Greenock site. A report of these activities will be made available to the Steering Committee.
The level of information relating to the postcodes for the last known addresses of current and former employees will be explored with NSUK. If suitable, this information will help in the
43

adjustment of the cancer statistics in relation to the geographical area of Scotland in which the plant is based.
5. FORMATION OF A STEERING COMMITTEE FOR THE INVESTIGATION
EMSU has now appointed a Steering Committee to oversee the scientific conduct of the investigation. The membership of the committee with their specialty is as follows:
Dr. Raymond Agius - Occupational Medicine (University of Edinburgh) Prof. Freda Alexander - Statistics and Epidemiology (University of Edinburgh) Dr. Lewis Reay - Public Health Medicine (Argyll and Clyde Health Board)
The first responsibility for the Committee will be to approve the investigation protocol. The Committee will also be provided with monthly reports of investigation progress, and any other reports that they may request during the course of the investigation. Once the statistical assessment of the cancer experience of the NSUK workforce has been completed, their advice will be sought on whether the results indicate any work-related risks and whether further epidemiological investigation is merited. They will also be asked to peer-review the report of the investigation. HSE will take the final responsibility for the conduct of the investigation, the interpretation of the findings and recommendations for further investigation. The Committee will not be expected to advise on specific action in the workplace, since this is a matter for HSE.
6. WORKER PRESENTATION AND FLAGGING OF WORKERS FOR DEATHS AND CANCER REGISTRATIONS
Once the protocol for the investigation has been agreed by the Steering Committee, it will be presented to the management and workforce representatives of the NSUK workforce. Approval for the proposed investigation will then be sought. HSE will prepare a single page leaflet explaining the investigation for distribution to the workforce. Details of a HSE contact number for any confidential queries will be placed in the leaflet. The mode for informing former workers will be agreed with NSUK in advance of the presentation. Possibilities to include placing an advert in the local newspaper, announcing the investigation.
A copy of the agreed investigation protocol, together with the appropriate completed application form, will be forwarded to GRO(S) and ISD to enable clearance for the investigation to be obtained from there shared Privacy Advisory Committee.
The advice of the Scottish Medical Research Ethics Committee will be sought regarding whether central and/or local ethical approval (Argyll and Clyde and possibly Ayrshire and Arran) is required for the investigation.
7. DISEASE GROUPING AND ADDRESSING THE CONCERNS OF THE CAMPAIGNERS
It is not EMSU's intention to compare the cancer rates for every type of cancer that has occurred amongst current and former employees. This is for purely statistical reasons. If there were no real difference in the cancer rates of NSUK with that of the comparison population, then for every 20 comparisons made, at the usual two-sided 5% significance level, one statistically significantly difference between the cancer rate in the Greenock current and former workers and
44

the comparison population could arise purely as a result of chance. It is important too minimise the number of potentially raised SMRs or SRRs which are spurious or due to chance.
Broad disease groupings will be used in a hypothesis generating sense. These are based broadly on the chapters of the ninth revision of the international classification of diseases. They are as follows:
Disease (ICD9)
All Causes (001-999) All malignant neoplasms (140-208) Malignant neoplasm of the lip, oral cavity and pharynx (140-149) Malignant neoplasm of digestive organs and peritoneum (150-159) Malignant neoplasm of respiratory and intrathoracic organs (160-165) Malignant neoplasm of other genitourinary organs (179-189) Malignant neoplasm of the lymphatic and haematopoietic tissue (200-208) Non-malignant neoplasms (210-239) Diseases of the blood and blood forming organs (280-319) Diseases of the circulatory system (390-392) Diseases of the respiratory system (460-519) Diseases of the genitourinary system (580-589)
Specific cancer groups based on the known or suspected carcinogens which have been used atthe factory will be used to test the hypotheses that those cancers are in excess. They are asfollows:
Disease (ICD9)
Malignant neoplasm of the trachea, bronchus and lung (162) Malignant neoplasm of the pleura (163) Malignant melanoma of the skin (172) Other malignant neoplasm of skin (173) Malignant neoplasm of the female breast (174) Malignant neoplasm of the thyroid gland (193) Leukaemia except chronic lymphatic leukaemia (204.0, 204.2-208) Multiple myeloma (203)
In addition those cancers not already included in 7.3 which are the concern of the campaigngroup Phase Two will be tested in the analysis. These are:
Disease (ICD9)
Malignant neoplasm of the stomach (151) Malignant neoplasm of the uterus (179, 182) Leukaemia (204-208)
Phase Two will also be asked if they would be willing to supply a list of cancer cases which are known to them. Any cases thus identified will be used as an informal check against completeness of personnel information, cancer case ascertainment, and accuracy of diagnosis. Areas of concern at the plant will also be pursued, although NSUK will be the only source of occupational data used in the formal cancer investigation. A report on the meeting with Phase Two will be made available to the Steering Committee.
45
8. FLAGGING THE NSUK WORKERS
Once ethical approval for the HSE investigation has been obtained a data set will submitted to the GRO(S) in the appropriate computer format, including an HSE derived unique investigation number for each individual. This will enable a computer match of people on the NSUK data file with the NHSCR to be made thus identifying those individuals associated with a cancer registration and those who have died. Once GRO(S) have completed their matching against the NHSCR, the data set will be forwarded to ISD to see if additional cancer registrations or any diagnostic changes should be reflected in the data. Those workers who could not be computer matched will be traced manually by GRO(S) staff. Should the number of NSUK workers remaining untraced be nontrivial, consideration will be given to utilising NI numbers to obtain fact and date of death information from Mortality Investigation facility offered by the Benefits Agency. A request for them to allow this in principle has been lodged and we await the outcome. Those workers found to have died via this route will then be referred back to GRO(S) to see if cause of death can be obtained.
9. COMPARISON POPULATIONS
The death and cancer registration experience of the NSUK workforce will be compared to that for Scotland as a whole. Comparison will be made for the years 1970 to the latest year for which death and cancer data are available and thought to be relatively complete. This is currently 1996 for cancer registrations and 1998 for mortality. Consideration to extending these by a further year will be assessed on the basis of the availability of the extra information at the time of the statistical analysis. Any Scottish national cancer registration data not already held by EMSU will be obtained from ISD.
Local populations have been determined as too small in number to provide a statistically stable comparison population. This is particularly so for rarer causes of death. The approach adopted in this investigation will therefore be to adjust the Scottish national cancer registration and mortality rates by using the Carstairs deprivation index. This will involve deriving weighting factors for the above set of diseases, based on census data at the postcode sector level (based on the last known address of current and former NSUK workers). In effect the cancer rates in the NSUK workforce will be compared to those of all Scottish areas similar to Greenock.
10. STATISTICAL ASSESSMENT OF CANCER AT NSUK
The cancer and cancer mortality experience at NSUK will be examined by calculating SMRs and SRRs (indirectly standardised for age, sex and calendar year) f or the broad disease groupings, for those cancers associated with the known or suspected carcinogens which have been used at the Greenock site, and those which are of concern to Phase Two. SMRs and SRRs and their 95% confidence intervals will be calculated in relation to national Scottish population with and without adjustment for the Carstairs index of deprivation. Deaths found to have taken place in England and Wales (preliminary indications are that this could be as high as 10% of deaths) will be included in the analysis. Analyses of cancer registrations however will be censored at point of transfer to England and Wales if after 1992, since cancer registrations for England and Wales are regarded as complete only to the end of 1992.
Where the data permit, e.g. the numbers are not too small, additional subanalyses will be carried out as follows:
46

a) SMRs and SRRs broken down by 10- (or, if possible 5-) year groupings for calendar year (to investigate trends over time).
b) SMRs and SRRs broken down by 10- (or, if possible 5-) year grouping for length of time in years since start of (first) employment (to investigate latency effects).
c) SMRs and SRRs broken down by 10- (or, if possible 5-) year grouping for duration of employment (to investigate trends with length of exposure).
d) SMRs and SRRs cross tabulated by latency and employment duration.
e) SMRs and SRRs for subgroups with similar exposure potential (depends on identifying usable surrogates of exposure potential).
f) Sensitivity analyses, including SMRs and SRRs, but workers with less than 12 month's total employment will be excluded (excludes those cancers less likely to be work-related). In studies of male workers, short-term workers have often produced anomalous results, generally ascribed to lifestyle differences. It is not clear whether similar effects apply to women - whose work patterns are different).
Should any of the analyses result in an important excess after examination of outcomes and work history information, then further exposure assessments may be sought. This will be for specific individuals associated with the excess and beyond that determined to be readily available at the outset of the investigation. This could involve the use of assessments made by HSE hygienists, if found to be feasible (care will be taken to preserve confidentiality of cases by mixing real cases and any controls with dummy ones). If the data permit, an analysis via an internal comparison of cancer rates in the `exposed' and `unexposed' workers will be undertaken. Should this result in a credible explanation for an excess, then HSE will consider the need for a fuller epidemiological investigation of cancer in the UK semiconductor industry.
11. REPORT PRODUCTION AND DISSEMINATION OF RESULTS
A presentation of the results of the investigation together with a written report will be made available to NSUK management and workforce representatives prior to publication of the report. At the same time a summary leaflet explaining the results of the investigation will be made available to the workforce. The report and worker-leaflet will be peer-reviewed by the Steering Committee prior to release.
The HSE report of the results of the investigation will be made public once the NSUK management and workforce have been made aware of the findings.
12. PROTOCOL MODIFICATIONS
All modifications to this protocol once it has been initially agreed by the Steering Committee will be documented within the protocol, and will be drawn to the Committee's attention.
47

APPENDIX 2 – WORKER LEAFLET ANNOUNCING THE INVESTIGATION
NATIONAL SEMICONDUCTOR UK’S GREENOCK PLANT PROPOSED INVESTIGATION BY THE HEALTH AND SAFETY EXECUTIVE (HSE)
WHAT IS THIS ALL ABOUT?
Some people, including some ex-employees of National Semiconductor UK (NSUK), believe that working in the Company’s Greenock plant has caused cancer to develop in some members of the work force.
Currently there is no scientific evidence that working in the semiconductor industry is associated with an increased risk of cancer. However, we do know some chemicals used at the plant could cause cancer if they are not used properly and according to the law.
HSE would like to undertake an investigation of cancer in people who work at the plant to see if we can get a clearer picture. We want to include past employees in the investigation too.
HOW WOULD HSE DO ITS INVESTIGATION?
HSE would use standard scientific methods to carry out its investigation. An independent panel of Scottish health experts will monitor our work. We will also obtain the approval of the appropriate Scottish medical research ethics committee.
HSE would obtain information from the National Health Service Central Register (NHSCR) for anyone who has worked at the Greenock plant since it started operations in 1970. Records at NHSCR can identify whether anyone in the work force has died, and if so, the cause of their death. The records can also show whether someone who is still alive has ever had cancer.
HSE would then compare the number of cancers in NSUK employees with the number in people from similar backgrounds in the Scottish population. This should show whether or not NSUK employees are more likely than other people to suffer from cancer.
Before starting this work, HSE would ask local interest groups to identify the types of cancers about which they are concerned so that their concerns can be addressed by the investigation.
HOW DOES THIS AFFECT ME?
The health information that we would need for this investigation is available from records already kept about you. We would not be speaking to you personally, or asking you any
48

questions about your health. You need do nothing if you are willing to participate in the investigation.
Only a small number of the investigating team would see the records, which will otherwise remain strictly confidential. No health details will be shown to your employers.
To be allowed to use the NHSCR records HSE would need to demonstrate that employees of NSUK had been properly consulted about the proposed investigation.
To do this HSE will provide current and ex-employees with a copy of this leaflet. A detailed statement of what HSE would like to do will also be available on the Greenock site. We will hold meetings at the Greenock site to speak to as many workers as possible about the investigation and give them an opportunity to ask questions.
For those who would prefer to raise any questions or concerns in private a contact address and phone number is given at the end of this leaflet.
You can have a say in what is done with your health records. If anyone, including ex-employees, wants to let HSE know of any worries they might have about being included in the investigation they can write or phone the contact given below.
We will respect their worries and like everything else about individual people HSE will keep this confidential.
Of course the more records examined the more accurate the final picture is likely to be.
WHEN AND HOW WILL I HEAR ABOUT THE RESULTS?
We think the investigation will take about one year to complete once it has started.
HSE will report the findings to employees before they are made public and will do what we can to make sure that ex-employees hear directly from us as well. We will provide everyone with a summary leaflet, and a copy of a detailed report will be made available for employees to look at as well.
We will make our findings public and listen to any comments made by other experts.
All the information in these documents will be made anonymous to avoid giving away any personal information about individual employees.
The panel of health experts monitoring our work will see and comment on these documents as they are prepared.
We will show these documents to the managers of the Greenock plant shortly before they are printed - but only so they can check that anything we say about the operation of the plant or information they have supplied to HSE is accurate.
49
WHAT IF HSE DOES FIND SOME CANCERS ARE MORE COMMON IN NATIONAL SEMICONDUCTOR UK EMPLOYEES?
Further work might be necessary to identify the cause of any problem and whether it is related to current or past activity at the plant. We would discuss the need for any further investigations, or for action, with the management and employees at NSUK. Alternatively, we will say if we think there is no cause for concern.
PLEASE REMEMBER
We cannot do this investigation without personal information about current and past employees of NSUK. We will be very careful to keep this information confidential.
Please co-operate with HSE in this important work. But if you are concerned about what we want to do with information about you, or want to know more then please use freephone:
0800 592 450
or write to Dr John Osman (Senior Employment Medical Adviser) at:
HSE Rm 236 Magdalen House
Bootle, L20 3QZ
Merseyside
50

APPENDIX 3 – TERMS OF REFERENCE FOR INDEPENDENT SCIENTIFIC STEERING COMMITTEE
HSE INVESTIGATION OF CANCER IN CURRENT AND FORMER WORKERS OF NATIONAL SEMICONDUCTOR (UK) LTD (NSUK)
Steering Committee - Terms of Reference
The committee's role is to provide an independent check on the technical quality of the proposed investigation throughout its course from design to report. In particular the committee will:
1. Comment on the final draft of the investigation protocol; 2. Endorse the investigation protocol; 3. Receive a report from HSE at the end of each month on investigation progress; 4. Be consulted on, and endorse, any subsequent major alterations to the investigation
protocol; 5. Endorse the a priori investigation hypotheses following the meeting with the campaign
group Phase Two; 6. Comment on the initial statistical assessment of the cancer experience of current and
former workers; 7. Endorse the investigation of any statistical excesses found in relation to the workplace; 8. Comment on the final drafts of investigation report and worker leaflet; 9. Endorse the finalised versions of the investigation report and worker leaflet; and 10. Comment on the paper to be submitted for publication in a peer-reviewed publication.
As is usual with such investigations, HSE and the Steering Committee will maintain confidentiality of the investigation, any correspondence and results, at least until the findings have been presented to management and worker representatives of NSUK.
51
APPENDIX 4 – RESULTS OF THE EXERCISE TO FIND AN EASILY EXTRACTABLE VARIABLE TO ACT AS A SURROGATE
FOR POTENTIAL EXPOSURE TO KNOWN OR SUSPECT CARCINOGENS
INVESTIGATION OF CANCER AMONG THE CURRENT AND FORMER EMPLOYEES OF NATIONAL SEMICONDUCTORS (UK) LTD. (NSUK), GREENOCK
Report to the Steering Committee
Results of the Assessment of Data Sources for Possible Use as Flag for Potential Exposure to Occupational Carcinogens
17 July 2000
1. INTRODUCTION
As outlined in Section 4.1 of the Investigation Protocol, the intention was to look for some simple and available way of categorising workers who are potentially exposed or not to known or suspected occupational carcinogens. Ideally, it would have been preferable to have extracted this information from already existing computer files.
INFORMATION CONTAINED IN THE DIFFERENCT DATA SOURCES
1.1 Personnel Data
The computerised personnel system (SAP) contains information on: Position (includes the employee’s department) Shift Pattern (weekly 40 hour day shift or 42 hour continental shift) Histories of Job Changes Information on Job Grade Exempt status (Exempt are Professional Staff, also Non-exempt and Hourly) Head Count (could be used to separate engineers from other Fab workers)
It is possible, for NSUK HR staff to ascertain whether or not a worker works or worked in Fab, worked in Non-Fab or whose work caused them to have occasion to enter the fab area from the information contained in the SAP system. Unfortunately the information is only available for Greenock employees in post from 1995 onwards and the information is restricted to 1995 onwards.
Similar information in contained in the manual records, but these only exist for workers not on the SAP system for those workers who left within the last 12 months or so. Information is also contained on Canofile as computer images for workers who left more than 12 months age, but these are held without optical character recognition and it would therefore be laborious to extract the information.
52

1.2 Payroll Data
There is no information in these records that could usefully be used as a surrogate for potential carcinogenicity exposure.
1.3 Pensions Data
Potentially useful information included weekly/monthly paid and gross pay. Discussions indicated that neither of these sources of information could provide sufficiently discriminatory groupings with regards to potential exposures. Therefore there is no information in these records that could usefully be used as a surrogate for potential carcinogenicity exposure.
1.4 Occupational Health Data
Information from the pre-employment medical check in relation to whether or not an employee is ear-marked for work in the fab area or not, is readily accessible via a series of coded stickers on the outside of the file for each worker. More detailed information is contained within the records in relation to job changes, but this was deemed incomplete, since the information was only updated when a worker had occasion to come into contact with the Occupational Health Department at NSUK. As for the historic personnel data, the information contained in the OH records would also be prohibitively time-consuming to extract.
According to HSE inspectors, NSUK have in general carried out good quality risk assessments as required by CoSHH. Importantly, such assessments relate to work practices rather than the individual worker. According to Schedules 5 and 11 of CoSHH, NSUK have not deemed it appropriate, from these risk assessments, that medical surveillance is “appropriate” under CoSHH. Therefore no CoSHH records exist that could be usefully used for this HSE investigation as a direct or surrogate measure of exposure to known or potential carcinogens at the individual worker level.
3. CONCLUSION AND RECOMMENDATIONS
The only sensible and easily accessible information would appear to be a flag of ever or never worked in fab obtained from the pre-employment medical check, the data being held as coloured stickers in the occupational health records. Because these flags are crude surrogates of potential exposure, care will be taken to ensure that they are no over-interpreted in the analysis of the epidemiological data set.
It is proposed that HSE medical staff arrange with NSUK a mutually convenient time when this information may be extracted.
53
APPENDIX 5 – RESULTS OF THE EXERCISE TO VALIDATE FAB/NON-FAB STATUS FROM OCCUPATIONAL HEALTH
RECORDS
REPORT ON VALIDATION OF FAB/NON-FAB FLAGS FROM NSUK OCCUPATIONAL HEALTH RECORD SYSTEMS
Recap of structure of OH record system at NSUK
NSUK’s occupational health data are all held in paper form on a Kardex Lectriever system in the OH department. They are filed alphabetically within 3 groups as follows:
i. Current employees. Each employee has a separate manilla folder divided into various subsections.
ii. Past employees with dates of leaving since about 1988. Each employee has a separate manilla folder, as above
iii. Past employees who left prior to 1988. Each employee has an individual plastic wallet containing all their records in a single bundle. These wallets are placed in manilla folders containing a number of records which share the first two letters of the surname. Each folder can contain anything from 2 to 12 records.
The OH record keeping system was modernised in the late 1980s. Employees who were still working for NSUK at the date of refiling their record moved onto the new system, and therefore have the same record structure as current workers, although they are moved to a different physical section of the filing system on leaving. The records for workers who had already left were filed as described in (iii) above to save space and resources. There is some temporal overlap of systems (ii) and (iii) for past employees, as the system was constructed over an extended time period.
Fab/non-fab flagging by NSUK
During the reorganisation of the record system described above the OH department decided to place readily identifiable markers of fab/non-fab status on the outside cover of all the OH record folders. The decision to record this factor was influenced by the studies of miscarriage rates in fabrication workers which were ongoing at the time. They were also flagging other factors of interest to the OH department on the covers of the records, though none of these related to occupational exposures.
For records falling in groups (i) and (ii), as described above, a green sticker was placed on the spine of the manilla folder of fab workers. The absence of a green sticker indicated non-fab status (see under “verification” below). For records in group (iii) a self adhesive summary sticker recording name, date of birth, date of start of employment and date of leaving employment had already been placed on the plastic cover of each individual record. To this the words “Fab” or “Non-fab” were added by hand where the information could be obtained from the enclosed documents. No annotation was added if the information could not be ascertained from the written records.
54

At the time of initial flagging the fab/non-fab classification of all records in groups (ii) and (iii) was based on the worker’s first job at NSUK, as recorded on the initial medical examination records. This was also the case for the majority of group (i) records, though in a few cases the worker’s current job may have been used if the OH staff performing the flagging knew that this was different from the starting job. Some of these records will subsequently have moved to group (ii) as workers have left NSUK, therefore a very small number of both the group (i) and (ii) records may be flagged on the basis of a job other than that at the start of employment. (No such cases were actually identified during verification checks, which implies that the proportion is less than 0.5%).
Subsequent to the initial flagging process all new employees at the Greenock site have been flagged on the basis of their starting job. No systematic attempt has been made to update the flagging of workers who have changed jobs. OH staff indicated that they would do this if they knew a worker had permanently changed jobs and the initial flag was incorrect, but they believed that in practice they had rarely done so. It can therefore be assumed that the majority of records, in all groups, are flagged on the basis of the starting job.
Basis on NSUK’s fab/non-fab classification
The intention was to classify as “fab” all those workers who spend a substantial proportion of their working week in the fabs. Therefore, all production line “operators” (the commonest job description on initial medical screening records) were flagged as “fab”, as were supervisors and junior managers who spent most of their time in the fabrication areas. All clerical and middle/senior managerial staff and other groups who would have no obvious need to enter the fabs on anything more than an occasional basis were classified as non fab. Engineering staff were divided into “design” groups, who would only intermittently visit the fab for short periods and were classified as “non-fab”, and “production” groups, who were likely to spend prolonged periods of time in the fabs on more than one occasion each week and were classified as “fab”.
Some groups were more difficult to classify on the basis of their job title alone. Maintenance workers had workgroup designations on their initial medical assessment forms which were known to the OH staff to be associated with the maintenance of particular types of equipment, which facilitated their classification. Quality assurance workers were classified partly in a similar way to maintenance workers, supplemented by the OH staff’s knowledge of the individual worker. Any workers who could not be classified on a group basis were classified using the personal knowledge of the OH staff.
Verification of the NSUK flagging system
A previous visit was conducted by HSE staff to conduct checks on the completeness and accuracy of NSUK’s data sources as described in detail in Appendix 6. A total of 251 OH records were checked during that visit. In anticipation of the possible subsequent use of the fab/non-fab flags these records were additionally checked for agreement between the flag and the information recorded on the initial medical screening record, assuming that the flagging rules described by the OH department had been followed.
Among all 251 records examined there were 12 cases where the HSE investigator queried the basis of the flagging and in all cases was given a satisfactory explanation for the apparent discrepancy (either the use of an element in the job description with which the investigator was not familiar, such as a maintenance workgroup, or the application of personal knowledge of the
55
worker by the OH staff). There were no cases where the HSE investigator was unable, after discussion, to agree with the flagging applied.
Among the group (i) and (ii) records there were no instances where a green sticker was absent but the employee appeared to have been initially employed in a fabrication job. Among 63 records in group (iii) there were no cases where fab/non fab classification had not been applied and the HSE investigator felt that it would have been possible to do so.
Extraction of fab/non-fab flagging data
Three HSE personnel visited the NSUK site from 30 August 2000 to 1 September 2000 inclusive to extract the fab data taking with them a single copy of the HSE master list of subjects to be included in the investigation. They were informed that there had been significant recruitment of new personnel since the compilation of the original list. In particular a batch of over 100 new production operators had started work in May/June 2000. The decision was taken not to add these new personnel to the list, therefore the general rule was adopted, prior to examining the records, that no information would be recorded for subjects who were not on the HSE list if either the date of start was confirmed as after 30 April 1999 or the date of initial medical examination was after 31 December 1999 and no start date was recorded.
The procedure then adopted was to physically examine all the records held in the OH department, match the record with an entry in the HSE list and record a single character in the “fab/non-fab” field according to the following rules:
1. For records in groups (i) and (ii), record “F” if green sticker present, “N” if no green sticker present.
2. For records in group (iii), record “F” if “fab” recorded on cover sticker, “N” if “nonfab” recorded, “O” if fab status not recorded on cover sticker.
The records were removed from the Lectriever system in physically manageable batches and removed to an interview room in the OH department. One member of the HSE team read out the name, other identifying details (as required) and fab status from the records while a second member identified the corresponding entry in the HSE list and recorded the flagging information. The third member observed and checked the recording process. The “recorder” and “observer” changed places at break and mealtimes but the same record reader (RCE) remained in place for the whole of the group (i) and (ii) records as he was more familiar with the internal structure of the records and therefore faster at finding identifying details. NSUK OH staff assisted with removal and refiling of records and answered queries as required but took no part in recording the flagging data.
The full name was first read out from the records and a corresponding name identified in the HSE list. If a single name was identified a second variable (either date of birth or date of starting employment, whichever was most readily available) was then read out to confirm the match. Where the HSE list contained more than one matching name at least two matching confirmatory variables, chosen from date of birth, date of start, National Insurance number and address, were required to confirm the match. If a match could not be found the details were recorded in a notebook for subsequent reexamination.
Where a match was established but a discrepancy in the HSE list was uncovered by the matching process the “corrected” information was recorded in red ink on the list and all fields which had been confirmed as matching were highlighted. (It should be noted that this is not a
56

systematic error check, because where a match was established on the name and first confirmatory variable no further checks were carried out.)
Where the HSE list recorded more than one surname (e.g. a married name and maiden name) an attempt was made to find both names in the OH record and, where possible, the name most recently used was identified and highlighted in the HSE list.
The NSUK occupational health staff drew attention to a batch of about 100 records held in a non-standard form within the department which were believed to represent workers who had been employed at the Swindon plant, not at Greenock, and should not have been included in the HSE list. They suggested that the team might take the opportunity to check that this was the case. Accordingly a random selection of 10 records was pulled from this bundle and confirmed not to be included in the list.
On several occasions, while checking a group (iii) record, a second, older, record was found for a subject already identified in the group (i) or (ii) records. In a few cases this permitted correction or supplementation of data in the HSE list (most commonly highlighting of the most recent surname) but in no case was it felt necessary to alter the fab status flag already allocated.
At the end of the process attention was turned to the notebook (mentioned above) in which non-matching records had been recorded. Before leaving the plant it was established that in 4 cases the information matched the “secondary” name of a subject recorded as having two surnames in the HSE list. The appropriate flag was therefore recorded and the matching surname highlighted.
57

APPENDIX 6 – RESULTS OF THE 10% SAMPLE CHECK OF PERSONNEL RECORDS
INVESTIGATION OF CANCER AMONG THE CURRENT AND FORMER EMPLOYEES OF NATIONAL SEMICONDUCTORS (UK) LTD. (NSUK), GREENOCK
Report to the Steering Committee 10 November 2000
Results of the Sample Check on the Completeness of the Personnel Data
1. INTRODUCTION
In accordance with Section 3.3 of the Investigation Protocol, HSE has now completed its check on the completeness of the personnel data supplied by NSUK.
This report describes the different data sources for NSUK Greenock personnel data and sets out the results of checks that were carried out in order to assess the overall completeness of the personnel data from these various sources.
It also sets out action taken by HSE in conjunction with NSUK to improve the completeness and accuracy of the investigation data set, based on information obtained during and subsequent to the checking exercise.
Finally, conclusions are drawn in relation to the level of completeness and accuracy of the personnel data.
2. NSUK PERSONNEL DATA
2.1 Construction of the NSUK Personnel Data File
A personnel list for HSE was constructed from the Occupational Health Dept. and Human Resources SAP system and circulated to pensions and payroll for checking against these sources. Discussion with NSUK employees and subsequent email correspondence with NSUK suggested these checks probably only involved modification of records already on this list. Hence, employees missing from this list but recorded within either of these other sources would not have been identified and added to the list.
2.2 Construction of the HSE master file
A list of all employees contained in the revised data set sent to HSE in September 1999 was produced (the HSE master list) in order that an approximate overall 10% check on the
58

completeness and, at the same time, the accuracy of NSUK’s personnel data. The HSE master list contained information on 4,814 NSUK personnel.
3. METHODS
The intention was to check every 20th record or so from the different data sources (see Section 3 for further details) so that this would result in an approximate overall 10% check (given the overlap between sources). For each source checks were made by randomly selecting and checking a record within the first 20, and then systematically sampling and checking approximately every 20th record thereafter against the HSE master list.
A 100% check was undertaken on data sources where initial checks suggested some subjects may be missing from the HSE master list. These 100% checks were undertaken offsite on computerised or hard copy printouts for human resources canofile records, computerised payroll data, and computerised pensions data (see Section 5 for details).
In addition, HSE prepared a list of 100 workers, stratified by year of starting, for the purpose of conducting a separate investigation to assess the feasibility of extracting any usable indices of exposure to potential carcinogens. The results of this exercise were the subject of a separate report to the Steering Committee. These records were also checked for accuracy against the NSUK records for human resources and occupational health data.
4. DATA SOURCES
4.1 Human Resources Data
NSUK’s human resources data are available from 3 different sources:
i. a computerised (SAP) system, ii. paper records, and iii. scanned images contained in Canofile records.
4.1.1 The SAP system
This computer system contains personnel information on all NSUK Greenock workers who were in post in 1995 or later. Currently it contains information on some 800 or so current workers.
4.1.2 Paper Records
These exist for all current workers, for those workers who left within the last year, and a few records for workers who left slightly longer ago than this (Canofiling these is not regarded as high priority work and a small backlog has built up – see Section 4.1.3).
59

4.1.3 Canofile Records
Canofile records consist of scanned images of all pages of former NSUK workers’ human resources records. The system has been in place since 1996, and contains records for 1978 former employees. The records are indexed by employees’ names and dates of birth. The number of scanned pages for a worker ranges from approximately 20 pages up to approximately 200 or so and, exceptionally, up to more than 600 pages. The scanned pages are stored as images without character recognition and therefore extracting information is not straightforward. Records exist for all workers who left NSUK Greenock more than 12 months before (apart from the manual records waiting to be Canofiled).
4.2 Payroll Data
The payroll data consists of two sources:
i. a computerised system and ii. microfiche records.
4.2.1 Computerised records
The computerised records exist for every NSUK employee on the current payroll (approximately 800).
4.2.2 Microfiche Records
The microfiche records exist for every NSUK employee on the payroll from 1981 to 1998.
4.3 Pensions Data
There are three sources of pension data:
i. a computer database created in 1991 with all current records and a large proportion of past workers;
ii. four 'Black books' containing hard copy printouts from older records some of which were reportedly not entered on the computer database; and
iii. hanging paper files in Human Resources reported to be directly derived from the above two sources.
4.3.1 Computerised Records
The computerised pensions system was created in 1991 and reportedly contained data on all current workers and a large proportion of ex-workers. It contained 4645 records of which 2896 had unit codes N1 and N2 reported to represent mainly Greenock employees. The other unit
60

codes were reported to represent only employees at other sites. This database was accessed within the Finance Department.
4.3.2 Black Book Records
These books held in the Finance department contained approximately 2000 records reported to be all Greenock employees. Two of the four Black books contain employees who had life insurance cover only and not a pension.
4.3.3 Paper Records
Approximately, 900 paper records in hanging files within the Human Resources unit contained details of those currently in receipt of pensions, or with deferred benefits. These were directly derived from the other two sources of pension records, and given this a less rigorous 1 in 40 check of these records was undertaken.
4.4 Occupational Health Data
NSUK’s occupational health data are all held in paper form on a Kardex Lectriever system in the OH department. The are filed alphabetically, but are divided into 3 subsections as follows:
i. Current employees. ii. Past employees who left during or after approximately 1988. iii. Past employees who left prior to approximately1988.
4.4.1 Current employees
Each employee has a separate manilla folder divided into various subsections. There are approximately 800-900 of these records.
4.4.2 Past employees with dates of leaving since about 1988
The OH record keeping system was extensively improved in the late 1980s. Employees who were still working for NSUK at the date of re-filing their record moved onto the new system, and therefore have the same record structure as current workers, with each past employee having a separate manilla folder. Given, this re-filing exercise was extended over a number of years in the 1980s there is no clear cut-off date between the two past workers OH sources. There are approximately 1300-1500 of these records within this source.
4.4.3 Past employees who left prior to approximately 1988
Each employee had a plastic wallet containing all their records in a single bundle. These wallets stored in manilla folders containing a number of records which share the first two letters of the
61

surname. Each folder can contain anything from 2-12 records. Given this filing structure, and the greater sensitivity of these data, folders were sampled and all records within folders checked. Three folders were sampled from the beginning, middle and end of each shelf containing these data. There were approximately 600-1000 of these records.
5. RESULTS OF THE COMPLETENESS CHECK
5.1 Human resources data
5.1.1 The SAP system
Item Frequency
Number of records checked 91 Number of employees not on HSE master list 0 Number of employees on HSE master list and details match 87 Number of employees on HSE master list and not all details match 4 Number of employees on HSE master list with name different 0 Number of employees on HSE master list with sex different 2 Number of employees on HSE master list with date of birth different 2 Number of employees on HSE master list with start date different 0
5.1.2 Paper records
Item Frequency
Number of records checked 78 Number of employees not on HSE master list 1 Number of employees on HSE master list and details match 62 Number of employees on HSE master list and not all details match 15 Number of employees on HSE master list with name different 2 Number of employees on HSE master list with sex different 0 Number of employees on HSE master list with date of birth different 4 Number of employees on HSE master list with start date different 10
5.1.3 Canofile records (100% sample)
Item Frequency
Number of records checked 1978 Number of employees not on HSE master list 94 Number of employees on HSE master list and details match 1828 Number of employees on HSE master list and not all details match 56 Number of employees on HSE master list with name different 4 Number of employees on HSE master list with sex different * Number of employees on HSE master list with date of birth different 52 Number of employees on HSE master list with start date different * * canofile index used for 100% download of these records contained only surname, first name and date of birth.
62

5.1.4 Check of 100 records
Item Frequency
Number of records checked 100 Number of employees not found* 33 Number of employees on HSE master list and details match 63 Number of employees on HSE master list and not all details match 4 Number of employees on HSE master list with name different 0 Number of employees on HSE master list with sex different 2 Number of employees on HSE master list with date of birth different 2 Number of employees on HSE master list with start date different 1 * All 100 were found within the occupational health data
5.2 Payroll data
5.2.1 Computerised records (100% sample)
Item Frequency
Number of records checked 843 Number of employees not on HSE master list 26 Number of employees on HSE master list and details match 724 Number of employees on HSE master list and not all details match 93 Number of employees on HSE master list with name different 17 Number of employees on HSE master list with sex different 0 Number of employees on HSE master list with date of birth different 17 Number of employees on HSE master list with start date different 70
5.2.2 Microfiche records
Item Frequency
Number of records checked 84 Number of employees not on HSE master list 18 Number of employees on HSE master list and details match 30 Number of employees on HSE master list and not all details match 36 Number of employees on HSE master list with name different 2 Number of employees on HSE master list with sex different 0 Number of employees on HSE master list with date of birth different 1 Number of employees on HSE master list with start date different 17
63

5.3 Pensions data
5.2.3 Computerised records (100% sample)
Item* Frequency
Number of records checked 2896 Number of employees not on HSE master list 276 Number of employees on HSE master list and details match 2519 Number of employees on HSE master list and not all details match 101 Number of employees on HSE master list with name different 45 Number of employees on HSE master list with sex different 0 Number of employees on HSE master list with date of birth different 60 Number of employees on HSE master list with start date different ** * The 100% download checked was of records with unit codes N1 and N2 that were reported to represent mostly Greenock employees ** Only joining date of the pension scheme available. Although this will be close to the start date in most cases (and therefore could be used as a surrogate measure of the start date in the absence of any more accurate information), in view of the large number of minor discrepancies likely to exist between dates, this was not used as a validation check.
5.2.4 Black book records
Item Frequency
Number of records checked 89 Number of employees not on HSE master list * 9 Number of employees on HSE master list and details match 64 Number of employees on HSE master list and not all details match + 16 Number of employees on HSE master list with name different 9 Number of employees on HSE master list with sex different 2 Number of employees on HSE master list with date of birth different 5 Number of employees on HSE master list with start date different * * Start date not available, only joining date of the pension scheme. Given the scheme is voluntary, this information was considered a poor surrogate measure of start date.
5.2.5 Paper records (2.5% sample)
Item Frequency
Number of records checked 22 Number of employees not on HSE master list * 0 Number of employees on HSE master list and details match 22 Number of employees on HSE master list and not all details match 0 Number of employees on HSE master list with name different 0 Number of employees on HSE master list with sex different 0 Number of employees on HSE master list with date of birth different + 0 Number of employees on HSE master list with start date different** * * Start date not available, only joining date of the pension scheme that given its voluntary nature may not be a useful surrogate measure of start date.
64
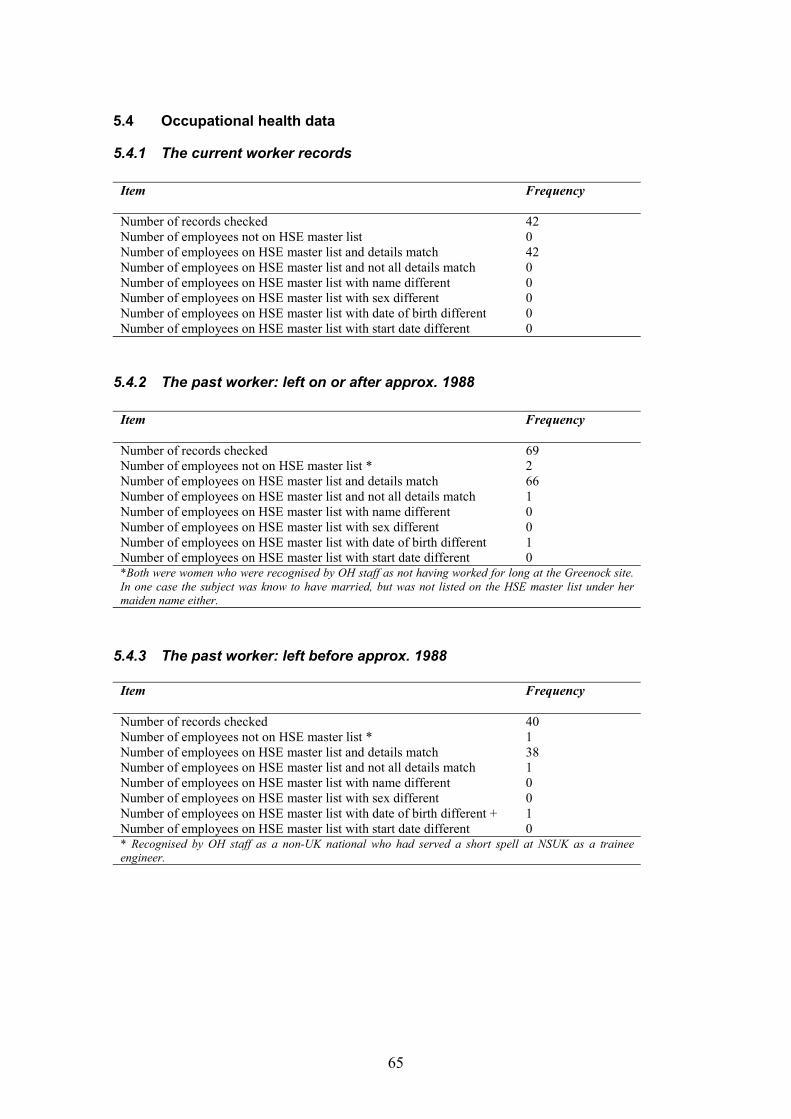
5.4 Occupational health data
5.4.1 The current worker records
Item Frequency
Number of records checked 42 Number of employees not on HSE master list 0 Number of employees on HSE master list and details match 42 Number of employees on HSE master list and not all details match 0 Number of employees on HSE master list with name different 0 Number of employees on HSE master list with sex different 0 Number of employees on HSE master list with date of birth different 0 Number of employees on HSE master list with start date different 0
5.4.2 The past worker: left on or after approx. 1988
Item Frequency
Number of records checked 69 Number of employees not on HSE master list * 2 Number of employees on HSE master list and details match 66 Number of employees on HSE master list and not all details match 1 Number of employees on HSE master list with name different 0 Number of employees on HSE master list with sex different 0 Number of employees on HSE master list with date of birth different 1 Number of employees on HSE master list with start date different 0 *Both were women who were recognised by OH staff as not having worked for long at the Greenock site. In one case the subject was know to have married, but was not listed on the HSE master list under her maiden name either.
5.4.3 The past worker: left before approx. 1988
Item Frequency
Number of records checked 40 Number of employees not on HSE master list * 1 Number of employees on HSE master list and details match 38 Number of employees on HSE master list and not all details match 1 Number of employees on HSE master list with name different 0 Number of employees on HSE master list with sex different 0 Number of employees on HSE master list with date of birth different + 1 Number of employees on HSE master list with start date different 0 * Recognised by OH staff as a non-UK national who had served a short spell at NSUK as a trainee engineer.
65

5.4.4 Check of 100 records
Item Frequency
Number of records checked 100 Number of employees not found 0 Number of employees on HSE master list and details match 88 Number of employees on HSE master list and not all details match 12 Number of employees on HSE master list with name different 1 Number of employees on HSE master list with sex different 0 Number of employees on HSE master list with date of birth different 5 Number of employees on HSE master list with start date different 6
6. INITIAL CONCLUSIONS
Overall, there were 373 potentially additional workers found on NSUK records, that were not supplied to HSE in September 1999 (excluding records replicated on more than one sampled source). 347 of these were from sources where 100% checks were carried out, and the remaining 26 from sources where 1 in 20 records were checked. This gave an initial estimate of potentially additional workers of 867.
7. PRODUCTION OF FILE SENT TO NHSCR
The two spreadsheet files containing address information for workers in the investigation, supplied by NSUK in March 2000, also contained a number of workers not included on the HSE master list (based on the September 1999 data set). This was not realised until after the HSE master list for the 10% sample check was created (from the September 1999 data).
The 4,814 records on the HSE master list were not validated. Initial validation reduced this to 4,558 workers. In the light of additional personnel contained in the March 2000 files containing address information supplied by NSUK, and further validation and subsequent queries with the company, some 429 workers were added to the data set without definite confirmation of having been employed by NSUK at Greenock. Thus 4,987 NSUK workers were included in the file sent for tracing at the NHSCR. (These 429 workers will not be included in the main analysis, but were traced for the sake of completeness).
8. FINAL CONCLUSIONS
Carrying out the 10% sample check resulted in the identification a possible loophole in NSUK’s approach to identifying all their personnel who had worked at the Greenock site. The checks, including 100% cross-check against three of the sources, helped identify a substantial number of potential additional Greenock employees who were not included on the original personnel file because of the way it was constructed. In view of subsequent work done in conjunction with NSUK on the list of additional workers, it is now felt that the resulting data set of 4,987 employees is as complete and accurate as practically possible, and certainly sufficient for tracing at the National Health Service Central Register.
66

APPENDIX 7 – FINALISATION OF DATA SET SENT TO NHSCR
INITIAL DATA SENT
An initial data set was provided by NSUK and contained information on the following variables
Surname Maiden name Forename(s) Date of birth National Insurance No Start date Leave date Whether or not deceased
Workers had a record on the file for each distinct employment episode at the Greenock site.
The data were internally validated using the computer package SPSS (SPSS, 1999). In particular, a unique identification (ID) number was created for each record, and separate identifiers created for those records with a marking of ‘deceased’. Special variables ‘lag’ were also created to enable duplicates and triplicates etc to be identified after the data file was appropriately sorted. Dummy leaving dates of 30.4.1999 were inserted for those records with a start date, but no leaving date.
All missing or inconsistent data were queried with NSUK. In particular, they were asked to: confirm the suspected duplicates; correct any conflicting information; correct and supply any missing information for records confirmed as separate individuals; and correct and supply any of the conflicting or missing information.
The data file contained 4857 records of personnel information. (See Appendix 6 for further on the data sources used to compile the data file).
The following queries resulting from the initial validation were sent to NSUK.
Potential duplicate records
• 50 records pairs with the same NI number and overlapping employment episodes • 26 record pairs with same surname and birth dates, different NI numbers and distinct
employment episodes • 93 record pairs with the same NI number distinct employment episodes
Other checks
• 100 records which had missing start of employment dates • 5 workers with start of employment dates before 1970 • 2 records which had end of employment dates before 1970 or after 30 April 1999 • 36 workers with start of employment dates after end of employment • 13 workers with invalid entries for start of employment
• 43 workers aged less than 16 at start of employment • 1 worker aged greater than 65 at the end of employment
• 86 workers with invalid or missing birth dates
67

Revised data set
NSUK responded to the queries about the initial data by supplying a revised data file containing the same variables as the original.
A similar series of validation checks were run on this file after again creating a unique ID for each variable, creating appropriate lag variables and sorting the file. Any missing or inconsistent data were again queried with NSUK. A list was sent to NSUK so that any amendments to the queried records could be annotated rather than them sending a third data file to us.
NSUK were asked to confirm the sex of around 100 workers where this could not be unambiguously determined from their first name.
All responses to the queries resulted in coded changes being made to the data held in SPSS. Information was combined so that there was a single record for each individual in the data set. Where discrepancies remained unresolved for pairs of records representing the same person, new fields were created in the data file to hold the alternative information, with the intention of identifying the correct information when tracing at NHSCR.
The revised data file contained 4814 records of personnel information.
The following queries resulted from the validation checks.
Potential duplicates identified from NI number
• 12 record pairs which had the same NI number were queried with NSUK due to differing spelling in names or completely different names/dates of birth
• 38 record pairs with same NI number and overlapping employment periods were queried with NSUK. A number of these also had discrepancies in names and dates of birth. NSUK confirmed that 6 of these pairs represented different people.
• 13 record pairs with the same NI number, which represented the same person with 2 distinct periods of employment, were queried due to discrepancies in the names/dates of birth. NSUK indicated that one of these pairs represented different people.
• 2 sets of 3 records with the same NI number were queried due to discrepancies in the names/dates of birth.
• There were no sets of records where more than 3 had the same NI number.
Potential duplicates identified from name and date of birth
Since some of the records did not have a NI number, it was necessary to search for replicate records using name and date of birth.
• 16 record pairs with the same surname and date of birth (but with different or missing NI numbers) were queried with NSUK since the records were not exact duplicates. NSUK confirmed that 2 of these pairs represented different people - in both cases one of the dates of birth had been incorrect. A further 7 were assumed to represent different
68

people, since information in other fields - such as first name and sex, did not match closely.
• 15 record pairs with the same first name and date of birth (but with different or missing NI numbers) were queried with NSUK since it was possible that they represented the same person. NSUK confirmed that 9 of these did in fact represent the same person.
• There were no records where more than 2 had the same surname and date of birth or the same first name and date of birth (but different NI numbers), which had not been identified by previous validation checks.
Other checks
The following queries resulting from the validation of the revised data file were also sent to NSUK:
• 16 records where the date of birth was missing • 15 records with missing start date • 21 records where the start date was the same as the leave date • 5 records where the worker was aged less than 16 at the start date • 4 records where the worker was aged greater than 65 at the leave date
Amendments made to the data resulting from information from telephone calls from NSUK workers or relatives
Some additional information changes were received via the confidential freephone helpline set up at the outset of the investigation to deal with the concerns of current and former employees. In particular this was the means by which workers, or former workers, could inform HSE that they wished to opt out of the investigation.
• 3 people contacted HSE stating that they were opting out of the investigation. Records relating to these were deleted from the personnel data file. In addition, a relative of a former worker contacted HSE requesting that the person be excluded from the investigation.
• 5 people stated that they had never worked at the Greenock site. Two of these were present on the data file and deleted.
• 3 changes to the data were made resulting from workers informing HSE that their name had changed.
Address information
After validation, address information for workers was matched to the records on the personnel data file. The address information was received from NSUK in 2 batches. One file contained address information for all people who had worked at NSUK in the last five years, the other contained the address information for people who worked before this time. Before merging the address records to the validated personnel data file, the address files were themselves checked for duplicates to ensure a one-to-one match.
69

Any duplicate records on the 2 files containing the address information were deleted before matching to data held in SPSS. In some cases duplicate records existed with different addresses. These were combined into single records with 2 possible addresses. 4221 address records were merged to the validated personnel data held in SPSS.
Check of completeness and accuracy of NSUK personnel data
The 10% and 100% check of completeness and accuracy of NSUK personnel data (described in detail in Appendix 6), resulted in the identification of 425 additional workers potentially employed by NSUK at Greenock. They were added to the data file. However, since NSUK were unable to confirm that any of them had worked at the Greenock site, they were marked as ‘unconfirmed Greenock workers’.
The checks also highlighted a number of discrepancies between data on the revised data file and the original source data. Where it could be assumed that the data file was incorrect, coded amendments were made to the data held in SPSS. Otherwise the alternative information was added to the record.
Of the discrepancies found between the data held by HSE in SPSS and the original source data, coded changes were made in 7 cases. Alternative information was added in 217 cases. The majority of these resulted from the 100% match of the HSE data file against NSUK’s pension and payroll records. Where discrepancies occurred in the date of birth or employment start date, but the difference was less than one month, no changes were made to the data file.
The consolidated data file, incorporating the information and amendments from the various stages describe above, was sent to the NHSCR to enable workers to be flagged on their computer system for notification of deaths and cancer registrations.
70

APPENDIX 8 – STATISTICAL ANALYSIS PLAN FOR THE INVESTIGATION
INVESTIGATION OF CANCER AMONG THE CURRENT AND FORMER EMPLOYEES OF NATIONAL SEMICONDUCTORS (UK) LTD., GREENOCK
STATISTICAL ANALYSIS PLAN
PREMLIMINARY MATTERS
A number of tasks will need completing before analysis of the cohort can be started. In particular the following:
1. Check data supplied by ISD against published Scottish population and mortality data we already hold (supplied previously by GRO(S)), and check for internal consistency:
- Check that mortality and cancer registration data for all the disease groups requested have been supplied (see page 4);
- Check mortality data by age group, sex and disease group against annual figures obtained from GRO(S) held by EMSU;
- Check cancer registration data for appropriate disease groups against figures published on ISD website;
- Check population data by year and sex against figures supplied by GRO(S) on an annual basis;
- Check census population data by age group and sex totalled across deprivation quintiles against population data for 1981 and 1991;
- Check mortality data by age group, sex and disease totalled across deprivation quintiles for 1979-83 and 1989-93 against mortality data held be EMSU;
- Check cancer registration data by age group, sex and disease totalled across deprivation quintiles for 1979-83 and 1989-93 against the other cancer registration data supplied by ISD for internal consistency.
2. Construct Scottish death and cancer registration rates (adjusted and unadjusted for Carstairs index of deprivation) by age, sex and time period. The adjusted rates will be produced at the group level rather than an individual level. This will be done by applying weights based on the overall deprivation distribution of current Greenock workers and the Scottish population as a whole (from 1981 and 1991 census information) to the appropriate time periods within each disease group. Death and cancer registration rates will be formatted for use with the analysis software (OCMAP-PLUS).
3. Rationalise information in the cohort data file where problems identified during the initial validation checks have not been resolved when tracing at GRO(S):
- Where workers have more than one overlapping employment episode the earliest start date and most recent end date will be taken as start and end dates of a single employment episode;
- Workers with missing start dates will be excluded;
71

- Duplicate records which remain in the cohort data file will be summarised as single records applying the above two rules if appropriate.
- Records of the above will be kept for initial summarisation of those excluded and the reasons for exclusion
4. As validation of the tracing information supplied by GRO(S), coding of causes of death and cancer registrations, as well as dates of death and cancer registration, names and dates of birth in the cohort data file will be checked against hard copies of death certificates or electronic death/cancer registration records also supplied.
(5. Depending on the success of the GRO(S) tracing exercise, send file of untraced workers to DSS for identification via NI number. Any deaths notified will be sent back to GRO(S) for cause of death coding utilising additional information (i.e. date of death and possibly more accurate name and date of birth) from DSS.)
6. During the tracing exercise all deaths will have been coded by GRO(S) to ICD9. However, reference rates will be constructed based on mortality data supplied by ISD coded to ICD8 for pre-1979 deaths. Therefore the coding of pre-1979 deaths will be checked to verify that the equivalent ICD8 codes would result in the deaths being assigned to the same broad disease group for analysis, to avoid any potential numerator/denominator bias.
DESCRIPTIVE STATISTICS
1. Summary of vital status at the investigation end date (30 April 1999): - Frequency table showing GRO(S) tracing statistics; - Frequency table showing DSS tracing statistics (if applicable) - Frequency table showing combined tracing statistics including number of deaths and
cancer registrations.
2. Summarise the structure of the cohort to inform decisions on appropriate analyses to undertake – for example, for selection of appropriate time periods for stratification, and extent of analyses of cohort subgroups. Some of these may be provided by graphical means only.
Exclusions from the Cohort - Number excluded by reason for exclusion - vital status distribution - age and sex distribution - proportion of current/ex workers - proportion of fab/non-fab workers - distribution of employment duration - distribution of employment start dates - number of current workers by year
Overall cohort structure: - age and sex distribution - proportion of current/ex workers - proportion of fab/non-fab workers
72
- distribution of employment duration - distribution of employment start dates - number of current workers by year - number in cohort with multiple employment periods
Deceased cohort members: - age and sex distribution - proportion of fab/non-fab workers - distribution of employment duration - distribution of employment start dates (i.e. time since first employment) - number of unconfirmed Greenock workers - distribution of cause of death (ICD9) - number of deaths outside Scotland.
Cohort members with cancer registrations: - age and sex distribution - proportion of fab/non-fab workers - distribution of employment duration - distribution of employment start dates (i.e. time since first employment) - number of unconfirmed Greenock workers - distribution of cancer site (ICD9) - distribution of cancer type (ICD9)
Alive cohort members without cancer registrations: - age and sex distribution - proportion of fab/non-fab workers - distribution of employment duration - distribution of employment start dates (i.e. time since first employment)
FORMAL ANALYSIS
The cancer mortality and morbidity experience of cohort members will be examined by calculating standardised mortality ratios (SMR) and standardised registration ratios (SRR) (indirectly standardised for age, time period and sex) for the 26 disease groups outlined in the investigation protocol (also given below for completeness). Analyses will be undertaken using the computer package OCMAP-PLUS v 3.09.
SMRs and SRRs, and their 95% confidence intervals, will be calculated in relation to the national Scottish population with and without adjustment for the Carstairs index of deprivation.
The 26 disease groups with the appropriate ICD8 and ICD9 ranges, as set out in the investigation protocol, are given in the following table:
73
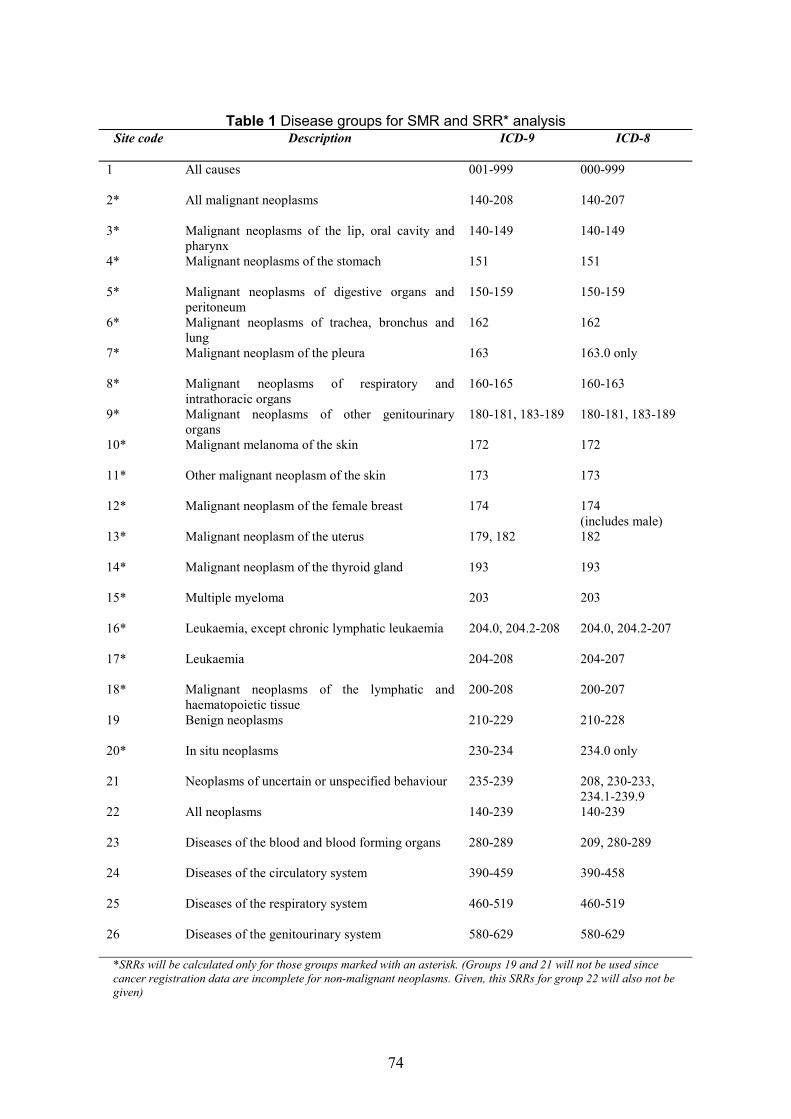
Table 1 Disease groups for SMR and SRR* analysis Site code Description ICD-9 ICD-8
1 All causes 001-999 000-999
2* All malignant neoplasms 140-208 140-207
3* Malignant neoplasms of the lip, oral cavity and 140-149 140-149 pharynx
4* Malignant neoplasms of the stomach 151 151
5* Malignant neoplasms of digestive organs and 150-159 150-159 peritoneum
6* Malignant neoplasms of trachea, bronchus and 162 162 lung
7* Malignant neoplasm of the pleura 163 163.0 only
8* Malignant neoplasms of respiratory and 160-165 160-163 intrathoracic organs
9* Malignant neoplasms of other genitourinary 180-181, 183-189 180-181, 183-189 organs
10* Malignant melanoma of the skin 172 172
11* Other malignant neoplasm of the skin 173 173
12* Malignant neoplasm of the female breast 174 174 (includes male)
13* Malignant neoplasm of the uterus 179, 182 182
14* Malignant neoplasm of the thyroid gland 193 193
15* Multiple myeloma 203 203
16* Leukaemia, except chronic lymphatic leukaemia 204.0, 204.2-208 204.0, 204.2-207
17* Leukaemia 204-208 204-207
18* Malignant neoplasms of the lymphatic and 200-208 200-207 haematopoietic tissue
19 Benign neoplasms 210-229 210-228
20* In situ neoplasms 230-234 234.0 only
21 Neoplasms of uncertain or unspecified behaviour 235-239 208, 230-233, 234.1-239.9
22 All neoplasms 140-239 140-239
23 Diseases of the blood and blood forming organs 280-289 209, 280-289
24 Diseases of the circulatory system 390-459 390-458
25 Diseases of the respiratory system 460-519 460-519
26 Diseases of the genitourinary system 580-629 580-629
*SRRs will be calculated only for those groups marked with an asterisk. (Groups 19 and 21 will not be used since cancer registration data are incomplete for non-malignant neoplasms. Given, this SRRs for group 22 will also not be given)
74
SMR AND SRR ANALYSES
SMRs and SRRs will be calculated for the following groupings/cross-tabulations where datapermit using OCMAP-PLUS. Entire cohort by:
- disease group; - disease group and sex; - disease group and calendar year group (5- or 10-year groups depending on number of
available cases and distribution of cases by calendar year*) in order to investigate trends over time;
- disease group with appropriate latency applied; - disease group and time since first employment group (5- or 10-year groups depending
on number of cases and distribution of cases by time since first employment*) in order to investigate latency effects;
- disease group and duration of employment group (5- or 10- year groups depending on number of cases and distribution of cases by duration of employment*) in order to investigate effects of duration of exposure
- latency and employment duration group; - disease group and exposure group (fab/non-fab).
All the above excluding workers employed for less than one year.
* Earlier descriptive statistics will inform appropriate grouping.
SENSITIVITY ANALYSIS
Likely worst case and best case assumptions will be developed for cases that have been excluded due to missing data fields. These will be included in analysis to identify the extent of the potential influence of this missing data.
Similarly those workers where Greenock/non-Greenock status was in doubt and those employed for less than one year will be included in an analysis to determine the effects of these cases on the results.
Further, such analysis may be applied to specific findings to assess their robustness to such potential errors.
FURTHER ANALYSIS
Some investigation of the data will be undertaken where there is sufficient evidence of a possible work-related relationship, i.e. significantly elevated SMR, dose-response- increasing SMR with employment duration, coherent with knowledge of disease in relation to latency analysis, duration of exposure, etc. This in relation to cancers will consist of qualitative consideration of histology information to see if there is evidence of specificity in relation to specific cancer type. In cases of all disease qualitative consideration of cases regarding specificity in relation to time worked at Greenock, whether FAB, length of employment age, etc.
75

FURTHER POINTS TO NOTE
It is possible that a non-trivial number of ex-workers migrated to England and Wales and that the Cancer registration system may be less complete for recent years in England and Wales compared with Scotland. This will be considered when assessing the SRR results.
76

APPENDIX 9 – METHODOLOGY FOR CARSTAIRS ADJUSTED ANALYSIS
CARSTAIRS INDEX
Carstairs index (or deprivation quintile) for a post code sector is a discrete score of 1 to 5 which indicates the level of deprivation (1 = affluent; 5 = deprived). It is derived from information on 4 key variables: percent of persons within the sector with no car, percent in overcrowded housing, percent for which household head is in semi or unskilled occupation (social class IV or V), and percent of men unemployed. A 7-point scale can also be used. Conversion from the 7point scale to 5-point is done by combining categories 1 and 2, and 6 and 7.
STANDARD METHOD OF ADJUSTING FOR DEPRIVATION
The standard way of adjusting for deprivation in a cohort investigation involves obtaining the deprivation score of each individual in the investigation (from their postcode sector of residence), and weighting at the individual level. This was not possible in the NSUK investigation since we did not have address information for all cohort members.
METHOD OF ADJUSTMENT IN NSUK INVESTIGATION
The deprivation distribution of the current NSUK workforce (current at 30 April 1999) was obtained from ISD, based on address data supplied by NSUK. It was assumed that this adequately represented the distribution by deprivation quintile for all workers regardless of age and year. The distribution was obtained for males and females separately. The table at the end of Appendix 9 gives the postcode sectors distribution of current workers by sex used by ISD to derive the deprivation distribution.
The NSUK deprivation distribution was used in conjunction with 5-year Scottish cancer and death data for the disease groups in the investigation (by sex, age, and deprivation quintile for 1979-83 and 1989-93), and Scottish population data by sex, age and deprivation quintile, from the 1981 and 1991 censuses, to produce disease, sex, age and calendar-time specific weights. These were then applied to the Scottish death and cancer registration rates in order to produce adjusted denominator rates for the SMR/SRR analyses.
DEPRIVATION DISTRIBUTION OF NSUK CURRENT WORKFORCE AS OF 30/4/1999
Depcat Males % Females % Total % 1 89 13.5 29 4.5 118 9.0 2 37 5.6 33 5.1 70 5.3 3 101 15.3 72 11.1 173 13.2 4 87 13.2 76 11.7 163 12.4 5 224 33.9 341 52.4 565 43.1 Missing 123 18.6 100 15.4 223 17.0
Total 661 100 651 100 1312 100
77
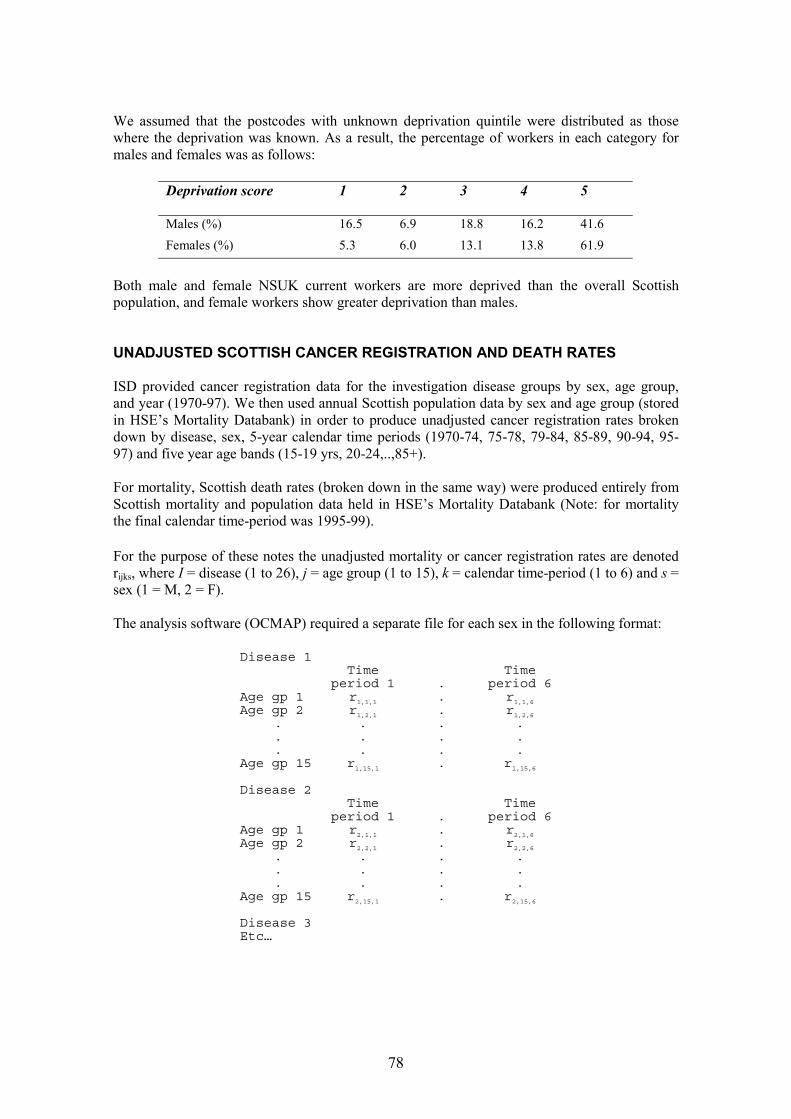
We assumed that the postcodes with unknown deprivation quintile were distributed as those where the deprivation was known. As a result, the percentage of workers in each category for males and females was as follows:
Deprivation score 1 2 3 4 5
Males (%) 16.5 6.9 18.8 16.2 41.6 Females (%) 5.3 6.0 13.1 13.8 61.9
Both male and female NSUK current workers are more deprived than the overall Scottish population, and female workers show greater deprivation than males.
UNADJUSTED SCOTTISH CANCER REGISTRATION AND DEATH RATES
ISD provided cancer registration data for the investigation disease groups by sex, age group, and year (1970-97). We then used annual Scottish population data by sex and age group (stored in HSE’s Mortality Databank) in order to produce unadjusted cancer registration rates broken down by disease, sex, 5-year calendar time periods (1970-74, 75-78, 79-84, 85-89, 90-94, 9597) and five year age bands (15-19 yrs, 20-24,..,85+).
For mortality, Scottish death rates (broken down in the same way) were produced entirely from Scottish mortality and population data held in HSE’s Mortality Databank (Note: for mortality the final calendar time-period was 1995-99).
rFor the purpose of these notes the unadjusted mortality or cancer registration rates are denoted
ijks, where I = disease (1 to 26), j = age group (1 to 15), k = calendar time-period (1 to 6) and s = sex (1 = M, 2 = F).
The analysis software (OCMAP) required a separate file for each sex in the following format:
Disease 1 Time Time
period 1 . period 6 Age gp 1 Age gp 2
r1,1,1
r1,2,1
.
. r1,1,6
r1,2,6
. . . .
. . . .
. . . . Age gp 15 r1,15,1 . r1,15,6
Disease 2 Time Time
period 1 . period 6 Age gp 1 Age gp 2
r2,1,1
r2,2,1
.
. r2,1,6
r2,2,6
. . . .
. . . .
. . . . Age gp 15 r2,15,1 . r2,15,6
Disease 3 Etc…
78

� � ��
� � ��
MAKING THE CARSTAIRS ADJUSTMENT
The following data were supplied by ISD to enable us to calculate the necessary weights to apply to the unadjusted Scottish death and cancer registration rates:
1. Population data from the 1981 and 1991 censuses broken down by sex, age and deprivation quintile.
2. Mortality data for two time periods (1979-83 and 1989-93) broken down by disease (the 26 disease groups defined in the investigation protocol), sex, age and deprivation quintile.
3. Cancer registration data for two time periods (1979-83 and 1989-93) broken down by disease for 18 of the 26 disease groups used in the cancer registration analyses, sex, age and deprivation quintile.
Derivation of weights
The data described above allowed us to calculate the following:
Pqjk *s 5
pqjk *s = Proportion of Scottish population in quintile q by age group j, time period = k* (= 81 or 91) and sex s. p� qjk *s
q=1
G = Proportion of NSUK current workforce in each quintile q by sex qs
Number of Scottish deaths (or cancer registrations) in the 5-year periods surrounding =dqijk*s each census (i.e. 1979-83 and 1989-93 denoted by k* = 81 and 91 respectively) in
quintile q, disease i, age group j and sex s.
Rqijk*s
dqijk*s 5-year death (or cancer registration) rate for quintile q, disease i, age group = = j, time period k* and sex s.pqjk*s
Substituting for :pqjk*s
� Rqijk*s
dqijk*s= 5 .
*Pqjk*s × � p s qjkq=1
The weights wijk*s are given by the following formula:
G5 5
� (G × qijk s ) � qsd *s ×R qijk* Pqjk*s qs
=1q=1 = q
=wijk*s 5 5(Pqjk*s × Rqijk*s )� � dqijk*s q=1 q=1
79

The latter expression was used to create the weights using SPSS.
The weights wijk*s have the same subscripts as the unadjusted rates except that there are only 2 time periods for the wijk*s (k* = 81, 91) rather than 6 in the rijks (k = 1,..,6; representing 5-year periods from 1970). The adjusted rates were produced by multiplying the unadjusted rates by the weights for time period k* = 81 for the first 3 time periods (k = 1, 2, 3), and by the weights for k* = 91 for the second three (k = 4, 5, 6) as follows:
rr[adj]
i j k s = ri j k s x wi j (81) s fork = 1,2,3 [adj]
i j k s = ri j k s x wi j (91) s fork = 4,5,6
Diagramatically:
Disease1
Time period Time period Time period Time period1 . 3 4 . 6
Age gp r xw . r xw R xw . r xw1
1,1,1 1,1,(81) 1,1,3 1,1,(81) 1,1,4 1,1,(91) 1,1,6 1,1,(91)
Age gp r xw . r xw R xw . r xw2
1,2,1 1,2,(81) 1,2,3 1,2,(81) 1,2,4 1,2,(91) 1,2,6 1,2,(91)
. . .
. . .
. . .Age gp r xw .
. . . .
. . . .
. . . .r xw r xw . r xw
15 1,15,1 1,15,(81) 1,15,3 1,15,(81) 1,15,4 1,15,(91) 1,15,6 1,15,(91)
Disease2Age gp r xw . r xw r xw . r xw1
2,1,1 2,1,(81) 2,1,3 2,1,(81) 2,1,4 2,1,(91) 2,1,6 2,1,(91)
Age gp r xw . r xw r xw . r xw2
2,2,1 2,2,(81) 2,2,3 2,2,(81) 2,2,4 2,2,(91) 2,2,6 2,2,(91)
. . .
. . .
. . .Age gp r xw .
. . . .
. . . .
. . . .r xw r xw . r xw
15 2,15,1 2,15,(81) 2,15,3 2,15,(81) 2,15,4 2,15,(91) 2,15,6 2,15,(91)
Disease3Etc…
ASSUMPTIONS
In the 5-year mortality and cancer registration data used to derive the adjustment weights, deprivation was coded to 9 in some cases. This category was used by ISD for records for which it was not possible to derive a deprivation quintile, either because no postcode was given or because the postcode was incorrect. 3.7% of incident cases fell into this category in the 197983 cancer registration data. However for incidence cases for the later time period and for deaths in both time periods the number with missing deprivation quintiles was under 1%. We assumed
80

that category 9 cases would have the same distribution as those coded 1 to 5, and hence discarded them.
A similar assumption was made in respect of the current NSUK workforce where inaccurate or missing postcodes resulted in 17% of current workers being coded as category 9.
OTHER ISSUES
Less common diseases
The death and cancer registration data for 1979-83 and 1989-93 used to the calculate the weights were disaggregated by disease, deprivation quintile, age group, and sex. This resulted in cells with no deaths or registrations for some less common disease groups. In particular, in some cases there were no cases in any of the five quintiles for a given disease, age group and sex. This was especially true of certain cancers in the younger age groups. For example, there were no deaths from malignant melanoma of the skin in males aged 15-19. The weight calculation for a given time period, disease, age group and sex combination involves dividing by the total number of cases in that cell. When this quantity is zero – as in the above example - no weight can be produced.
A second problem arises when calculating weights for a particular time-period, disease and sex when the number of cases in each age group is non-zero but small. In such situations the weights are based upon small numbers and therefore may vary substantially from age group to age group. This may result in adjusted rates which individually reflect more strongly the variation resulting from the small numbers of cases than the effect of the deprivation adjustment.
Smoothing
A revised method for deriving the weights which smoothed the death/cancer registration data over the age groups for a particular time-period, disease, sex and deprivation quintile would help to eliminate both these problems. The charts show smoothed and unsmoothed weights for each age group for malignant melanoma of the skin based on 1979-83 deaths – for males and females. Smoothing was carried out by applying a 5-point moving average to the death data before calculating the weights.
81

Weights for deaths from melanoma of the skin: males, 1979-83
1.8
1.6
1.4
1.2
1
0.8
0.6
0.4
0.2
0 1 2 3 4 5 6 7 8 9 10 11 12 13 14 15
age groupUnsmoothed Smoothed
Weights for deaths from melanoma of the skin: females, 1979-83
1.6
1.4
1.2
1
0.8
0.6
0.4
0.2
0 1 2 3 4 5 6 7 8 9 10 11 12 13 14 15
age group Unsmoothed Smoothed
82

APPROACH ADOPTED FOR INVESTIGATION
In most cases where a weight cannot be produced because of a zero denominator, the unadjusted rates themselves (to which the weight would be applied) would be zero. However, because the denominator rates are for different time periods (starting at 1970) it is possible to get a non-zero unadjusted rate for which we cannot produce a weight. Where this happens the rate would tend to be very small.
Although the individual weights may be strongly influenced by the variation resulting from small numbers of cases for some disease groups, many cohort members will contribute PYRS to a number of cells when standardizing by age and calendar time period in the SMR/SRR calculation. Hence there is some ‘smoothing’ inherent in the SMR/SRR calculation.
Given these two factors – and complicated programming required, the smoothing approach was not adopted in this investigation. Weights were set to 1 where they could not be produced due to division by zero.
83

Postcode sectors for NSUK workers current on 30 April 1999
Post code Males Females Total Table continued: AB15 7 1 1 Post code Males Females Total CA 9 1 1 KA9 2 1 1 EH11 1 1 1 KY3 0 1 1 EH54 9 1 1 KY6 3 1 1 FK7 9 1 1 ML3 6 1 1 G12 0 2 2 ML3 9 1 1 G12 8 1 1 ML4 2 1 1 2 G12 9 1 1 ML6 0 1 1 G14 9 1 1 ML6 9 1 1 2 G20 0 1 1 NP44 2 1 1 G20 6 1 1 PA1 1 1 1 G20 8 2 2 PA1 2 3 3 6 G22 6 1 1 PA1 3 1 1 G41 2 2 2 PA10 2 1 1 G41 3 2 1 3 PA11 3 2 1 3 G42 9 1 1 PA13 4 7 6 13 G44 3 1 1 PA14 4 1 1 G44 4 1 1 PA14 5 47 50 97 G46 6 1 1 PA14 6 27 52 79 G51 2 1 1 PA15 1 7 13 20 G61 1 2 2 PA15 2 17 31 48 G61 3 1 1 PA15 3 16 30 46 G61 4 1 1 PA15 4 45 66 111 G64 1 1 1 PA15 7 1 1 G64 2 1 1 PA15 9 1 1 2 G64 3 1 1 PA16 0 58 99 157 G69 6 1 1 PA16 1 3 3 G69 7 1 1 PA16 2 2 2 G72 0 1 1 PA16 4 1 1 2 G72 4 1 1 PA16 7 32 45 77 G72 8 1 1 PA16 8 22 29 51 G75 0 2 2 PA16 9 23 23 46 G75 8 1 1 PA17 5 4 1 5 G76 0 1 1 PA18 1 1 1 G76 7 3 3 PA18 6 30 9 39 G78 1 1 1 2 PA19 1 77 65 142 G78 2 1 1 2 PA19 2 1 1 G78 3 1 1 PA2 0 2 2 G81 1 1 1 PA2 4 1 1 G81 3 1 1 PA2 6 3 3 G81 6 2 2 PA2 7 1 1 2 G82 2 1 1 PA2 8 2 2 G82 3 2 2 PA2 9 1 1 2 G82 5 2 2 PA23 7 1 2 3 KA1 1 1 1 PA23 8 2 1 3 KA10 7 1 1 PA3 2 1 1 2 KA11 1 1 1 2 PA4 0 2 2 KA11 2 1 1 PA4 8 1 1 KA12 1 1 1 PA5 0 1 1 KA13 6 1 1 PA5 8 2 2 KA15 1 1 1 PA5 9 1 1 KA21 6 1 1 PA6 7 4 4 KA22 7 1 1 PA7 5 2 5 7 KA23 9 1 1 PA8 6 3 3 KA25 7 1 1 PA8 7 4 2 6 KA29 0 5 1 6 WA8 0 1 1
KA30 8 7 3 10 Missing or invalid code 110 93 203
KA30 9 6 2 8 Total 661 651 1312
84
APPENDIX 10 – INDEPENDENT VERIFICATION OF IMPLIMENTATION OF STUDY METHODOLOGY
The investigation team applied validation checks throughout the investigation process, but to further ensure investigation integrity an independent final quality assessment was undertaken on all documentation and computer files. This is described below.
Independently checking every file and record from beginning to end would be hugely burdensome and impracticable. Therefore, a targeted approach was adopted. The investigation team broke the investigation process into five stages that were:
• Initial data acquisition, inputting and validation (including the 10% check of NSUK records).
• The flagging process including data preparation, handling of flagging responses, the general flagging procedure.
• Inputting of flagging, death and cancer registrations data. • Preparation of analysis files. • Data analysis.
Documentation was available for all stages. The team then highlighted areas within these stages that carried the greatest risk of introducing errors or greatest risk of affecting results if any errors were present, and recommended checks of these areas as follows:
• Check all cases with death or cancer registration outcomes. Follow these records back from final data file to initial data file and critically investigate any discrepancies between files to ensure any data alterations follow documented assumptions. Further check paper copies of death certificates, registrations, and embarkations match with electronic details.
• Check the logic and its implementation are correct in respect of the validation checks on the original NSUK data. Particular attention should be given to areas where data could be lost such as where records where combined or seen as duplicates.
• Checking of logic and its implementation behind the 10% sample check. Particular focus should be given to consideration of Greenock/non-Greenock status and any amendments made to data files.
• Check logic and its implementation behind the tracing. Particular attention should be paid to further traces identified via the additional DSS tracing stage.
• Check the logic of assumptions needed in creating the analysis file and their implementation.
• Check the logic used to identify appropriate dates of birth for analysis from the members and postings, in cases where there were more than one date of birth for a record in the original data.
An HSE Statistician with no previous involvement in this investigation was selected to undertake this independent assessment. The remit for this statistician was to check as they see fit the investigation process including investigation logic and its implementation to ensure errors
85
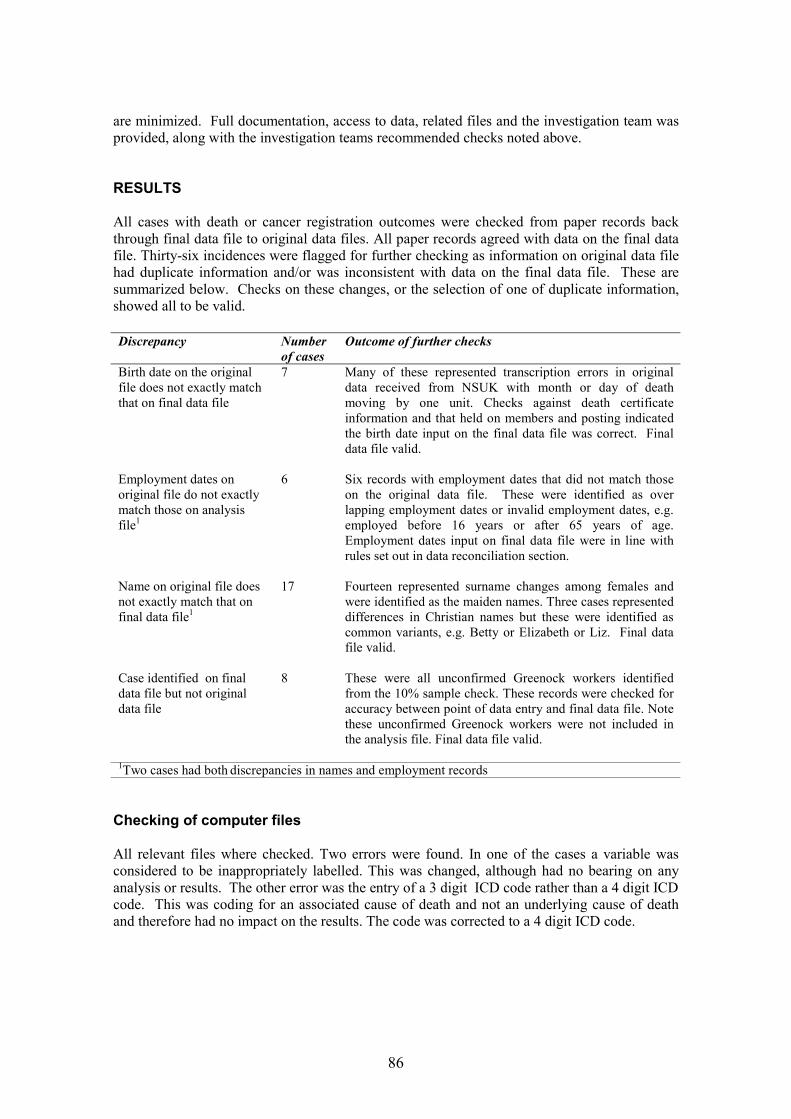
are minimized. Full documentation, access to data, related files and the investigation team was provided, along with the investigation teams recommended checks noted above.
RESULTS
All cases with death or cancer registration outcomes were checked from paper records back through final data file to original data files. All paper records agreed with data on the final data file. Thirty-six incidences were flagged for further checking as information on original data file had duplicate information and/or was inconsistent with data on the final data file. These are summarized below. Checks on these changes, or the selection of one of duplicate information, showed all to be valid.
Discrepancy Number Outcome of further checks of cases
Birth date on the original 7 Many of these represented transcription errors in original file does not exactly match data received from NSUK with month or day of death that on final data file moving by one unit. Checks against death certificate
information and that held on members and posting indicated the birth date input on the final data file was correct. Final data file valid.
Employment dates on 6 Six records with employment dates that did not match those original file do not exactly on the original data file. These were identified as over match those on analysis file1
lapping employment dates or invalid employment dates, e.g. employed before 16 years or after 65 years of age. Employment dates input on final data file were in line with rules set out in data reconciliation section.
Name on original file does 17 Fourteen represented surname changes among females and not exactly match that on final data file1
were identified as the maiden names. Three cases represented differences in Christian names but these were identified as common variants, e.g. Betty or Elizabeth or Liz. Final data file valid.
Case identified on final 8 These were all unconfirmed Greenock workers identified data file but not original from the 10% sample check. These records were checked for data file accuracy between point of data entry and final data file. Note
these unconfirmed Greenock workers were not included in the analysis file. Final data file valid.
1Two cases had both discrepancies in names and employment records
Checking of computer files
All relevant files where checked. Two errors were found. In one of the cases a variable was considered to be inappropriately labelled. This was changed, although had no bearing on any analysis or results. The other error was the entry of a 3 digit ICD code rather than a 4 digit ICD code. This was coding for an associated cause of death and not an underlying cause of death and therefore had no impact on the results. The code was corrected to a 4 digit ICD code.
86

Check of investigation logic and assumptions
All investigation logic and assumptions within investigation documentation were checked. A query was raised over handling stop dates in cancer registration analysis in OCMAP. In the analysis cancer registrations ceased being at risk of cancer after registration which is incorrect as second primary cancers can occur. This was investigated and an analysis performed with the inclusion of these additional person years at risk. This had little impact on the results given the additional person years at risk was very small. Note this resulted in a negligibly small overestimation of risk for the SRR analyses. Unfortunately, the OCMAP program was unable to accommodate this modification with the more sophisticated latency analysis required in the full SRR analyses. However, given this change was demonstrated to have negligible effects on the results of the SRR analysis it was considered acceptable to maintain the methods employed. All other investigation logic and assumptions, and their implementation were deemed to be appropriate and valid.
CONCLUSION
A query was raised over cancer registration analysis in OCMAP relating to at risk status after cancer registration. This was explored and found to have no impact on results.
No major implementation errors were found, although one associated cause of death was found to be recorded as a 3 digit ICD rather than 4 digit which was corrected.
All input cancer registration and death data was accurately input. Information in records containing such outcomes were thoroughly scrutinised and shown to be valid.
87

APPENDIX 11 – WORKER RESULTS LEAFLET
HSE INVESTIGATION OF CONCERNS ABOUT CANCER AMONGCURRENT AND FORMER WORKERS AT NATIONAL SEMICONDUCTOR
(UK) LTD, GREENOCK
WHY WAS THE INVESTIGATION DONE?
Some people believe that working at National Semiconductor UK (NSUK) has caused an increased risk of cancer for people who have worked there.
There is very little scientific evidence about cancer risks in the semiconductor industry. So the Health and Safety Executive (HSE) decided to carry out an investigation.
The main aim was to establish - as quickly as possible - some facts about cancer in current and previous workers at NSUK. But we also made sure we could carry out a more detailed investigation if this was needed as a result of what we found.
Both the management and workers at NSUK agreed to co-operate with the investigation.
HOW DID HSE CARRY OUT THE INVESTIGATION?
We agreed our plan with a group of independent Scottish experts (the Scientific Steering Committee) and the local medical research ethics committee.
NSUK provided information about current and former employees at the Greenock plant. We used this information to find out which workers had died or developed cancer since starting work at the plant.
We compared the number of cases and types of cancer that actually occurred within the Greenock workforce with the number and types of cancer that would be expected based on Scottish data.
88

WHAT DID WE FIND AND WHAT DOES IT MEAN?
The investigation covered about 4500 current and former employees, about equal numbers of men and women. For these people we found:
��The total number of women who have died (from all causes) is slightly fewer than expected; the number of men who have died is substantially fewer than expected.
��The total number of cancer cases in women and men is about the same as expected.
��There were 11 cases of lung cancer in women, two to three times as many as expected – a significant finding that raises the possibility of a work-related cause. However, some of the detailed findings for lung cancer argue against this possibility, and other factors unrelated to the workplace must be carefully considered as well. For instance information on smoking was not available to our investigation. Even so, we must treat this finding seriously.
��There were three cases of stomach cancer in women - four or five times as many as expected. Because of the small number of cases we are less confident of the significance of this finding. As with lung cancer, some of the detailed findings for stomach cancer argue against the possibility of workplace cause, and we have no information on other possible causes such as diet. However, we still cannot exclude the possibility of a work-related cause.
��There were two cases of lung cancer in men, about half as many as expected, and no cases of stomach cancer.
��There were 20 cases of breast cancer in women - about 1.3 times as many as expected (5 more actual cases than expected). A number of factors such as the age at which women first become pregnant can affect the risk of breast cancer. Further work is required before we can say anything more about this finding.
��There were three deaths from brain cancer in men - about four times as many as expected. There were four cases of brain cancer altogether. This is probably not work-related, but the possibility cannot be entirely ruled out.
��None of the other cancers we investigated produced any evidence of important excesses.
In summary:
The current findings, though inconclusive, reinforce concern about cancer in the workforce at NSUK in Greenock.
They raise the possibility of a work-related cause for some of these cancers, particularly lung cancer, but there is no proof that working at NSUK has caused an increased risk of employees developing cancer.
Further research is needed before we will be able to reach more definite conclusions about whether or not workplace factors are playing a role in causing some of the cancers that have occurred.
89

WHAT SHOULD YOU DO NOW?
You and your management should pay particular attention to following fully all of the health and safety rules and procedures necessary for your work.
If you have any questions about this investigation, you and your relatives can ring our confidential freephone help line, details of which are at the end of this leaflet.
The Health and Safety staff at NSUK will be available to advise current and former employees. If you wish to use this offer of support the telephone number is 01475 655444
There is no need to consult your GP about the results of this study. However, as ever, if you have any specific concerns about your health, then you should contact your GP. All GPs and NHS Health Boards in Scotland have been informed about the findings of our investigation.
WHAT WILL HSE DO NOW?
HSE inspectors have already started discussions with NSUK to ensure that the necessary controls are in place and to consider if any additional precautions are necessary. We will carry out a fuller review in conjunction with management and worker representatives as soon as possible. This will be part of a full review of current working practices and controls in the semiconductor industry across Great Britain.
We will want to look more closely at the work done by the people who developed lung, stomach, breast and brain cancers. We will also gather as much information as we can about possible non-workplace factors. This should help towards finding out if there is any connection between the work being done and the risk of developing cancer.
We will need to speak to you and the NSUK management to explain how this research will be carried out and get agreement to it. We will also seek ethical approval and ask the Scientific Steering Committee to monitor the work.
We will be giving very high priority to this work. We are not yet sure how long it will take but we will tell you more as these plans are developed. At the moment we think it would be completed within twelve months of the time when all the agreements are in place.
If these cancers are due to workplace factors, then we might expect to see similar findings in other semiconductor companies. Knowing whether or not this is the case would help everyone understand our findings better. Therefore, we will also be recommending to the rest of the industry in Great Britain that an industry-wide investigation of the same type as the one reported here should be undertaken. This investigation should also be done by independent investigators.
HOW CAN I FIND OUT MORE?
Copies of the technical report are available from NSUK management. The report can also be found on the HSE web site at: http://www.hse.gov.uk/statistics/nsukrept.pdf
90

Also, you and your family can ring the HSE’s confidential freephone line.
CONFIDENTIAL FREEPHONE HELPLINE
For information about the report and its findings, or for help and advice if you are worried, call:
0800 592450
91

Prepared by the Health and Safety Executive C5 12/01

ISBN 0-7176-2144-8
780717621446£7.50 9