cancer 07
TRANSCRIPT

8/8/2019 Cancer 07
http://slidepdf.com/reader/full/cancer-07 1/9
Increased Risk of Oral Cancer in Relation to Common
Indian Mitochondrial Polymorphisms andAutosomal GSTP1 Locus
Sayantan Datta, MSc
Mousumi Majumder, MSc
Nidhan K. Biswas, MSc
Nilabja Sikdar, PhD
Bidyut Roy, PhD
Human Genetics Unit, Indian Statistical Institute,
Kolkata, India.
BACKGROUND. Polymorphisms at mitochondrial (mt) loci could modulate the risk
of diseases including cancers. Here the mtDNA polymorphisms at 12,308 nucleo-
tide pairs (np), 11,467 np, 10,400 np, and 10,398 np were studied to examine the
association with the risk of oral cancer and leukoplakia, alone and in combina-
tion with polymorphisms at the GST loci.
METHODS. Polymorphisms at mt loci were screened in 310 cancer, 224 leukopla-kia, and 389 control individuals by polymerase chain reaction (PCR) restriction
length polymorphism (RFLP) and most of the GST genotype data were taken
from previously published reports. Data were analyzed to determine the risk of
the diseases.
RESULTS. The major allele, A, at 12,308 np on tRNA Leu (CUN), increased the risk
of cancer (odd ratio [OR] of 1.7; 95% confidence interval [95% CI], 1.1–2.6) but
not that of leukoplakia. The same allele also appeared to increase the risk of can-
cer in smokers (OR of 4.0; 95% CI, 1.1–14.4), who are mostly males (OR of 1.8;
95% CI, 1.1-3-2), but not in smokeless tobacco users, who are mostly females.
The major allele A at 11467 np demonstrated identical results as the major allele,
A, at 12,308 np. The major alleles G at 10,398 np and T at 10,400 np (ie, M-hap-
logroup) increased the risk of cancer significantly in smokers (OR of 2.6; 95% CI,
1.2–5.7 and OR of 2.4; 95% CI, 1.1–5.1, respectively). The risk-risk genotype-allele
combination at GSTP1 and mt12308 np loci increased the risk of cancer (OR of
2.6; 95% CI, 1.4–4.9) when compared with the nonrisk-nonrisk combination in
leukoplakia patients.
CONCLUSIONS. Polymorphisms at the mt loci alone and in combination with the
risk genotype at GSTP1 increased the risk of oral cancer. Thus, risk genotypes
from 2 different organelles may work in combination to increase the risk of oral
cancer. Cancer 2007;110:1991–9.Ó 2007 American Cancer Society.
KEYWORDS: tobacco use, oral cancer risk, mitochondrial loci, GSTP1, polymorph-
isms.
The human mitochondrial (mt) genome is a circular DNA of 16,569 nucleotide pairs (np) and each cell contains 50 to 1000
copies of mitochondria. Instability at mtDNA, including mutations
and deletions, has been reported in neurodegenerative diseases,
sudden infant death syndrome, aging and longevity, and cancer.1–6
Apart from mutations, polymorphisms at mtDNA also act as modu-
lating factors for aging and longevity and risk of various diseases
including cancer.7–9 Mitochondrial polymorphisms could be desig-
nated as different related haplogroups, which are population-speci-
fic. Of the 4 African haplogroups L0, L1, L2, and L3, L3 is the only
haplogroup that has spread outside Africa and all the modern-day
The Department of Science and Technology of
the Government of India provided partial financial
support for this work.
Ms. M. Majumder is an SRF funded by Lady Tata
Memorial Trust, Mumbai, India.
Mr. S. Datta and Mr. N.K. Biswas are fellows
funded by C.S.I.R., New Delhi, India.
Nilabja Sikdar‘s current address: National Human
Genome Research Institute, Bethesda, Maryland.
We thank the study participants and Professor
Partha P. Majumder for suggestions and Drs.Ranjan R. Paul, S. Datta, Sk. A. Mahmud, and
Shalini Gupta for patient diagnoses. We also
thank Mr. Badal Dey for technical help during
resequencing.
Address for reprints: Bidyut Roy, PhD, Human
Genetics Unit, Indian Statistical Institute, 203 B.
T. Road, Kolkata 700108, India; Fax: (011) 033
2577–3049; E-mail: [email protected]
Received March 29, 2007; revision received May
16, 2007; accepted June 19, 2007.
ª 2007 American Cancer Society
DOI 10.1002/cncr.23016Published online 20 September 2007 in Wiley InterScience (www.interscience.wiley.com).
1991
8/8/2019 Cancer 07
http://slidepdf.com/reader/full/cancer-07 2/9
haplogroups are derived from L3. The L3 has been
divided into 2 macro haplogroups, M and N. The N
haplogroup is identified by the loss of a DdeI site at
10,397 because of G10398A transition. The M hap-
logroup, mostly observed in the Indian population, is
identified by 2 transitions, A10398G and C10400T , which result in the creation of an AluI site in the
ND3 gene. The second most common haplogroup
found among Indians is haplogroup U, which
belongs to the N haplogroup lineage. The U
haplogroup is identified by A12308G transition in
tRNA Leu (CUN). A transition in the ND4 gene at
A11467G , which causes loss of the TruI1 site, has
also been used as a U haplogroup marker.
The human mt genome encodes 13 of more than
80 polypeptide subunits of the mt respiratory chain
complexes and contains 24 additional genes for
RNAs required for mt protein biosynthesis. These
include 2 rRNA genes and 22 tRNA genes, 1 for eachof 18 amino acids, and 2 each for tRNA Leu (which
read UUR and CUN codons) and tRNA Ser (which
read UCN and AGY codons).10 Of the 22 mitochon-
drial tRNAs, the single most used tRNA (%14.9%) for
mitochondrial protein synthesis is tRNA Leu (CUN).11
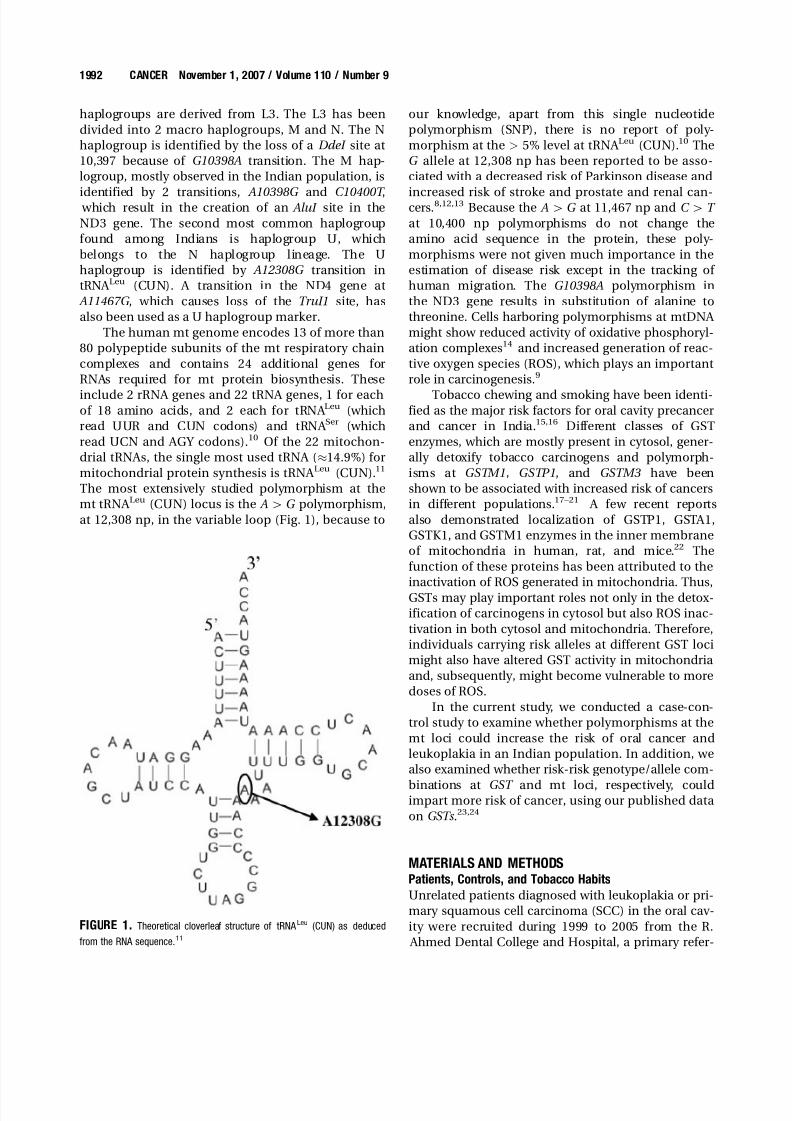
The most extensively studied polymorphism at the
mt tRNA Leu (CUN) locus is the A[G polymorphism,
at 12,308 np, in the variable loop (Fig. 1), because to
our knowledge, apart from this single nucleotide
polymorphism (SNP), there is no report of poly-
morphism at the > 5% level at tRNA Leu (CUN).10 TheG allele at 12,308 np has been reported to be asso-
ciated with a decreased risk of Parkinson disease and
increased risk of stroke and prostate and renal can-cers.8,12,13 Because the A[G at 11,467 np and C [ T
at 10,400 np polymorphisms do not change the
amino acid sequence in the protein, these poly-
morphisms were not given much importance in the
estimation of disease risk except in the tracking of
human migration. The G10398A polymorphism in
the ND3 gene results in substitution of alanine to
threonine. Cells harboring polymorphisms at mtDNA
might show reduced activity of oxidative phosphoryl-
ation complexes14 and increased generation of reac-
tive oxygen species (ROS), which plays an important
role in carcinogenesis.9
Tobacco chewing and smoking have been identi-fied as the major risk factors for oral cavity precancer
and cancer in India.15,16 Different classes of GST
enzymes, which are mostly present in cytosol, gener-
ally detoxify tobacco carcinogens and polymorph-
isms at GSTM1, GSTP1, and GSTM3 have been
shown to be associated with increased risk of cancers
in different populations.17–21 A few recent reports
also demonstrated localization of GSTP1, GSTA1,
GSTK1, and GSTM1 enzymes in the inner membrane
of mitochondria in human, rat, and mice.22 The
function of these proteins has been attributed to the
inactivation of ROS generated in mitochondria. Thus,
GSTs may play important roles not only in the detox-
ification of carcinogens in cytosol but also ROS inac-
tivation in both cytosol and mitochondria. Therefore,
individuals carrying risk alleles at different GST loci
might also have altered GST activity in mitochondria
and, subsequently, might become vulnerable to more
doses of ROS.
In the current study, we conducted a case-con-
trol study to examine whether polymorphisms at the
mt loci could increase the risk of oral cancer and
leukoplakia in an Indian population. In addition, we
also examined whether risk-risk genotype/allele com-
binations at GST and mt loci, respectively, couldimpart more risk of cancer, using our published data
on GSTs .23,24
MATERIALS AND METHODSPatients, Controls, and Tobacco Habits
Unrelated patients diagnosed with leukoplakia or pri-
mary squamous cell carcinoma (SCC) in the oral cav-
ity were recruited during 1999 to 2005 from the R.
Ahmed Dental College and Hospital, a primary refer-
FIGURE 1. Theoretical cloverleaf structure of tRNA Leu (CUN) as deduced
from the RNA sequence.11
1992 CANCER November 1, 2007 / Volume 110 / Number 9

8/8/2019 Cancer 07
http://slidepdf.com/reader/full/cancer-07 3/9
ral center at Kolkata, India. For all patients, the
Department of Pathology from the same hospital
performed histopathologic diagnosis of the lesions. A
small fraction of the patients (%3%) without
any tobacco habits were excluded from this study.
Unrelated controls who came for treatment of dentalailments but without any previous and present
lesions in the oral cavity were recruited from the
same hospital. Initially, 340 cancer patients were
approached, 326 of whom (96%) agreed to partici-
pate. Finally, 310 cancer patients (95% of the partici-
pants) donated blood for the study. In the case of
318 leukoplakia patients, 264 (83%) agreed to partici-
pate in this study and 224 leukoplakia patients (85%
of the participants) agreed to donate blood. Approxi-
mately 665 controls were approached, 525 of whom
(79%) agreed to participate in this study and 389
individuals (74% of the participants) came forward
for blood donation. After obtaining informed writtenconsent, all patients and controls were personally
interviewed to obtain information regarding age, sex,
occupation, alcohol consumption, type of tobacco
habits, daily tobacco use frequency, duration of
habits, economic status, place of job, and food
habits.
All controls in this study were current tobacco
users but all patients had tobacco habits before diag-
nosis. Some patients and controls reported tobacco
habits such as smoking cigarettes and/or bidis , a
native cigarette-like stick of coarse tobacco hand-
rolled in a dry tembuhurni leaf. Individuals with only
a smoking habit are termed smokers. Some of the
patients and controls had a habit of smokeless
tobacco in the form chewing or dipping.23 Indivi-
duals having only a tobacco chewing/dipping habit
are termed smokeless tobacco users. The remaining
patients and controls had both smoking and chew-
ing/dipping habits simultaneously and are termed
‘mixed’ habituees. Lifetime smokeless tobacco expo-
sure was measured in terms of the frequency of
chewing/dipping per day multiplied by the duration
of habit. This is termed the chewing-year (CY; taking
smokeless tobacco once a day for 1 year 5 1 CY).
Similarly, the dose of tobacco smoking was measuredas pack-years (PY): 1 pack per day for 1 year 5 1 PY
(1 pack 5 20 cigarettes or 40 bidis , because the
tobacco content of 1 cigarette [700–1000 mg] is
nearly equal to that present in 2 bidis [850–1050
mg]).
Sample Collection and Processing
Approximately 3.0 mL of blood was collected by vein
puncture from patients (310 cancer patients and 224
patients with leukoplakia) and controls (n 5 389)
and stored at 2208C until DNA was isolated by the
salt precipitation method.25 DNA was also isolated
from the affected tissues of a subset of leukoplakia
(n 5 30) and cancer (n 5 30) patients. This prepara-
tion contained both nuclear and mtDNA. Biopsy
materials collected from all leukoplakia and cancerlesions were processed for histopathology.
Genotyping at mt and Autosomal Loci
G10398A and C10400T
DNA samples were polymerase chain reaction (PCR)-
amplified using primers located between 10,284–
10,306 np (forward) and 10,484–10,459 np (reverse)
followed by digestion with DdeI and AluI at 378C,
separately. On resolving the DdeI -digested products
in a 2% agarose gel, the 10,398 A allele gave rise to
bands of 128 base pairs (bp) and 73 bp, whereas the
10,398G allele demonstrated bands of 90 bp, 73 bp,and 38 bp. On resolving the AluI -digested products,
the 10400C allele demonstrated a single band of 201
bp, whereas the 10400T allele demonstrated bands of
115 bp and 86 bp.
A11467G
DNA samples were PCR-amplified using primers
located between 11,319–11,338 np (forward) and
11,963–11,944 np (reverse) followed by digestion with
TruI1 at 658C. On resolving the digested products in
a 2% agarose gel, the 11,467G allele demonstrated
bands of 538 bp, 86 bp, and 21 bp, whereas the11,467 A allele demonstrated bands of 412 bp, 126 bp,
86 bp, and 21 bp.
A12308G
DNA samples were PCR-amplified using forward
primer 50-CTC AAC CCC GAC ATC ATT ACC-30
(12,104–12,124 np) and reverse primer 50-ATT ACT
TTT ATT TGG AGT TGC ACC AAg ATT-30 (12,338–
12,309 np), in which ‘g’ is the mismatched base. This
mismatch created an HinfI site if the G allele is pres-
ent at this SNP.26 The PCR products were digested
with HinfI and resolved in 2% agarose gel. The
12,308 A allele gave rise to 168 bp and 67 bp and the12,308G allele gave rise to 138 bp, 67 bp, and 30 bp
DNA bands.
GSTM1, GSTM3, and GSTP1 (codon 105)
Previously, 310 cancer patients, 197 leukoplakia
patients, and 348 control individuals from the pres-
ent sample pools were genotyped at these loci.23 In
this study, an additional 27 leukoplakia patients and
41 controls were recruited and genotyped using the
same methods.
SNPs at mt Loci and Risk of Oral CA/Datta et al. 1993

8/8/2019 Cancer 07
http://slidepdf.com/reader/full/cancer-07 4/9
Risk Genotypes/Alleles
The GSTM1 homozygous deletion, GSTM3 ( A/A) and
GSTP1 Ile/Ile genotypes were considered as risk
genotypes because these genotypes increased the
risk of leukoplakia and cancer in different popula-
tions.18–21,23,24 Contrary to reports,7,9,12,13 the major A
allele at 12,308 np, G allele at 10,398 np, and T allele
at 10,400 np were considered risk alleles because
they increased the risk of cancer in this population.
Sequencing of PCR Products
Genotypes and alleles at GST and mt loci, respec-
tively, determined by PCR restriction length poly-
morphism (RFLP) or PCR methods were cross-
checked in DNA samples isolated from the blood of
35 controls, 22 leukoplakia patients, and 28 cancer
patients by resequencing (ABI 3100 Genetic Analyzer;
Applied Biosystem, Foster City, Calif) using the re-
spective GST24 and mt primers. However, a different
set of mt primers (forward primer: 12,117-12,138 np,
reverse primer: 12,553-12,533 np) was used for rese-quencing the PCR product for the A12308G locus. In
addition, PCR products synthesized by the mt pri-
mers from DNA isolated from 6 leukoplakia and 15
cancer tissues were also resequenced to check for so-
matic mutation.
Statistical Analysis
The risks of oral cancer and leukoplakia were calcu-
lated as odds ratios (ORs) with 95% confidence inter-
vals (95% CIs) for mt alleles in all and stratified
samples by binary logistic regression, adjusting for
age, sex, and tobacco dose, using the SPSS statistical
software package (SPSS Inc, Chicago, Ill). Chi-square
tests were used for comparison of genotype/allele
frequencies between 2 groups in 2 3 2 tables (degree
of freedom [df] 5 1). The risk of the cancer was also
determined comparing the different risk/nonrisk ge-
notype/allele combinations at GSTs and mt loci in
patients and controls.
RESULTSOn interview, it was revealed that the majority of the
patients and controls (>96%) were ethnically Benga-
lee and belonged to a low-income group (family
income < U.S. $100 per month). All males were
engaged in diverse occupations but with no exposure
to toxic chemicals in the workplace. Most sampled
females were housewives but some also worked as
housemaids. Demographic characteristics and
tobacco and alcohol habits of patient and control
populations are summarized in Table 1. Becauseapproximately 85% of smokers in our samples used
both cigarettes and bidis , data concerning bidi and
cigarette smokers were not analyzed separately. In
control and patient groups, only a few (4%–5%) indi-
viduals consumed alcohol occasionally. Therefore,
alcohol consumption was also not considered in the
analysis.
The sites of oral cavity affected by leukoplakia
were buccal mucosa and commissure area (74%),
buccal mucosa and alveolar sulcus (21%), and ton-
TABLE 1Demography and Tobacco and Alcohol Exposures of Patients and Controls
Subjects and habits
Controls
N 5 389 (%)
Leukoplakia
N 5 224 (%)
P (Leukoplakia
vs Control)
Cancer
N 5 310 (%)
P (Cancer
vs Control)
Sex Male 302 (78) 196 (87) .004 198 (64)<
.0001Female 87 (22) 28 (13) 112 (36)
Age, y MeanÆ SD 49 Æ 12 47 Æ 10 .03 55 Æ 11 <.0001
Range 25–80 25–75 25–88
Tobacco smoking habit Smokers 145 (37) 133 (60) .0001 53 (17) <.0001
Lifetime smoking range, PY 2–90 2–90 2–75
Mean smoking dose Æ SD, PY 31 Æ 18 24 Æ 16 .0006 32 Æ 14* NS
Smokeless tobacco/
chewing habit
Smokeless tobacco users 169 (44) 32 (14) <.0001 176 (57) .001
Lifetime smokeless tobacco using range, CY 12–925 12–420 4–1250
Mean smokeless tobacco dose Æ SD, CY 183 Æ 145 64 Æ 174 .0001 182 Æ 162 NS
Mixed habits Smoking as well as smokeless tobacco habit 75 (19) 59 (26) .05 81 (26) .04
Lifetime smoking, range in PY 2–90 2–80 2–120
Mean smoking dose Æ SD, PY 22 Æ 14 26 Æ 19 NS 25 Æ 16* NS
Lifetime smokeless tobacco use, range, CY 10–600 10–600 10–640
Mean smokeless tobacco dose Æ SD, CY 100 Æ 91 58 Æ 103 .01 106 Æ 88 NS
Alcohol consumer 14 (4) 10 ((4) NS 15 (5) NS
SD indicates standard deviation; PY, pack-year; NS, not significant; CY, chewing-year.
* P 5 .009.
1994 CANCER November 1, 2007 / Volume 110 / Number 9

8/8/2019 Cancer 07
http://slidepdf.com/reader/full/cancer-07 5/9
gue (5%). The majority of the patients had ulcerative
(60%) followed by homogeneous (37%) and nodular
(3%) types of leukoplakia. Fifty-two percent of thecancer sites were buccal mucosa and alveolar sulcus
and the remaining sites were distributed almost
equally among the lip, tongue, retromolar area, and
buccal sulcus. Histopathologically, all malignancies
were diagnosed as SCC of the oral cavity. These
could be classified as well (65%), moderately (17%),
and poorly (18%) differentiated SCC.
In 8% to 10% of samples, alleles and genotypes,
determined by PCR or PCR-RFLP, were also cross-
checked by resequencing and there were no mis-
matches. In addition, mtDNA polymorphisms were
also screened by PCR-RFLP in DNA isolated from
affected tissues in a subset of patients. The SNP al-leles detected in the tissue DNA were identical to
those detected in the blood DNA (Fig. 2). A few mt
PCR products obtained from tissue DNA (6 leukopla-
kia and 15 cancer) were also resequenced and no so-
matic mutation was detected. Thus, the possibility of
somatic mutation at these loci was excluded. All 3
populations exhibited good fit to Hardy-Weinberg
equilibrium at GSTM3 (P 5 .5 for controls, .6 for leu-
koplakia, and .7 for cancer) and GSTP1 (P 5 .7 for
controls, .9 for leukoplakia, and .5 for cancer).
The major 12,308 A allele increased the risk of oral
cancer when compared with controls (OR of 1.7; 95%
CI, 1.1–2.6) and leukoplakia patients (OR of 2.2; 95%
CI, 1.3–3.7) ( Table 2). However, no significant risk of
leukoplakia was observed when the frequencies of this
allele between leukoplakia patients and controls werecompared (OR of 0.8; 95% CI, 0.52–1.18). This allele
also increased the risk of cancer in males (OR of 1.8
[95% CI, 1.1–3.2] and OR of 2.4 [95% CI, 1.3–4.4])
when compared with those in controls and leukoplakia
patients, respectively. Stratification of patients and
controls by types of tobacco habit also revealed that
this allele increased the risk of cancer among smokers
when compared with controls (OR of 4.0; 95% CI, 1.1–
14.4) and leukoplakia patients (OR of 6.3; 95% CI, 1.8–
22.6), but not in smokeless tobacco users and mixed
habituees. However, no dose-response correlation
between the risk of cancer and smoking doses was
observed when the cancer patients and controls with a smoking habit were divided into 2 groups with low
(<19 PY) and high (>19 PY) smoking doses on the ba-
sis of median PY of controls. The reason for this could
be the small sample sizes because of stratification of
smoking doses.
Similar to the major 12,308 A allele, the major A
allele at 11,467 np also demonstrated identical
results when data of patients and controls were
compared (data not shown). This indicates com-
plete linkage disequilibrium between these 2 alleles
as has been reported in other Indian populations.27
Major allele, G , at 10,398 np increased the risk of
cancer marginally in overall samples (OR of 1.4;
95% CI, 1.0–1.9) but significantly (OR of 2.6; 95%
CI, 1.2–5.7) in smokers when compared with those
of controls (Table 3). Similarly, the major T allele at
10,400 np, the M-haplogroup marker, increased the
risk of cancer marginally in overall samples (OR of
1.4; 95% CI, 1.0–2.0) but significantly (OR of 2.4;
95% CI, 1.1–5.1) in smokers when compared with
those in controls. However, neither of the 10398G
and 10400T alleles appeared to increase the risk of
cancer in smokeless tobacco users and mixed habi-
tuees.
Among all GST loci, the risk-risk genotype-allelecombination at GSTP1 and mt12308 np loci, respec-
tively, increased the risk of cancer significantly (OR
of 2.6; 95% CI, 1.4–4.9) in comparison with leukopla-
kia patients carrying a nonrisk-nonrisk (genotype-al-
lele) combination (Table 4). Similarly, the risk-risk
(genotype-allele) combination at GSTP1 and 10,398
np loci, respectively, increased the risk of cancer (OR
of 1.8; 95% CI, 1.1–3.0) in comparison with leukopla-
kia patients carrying the nonrisk-nonrisk (genotype-
allele) combination at these loci.
FIGURE 2. Representative restriction fragment length polymorphism (RFLP)
pattern of G12308A polymorphism. Banding patterns in Lanes 1 and 3
represent G allele in blood and tissue DNA, respectively, from the
same cancer patient. Similarly, banding patterns in Lanes 2 and 4 represent
A allele in blood and tissue DNA, respectively, from another cancer patient.
Lane M in HaeIII digest of phi X174 for size standard. bp indicates base
pairs.
SNPs at mt Loci and Risk of Oral CA/Datta et al. 1995

8/8/2019 Cancer 07
http://slidepdf.com/reader/full/cancer-07 6/9
DISCUSSIONIn India males use both smoking and smokeless
tobacco, whereas females use mostly smokeless
tobacco. Although smokers and smokeless tobacco
users are equally affected by leukoplakia, compara-
tively more male patients, who are mostly smokers,
were present in the leukoplakia rather than the can-
cer population ( Table 1). The reason might be that
leukoplakia is not life-threatening initially, so most
likely the females (mostly smokeless tobacco users)
preferred to avoid the lengthy procedures to report
to the hospital. As a result, females are less repre-
sented in the leukoplakia population.
Unlike earlier studies, in which the minor G al-
lele at mt 12,308 np (ie, U-haplogroup) was positively
associated with various disease phenotypes,12,13 our
TABLE 3Distribution of A and G Alleles at mt 10398np in Patients and Controls and Risk of Cancer
Category of samples Allele
Control
No. (%)
Cancer
No. (%) OR (95% CI) Allele
Leukoplakia
No. (%)
Cancer
No. (%) OR (95% CI)
All samples A 144 (38) 93 (30) Reference A 89 (40) 93 (30) Reference
G 239 (62) 215 (70) 1.4 (1.0–1.9) P 5.05 G 134 (60) 215 (70) 1.5 (1.0–2.2) P 5 .05
Total 383 ( 308 ( Total 223 ( 308 (
Tobacco habit
Smokers A 54 (37) 10 (19) Reference A 58 (44) 10 (19) Reference
G 91 (63) 43 (81) 2.6 (1.2–5.7) P 5.02 G 75 (56) 43 (81) 3.6 (1.6–8.3) P 5 .002
Total 145 ( 53 ( Total 133 ( 53 (
Smokeless tobacco users A 63 (38) 54 (31) Reference A 15 (47) 54 (31) Reference
G 104 (62) 121 (69) 1.4 (0.9–2.2) G 17 (53) 121 (69) 2.1 (0.9–4.5)
Total 167 ( 175 ( Total 32 ( 175 (
Mixed habits A 27 (38) 29 (36) Reference A 16 (28) 29 (36) Reference
G 44 (62) 51 (64) 1.0 (0.5–2.0) G 42 (72) 51 (64) 0.5 (0.2–1.2)
Total 71 ( 80 ( Total 58 ( 80 (
OR indicates odds ratio; 95% CI, 95% confidence interval.The OR and 95% CI were adjusted for age, sex, and tobacco dose.
TABLE 2Distribution of A and G Alleles at mt12308np in Patients and Controls and Risk of Cancer
Category of
samples Allele
Control
No. (%)
Cancer
No. (%) OR (95% CI) Allele
Leukoplakia
No. (%)
Cancer
No. (%) OR (95% CI)
All samples G 71 (18) 37 (12) ReferenceG
50 (22) 37 (12) Reference A 312 (82) 271 (88) 1 .7 (1.1–2.6), P 5 .02 A 173 (78) 271 (88) 2.2 (1.3–3.7), P 5 .004
Total 383 ( 308 ( Total 223 ( 308 (
Sex
Male G 57 (19) 23 (12) Reference G 45 (23) 23 (12) Reference
A 241 (81) 173 (88) 1 .8 (1.1–3.2) P 5 .03 A 150 (77) 173 (88) 2.4 (1.3–4.4) P 5 .005
Total 298 ( 196 ( Total 195 ( 196 (
Female G 14 (16) 14 (13) Reference. G 5 (18) 14 (13) Reference
A 71 (84) 98 (87) 1.5 (0.7–3.5) A 23 (82) 98 (87) 1.9 (0.6–6.1)
Total 85 ( 112 ( Total 28 ( 112 (
Tobacco habit
Smokers G 26 (18) 3 (6) Reference G 35 (26) 3 (6) Reference
A 119 (82) 50 (94) 4.0 (1.1–14.4) P 5.03 A 98 (74) 50 (94) 6.3 (1.8–22.6) P 5 .004
Total 145 ( 53 ( Total 133 ( 53 (
Smokeless tobacco users G 28 (17) 24 (14) Reference G 5 (16) 24 (14) Reference
A139 (83) 151 (86) 1 .3 (0.7–2.4)
A27 (84) 151 (86) 1.3 (0.4–3.8)Total 167 ( 175 ( Total 32 ( 175 (
Mixed habits G 17 (24) 10 (12) Reference G 10 (17) 10 (12) Reference
A 54 (76) 70 (88) 2.1 (0.9–5.1) A 48 (83) 70 (88) 1.1 (0.4–3.1)
Total 71 ( 80 ( Total 58 ( 80 (
OR indicates odds ratio; 95% CI, 95% confidence interval.The OR and 95%CI were adjusted for age, sex (except when the samples were stratified by sex), and tobacco dose. Few DNA samples from patients and
controls failed to amplify upon repeated attempts so they were excluded.
1996 CANCER November 1, 2007 / Volume 110 / Number 9

8/8/2019 Cancer 07
http://slidepdf.com/reader/full/cancer-07 7/9
study revealed that the major A allele is positively
associated with oral cancer risk when compared with
controls and leukoplakia patients (Table 2). A recentstudy also reported a negative association between
minor G allele and the risk of stroke in a Caucasian
population.28 Thus, it is observed that both the ‘ A’ and
‘G ’ alleles at 12,308 np could act as risk factors for dif-
ferent diseases. In this population, major allele G at
10,398 np increased the risk of oral cancer (Table 3).
In another study,9 minor ‘ A’ allele at 10,398 np (ie, N-
haplogroup) increased the risk of breast cancer in an
African-American population but somatic mutation
from A to G allele was also observed in thyroid carci-
noma from a European population.29 Thus, these
observations suggest that both alleles at few SNP sitescould also act as risk factors for different diseases.
The A12,308G polymorphism is located in the variable
loop next to the anticodon stem of tRNA Leu (CUN)
(Fig. 1). A report also suggested that mutation at a
nearby position, 12,311 np, in the variable loop of
tRNA Leu (CUN) could be a causative factor for chronic
progressive external ophthalmoplegia in Japanese
patients,30 so single nucleotide change in the variable
loop may affect the efficient functioning of tRNA Leu
(CUN). Thus, a slight alteration in the efficiency of
tRNA Leu (CUN) may cause disruption in the mito-
chondrial protein synthesis leading to a decrease in
oxidative phosphorylation and an increase in ROSproduction. Currently, we do not have any biological
evidence or explanation for how these major alleles at
12,308 np and 10,398 np loci could increase the risk
of oral cancer, but it needs to be clarified. Alterna-
tively, it could also be possible that these major alleles
may be a surrogate marker of other risk allele/s which
is/are in linkage disequilibrium. Apart from the major
12308A and 10398G alleles, the M-haplogroup (ie, a
combination of 10398G and 10400T alleles) also
increased the risk of cancer in this population. One
interesting feature is that the risk of cancer is always
more when the data of cancer patients are compared
with those of leukoplakia patients instead of controls(Tables 2 and 3). Leukoplakia is a precancerous lesion
and only 2% to 10% of leukoplakia progress to cancer,15
so the 12308A and 10398G alleles and M-haplogroup
may be a few of those germline polymorphisms that
increase the chance of leukoplakia developing into
cancer.
One interesting observation is that the major
12308A allele increased the risk of cancer in males
who had mostly a smoking habit (70%, 96%, and
66% of males in the control, leukoplakia, and cancer
populations, respectively) but not in females, who
had mostly a smokeless tobacco habit (98%, 89%,and 99% of females in the control, leukoplakia, and
cancer populations, respectively), although the dis-
tribution of A and G alleles at 12,308 np is similar
in males and females of the control population
(Table 2). These observations suggest that smokers,
but not smokeless tobacco users, are susceptible to
cancer in the presence of the 12308A allele. However,
this observation should be reconfirmed in large In-
dian male samples with smoking or smokeless
tobacco habits and European populations in which
both males and females are mostly smokers. One of
the reasons why the 12308A allele that increased the
risk of oral cancer in males persisted in this popula-tion may be that males are susceptible to this allele
but females, who are not susceptible, transmit
mtDNA. Hence, the 12308A allele was insulated
against selection in the males. Mt alleles did not
increase the risk of cancer in mixed habituees
(Tables 2 and 3), although they had both tobacco
smoking and chewing habits. Because the types and
amounts of carcinogens present in tobacco used for
smoking and chewing are different,31 we could not
compare the total dosage of carcinogens in smokers
TABLE 4Distribution of Genotype/Allele Combinations at GSTP1 and mt12308np Loci and Risk of Cancer
Risk/Nonrisk
(Genotype/Allele)
combinations at
Control
No. (%)
Cancer
No. (%)
Crude OR
(95% CI)
Leukoplakia
No. (%)
Cancer
No. (%)
Crude OR
(95% CI)
GSTP1- mt 12308
Nonrisk/Nonrisk 28 (7) 20 (7) Reference 28 (13) 20 (7) Reference
Nonrisk/Risk 144 (38) 106 (35) 1.0 (0.5–1.9) 82 (37) 106 (35) 1.8 (0.9–3.4)
Risk/Nonrisk 42 (11) 17 (5) 0.6 (0.2–1.3) 22 (10) 17 (5) 1.1 (0.5–2.5)
Risk/Risk 167 (44) 164 (53) 1.4 (0.7–2.5) 89 (40) 164 (53) 2.6 (1.4–4.9)*
Total 381 ( 307 ( 221 ( 307 (
OR indicates odds ratio; 95% CI, 95% confidence interval.
* P 5 .005.
Few samples had to be excluded because, in some individuals, data regarding both the loci were not available. Therefore, the sample sizes are different from Table 3.
SNPs at mt Loci and Risk of Oral CA/Datta et al. 1997

8/8/2019 Cancer 07
http://slidepdf.com/reader/full/cancer-07 8/9
and mixed habituees. Moreover, the risk of cancer in
smokeless tobacco users/chewers is not modified by
these mt alleles. Therefore, a possible explanation of
why mt alleles could not modify the risk of cancer in
mixed habituees could be less smoking dose in mixed
habituees in comparison to smokers (P 5
.009 formean smoking doses between mixed habituees and
smokers of cancer patients, Table 1).
The GSTM1, GSTP1, and GSTM3 enzymes could
detoxify polyaromatic hydrocarbons present mostly
in tobacco smoke. If the smokers of the 3 popula-
tions were stratified as carriers and noncarriers of at
least 1 risk genotype at any of the GSTM1, GSTM3, or
GSTP1 loci, then distribution of these smokers
among the control, leukoplakia, and cancer popula-
tions was not found to be significantly different
(P 5 .06). However, analysis of the stratified smokers,
who were carrying at least 1 risk genotype at any of
the GSTM1, GSTM3, or GSTP1 loci, as well as the mt12308A allele, demonstrated a risk of cancer when
compared with the respective leukoplakia patients
(OR of 5.8; 95% CI, 1.6–25.3). Thus, the observed risk
of cancer among smokers might be because of the si-
multaneous presence of both 12308A allele and at
least 1 risk genotype at any of the 3 GST loci rather
than the presence of the mt 12308A allele alone (as
shown in Table 2).
It has been reported that the GSTP1 enzyme
could also move to mitochondria and inactivate
ROS.22 Therefore, individuals carrying a risk genotype
at GSTP1 will detoxify fewer carcinogens in cytosol
and less ROS in mitochondria. In this study, the
GSTP1 risk genotype alone could not increase the
risk of oral cancer (OR of 1.0; 95% CI, 0.9–1.0) but
the major A allele at 12,308 np increased the risk of
cancer in overall samples (Table 2). Again, a risk-risk
(genotype-allele) combination at GSTP1 and 12,308
np loci exhibited slightly more (%18%) risk of cancer
in comparison to major A allele at 12,308 np alone
(an OR of 2.2 in Table 2 increased to 2.6 in Table 4).
Similarly, a risk-risk (genotype-allele) combination at
GSTP1 and 10,398 np loci also exhibited slightly
more (%20%) risk of cancer in comparison with G al-
lele at 10,398 np alone. Therefore, it may be possiblethat the mt risk alleles and GSTP1 risk genotype
might have increased the risk of cancer jointly.
In this hospital-based study, controls had dental
ailments such as caries and gingivitis, so selection
bias may occur. Although tobacco dose was adjusted
whenever it was required, secondhand smoke expo-
sure, diet, and other environmental exposures were
not adjusted in our logistic regression models
because of incomplete and missing information.
Although the overall sample sizes were large, there
were comparatively fewer females in the control and
leukoplakia patient populations. Therefore, it is
necessary to repeat a similar study with more female
samples in cases and controls. To our knowledge,
this is the first study to date to demonstrate an asso-
ciation between the risk of oral cancer and a majorallele at the mt tRNA locus independently and also
in combination with polymorphism at nuclear DNA.
REFERENCES1. Jakupciak JP, Wang W, Markowitz ME, et al. Mitochondrial
DNA as a cancer biomarker. J Mol Diagn. 2005;7:258–267.
2. Abnet CC, Huppi K, Carrera A, et al. Control region muta-
tions and the ‘common deletion’ are frequent in the mito-
chondrial DNA of patients with esophageal squamous cell
carcinoma. BMC Cancer . 2004;4:30–37.
3. Wu C, Yin P, Hung W, et al. Mitochondrial DNA mutations
and mitochondrial DNA depletion in gastric cancer. Genes
Chromosomes Cancer . 2005;44:19–28.4. Petros JA, Baumann AK, Ruiz-Pesini E, et al. MtDNA muta-
tions increase tumorigenicity in prostate cancer. Proc Natl
Acad Sci U S A. 2005;102:719–724.
5. Lee HC, Yin PH, Lin JC, et al. Mitochondrial genome
instability and mtDNA depletion in human cancers. Ann N
Y Acad Sci . 2005;1042:109–122.
6. Lee HC, Yin PH, Yu TN, et al. Accumulation of mitochon-
drial DNA deletions in human oral tissues—effects of betel
quid chewing and oral cancer. Mutat Res . 2001;493:67–74.
7. De Benedictis G, Rose G, Carrieri G, et al. Mitochondrial
DNA inherited variants are associated with successful
aging and longevity in humans. FASEB J . 1999;13:1532–
1536.
8. Van der Walt JM, Nicodemus KK, Martin ER, et al. Mito-
chondrial polymorphisms significantly reduce the risk of Parkinson disease. Am J Hum Genet . 2003;72:804–811.
9. Canter JA, Kallianpur AR, Parl FF, Millikan RC. Mitochon-
drial DNA G10398A polymorphism and invasive breast can-
cer in African-American women. Cancer Res . 2005;65:8028–
8033.
10. Vilmi T, Moilanen JS, Finnila S, Majamaa K. Sequence vari-
ation in the tRNA genes of human mitochondrial DNA.
J Mol Evol . 2005;60:587–597.
11. Hao R, Zhao M, Hao Z, Yao Y, Wang E. A T-stem slip in
human mitochondrial tRNA Leu(CUN) governs its charging
capacity. Nucleic Acids Res . 2005;33:3606–3613.
12. Pulkes T, Sweeney MG, Hanna MG. Increased risk of stroke
in patients with the A12308G polymorphism in the mito-
chondria. Lancet . 2000;356:2068–2069.
13. Booker LM, Habermacher GM, Jessie BC, et al. North American white mitochondrial haplogroups in prostate
and renal cancer. J Urol . 2006;175:468–473.
14. Jacobs HT. Disorders of the mitochondrial protein synthe-
sis. Hum Mol Genet . 2003;12:R293–301.
15. Gupta PC, Mehta FS, Daftary DK, et al. Incidence rates of
oral cancer and natural history of oral precancerous
lesions in a 10-year follow-up study of Indian villagers.
Community Dent Oral Epidemiol . 1980;8:287–233.
16. Ferlay J, Bray F, Pisani P, Parkin DM. Cancer incidence,
mortality and prevalence. GLOBOCAN 2002. Worldwide
IARC Cancer Base No. 5, version 2.0. Lyon, France: IARC
Press; 2004.
1998 CANCER November 1, 2007 / Volume 110 / Number 9
8/8/2019 Cancer 07
http://slidepdf.com/reader/full/cancer-07 9/9
17. Jahnke V, Strange R, Matthias C, Fryer A. Glutathione S -
transferase and cytochrome P450 genotypes as a risk fac-
tors for laryngeal carcinoma. Eur Arch Otorhinolaryngol .
1997;254:147–149.
18. Nakajima J, Elovaara E, Anttila S, Hirvonen A, Camus AM,
Hayes JD. Expression of polymorphism of glutathione S -
transferase in human lungs: risk factors in smoking relatedlung cancer. Carcinogenesis . 1995;16:707–711.
19. Yengi L, Inskip A, Gilford J, et al. Polymorphism at the glu-
tathione S -transferase locus GSTM3: interactions with cyto-
chrome P450 and glutathione S -transferase genotypes as
risk factors for multiple cutaneous basal cell carcinoma.
Cancer Res . 1996;56:1974–1977.
20. Jourenkova-Mironova N, Reinikainen M, Bouchardy C,
Dayer P, Benhamou S, Hirvonen A. Larynx cancer risk in
relation to glutathione S -transferase M1 and T1 genotypes
and tobacco smoking. Cancer Epidemiol Biomarkers Prev .
1998;7:19–23.
21. Oude Ophuis MB, Mulder TP, Peters WH, Manni JJ. Plasma
GSTP1-1 levels in patients with head and neck squamous
cell carcinoma. Cancer . 1998;82:2434–2438.
22. Gallagher EP, Gardner JL, Barber DS. Several glutathione S-
transferase isozymes that protect against oxidative injury
are expressed in human liver mitochondria. Biochem Phar-
macol . 2006;71:1619–1628.
23. Majumder M, Sikdar N, Paul RR, Roy B. Increased risk of
oral leukoplakia and cancer among mixed tobacco users
carrying XRCC1 variant haplotypes and cancer among
smokers carrying 2 risk genotypes, 1 on each of GSTM3
and XRCC1 (codon 280). Cancer Epidemiol Biomarkers
Prev . 2005;14:2106–2112.
24. Sikdar N, Paul RR, Roy B. Glutathione S -transferase M3 ( A/
A) genotype as a risk factor for oral cancer and leukoplakia
among Indian tobacco smokers. Int J Cancer . 2004;109:95–
101.
25. Miller SA, Dykes DD, Polesky HK. A simple salting out pro-
cedure for extracting DNA from human nucleated cells.
Nucleic Acids Res . 1988;16:1215.26. Torroni A, Huoponen K, Francalacci P, et al. Classification
of European mtDNAs from an analysis of 3 European
populations. Genetics . 1996;144:1835–1850.
27. Palanichamy MG, Sun C, Agrawal S, et al. Phylogeny of mi-
tochondrial DNA macrohaplogroup N in India, based on
complete sequencing: implications for the peopling of
South Asia. Am J Hum Genetics . 2004;75:966–978.
28. Deschauer M, Chinnery PF, Schaefer AM, Turnbull DM,
Taylor RW. No association of the mitochondrial DNA
A12308G polymorphism with increased risk of stroke in
patients with the A3243G mutation. J Neurol Neurosurg
Psychiatry . 2004;75:1200–1207.
29. Yeh JJ, Lunetta KL, van Orsouw NJ, et al. Somatic
mitochondrial DNA (mtDNA) mutations in papillary thyr-
oid carcinomas and differential mtDNA sequence variants
in cases with thyroid tumors. Oncogene . 2000;19:2060–
2066.
30. Hattori Y, Goto Y, Sakuta R, Nonaka I, Mizuno Y, Horai S.
Point mutations in mitochondrial tRNA genes: sequence
analysis of chronic progressive external ophthalmoplegia
(CPEO). J Neurol Sci . 1994;125:50–55.
31. Hecht SS. Tobacco carcinogens, their biomarkers and
tobacco-induced cancer. Nat Rev Cancer . 2003;3:733–
744.
SNPs at mt Loci and Risk of Oral CA/Datta et al. 1999