canadian housing bubble
DESCRIPTION
This paper explores the subject of a possible housing bubble in Canada. It examines a diverse array of factors that may have contributed to the rise in house prices in Canada. The paper evaluates each factor individually and determines the health of the Canadian housing market using common valuation techniques.Results suggest that economic fundamentals in Canada provide little explanation for the Canadian house price dynamics. Market fundamentals have become insignificant in affecting house prices, and the price-momentum conditions characteristic of a bubble now exist. The extreme decoupling of the market prices from the underlying fundamentals suggests an upcoming correction in housing prices in Canada.TRANSCRIPT
The Elusive Canadian Housing Bubble
FEBRUARY 2010
Alexandre Pestov

Alexandre Pestov February 2010
The Elusive Canadian Housing Bubble Page 1 of 51
ABSTRACT
The cause of the housing bubble associated with the sharp run-up and the subsequent drop in home prices in the
US over the period of 1999-2008 has been the focus of significant research attention. Despite numerous
similarities, the Canadian housing market escapes the same level of interest, mostly due to the seemingly stable
housing prices.
This paper explores the subject of a possible housing bubble in Canada. It examines a diverse array of factors that
may have contributed to the rise in house prices in Canada. The paper evaluates each factor individually and
determines the health of the Canadian housing market using common valuation techniques.
Results suggest that economic fundamentals in Canada provide little explanation for the Canadian house price
dynamics. Market fundamentals have become insignificant in affecting house prices, and the price-momentum
conditions characteristic of a bubble now exist. The extreme decoupling of the market prices from the underlying
fundamentals suggests an upcoming correction in housing prices in Canada.
Please direct all inquiries regarding this paper to [email protected].
Alexandre Pestov February 2010
The Elusive Canadian Housing Bubble Page 2 of 51
TABLE OF CONTENTS
Abstract ..................................................................................................................................................................................................... 1
1 Introduction .......................................................................................................................................................................................... 3
2 Cost of Borrowing .............................................................................................................................................................................. 5
Section Summary ................................................................................................................................................................................ 9
3 Housing (un)Affordability ................................................................................................................................................................ 11
Section Summary .............................................................................................................................................................................. 14
4 The US and Canada – Not As Different As They Appear ...................................................................................................... 15
Section Summary .............................................................................................................................................................................. 19
5 CMHC - The Postponed Crisis ..................................................................................................................................................... 21
Section Summary .............................................................................................................................................................................. 26
6 Recession - A Peculiar Case of Rising Prices and Volumes .................................................................................................... 28
Section Summary .............................................................................................................................................................................. 34
7 Fundamental Valuation ..................................................................................................................................................................... 36
Section Summary .............................................................................................................................................................................. 42
8 Parting Words .................................................................................................................................................................................... 43
References .............................................................................................................................................................................................. 48
Data Resources ................................................................................................................................................................................ 48
Books .................................................................................................................................................................................................. 49
On-Line Sources............................................................................................................................................................................... 49
Formulas ............................................................................................................................................................................................. 51
Revisions .................................................................................................................................................................................................. 52
1.01 ...................................................................................................................................................................................................... 52
Alexandre Pestov February 2010
The Elusive Canadian Housing Bubble Page 3 of 51
1 INTRODUCTION
A financial bubble is defined as trade in high volumes at prices that are considerably at variance with intrinsic values
(King, Ronald R.; Smith, Vernon L.; Williams, Arlington W. and van Boening, Mark V., 1993). In the late 2000s, the
Canadian housing market has exhibited both high volumes and prices that are considerably at variance with
intrinsic values. Yet, the Canadian public remains on an ever-increasing buying spree with condo buildings in
Vancouver and Toronto being 70 percent sold out by the end of the first weekend after being available for sale. Is
there a bubble or is there not?
This is a question that has been debated for several years now. Both opponents and proponents of the housing
bubble notion put forth facts and estimates to argue their cases. This debate will continue until either housing
prices firmly stabilize at a certain level or plunge.
A critical look at the state of the housing market in Canada signals a growing bubble that is about to burst. This
paper is structured in a way that covers the most important points pertaining to the current situation. It is not
written to represent formal academic research, but it is designed to motivate readers to take an impartial look at
the housing market and reassess it using the facts.
Much of this paper builds on primary research conducted in the Toronto area. Many individuals of different
backgrounds were surveyed and interviewed for the purposes of constructing this document. The primary
research helped to identify several common themes and misconceptions that exist amongst the Canadian public.
The key objective of this paper is to address them along with presenting factual information that will show the
current state of the housing market in Canada.
The paper uses the following structure to discuss these matters:
- “Cost of Borrowing”. This section builds on the primary research conducted for the purposes of this paper
and examines the key items of interest rates and mortgage payments.
Section objectives: o To clarify any misconceptions about the future directions of the interest rate
o To illustrate the significance of rising mortgage rates on mortgage payments
o To explain the impact of rising rates on the borrowers with short-term mortgages in the current
interest rates environment
- “Housing Affordability” section provides a glimpse of the current state of housing affordability in Canada,
draws historical parallels with the housing bubble of the late 1980s and compares recent surges in housing
prices in four major Canadian cities to the mean household income.
Section objectives: o To contrast the present affordability of the Canadian housing to the historical norms
o To compare current housing prices in Canada to the peak of the real-estate bubble of the late
1980s
o To show the widening gap developing between housing prices and mean household income
- The “US and Canada” section offers a direct comparison of the housing bubble in the US and Canada.
Section objectives:
o To refute a common myth that the Canadian housing market did not go “too far, too fast”
o To disprove the misconception that the rise in the Canadian housing prices was not as intense as
that of the US, and thus does not constitute a “bubble”
Alexandre Pestov February 2010
The Elusive Canadian Housing Bubble Page 4 of 51
o To counter the views suggesting that other factors, such as housing affordability, are in better
shape in Canada than in the US
- The CMHC (Canada Mortgage and Housing Corporation) part of this document contains a quick peek at
the array of tool used by the Canadian government to temporarily prop up the prices in 2007-2008 and
postpone the housing market collapse to a later date.
Section objectives: o To explain how the housing market collapse was delayed
o To show the tools leveraged in propping up housing prices
o To demonstrate that the delay in bursting the bubble will have significant negative long-term
effects on the Canadian economy
- In the “Recession” section, the subject of mass-madness is covered.
Section objectives:
o To show that Canadians are buying houses they cannot afford
o To illustrate the disregard of fundamental income to price balance
o To expose the increasing leveraging of Canadian households
- Finally, the “Fundamental Valuation” section concludes the message with providing fundamental valuation of
the housing market from the rent to ownership cost perspective.
Section objectives: o To show the absence of support for the current housing prices using various metrics
o To contrast renting and owning in the today‟s environment
o To expose the fallacy of buying a property on the premise of renting it out in an event of a
housing downturn
As mentioned earlier, this paper is intended to motivate readers to examine publicly available information with a
goal of forming an educated opinion about the state of the housing market in Canada. I hope you will find the
information presented in this paper helpful, and I thank you for taking the time to read it.
Alexandre Pestov February 2010
The Elusive Canadian Housing Bubble Page 5 of 51
2 COST OF BORROWING
Real-estate purchasing is a significant event in the lives of many. Land is a finite and scarce resource. It is especially
prominent in developed regions where the attractiveness of local economies and quality of live spurs competition
for prime spots. The demand conditions are reflected in land prices, which are generally substantially higher than
those of any other purchases an average person would make during his lifetime.
Unless a real-estate purchase is financed in full by the savings of the buyer, which is rarely the case in the modern
developed world, a borrowing-lending activity must be involved. As mentioned before, the amount changing hands
is in many cases comparable to the life-time earning potential of the buyer. Five, ten and even twenty-five percent
down payment of a typical real-estate transaction creates a significant leverage of 19:1, 9:1 or 3:1 respectively. High
leverage highlights the need for managing cost of borrowing given that this represents the greater portion of the
funds employed in a real-estate transaction. This type of leveraged purchasing is wrapped in what is commonly
known as a “mortgage”. By definition:
A mortgage is the transfer of an interest in property to a lender as a security for a debt.
Encounters with mortgages are the usual occurrences in daily lives for most adults living in developed countries.
These encounters can be direct – such as borrowing, refinancing, and frequent payments. They can also be indirect
– such as mortgage discussions that appear on the front pages of newspapers or that surface in conversations with
colleagues. Yet, despite the widespread exposure to mortgages, the structure and details of the mortgage concept
are surprisingly poorly understood.
In preparation for this research, I surveyed over 30 individuals from different walks of life. To my amazement,
nearly a half of the current mortgage holders had only a very basic understanding of the mortgage structure or no
understanding at all. Specifically, the lack of knowledge was prominent in discussions about the cost of borrowing
in relation to the mortgage lending rate. Of the 30 mortgage holders interviewed, 15 percent understood
percentage changes in the mortgage lending rate as being applicable to the monthly payment only, rather than the
entire borrowed amount. These individuals viewed an increase of a percent in the mortgage lending rate as a
percent increase to their monthly payment. In their view, a 10 percent increase to the mortgage rate would raise
their monthly payment by the equal 10 percent, and their current hypothetical $2,500 monthly payment would
grow to a mere $2,750. This major fallacy and the very vague understanding of the lending rate-monthly payment
relationship exhibited by another 35 percent of respondents prompted me to dedicate a portion of this paper to
this subject.
The basic annuity formula (References: Formulas) or any mortgage calculator shows that for interest rates
between 4 and 14 percent on a mortgage amortized over 25 years, an increase in lending rate by one percent
would result in an average monthly payment increase of 9 percent.
1 percent change in mortgage lending rate = 9 percent change in monthly mortgage
payment amount
15 percent of my survey respondents expected a10 percent mortgage rate hike to raise their current $2,500
monthly payment to $2,750. The reality is a 10 percent rise in interest rates from 4 to 14 percent on a mortgage
amortized over 25 years will send a $2,500 monthly payment to a stratospheric $5,701 or 128% increase. This is a
truly staggering discovery for those who did not budget for it.
Alexandre Pestov February 2010
The Elusive Canadian Housing Bubble Page 6 of 51
9 to 1 ratio can be advantageous or devastating. Fear it not when the mortgage lending rates are expected to go
down. However, if the rates are to go up, it may spread like wildfire through the ranks of borrowers, scorching
those caught unprepared. So the real burning question here is where are we today? Are the rates expected to go
down, stay flat or rise?
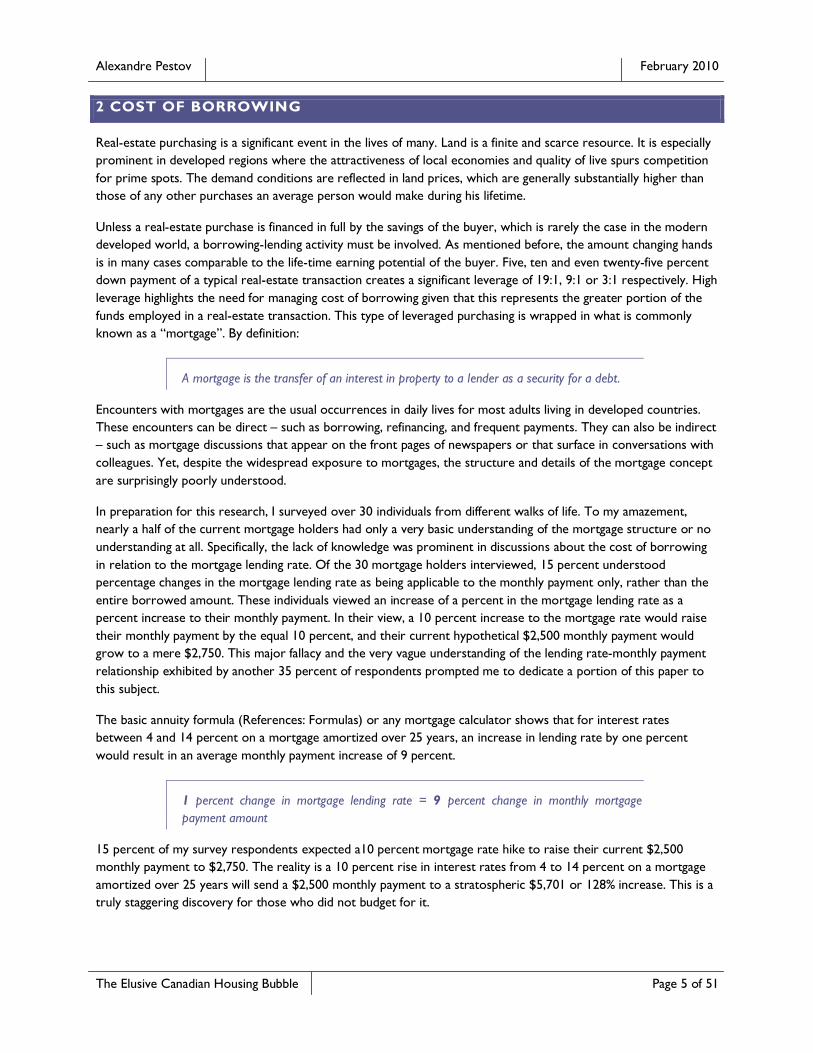
Exhibit 2.1 plots historical mortgage rates reported by the Bank of Canada for December of each year between
1935 and 2009.
Exhibit 2.1: Historical Canadian Bank Rate (1935 to 2009)
Source: Bank of Canada, Department of Monetary and Financial Analysis;
The bank rate is the rate of interest which a central bank charges on the loans and advances that it extends to
commercial banks and other financial institutions. In Canada, the bank rate is defined as the upper limit of the
overnight rate band announced each month by the Bank of Canada. The bank rate determines the relative cost
associated with borrowing capital. By historical standards, borrowing in Canada has never been cheaper - not in
the last 75 years. The only period that came close to the present times in terms of the lending rates was between
1944 and 1948, during the last years of World War II and at the beginning of the post-war reconstruction. Even
then, the rate was kept at 1.5 percent vs. 0.5 percent today.
The present bank rate is 4.8 percent below its 75-year average. It has never been lower in the Bank of Canada‟s
history, and there isn‟t much potential for lowering it any further, unless the Bank of Canada decides to pay
interest to those who borrow from it. The only direction for the bank rate from the current level is up.
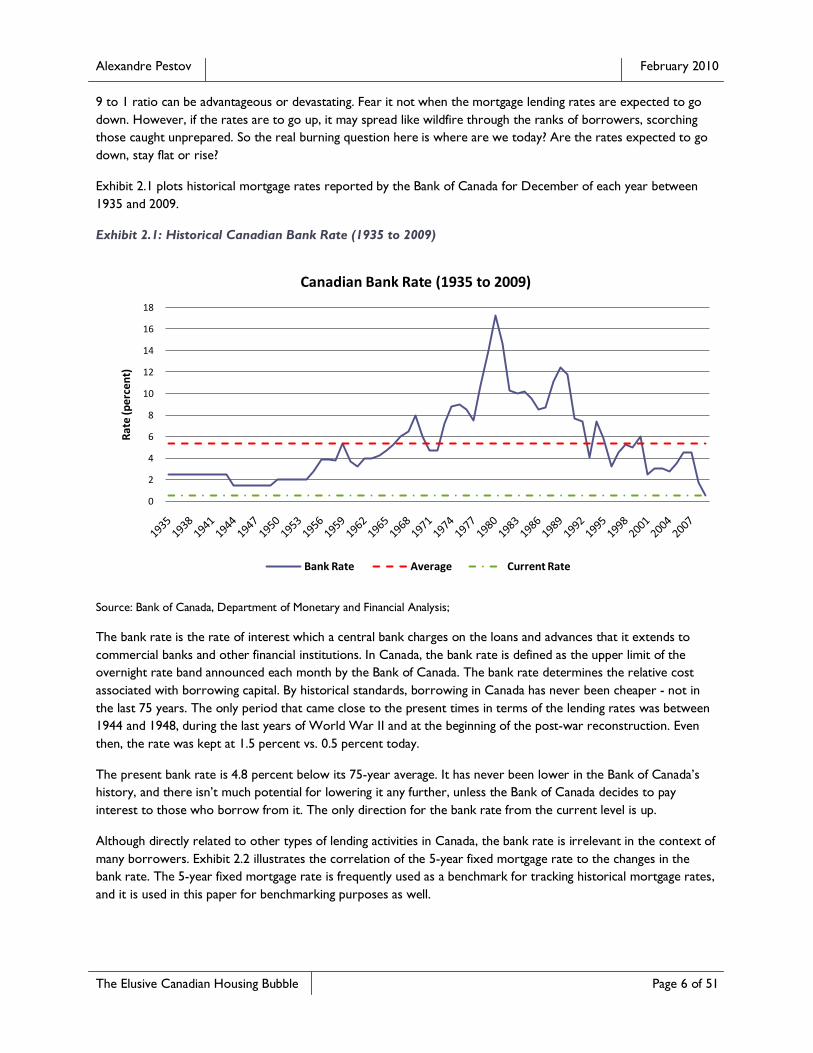
Although directly related to other types of lending activities in Canada, the bank rate is irrelevant in the context of
many borrowers. Exhibit 2.2 illustrates the correlation of the 5-year fixed mortgage rate to the changes in the
bank rate. The 5-year fixed mortgage rate is frequently used as a benchmark for tracking historical mortgage rates,
and it is used in this paper for benchmarking purposes as well.
0
2
4
6
8
10
12
14
16
18
Rat
e (p
erce
nt)
Canadian Bank Rate (1935 to 2009)
Bank Rate Average Current Rate
Alexandre Pestov February 2010
The Elusive Canadian Housing Bubble Page 7 of 51
Exhibit 2.2: Canadian Bank Rate and 5-year Fixed Mortgage Rate (1951 to 2009)
Source: Bank of Canada; Canada Mortgage and Housing Corporation;
From the chart above it can be observed that the bank rate and the 5-year fixed mortgage rates are highly
correlated. Once the bank rate begins its inevitable ascent, the mortgage rates will follow. How far will they go?
Without referring to complex and largely unreliable economic models, the historical data helps to shed some light
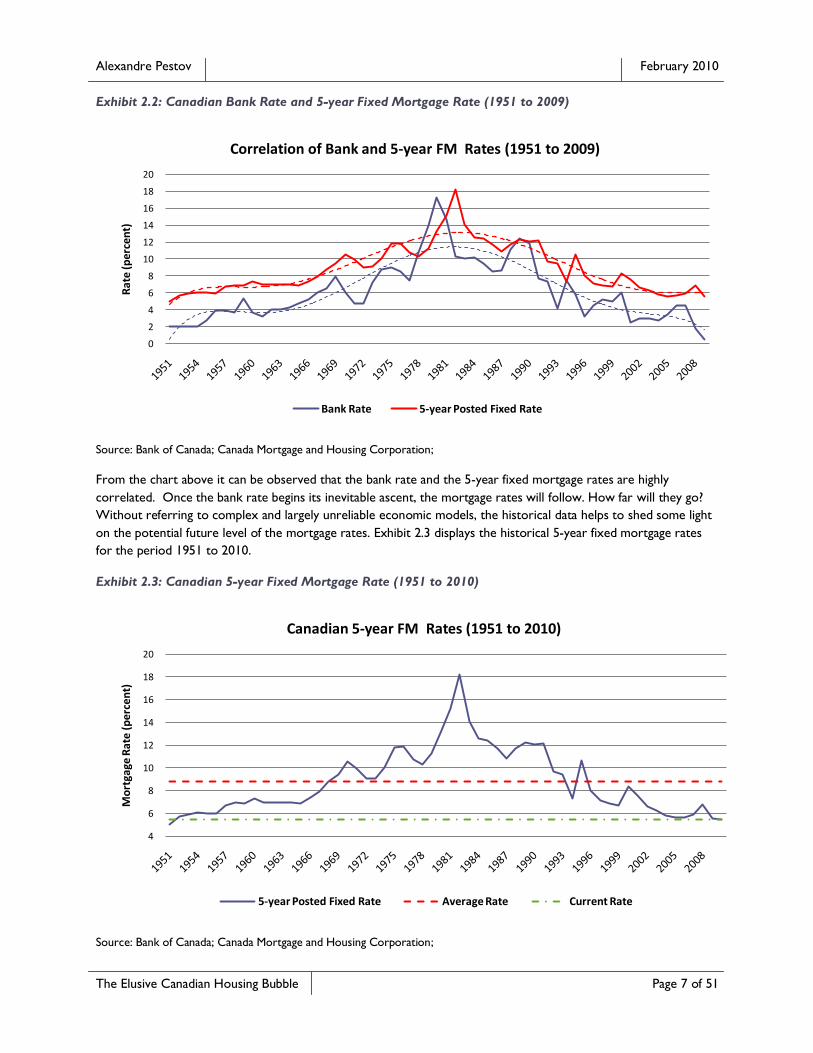
on the potential future level of the mortgage rates. Exhibit 2.3 displays the historical 5-year fixed mortgage rates
for the period 1951 to 2010.
Exhibit 2.3: Canadian 5-year Fixed Mortgage Rate (1951 to 2010)
Source: Bank of Canada; Canada Mortgage and Housing Corporation;
0
2
4
6
8
10
12
14
16
18
20
Rat
e (p
erce
nt)
Correlation of Bank and 5-year FM Rates (1951 to 2009)
Bank Rate 5-year Posted Fixed Rate
4
6
8
10
12
14
16
18
20
Mo
rtga
ge R
ate
(per
cen
t)
Canadian 5-year FM Rates (1951 to 2010)
5-year Posted Fixed Rate Average Rate Current Rate
Alexandre Pestov February 2010
The Elusive Canadian Housing Bubble Page 8 of 51
The following section of the document deals with several examples and scenarios pertaining to mortgages. It must
be noted that this paper uses a typical mortgage amortized over 25 years with payments made monthly, and the
same principal amount for all examples.
Over the last 59 years the 5-year fixed rate mortgage rate averaged at 8.8 percent (Exhibit 1.3). At the time of
writing of this paper, it stood at 5.49 percent. Assuming that the principal amount is the same, the following three
scenarios review different situation pertaining to the possible direction of the bank rate:
- Moderate inflation; bank rate rises to still historically low, but plausible 4 percent
- Average inflation; bank rate reaches its long-term average
- High inflation; bank rate exceeds its long-term average
In the first scenario, the bank rate reaches and stays at a moderate level of 4 percent. From the bank to mortgage
rate correlation and historical evidence, the 5-year mortgage rate would be approximately 7 percent, or 2.5
percent above today`s level. According to the 9 to 1 ratio discussed earlier, a 2.5 percent increase will translate
into approximately 24 percent rise in monthly payments.
The second scenario sends the bank rate to its historical average of 5.3 percent, an increase of 4.8 percent from
today`s levels. The result of such interest rate surge will be an approximate 35 percent hike in the monthly
mortgage bill.
The last scenario deals with a situation deemed impossible in the current environment of gloomy and loud
deflationary talks. Without going into a debate about the eventual effects of uncontrollable money-printing by
central banks globally, let`s assume that the ominous deflationary fears have failed to materialize. Instead, many
major global economies find themselves in a desperate need to react to severe inflationary pressure. Under this
assumption, being part of the global economy, Canada is forced to raise its rates to the above-average 10 percent.
As a result, under the 9 to 1 ratio, the monthly mortgage payments will rise approximately 55 percent.
The question to ask yourself, can you afford paying 25, 35 or even 55 percent more on
your current mortgage?
There is no linear formula to estimating the impact on different households. Another important consideration is
your location on the yield curve.
The yield curve is the relation between the interest rate and the time to maturity of the debt
for a given borrower.
Yield curve is a visualization of the interest rates for loans of different maturities, or the final payment date of a
loan, at which point the principal is due to be paid. Loans with different maturity dates typically carry different
interest rates. If all maturity dates and their corresponding interest rates for any given point in time are plotted on
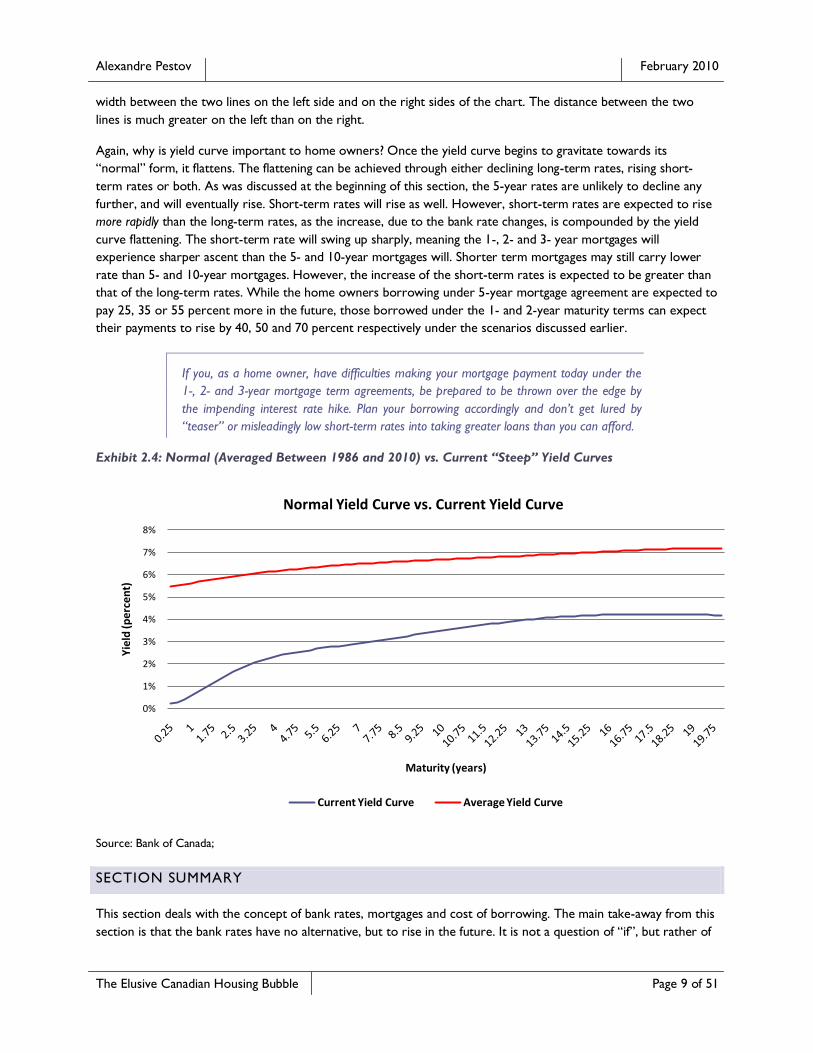
a chart, a yield curve is built. Exhibit 2.4 provides a snapshot of the current yield curve. The left part of the yield
curve encompasses short-term maturities, and is called “short end”. The right part representing maturities with
longer durations is a “long end” of the yield curve.
Why is yield curve important to home owners? A typical, or “normal”, yield curve gradually slopes upwards. In
some cases, the gap between the short-term and long-term rates widens, and the slope of the yield curve becomes
more pronounced. This is called a “steep” yield curve, and it is exactly how the current yield curve looks now. For
a visual comparison of the “normal” and “steep” yield curves please refer to Exhibit 2.4. Please notice the gap
Alexandre Pestov February 2010
The Elusive Canadian Housing Bubble Page 9 of 51
width between the two lines on the left side and on the right sides of the chart. The distance between the two
lines is much greater on the left than on the right.
Again, why is yield curve important to home owners? Once the yield curve begins to gravitate towards its
“normal” form, it flattens. The flattening can be achieved through either declining long-term rates, rising short-
term rates or both. As was discussed at the beginning of this section, the 5-year rates are unlikely to decline any
further, and will eventually rise. Short-term rates will rise as well. However, short-term rates are expected to rise
more rapidly than the long-term rates, as the increase, due to the bank rate changes, is compounded by the yield
curve flattening. The short-term rate will swing up sharply, meaning the 1-, 2- and 3- year mortgages will
experience sharper ascent than the 5- and 10-year mortgages will. Shorter term mortgages may still carry lower
rate than 5- and 10-year mortgages. However, the increase of the short-term rates is expected to be greater than
that of the long-term rates. While the home owners borrowing under 5-year mortgage agreement are expected to
pay 25, 35 or 55 percent more in the future, those borrowed under the 1- and 2-year maturity terms can expect
their payments to rise by 40, 50 and 70 percent respectively under the scenarios discussed earlier.
If you, as a home owner, have difficulties making your mortgage payment today under the
1-, 2- and 3-year mortgage term agreements, be prepared to be thrown over the edge by
the impending interest rate hike. Plan your borrowing accordingly and don’t get lured by
“teaser” or misleadingly low short-term rates into taking greater loans than you can afford.
Exhibit 2.4: Normal (Averaged Between 1986 and 2010) vs. Current “Steep” Yield Curves
Source: Bank of Canada;
SECTION SUMMARY
This section deals with the concept of bank rates, mortgages and cost of borrowing. The main take-away from this
section is that the bank rates have no alternative, but to rise in the future. It is not a question of “if”, but rather of
0%
1%
2%
3%
4%
5%
6%
7%
8%
Yie
ld (
pe
rce
nt)
Maturity (years)
Normal Yield Curve vs. Current Yield Curve
Current Yield Curve Average Yield Curve
Alexandre Pestov February 2010
The Elusive Canadian Housing Bubble Page 10 of 51
“when” and “how much”. The interest rate increase will lead to commensurable increases in mortgage rates. As
mortgage rates go up, the cost of borrowing translated into monthly payments will rise about 10 times faster. The
effects will be more noticeable for borrowers with short-term loan agreements, such as 1-, 2- and 3-year
mortgages who might see increases in their monthly mortgage payments ranging anywhere from 30 to 70 percent.
If you intend to buy a real-estate property, please base your judgement on the payments you will eventually have in
the future, rather than on unsustainably low payments offered to you now.
Alexandre Pestov February 2010
The Elusive Canadian Housing Bubble Page 11 of 51
3 HOUSING (UN)AFFORDABILITY
Mortgage rates do not possess a problem in an environment of affordable house prices. After all, if home owners
spend only a small fraction of their income towards home ownership, a rise of 25 or even 50 percent wouldn‟t be
an issue. Where is Canada today in terms of housing affordability?
To answer this question I refer to the quarterly housing affordability releases compiled by the Royal Bank of
Canada. In its November 2009 edition RBC states:
The string of significant improvements in housing affordability in Canada finally came to an
end in the third quarter [of 2009].
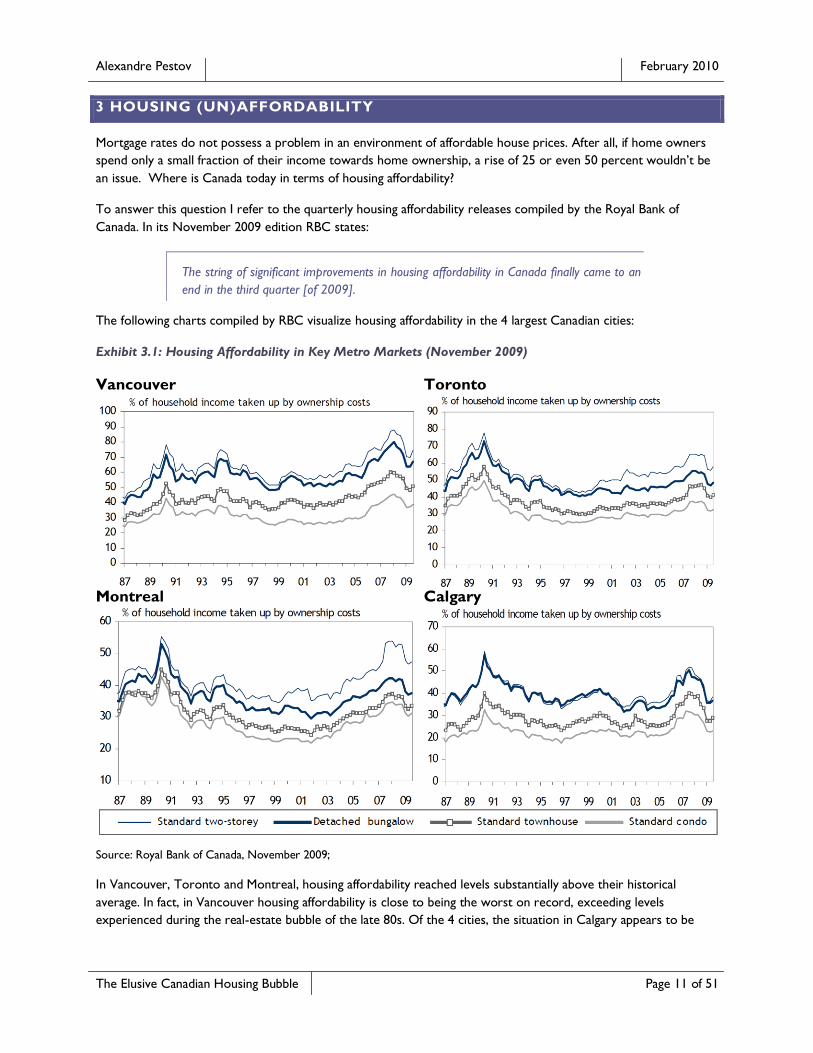
The following charts compiled by RBC visualize housing affordability in the 4 largest Canadian cities:
Exhibit 3.1: Housing Affordability in Key Metro Markets (November 2009)
Vancouver Toronto
Montreal Calgary
Source: Royal Bank of Canada, November 2009;
In Vancouver, Toronto and Montreal, housing affordability reached levels substantially above their historical
average. In fact, in Vancouver housing affordability is close to being the worst on record, exceeding levels
experienced during the real-estate bubble of the late 80s. Of the 4 cities, the situation in Calgary appears to be
Alexandre Pestov February 2010
The Elusive Canadian Housing Bubble Page 12 of 51
moderate and in line with historical norms due to the increase of mean household income that counterbalanced
the recent real-estate price increases.
Let‟s pause for a moment to digest the RBC report:
- An average Vancouver household (that is a family of usually two income earners, not a single person)
spends over 70 cents of every pre-tax dollar they earn on house ownership costs. Deduct unavoidable
taxes, and this amount would rise to nearly 100 percent of an average household income in Vancouver
- An average Toronto and Montreal household spends over 57 and 47 of their pre-tax income on house
ownership costs, or nearly 80 and 70 percent of their after-tax income respectively
An average Vancouver household spends almost a dollar on every dollar they earned. This is during:
- A severe recession (a subject that deserves its own section, and as such is covered later in this paper)
- Historically low interest rates
Incredible! Vancouver‟s property prices are reaching not just all-time highs in nominal terms, but are exceeding
those seen during the previous real-estate bubble in real-terms. However, cheerleaders of a perpetually growing
housing market point out that housing affordability, which can be taken as a sign of measurement of the housing
market health in Toronto, Montreal and Calgary is not nearly as bad as during the housing bubble of the late 80‟s.
This myth of positive affordability figures can be easily refuted by referring back to the cost of borrowing.
RBC Economics Research‟s housing affordability measures show the proportion of median pre-tax household
income required to service the cost of mortgage payments (principal and interest), property taxes and utilities. Of
these components, mortgage payments comprise approximately 80 percent of the overall housing costs. Back in
1990, at the peak of the real-estate bubble, the 5-year mortgage rate was 12 percent. It was 5.59 percent at the
time RBC compiled its November 2009 report. Mortgage rates conceal the underlying prices by skewing
affordability numbers. The poor affordability during the last bubble was experienced not as much due to inflated
housing prices, but rather due to high borrowing costs. To level the field and understand how today‟s real-estate
prices compare to those of the late 80‟s bubble, it is necessary to adjust the affordability measure for mortgage
rates.
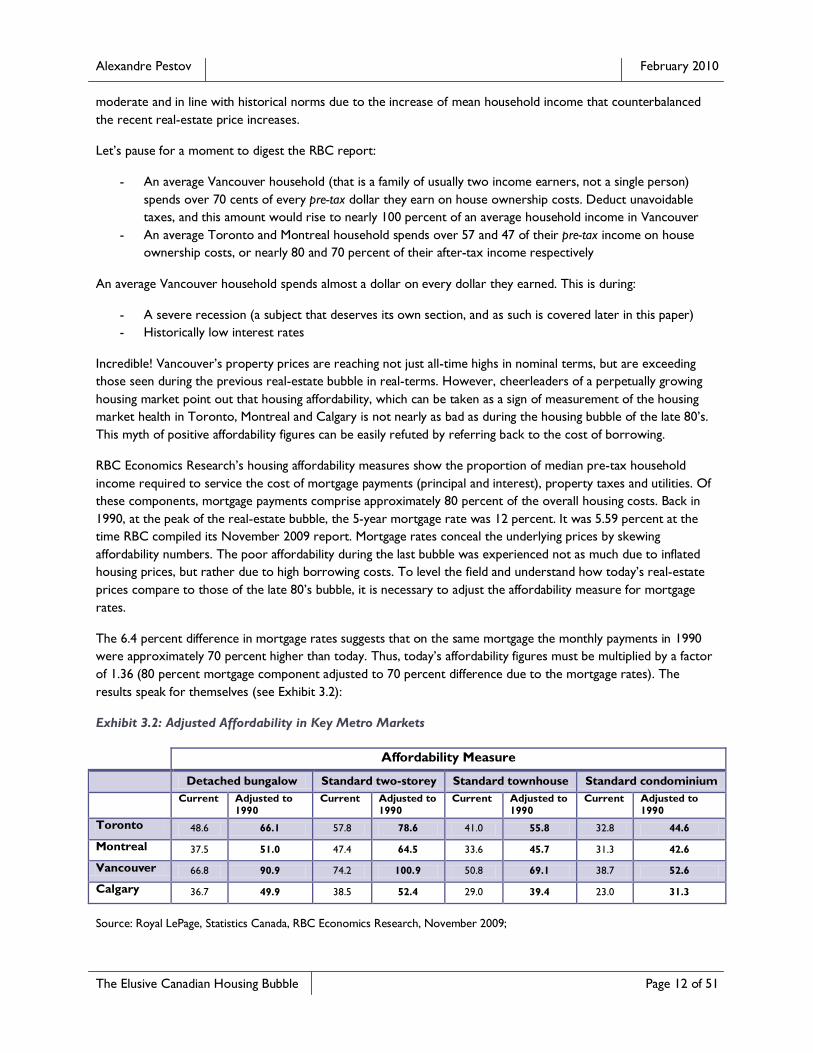
The 6.4 percent difference in mortgage rates suggests that on the same mortgage the monthly payments in 1990
were approximately 70 percent higher than today. Thus, today‟s affordability figures must be multiplied by a factor
of 1.36 (80 percent mortgage component adjusted to 70 percent difference due to the mortgage rates). The
results speak for themselves (see Exhibit 3.2):
Exhibit 3.2: Adjusted Affordability in Key Metro Markets
Affordability Measure
Detached bungalow Standard two-storey Standard townhouse Standard condominium
Current Adjusted to
1990
Current Adjusted to
1990
Current Adjusted to
1990
Current Adjusted to
1990
Toronto 48.6 66.1 57.8 78.6 41.0 55.8 32.8 44.6
Montreal 37.5 51.0 47.4 64.5 33.6 45.7 31.3 42.6
Vancouver 66.8 90.9 74.2 100.9 50.8 69.1 38.7 52.6
Calgary 36.7 49.9 38.5 52.4 29.0 39.4 23.0 31.3
Source: Royal LePage, Statistics Canada, RBC Economics Research, November 2009;
Alexandre Pestov February 2010
The Elusive Canadian Housing Bubble Page 13 of 51
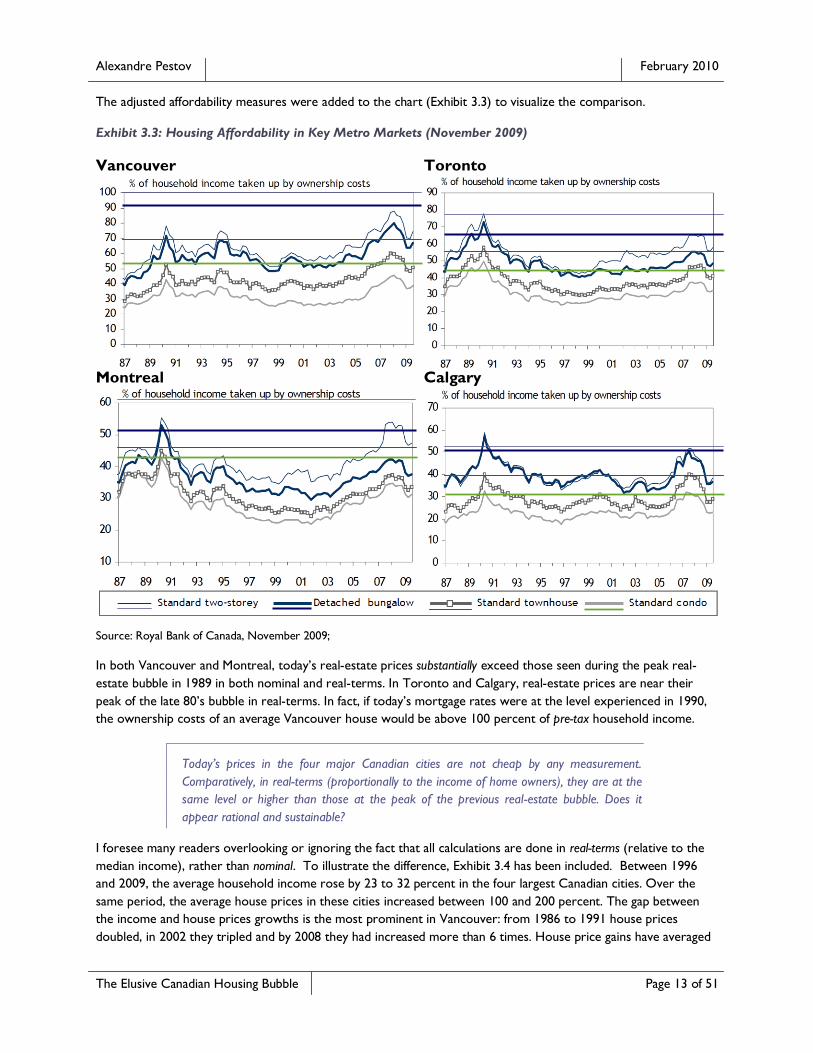
The adjusted affordability measures were added to the chart (Exhibit 3.3) to visualize the comparison.
Exhibit 3.3: Housing Affordability in Key Metro Markets (November 2009)
Vancouver Toronto
Montreal Calgary
Source: Royal Bank of Canada, November 2009;
In both Vancouver and Montreal, today‟s real-estate prices substantially exceed those seen during the peak real-
estate bubble in 1989 in both nominal and real-terms. In Toronto and Calgary, real-estate prices are near their
peak of the late 80‟s bubble in real-terms. In fact, if today‟s mortgage rates were at the level experienced in 1990,
the ownership costs of an average Vancouver house would be above 100 percent of pre-tax household income.
Today’s prices in the four major Canadian cities are not cheap by any measurement.
Comparatively, in real-terms (proportionally to the income of home owners), they are at the
same level or higher than those at the peak of the previous real-estate bubble. Does it
appear rational and sustainable?
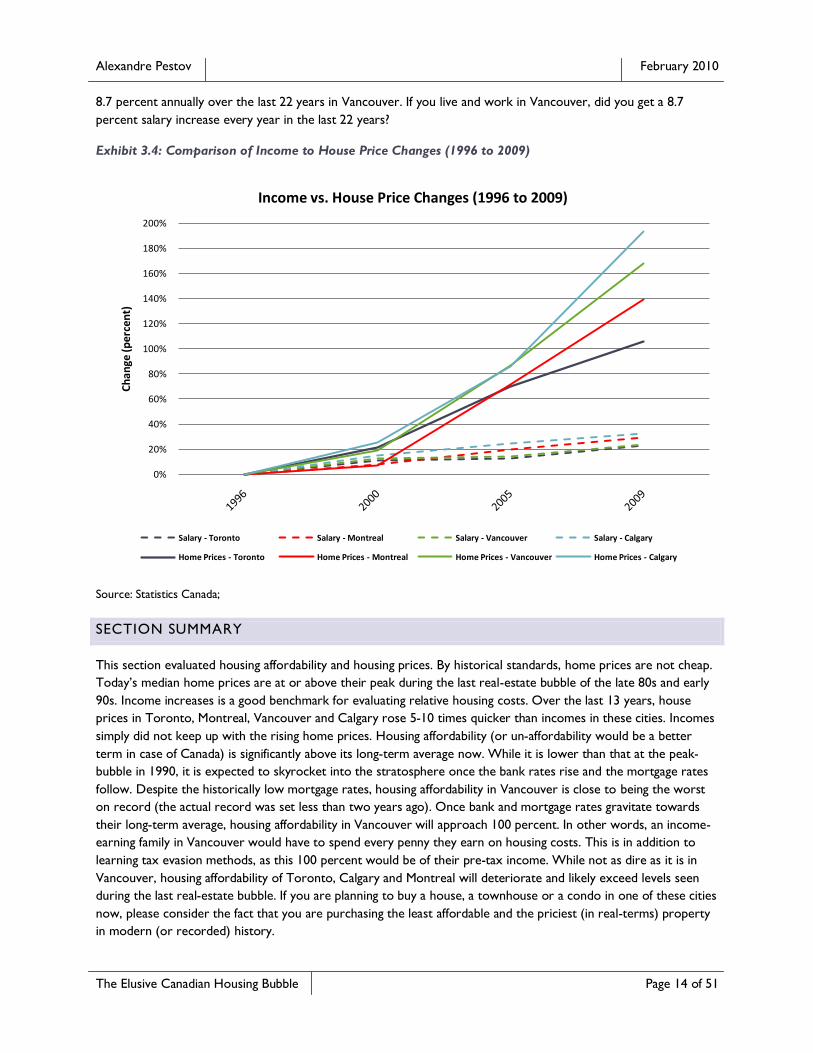
I foresee many readers overlooking or ignoring the fact that all calculations are done in real-terms (relative to the
median income), rather than nominal. To illustrate the difference, Exhibit 3.4 has been included. Between 1996
and 2009, the average household income rose by 23 to 32 percent in the four largest Canadian cities. Over the
same period, the average house prices in these cities increased between 100 and 200 percent. The gap between
the income and house prices growths is the most prominent in Vancouver: from 1986 to 1991 house prices
doubled, in 2002 they tripled and by 2008 they had increased more than 6 times. House price gains have averaged
Alexandre Pestov February 2010
The Elusive Canadian Housing Bubble Page 14 of 51
8.7 percent annually over the last 22 years in Vancouver. If you live and work in Vancouver, did you get a 8.7
percent salary increase every year in the last 22 years?
Exhibit 3.4: Comparison of Income to House Price Changes (1996 to 2009)
Source: Statistics Canada;
SECTION SUMMARY
This section evaluated housing affordability and housing prices. By historical standards, home prices are not cheap.
Today‟s median home prices are at or above their peak during the last real-estate bubble of the late 80s and early
90s. Income increases is a good benchmark for evaluating relative housing costs. Over the last 13 years, house
prices in Toronto, Montreal, Vancouver and Calgary rose 5-10 times quicker than incomes in these cities. Incomes
simply did not keep up with the rising home prices. Housing affordability (or un-affordability would be a better
term in case of Canada) is significantly above its long-term average now. While it is lower than that at the peak-
bubble in 1990, it is expected to skyrocket into the stratosphere once the bank rates rise and the mortgage rates
follow. Despite the historically low mortgage rates, housing affordability in Vancouver is close to being the worst
on record (the actual record was set less than two years ago). Once bank and mortgage rates gravitate towards
their long-term average, housing affordability in Vancouver will approach 100 percent. In other words, an income-
earning family in Vancouver would have to spend every penny they earn on housing costs. This is in addition to
learning tax evasion methods, as this 100 percent would be of their pre-tax income. While not as dire as it is in
Vancouver, housing affordability of Toronto, Calgary and Montreal will deteriorate and likely exceed levels seen
during the last real-estate bubble. If you are planning to buy a house, a townhouse or a condo in one of these cities
now, please consider the fact that you are purchasing the least affordable and the priciest (in real-terms) property
in modern (or recorded) history.
0%
20%
40%
60%
80%
100%
120%
140%
160%
180%
200%
Ch
ange
(per
cen
t)
Income vs. House Price Changes (1996 to 2009)
Salary - Toronto Salary - Montreal Salary - Vancouver Salary - Calgary
Home Prices - Toronto Home Prices - Montreal Home Prices - Vancouver Home Prices - Calgary
Alexandre Pestov February 2010
The Elusive Canadian Housing Bubble Page 15 of 51
4 THE US AND CANADA – NOT AS DIFFERENT AS THEY APPEAR
Let‟s rewind time back to late 2007 and early 2008. The fear of a bursting real-estate bubble has a firm grip on the
global economy. Real-estate prices plunge worldwide. Financial institutions implode under the pressure of
mounting losses. Bad loans and foreclosures skyrocket. Massive selling anxiety pushes global markets into oblivion.
Then Q1 of 2009 comes and brings a complete market meltdown, sending investors running for the exit globally.
As the dust begins to settle in Q2 of 2009, the global community comes to the realization the sky isn‟t falling. With
a solid market bottom in sight, the losses are now mostly accounted for. The respite in the sub-prime initiated
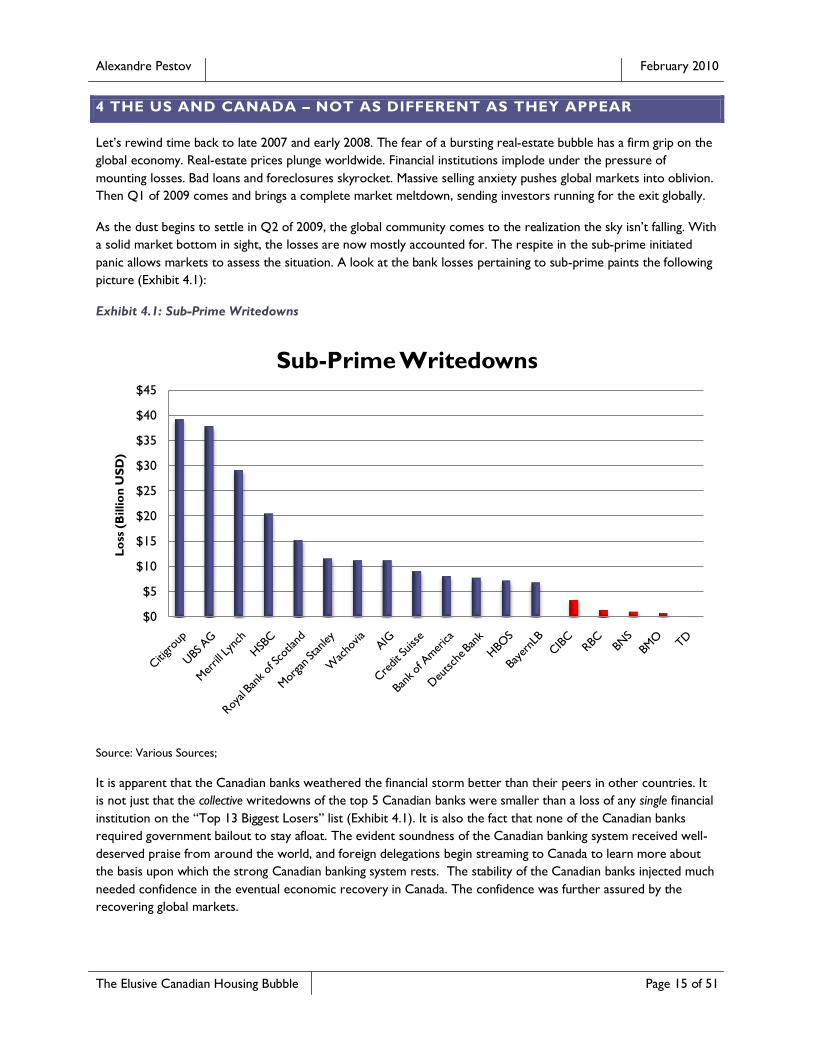
panic allows markets to assess the situation. A look at the bank losses pertaining to sub-prime paints the following
picture (Exhibit 4.1):
Exhibit 4.1: Sub-Prime Writedowns
Source: Various Sources;
It is apparent that the Canadian banks weathered the financial storm better than their peers in other countries. It
is not just that the collective writedowns of the top 5 Canadian banks were smaller than a loss of any single financial
institution on the “Top 13 Biggest Losers” list (Exhibit 4.1). It is also the fact that none of the Canadian banks
required government bailout to stay afloat. The evident soundness of the Canadian banking system received well-
deserved praise from around the world, and foreign delegations begin streaming to Canada to learn more about
the basis upon which the strong Canadian banking system rests. The stability of the Canadian banks injected much
needed confidence in the eventual economic recovery in Canada. The confidence was further assured by the
recovering global markets.
$0
$5
$10
$15
$20
$25
$30
$35
$40
$45
Lo
ss (
Billio
n U
SD
)
Sub-Prime Writedowns
Alexandre Pestov February 2010
The Elusive Canadian Housing Bubble Page 16 of 51
Around the same time, the Canadian public was able to pause and assess the real-estate market situation in
Canada. Just like the banking system, the Canadian housing market was the beaming image of health and stability.
While some metropolitan areas of the US witnessed 50-60 percent declines in home prices, real-estate prices in
the four largest Canadian cities dropped approximately 10-15 percent and rapidly bounced back, reaching all-time
high levels in Toronto.
Naturally, the parallels between the Canadian banking system and real-estate market were drawn. Both exhibited
remarkable resilience. Both withstood the headwinds of the financial crisis without collapsing. With the global
economy beginning to recover, the logical conclusion of “the worst is behind us” was made. And as many begin to
believe the slide in real-estate prices in Canada is reversed, explanations of how Canada managed to escape the
real-estate disaster similar to the one that hit the US and UK begin to pile up.
It doesn‟t take long to find real-estate pundits offering their views on fundamentally sound reasons why Canada
avoided the collapse. They can be seen posting authoritative articles on the front pages of weekly newspapers,
speaking publicly on CNBC and offering expert advice in numerous investment newsletters and press-releases.
Amusingly, the following inarticulate posting located on www.DicoverVancouver.com summarizes these views with
remarkable clarity (posted on 24 October 2008):
all you people that think vancouver's housing market is crashing are losers. vancouver's
housing market has gone up another 10% this month alone. when there's a global
recession, people want to invest their money in safe place and the only safe place right now
is in vancouver real estate. it's a sure win. we have the best economy in the world,
vancouver 2010 olympics, everybody wants to live here, and we are the #1 city in the
world!!!
if you don't buy now, you'll be priced out forever! housing is extremely cheap right now
compared to other cities like new york, tokyo, paris, london.
Generally, supporters of the averted housing crisis notion conclude that there wasn‟t a housing bubble in Canada
to begin with. Sure enough, some agree that prices are at historically high levels in real-terms and that affordability
is near or above record highs. However, they say, it is all relative. Relative to the rest of the world, especially the
US, house prices in Canada are still cheap. And relative to the US, Canada hasn‟t experienced the housing craze
and explosion in prices. Thus, the fact that Canada did not see a price collapse as the US did is fully warranted
simply because our “bubble” has never reached the proportions of the US madness.
This common fallacy cannot be further away from reality. First of all, ignoring basic valuations in favour of making
comparisons between dissimilar markets is inherently flawed. Even if Canada did not go through the same boom as
the US did, it doesn‟t mean that current prices are supported by any fundamentals. No matter what transpired in
other places of the world, Canadian residential real-estate is overvalued, prices are at historically high-levels in
nominal and real terms, and affordability is exceptionally poor in the environment of historically low interest rates.
Once these fundamentals begin to exert themselves, the relativistic argument (e.g. “it‟s not as bad as Miami was in
2007”) will not be able to sustain the current price levels.
Secondly, Canadians have developed a firm misconception that the Canadian real-estate market wasn‟t (isn‟t) as
inflated as that of the US was in 2007. Let‟s dissect this view and examine it using comparable metrics. Exhibit 4.2
shows an overlay of price index changes for select US (dashed lines) and four major Canadian cities (solid lines).
The starting point is the year 2000 – the year when the housing prices took off in both countries. At the peak of
the US bubble in 2006-2007, Calgary, Montreal and Vancouver were “outperformed” only by the hottest real-
estate spots in the US – Miami, FL, Los Angeles, CA, Las Vegas, NV and Tampa, FL. However, the three Canadian
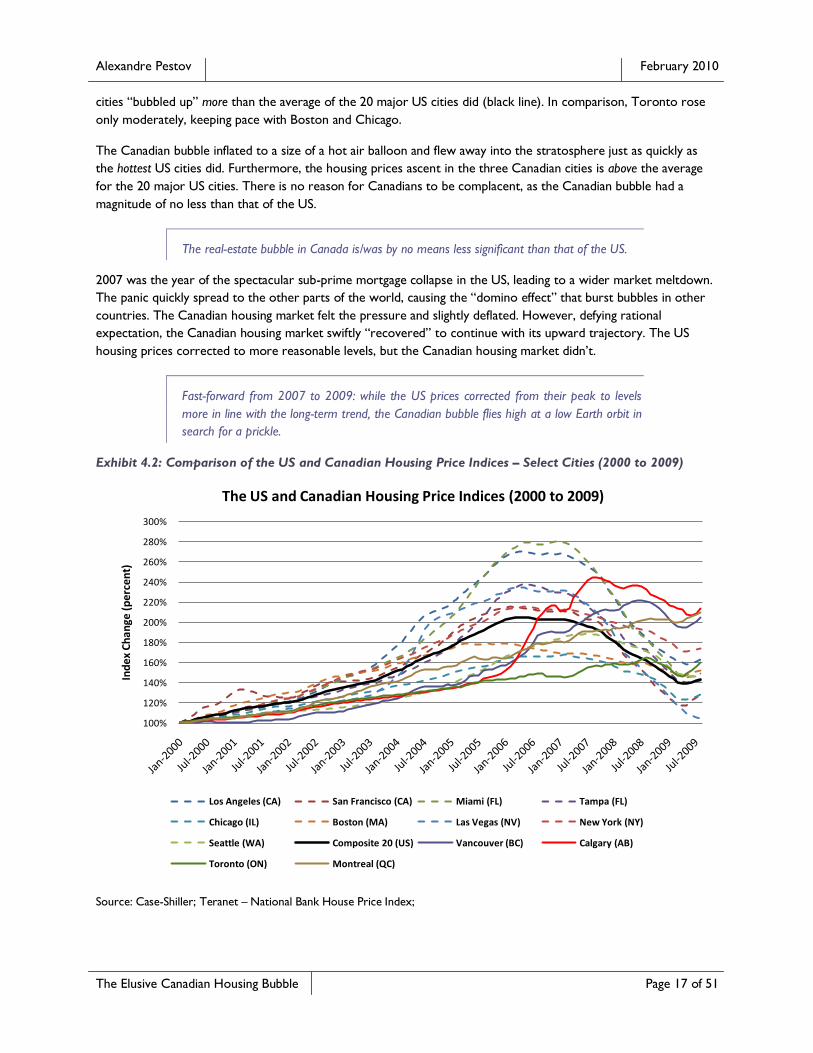
Alexandre Pestov February 2010
The Elusive Canadian Housing Bubble Page 17 of 51
cities “bubbled up” more than the average of the 20 major US cities did (black line). In comparison, Toronto rose
only moderately, keeping pace with Boston and Chicago.
The Canadian bubble inflated to a size of a hot air balloon and flew away into the stratosphere just as quickly as
the hottest US cities did. Furthermore, the housing prices ascent in the three Canadian cities is above the average
for the 20 major US cities. There is no reason for Canadians to be complacent, as the Canadian bubble had a
magnitude of no less than that of the US.
The real-estate bubble in Canada is/was by no means less significant than that of the US.
2007 was the year of the spectacular sub-prime mortgage collapse in the US, leading to a wider market meltdown.
The panic quickly spread to the other parts of the world, causing the “domino effect” that burst bubbles in other
countries. The Canadian housing market felt the pressure and slightly deflated. However, defying rational
expectation, the Canadian housing market swiftly “recovered” to continue with its upward trajectory. The US
housing prices corrected to more reasonable levels, but the Canadian housing market didn‟t.
Fast-forward from 2007 to 2009: while the US prices corrected from their peak to levels
more in line with the long-term trend, the Canadian bubble flies high at a low Earth orbit in
search for a prickle.
Exhibit 4.2: Comparison of the US and Canadian Housing Price Indices – Select Cities (2000 to 2009)
Source: Case-Shiller; Teranet – National Bank House Price Index;
100%
120%
140%
160%
180%
200%
220%
240%
260%
280%
300%
Ind
ex C
han
ge (
per
cen
t)
The US and Canadian Housing Price Indices (2000 to 2009)
Los Angeles (CA) San Francisco (CA) Miami (FL) Tampa (FL)
Chicago (IL) Boston (MA) Las Vegas (NV) New York (NY)
Seattle (WA) Composite 20 (US) Vancouver (BC) Calgary (AB)
Toronto (ON) Montreal (QC)
Alexandre Pestov February 2010
The Elusive Canadian Housing Bubble Page 18 of 51
Over the last 10 years, the boom cycle in the US real-estate market sent indices soaring over 100 percent from
their 2000 levels. However, half of the gains were forfeited during the subsequent bust. The Canadian market did
not follow the same path, and the moderate correction of 2008-2009 did not bring prices down far enough.
Housing prices in Vancouver, Montreal and Calgary are still more than 100 percent above their 2000 starting
point, and Toronto is up more than 60 percent.
The rapid rise in asset prices isn‟t the single most reliable indicator of a bubble. Certainly, a case for introducing a
secondary measurement of housing affordability can be made. This would be done to eliminate any distortions in
perception caused by any significant price adjustments. For instance, if prices in a severely undervalued market
double, then a bubble might not form, as the market remains undervalued even in the environment of doubling
housing prices. However, if prices in an already overvalued market double, bubble conditions are very likely to
develop.
It was determined earlier that the housing prices of the four largest Canadian metro areas rose just as sharply as
those in the epicentres of the US housing disasters. However, they did not plunge alongside the US indices. A
plausible explanation can be found in the possibly undervalued conditions of the Canadian housing market at the
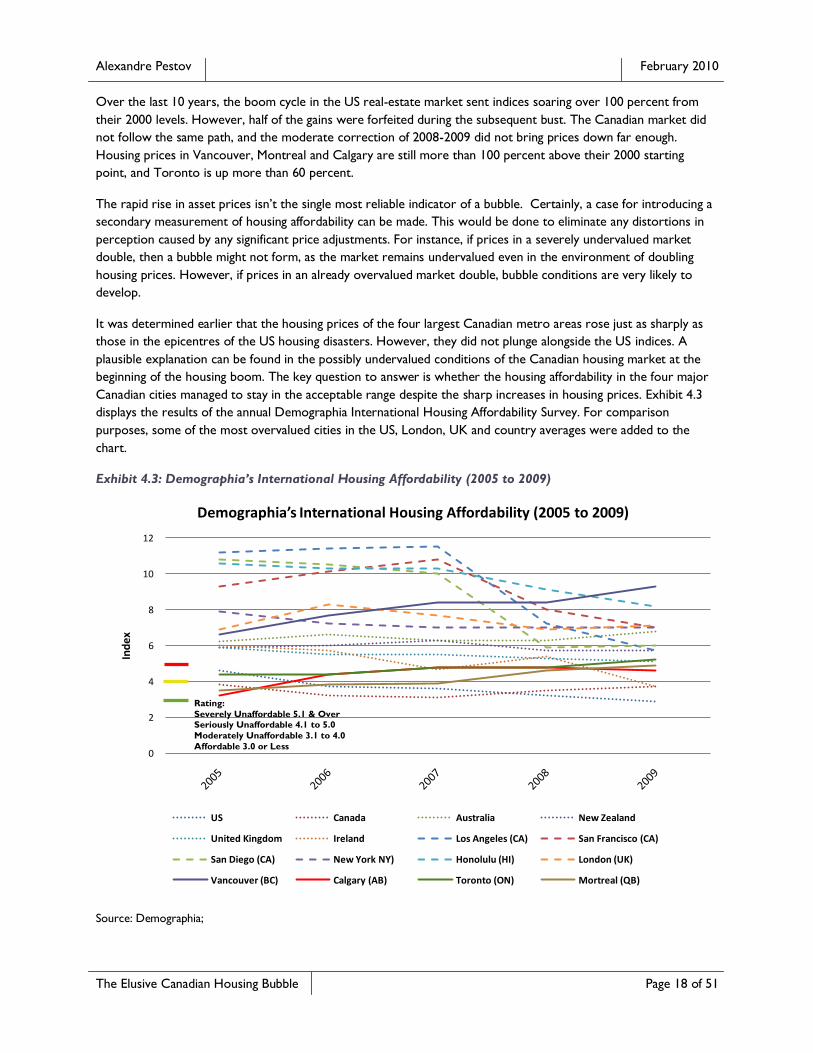
beginning of the housing boom. The key question to answer is whether the housing affordability in the four major
Canadian cities managed to stay in the acceptable range despite the sharp increases in housing prices. Exhibit 4.3
displays the results of the annual Demographia International Housing Affordability Survey. For comparison
purposes, some of the most overvalued cities in the US, London, UK and country averages were added to the
chart.
Exhibit 4.3: Demographia’s International Housing Affordability (2005 to 2009)
Source: Demographia;
0
2
4
6
8
10
12
Ind
ex
Demographia’s International Housing Affordability (2005 to 2009)
US Canada Australia New Zealand
United Kingdom Ireland Los Angeles (CA) San Francisco (CA)
San Diego (CA) New York NY) Honolulu (HI) London (UK)
Vancouver (BC) Calgary (AB) Toronto (ON) Mortreal (QB)
Rating:
Severely Unaffordable 5.1 & Over Seriously Unaffordable 4.1 to 5.0
Moderately Unaffordable 3.1 to 4.0
Affordable 3.0 or Less
Alexandre Pestov February 2010
The Elusive Canadian Housing Bubble Page 19 of 51
Demographia‟s affordability measurement is built on a ratio of median house price divided by gross annual median
household income. Based on the long-term data, real-estate is considered “affordable” if this ratio stands at 3.0 or
less, meaning that if the mean household income is $100,000 the mean property price is $300,000 or less. Once
the ratio climbs to the range between 3.1 and 4.0, the real-estate is deemed “moderately unaffordable”. With this
ratio between 4.1 and 5.0, real-estate is viewed as “seriously unaffordable”, and above 5.1 it becomes “severely
unaffordable”.
The annual Demographia International Housing Affordability Survey reveals surprising results. Predictably, during
the peak of the US housing boom the affordability measurement in cities including Los Angeles, San Diego,
Honolulu, and San Francisco reached double-digit levels. In retrospect, it is hard to comprehend the rational and
thinking process of buyers snatching houses they wouldn‟t be able to pay off during their lifetime. Vancouver didn‟t
trail far behind, staying solidly in the “severely unaffordable” category and surpassing both London, UK and New
York, NY by mid-2006. During that time, Calgary and Montreal gradually rose from “moderately unaffordable”
levels to “seriously unaffordable”. Toronto, being excessively pricey already, stayed within the “seriously
unaffordable” band.
Once the bubble burst and home prices plunged, the affordability improved in the most overpriced cities in the US
and UK. But not in Canada. Instead, the housing affordability average in Canada moved closer to the upper
boundary of the “moderately unaffordable” band. Instead, the mean house price in Canada became less affordable
than that of the US. During the crisis, Montreal and Calgary edged dangerously close to crossing the “severely
unaffordable” line, while in 2009 Toronto finally managed to turn itself into a “severely unaffordable” city. And
Vancouver outshined them all.
In 2009, Vancouver became the most unaffordable city among 272 markets. Presently,
Vancouver is less affordable than London, UK, Los Angeles, CA, Miami, FL, New York, NY,
Sydney, AU or any other city in Australia, Canada, Ireland, New Zealand, the United
Kingdom and the United States.
The differences in the US and Canadian tax systems must also be factored into the overall equation. In the US,
home mortgage interest is tax deductible. This is not the case in Canada. Keeping all other variables the same, the
tax-deductable interest allows US home owners to carry a higher home price to income ratio than their Canadian
counterparts can. It further highlights the problem in Canada: if the housing market in the US collapsed under the
weight of unaffordable mortgages in the environment of tax-deductible mortgage interest, then what does the future
hold for the Canadian market that is just as unaffordable, but provides no tax benefits for Canadian home owners?
SECTION SUMMARY
The intensity of the US housing madness has been well studied, documented and discussed in countless books,
magazines, academic papers, and TV shows. Hundreds of thousands of Internet websites contain information,
timelines, details, analysis and conspiracy theories of when, why and how it occurred. The tsunami of data
pertaining to the situation in the US easily overshadows and mutes already muffled voices preaching about the
existence and danger of the Canadian housing bubble. In this environment, it is easy to ignore them.
Nonetheless, it should not be forgotten that:
- “Bubbling” in the Canadian housing sector was no less intense than in the US
- The housing prices in the four major Canadian cities went “too far too fast” at par with the 20 largest US
metropolitans
Alexandre Pestov February 2010
The Elusive Canadian Housing Bubble Page 20 of 51
- Housing affordability situation in the four major Canadian cities is currently at par or worse than that of
the hotspots of the US housing boom
The targeted efforts of industry lobbyists, politicians, perma-bullish squads of TV personalities and authoritative
newspaper writers have certainly achieved their goals of gently guiding the views of the Canadian public into the
desired direction. The campaign of self-deception has succeeded. In spite of the obvious signs of a housing bubble,
Canadian buyers flock to grand openings of new condo sites, snatching 40, 50 and 60 percent of available units on
the first day of site opening. This does not, however, diminish the fact that the Canadian real-estate market is
positioned for a significant correction similar to that of the US.
If you are thinking of buying a house or a condo in Vancouver, Toronto, Montreal or Calgary today, imagine that
you are buying a condo in Miami in early 2007. The chances are you are buying near historically high prices (in
relation to your income) and historically poor affordability. Of course, mean income can miraculously jump to
restore the right balance of home price to income, and tomorrow you‟d be earning double of what you make
today. More likely, however, gravity will pull housing prices down, in line with their historical norms. Remember,
Canada experienced the same real-estate bubble as the US did. It just hasn‟t burst yet.
Alexandre Pestov February 2010
The Elusive Canadian Housing Bubble Page 21 of 51
5 CMHC - THE POSTPONED CRISIS
Naturally, a question of “why didn‟t it happen in Canada” arises. The ominous signs such as prices rising too
quickly and too far, poor affordability, extreme price to income ratio, excessive borrowing and near-extreme debt
levels carried by Canadian households are clearly in existence. However, 2008 has passed and the prices have
recovered. Now, at the beginning of 2010, many see the global economic revival ahead of us. Logically, it occurs to
observers that since the worst is behind us and the prices did not implode, there must be fundamental factors
propping the market.
The simple fact is the housing crisis in Canada was not prevented or fully experienced. It
was merely delayed.
The article posted on “Worthwhile Canadian Initiative36” captures the mistake many Canadian make with respect
to the Canadian housing market:
Real bubbles are unstable; they burst when you prick them. They don't spontaneously revert
to their original size. Soap bubbles aren't like tennis balls. If the bubble metaphor means
anything, it has to mean that. If asset price bubbles aren't unstable, and don't burst when
you prick them, or re-inflate immediately, then the bubble metaphor is useless.
How do you know if something was a bubble? If you prick it and it bursts, it probably was a
bubble. If you prick it and it goes back to the original size, it probably wasn't36
The “bubble” metaphor is referenced to illustrate the point of bursting a bubble. The “if it didn‟t burst right away,
it is not a bubble” statement certainly sounds convincing, but cannot be further from the truth. A soap bubble
takes about 0.3 of second to inflate, and the full sequence of popping last less than 1/100 of a second. The short
duration of the bursting cycle makes any timely repairs and re-inflation nearly impossible (however, I wouldn‟t rule
out any future scientific break-through in the area of soap bubble repairs). Asset bubbles develop over several
years and the burst cycles may last as long as several years too. Having the right tools in place, it is possible to put
a band-aid over the punctured surface and quickly re-inflate asset prices even higher. The key question is in the set
of tools available for the job.
The reason the US government was unable to plug the hole and prevent the bubble from bursting in 2007 lies in
the exhaustion of available means to do so. The secret bubble formula developed by Samsam Bubbleman in his 20-
year career pales in comparison to the even more covert stew developed by the Grand Wizard of bubbleology
Alan Greenspan. However, all good things eventually come to an end, and the hollow entity known as the US
housing market collapsed under its own weight.
Through the right mix of business practices and regulations, the Canadian mortgage lending industry showed
prudence in accepting the financial instrument of mass destruction that innovated the entire US financial sector to
the ground. Canada banks generally did not practice sub-prime lending. Nor acceptance of mortgage-backed
securities was as widespread in Canada as it was in the US. All of these and many other financial tricks available to
central bank conjurors were already fully employed and worn out in the US. But not in Canada.
When the US housing bubble gave way in 2007, the shock waves rippled through the fabric of the global financial
world at speed and intensity of those triggered by the Tsar Bomb. The Canadian housing market, being in a similar
bubble, began deflating. However, the government of Canada took aggressive measures to delay the inevitable.
Alexandre Pestov February 2010
The Elusive Canadian Housing Bubble Page 22 of 51
The bubble can be re-inflated if air inflows into the bubble exceed outflows. This condition can be achieved
through a careful manipulation of the supply and demand balance. In the US, the sub-prime lending injected
excessive numbers of buyers into the market over the years. In turn, the disproportionate demand pushed the
housing prices higher. Unfortunately for the US government, such artificial market stimulation cannot last forever.
Fortunately for the Canadian government, a large and untapped pool of potential sub-prime buyers existed, and
resources for generating extra demand to prop prices were readily available.
In 2007 the Harper government allowed the CMHC (Canada Mortgage and Housing Corporation) to dramatically
change its rules. The down payment requirements were reduced to zero percent and the amortization period was
extended to 40 years. These changes were included in the first Conservative budget in May of 2006. In August of
2008, these rules were tightened under the mantra of instituting yet another barrier to lax lending to safeguard the
Canadian financial system stability. Under the changes implemented in 2008, the minimum down payment was set
to 5 percent and maximum amortization period was reduced to 35 year. Cynically, Prime Minister Harper
described the adjustment as “In the U.S., they are still responding to the fallout of the subprime mortgage mess. In
Canada, we acted early over the past year.28”
But the long-term damage to the Canadian economy was already inflicted by the Harper government‟s
irresponsible policies conceived in 2006 and implemented in 200728. The “face-saving” backpedalling of 2008 did
not go far enough and lending standards remain perilously lenient.
To grasp the idea of the damage done by the introduction of 35- and 40-year mortgages, consider the repayment
schedule. Typically, mortgage payments consist of two components: principal repayment and interest. The shorter
the mortgage duration, a greater portion of the principal must be included in each payment. The longer the
mortgage duration, a lesser portion of the principal must be repaid with each payment, and thus the overall
payment amount decreases. Because of this, longer term loans allow borrowers to carry more debt.
However, with the repayment period of 35 to 40 years, mortgages effectively become interest-only loans, whereby
borrowers merely pay interest without noticeably reducing the principal amount. This type of mortgage would
appear beneficial to a financially constrained borrower. A household earning $8,000 net income a month generally
would not be interested in extending a mortgage duration from 20 to 40 years and reducing their monthly
payments from let‟s say $1,600 to $1,400 a month. It makes no material impact on their monthly budget, but
doubles the duration of indebtedness. However, for a household earning $2,500 in combined income this $200
saved would make a substantial difference.
Let‟s assume that based on the real-estate prices in the area, the monthly mortgage payments for the cheapest
property are set at $1,600 a month. Earning $2,500 monthly, a family simply cannot afford it, even with substantial
cuts in other areas of their expenditures. However, if the mortgage term is extended to 35 years from the usual
25, the monthly payments become $1,400. This is barely affordable, yet possible for the household in question to
pay. So they buy the house and become the proud home owners. Another family earns $150,000 a year gross, or
roughly $8,000 monthly after taxes. They have a posh 2-garage 4-bedroom house in Toronto and pay $5,000 a
month for it. Now, they are offered to take a 40-year mortgage instead of their current 20-year one. With the
unchanged payment of $5,000 a month they happily improve their living conditions and move into a 3-garage 5-
bedroom house. Good for them. A person with an on and off employment situation has a hard time accumulating
the necessary down payment to buy a condo. It is not a problem anymore, as new regulations allow him to take a
mortgage with 0 percent down. He could never dream of owning a real-property, and now he finally owns it.
Good for him. As Finance Minister of Canada Jim Flaherty describes it:
“These changes will result in greater choice and innovation in the market for mortgage
insurance, benefiting consumers and promoting home ownership.”
Alexandre Pestov February 2010
The Elusive Canadian Housing Bubble Page 23 of 51
These changes certainly promote home ownership, as many people who would never dream of having a house can
finally buy it. It is good for them, as they finally can afford a property of their own. It is good for the market, as
large injections of new buyers into the market creates extra demand and drives home prices higher. It is good for
lenders, as they can issue mortgages to a larger population and earn higher profits. It is good for politicians, as they
appear as prudent financial managers. It is good for everyone, until the rates begin to go up. And when the music
stops, the lights go off.
Interest rates cannot stay at the current unprecedentedly low levels forever. In fact, they are expected to rise as
soon as the economy shows signs of recovery to prevent it from overheating. This is not a question of “if”, as
determined earlier, but the question of “when”, and this “when” is just around the corner. Once the rates go up,
the $1,400 mortgage payment for the first family will turn into $1,800. The $5,000 monthly outlay out of the
budget of the second family will become $6,500. The rate hike throws both families over the edge and they are
forced to foreclose or sell their property at a loss just to be rid of the now unbearable monthly payments. These
houses sold at fire-sale prices will be multiplied by 1,000s, and this avalanche of sellers will push home prices down.
You don‟t have to be an economist to trace the logical chain of events. Nor do you have to be an historian with
the knowledge of events of the distant past. It has just happened in the US in 2007, and all you need to do is go on
the Internet and search for “housing crisis in the US”. Since 2007, the government of Canada has taken all the same
steps that led to the boom and subsequent collapse of the US housing market. The US market collapsed because it was
overvalued and built on unsustainable fundamentals. The Canadian market resembles the 2006 housing market in
the US with a stunning accuracy.
If 0 down payment 40-year mortgages weren‟t enough, the government of Canada rolled out a whole slew of new
programs to prop the market by stimulating demand through new buyers who cannot afford to own a house.
Home Buyers' Plan (HBP)24, which allows first-time buyers to withdraw $25,000 from their RRSP account towards
a home purchase, is another example of fiscal incentives that the government of Canada introduced to fuel the
buying spree.
All these programmes have a common theme – they cannot last forever. The more of them used to stimulate the
market to new highs, the greater the collapse will be once they are exhausted. Many will say that by taking drastic
measures, the Canadian government prevented the disaster. It must be understood the disaster was not averted,
but postponed. The structural imbalances within the system were not eliminated, they were worsened. The
government of Canada resembles a firefighter who piles a large load of firewood on top of the flames he is trying
to extinguish. For a brief period of time the results of his efforts would appear as a success - the flames disappear
from view and the fire would seem to be gone. However, in a matter of minutes the blaze will engulf the firewood
pile, burning higher and stronger than before. By injecting new buyers into the system, the government of Canada
temporarily propped the prices. However, these buyers were not in the system previously because they were
unable to carry the cost of home ownership under the prudent rules. With the new rules, they will be the first to
fail once interest rates go up, and they will magnify the problem tenfold once prices begin to drop again.
Having discussed the dangers of the course chosen by the Harper government for Canada, let‟s review the facts
behind these conclusions.
On December 10, 2009, the Governor of the Bank of Canada, Mark Carney, warned that Canadian families were
becoming more vulnerable to interest rate fluctuations. While other countries such as the United States and
Britain have seen reductions in personal debt-to-income ratios, Canadians have added more debt. Mark Carney
concludes that up to 10 percent of households would face serious problems meeting their house payments if
interest rates rise17; 18; 20. The percentage of households where interest payments exceed 40 per cent of income
could increase to near 10 per cent by 2012 under certain interest rate assumptions7. This is above the 6.1 percent
Alexandre Pestov February 2010
The Elusive Canadian Housing Bubble Page 24 of 51
average of the last 10 years, and well above the long term average. Minister of Finance Jim Flaherty echoed the
comments about the risk of rising personal debt7; 11; 22.
This admission of the danger of the current situation is certainly welcome. However, it misses the crucial link to
the policies designed and implemented by both Carney and Flaherty. Reckless and irresponsible moves to
artificially stimulate the housing market through inflated demand were done by luring those who cannot afford to
buy a house into buying one. Now, both public figures act shocked, surprised and worried about the 10 percent of
households that are expected to default once the interest rates go up.
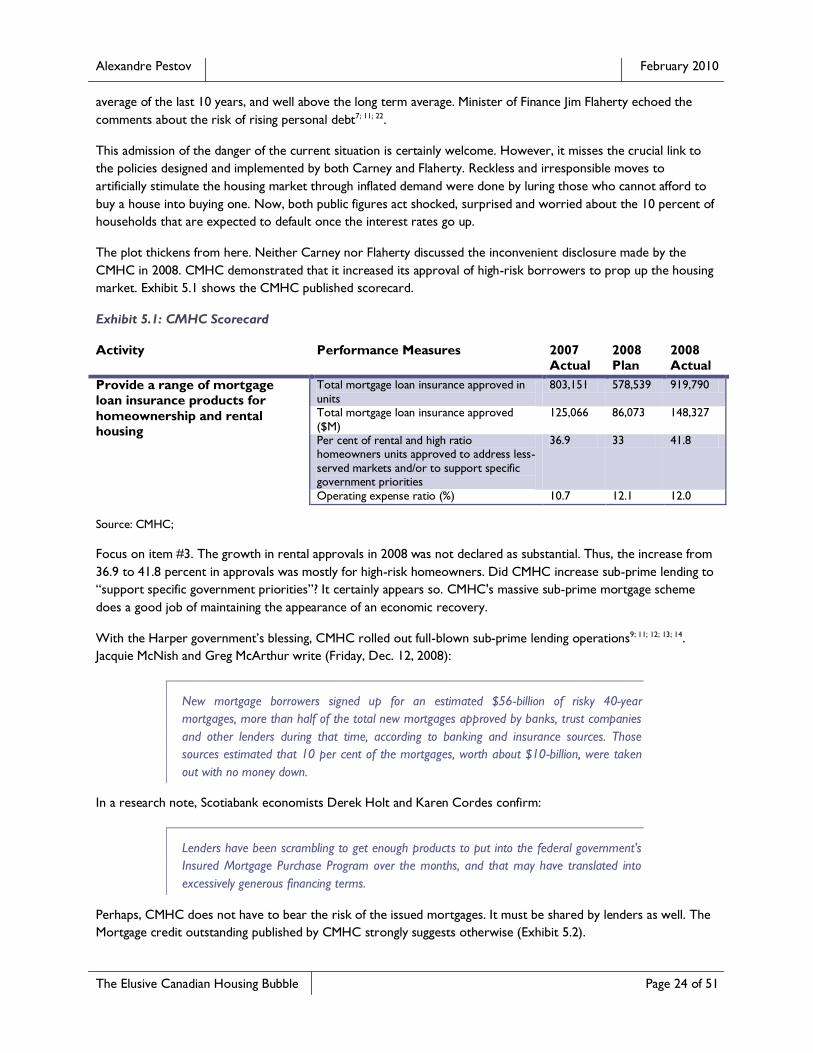
The plot thickens from here. Neither Carney nor Flaherty discussed the inconvenient disclosure made by the
CMHC in 2008. CMHC demonstrated that it increased its approval of high-risk borrowers to prop up the housing
market. Exhibit 5.1 shows the CMHC published scorecard.
Exhibit 5.1: CMHC Scorecard
Activity Performance Measures 2007 Actual
2008 Plan
2008 Actual
Provide a range of mortgage loan insurance products for
homeownership and rental housing
Total mortgage loan insurance approved in
units
803,151 578,539 919,790
Total mortgage loan insurance approved
($M)
125,066 86,073 148,327
Per cent of rental and high ratio homeowners units approved to address less-
served markets and/or to support specific government priorities
36.9 33 41.8
Operating expense ratio (%) 10.7 12.1 12.0
Source: CMHC;
Focus on item #3. The growth in rental approvals in 2008 was not declared as substantial. Thus, the increase from
36.9 to 41.8 percent in approvals was mostly for high-risk homeowners. Did CMHC increase sub-prime lending to
“support specific government priorities”? It certainly appears so. CMHC's massive sub-prime mortgage scheme
does a good job of maintaining the appearance of an economic recovery.
With the Harper government‟s blessing, CMHC rolled out full-blown sub-prime lending operations9; 11; 12; 13; 14.
Jacquie McNish and Greg McArthur write (Friday, Dec. 12, 2008):
New mortgage borrowers signed up for an estimated $56-billion of risky 40-year
mortgages, more than half of the total new mortgages approved by banks, trust companies
and other lenders during that time, according to banking and insurance sources. Those
sources estimated that 10 per cent of the mortgages, worth about $10-billion, were taken
out with no money down.
In a research note, Scotiabank economists Derek Holt and Karen Cordes confirm:
Lenders have been scrambling to get enough products to put into the federal government's
Insured Mortgage Purchase Program over the months, and that may have translated into
excessively generous financing terms.
Perhaps, CMHC does not have to bear the risk of the issued mortgages. It must be shared by lenders as well. The
Mortgage credit outstanding published by CMHC strongly suggests otherwise (Exhibit 5.2).
Alexandre Pestov February 2010
The Elusive Canadian Housing Bubble Page 25 of 51
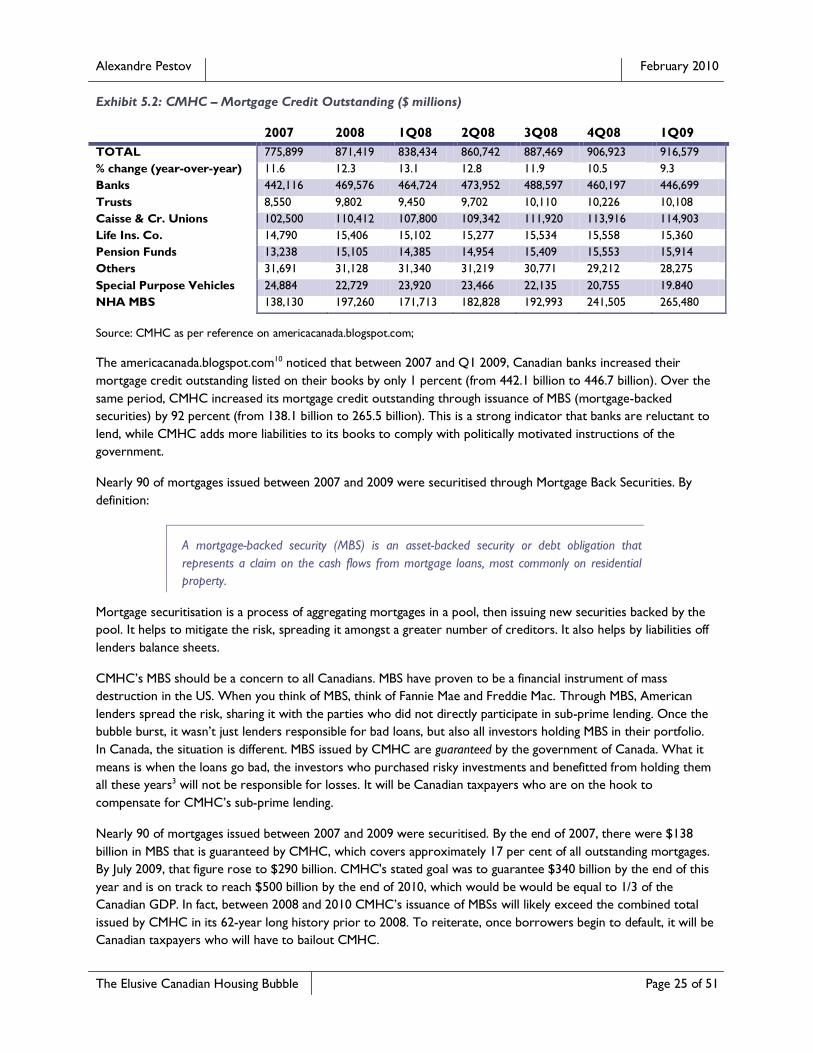
Exhibit 5.2: CMHC – Mortgage Credit Outstanding ($ millions)
2007 2008 1Q08 2Q08 3Q08 4Q08 1Q09
TOTAL 775,899 871,419 838,434 860,742 887,469 906,923 916,579
% change (year-over-year) 11.6 12.3 13.1 12.8 11.9 10.5 9.3
Banks 442,116 469,576 464,724 473,952 488,597 460,197 446,699
Trusts 8,550 9,802 9,450 9,702 10,110 10,226 10,108
Caisse & Cr. Unions 102,500 110,412 107,800 109,342 111,920 113,916 114,903
Life Ins. Co. 14,790 15,406 15,102 15,277 15,534 15,558 15,360
Pension Funds 13,238 15,105 14,385 14,954 15,409 15,553 15,914
Others 31,691 31,128 31,340 31,219 30,771 29,212 28,275
Special Purpose Vehicles 24,884 22,729 23,920 23,466 22,135 20,755 19.840
NHA MBS 138,130 197,260 171,713 182,828 192,993 241,505 265,480
Source: CMHC as per reference on americacanada.blogspot.com;
The americacanada.blogspot.com10 noticed that between 2007 and Q1 2009, Canadian banks increased their
mortgage credit outstanding listed on their books by only 1 percent (from 442.1 billion to 446.7 billion). Over the
same period, CMHC increased its mortgage credit outstanding through issuance of MBS (mortgage-backed
securities) by 92 percent (from 138.1 billion to 265.5 billion). This is a strong indicator that banks are reluctant to
lend, while CMHC adds more liabilities to its books to comply with politically motivated instructions of the
government.
Nearly 90 of mortgages issued between 2007 and 2009 were securitised through Mortgage Back Securities. By
definition:
A mortgage-backed security (MBS) is an asset-backed security or debt obligation that
represents a claim on the cash flows from mortgage loans, most commonly on residential
property.
Mortgage securitisation is a process of aggregating mortgages in a pool, then issuing new securities backed by the
pool. It helps to mitigate the risk, spreading it amongst a greater number of creditors. It also helps by liabilities off
lenders balance sheets.
CMHC‟s MBS should be a concern to all Canadians. MBS have proven to be a financial instrument of mass
destruction in the US. When you think of MBS, think of Fannie Mae and Freddie Mac. Through MBS, American
lenders spread the risk, sharing it with the parties who did not directly participate in sub-prime lending. Once the
bubble burst, it wasn‟t just lenders responsible for bad loans, but also all investors holding MBS in their portfolio.
In Canada, the situation is different. MBS issued by CMHC are guaranteed by the government of Canada. What it
means is when the loans go bad, the investors who purchased risky investments and benefitted from holding them
all these years3 will not be responsible for losses. It will be Canadian taxpayers who are on the hook to
compensate for CMHC‟s sub-prime lending.
Nearly 90 of mortgages issued between 2007 and 2009 were securitised. By the end of 2007, there were $138
billion in MBS that is guaranteed by CMHC, which covers approximately 17 per cent of all outstanding mortgages.
By July 2009, that figure rose to $290 billion. CMHC's stated goal was to guarantee $340 billion by the end of this
year and is on track to reach $500 billion by the end of 2010, which would be would be equal to 1/3 of the
Canadian GDP. In fact, between 2008 and 2010 CMHC‟s issuance of MBSs will likely exceed the combined total
issued by CMHC in its 62-year long history prior to 2008. To reiterate, once borrowers begin to default, it will be
Canadian taxpayers who will have to bailout CMHC.
Alexandre Pestov February 2010
The Elusive Canadian Housing Bubble Page 26 of 51
SECTION SUMMARY
At the beginning of this section, it was quoted:
How do you know if something was a bubble? If you prick it and it bursts, it probably was a
bubble. If you prick it and it goes back to the original size, it probably wasn't.36
The unfortunate fact is Canadians perceive the current situation in exactly the same way. The global economy is
viewed on the path to recovery. The worse appears to be behind us, and if the bubble didn‟t burst, it wasn‟t a
bubble.
Unlike the US, Canada has had an untapped pool of sub-prime borrowers. Through a lengthy period of abused
interest rates and sub-prime lending, the US has exhausted all means of adding more buyers into the mix to
support the housing boom. However, in Canada, the government was able to turn CMHC into a sub-prime lender,
and it opened the gates to thousands of new buyers to enter the housing market. The scheme worked, and new
demand re-inflated the bubble.
In my conversations with others, I noticed many view this detrimental move as positive: the bottom-line is the
government did not allow prices to fall. Consider this metaphor.
Everyone likes to party, but no one likes a hangover. If one partied a bit too much last night, he will face a
headache, nausea, dizziness, fatigue and other highly unpleasant post-party symptoms today. One alternative is to
admit the mistake of yesterday, suffer through a day of hangover, and move on to leading more productive life
tomorrow. Another alternative is to keep drinking. Drinking in the morning helps to conceal side-effects of the last
night party, or so I was told. Unfortunately, the proper remediation of hangover in this fashion will leave you dead-
drunk again. So the hangover was not fully experienced today, because it was postponed until tomorrow. Well,
tomorrow you will face the same tough choice – experience a hangover, which will be much worse after two days
of non-stop alcohol consumption, or keep drinking. You may choose to continue with the “fighting fire with fire”
approach, but eventually substance abuse will catch up with you. At the worst, you may turn into a version of Ozzy
Osbourne, walk into your bedroom and announce to your wife (assuming you still have a wife at this point)
“We‟ve had a little talk and it‟s clear that you have to die.” At this time, you are likely to go through a rehab clean-
up, experience ruined personal and professional life, and be left with a bill for the gallons of consumed alcohol.
On a serious note, the point of the above metaphor is that sometimes it is necessary to acknowledge irresponsible
behaviour and face today‟s reality in order to avoid a bigger problem in the future. If you think of the Canadian
government during the 2007-2008 period, it acted as a friendly bartender who kept pouring drinks into your glass,
assuring you it will help to avoid a hangover. Surely, the hangover was avoided on the day the glasses were filled
again. However, it cannot go on perpetually, and the subsequent crisis will be much worse when it eventually
unravels.
The hangover is not a problem. It is a logical consequence of the behaviour exhibited the day before. Headache
and other unpleasant side-effects are just the indicators of excessive and harmful toxins in your body. To avoid the
problem, you should concentrate on limiting alcohol consumption, and not fighting the headache. Similarly, when a
“low fuel” light turns on in a car, the problem isn‟t the light itself, but the low fuel level in the car. Disabling the
light will not solve the problem. To rectify it you will need to make a trip to a gas station, pull out the wallet and
buy some gas.
Economy functions in exactly the same manner. Drop in housing prices is not the problem in itself. It is an
indicator of excessively high housing prices, low affordability or oversupply. The true issue is imbalances in a
Alexandre Pestov February 2010
The Elusive Canadian Housing Bubble Page 27 of 51
particular asset class or in overall economy. Housing prices would plunge because they don‟t reflect the underlying
fundamental value of the properties. The problem rectification efforts should be focused on purging these
imbalances from the system, and not artificially propping up prices.
The correction process is painful. No one likes to see the value of their homes going down. However, this is a
necessary adjustment to bring all elements of the equation back to balance. Again, home prices will adjust because
they are not supported by fundamentals, and not because someone did not stop them from collapsing. As painful
as it is in a short-run, the long-term benefits of it are quite obvious. Present affordability levels demand household
to spend greater portion of their income to cover home ownership costs. After the housing price adjustments,
home ownership costs will go down, and home buyers will retain a larger part of their income for other things like
travel, clothing, cars and entertainment. It makes a big difference if a property costs 3 times of your annual income
vs. 5.2 in Toronto and 9.3 in Vancouver now.
Going back to the discussion about CMHC, it must be mentioned that the actions of the Canadian government
inflicted significant damage on Canada and its population. If you are of an opinion that the current prices are
supported by the underlying fundamentals, then you would probably agree that the market forces would have
pushed the prices back up eventually. In such case, all the wasteful spending of the Harper government has been
done in vain, as they are irrelevant in the bigger schema of things. The upward correction would have happened
with or without them, albeit at a slower pace.
However, if you believe fundamentals aren‟t there, and the house of cards is bound to collapse, especially as new
storeys are continuously added to it, consider the impact of the Harper government‟s intervention. Assume if left
on its own, the real-estate downturn of 2007 would have impacted a population of X thousands people. Now,
another group of Y thousands buyers has been added to the mix through various programs designed to support
home prices, which pushed prices higher. Rising prices have provoked a group of Z thousands buyers to chase the
momentum in fear of missing out on profits or being totally priced out from the market. Simultaneously, CMHC
insured N billion dollars in risky mortgages. The aftermath of the impeding housing market bust will no longer be
limited to the original X thousands people, but would also impact the Y + Z thousands buyers who have been
sacrificed to drive home prices higher in 2008-2009. CMHC would face an excessively high default rate streaming
from all three groups X, Y and Z (substantially higher than the long-term average), and will unquestionably require
a bailout.
Unfortunately, integrity and long-term vision is a rare quality amongst politicians. Individuals such as Paul A.
Volcker and David A. Dodge, who have strong will to make politically unpopular moves to position their countries
on a path to long-term prosperity, appear once in a generation. Much more frequently, Alan Greenspans, Ben
Bernanke and Mark Carney would show up on the scene, and implement politically convenient policies to build an
illusion of prosperity at the expense of long-term financial well-being. Canadians own no favours to Steven Harper,
Jim Flaherty and Mark Carney. They did not prevent the bubble from bursting; they merely postponed it. There are
no miracles in how the Canadian housing bubble managed to stay afloat. However, at the end, more homeowners
will suffer from the upcoming housing market correction. The ballooning national debt due to the careless sub-
prime lending of CMHC and wasteful programmes designed to re-inflate the housing bubble will be shared by all
Canadians. According to the CMHC financial statements, the corporation has only $8 billion equity backing $200
billion in assets8. Once defaults rise, the Canadian government will have no choice, but to bail out CMHC. The
scale of bailout will likely dwarf all other financial emergency responses done by the Canadian government in the
history of Canada. Higher national debt, increased taxes and reduced social services will be the direct result of the
Harper government‟s intervention to maintain an illusion of the Canadian housing market health.
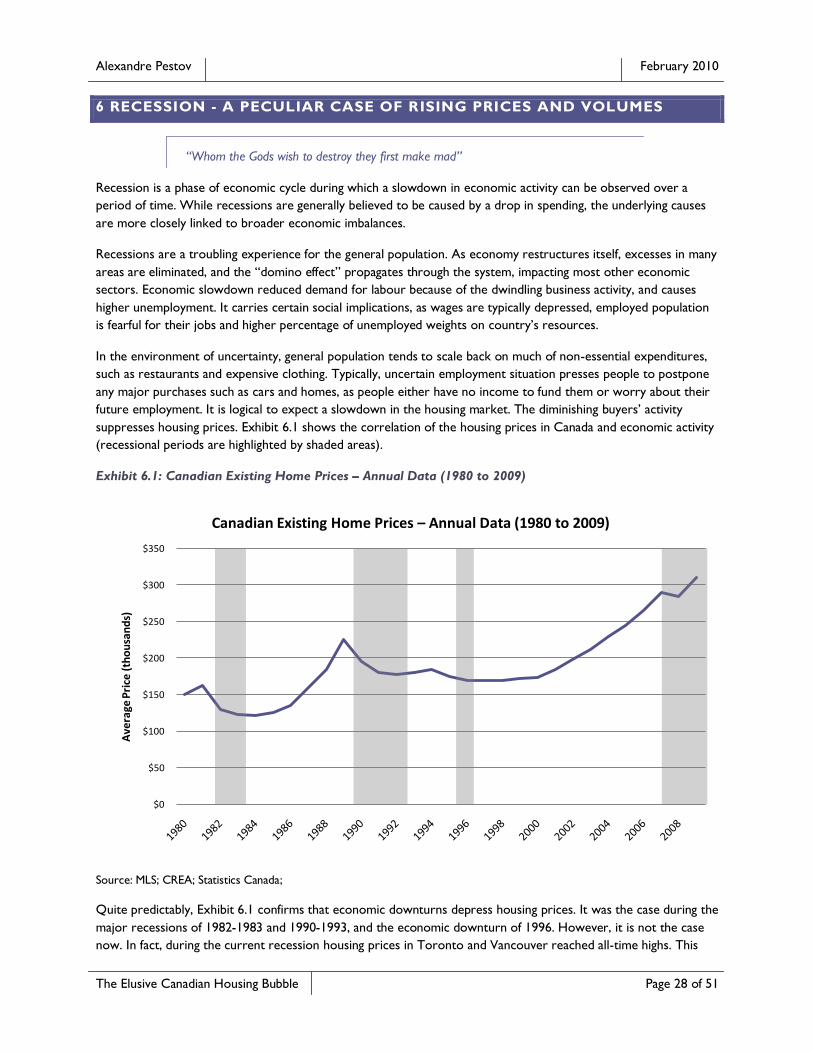
Alexandre Pestov February 2010
The Elusive Canadian Housing Bubble Page 28 of 51
6 RECESSION - A PECULIAR CASE OF RISING PRICES AND VOLUMES
“Whom the Gods wish to destroy they first make mad”
Recession is a phase of economic cycle during which a slowdown in economic activity can be observed over a
period of time. While recessions are generally believed to be caused by a drop in spending, the underlying causes
are more closely linked to broader economic imbalances.
Recessions are a troubling experience for the general population. As economy restructures itself, excesses in many
areas are eliminated, and the “domino effect” propagates through the system, impacting most other economic
sectors. Economic slowdown reduced demand for labour because of the dwindling business activity, and causes
higher unemployment. It carries certain social implications, as wages are typically depressed, employed population
is fearful for their jobs and higher percentage of unemployed weights on country‟s resources.
In the environment of uncertainty, general population tends to scale back on much of non-essential expenditures,
such as restaurants and expensive clothing. Typically, uncertain employment situation presses people to postpone
any major purchases such as cars and homes, as people either have no income to fund them or worry about their
future employment. It is logical to expect a slowdown in the housing market. The diminishing buyers‟ activity
suppresses housing prices. Exhibit 6.1 shows the correlation of the housing prices in Canada and economic activity
(recessional periods are highlighted by shaded areas).
Exhibit 6.1: Canadian Existing Home Prices – Annual Data (1980 to 2009)
Source: MLS; CREA; Statistics Canada;
Quite predictably, Exhibit 6.1 confirms that economic downturns depress housing prices. It was the case during the
major recessions of 1982-1983 and 1990-1993, and the economic downturn of 1996. However, it is not the case
now. In fact, during the current recession housing prices in Toronto and Vancouver reached all-time highs. This
$0
$50
$100
$150
$200
$250
$300
$350
Ave
rage
Pri
ce (
tho
usa
nd
s)
Canadian Existing Home Prices – Annual Data (1980 to 2009)
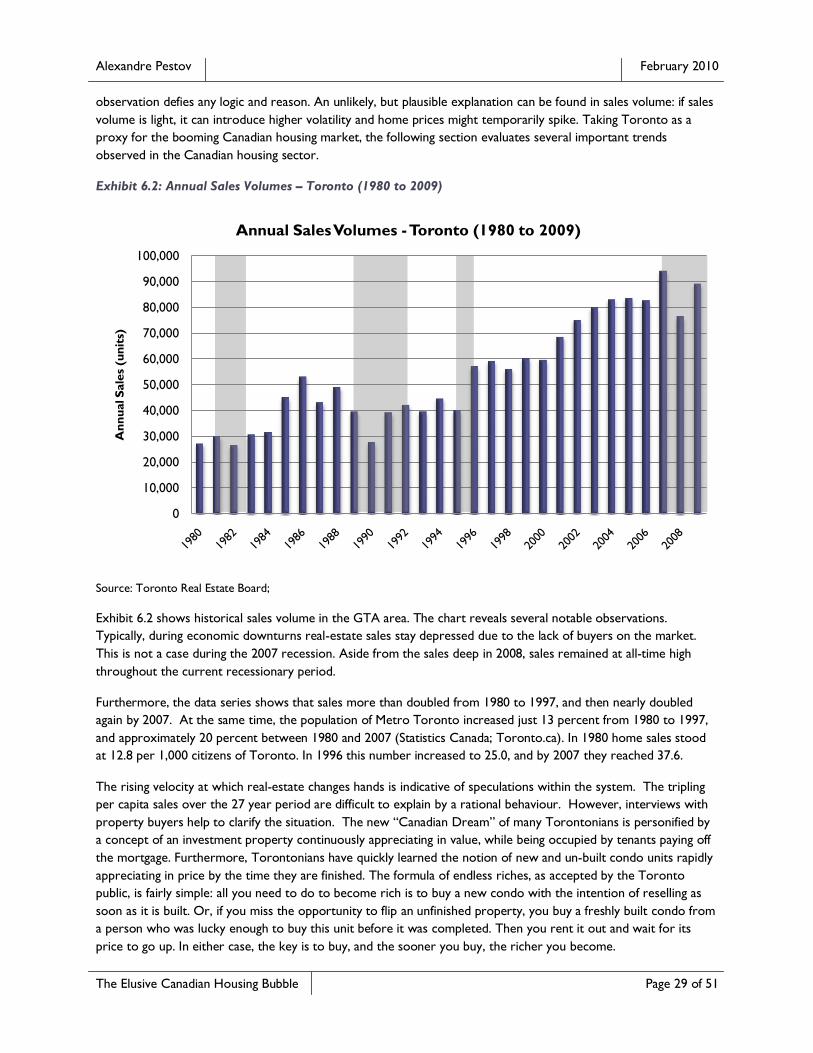
Alexandre Pestov February 2010
The Elusive Canadian Housing Bubble Page 29 of 51
observation defies any logic and reason. An unlikely, but plausible explanation can be found in sales volume: if sales
volume is light, it can introduce higher volatility and home prices might temporarily spike. Taking Toronto as a
proxy for the booming Canadian housing market, the following section evaluates several important trends
observed in the Canadian housing sector.
Exhibit 6.2: Annual Sales Volumes – Toronto (1980 to 2009)
Source: Toronto Real Estate Board;
Exhibit 6.2 shows historical sales volume in the GTA area. The chart reveals several notable observations.
Typically, during economic downturns real-estate sales stay depressed due to the lack of buyers on the market.
This is not a case during the 2007 recession. Aside from the sales deep in 2008, sales remained at all-time high
throughout the current recessionary period.
Furthermore, the data series shows that sales more than doubled from 1980 to 1997, and then nearly doubled
again by 2007. At the same time, the population of Metro Toronto increased just 13 percent from 1980 to 1997,
and approximately 20 percent between 1980 and 2007 (Statistics Canada; Toronto.ca). In 1980 home sales stood
at 12.8 per 1,000 citizens of Toronto. In 1996 this number increased to 25.0, and by 2007 they reached 37.6.
The rising velocity at which real-estate changes hands is indicative of speculations within the system. The tripling
per capita sales over the 27 year period are difficult to explain by a rational behaviour. However, interviews with
property buyers help to clarify the situation. The new “Canadian Dream” of many Torontonians is personified by
a concept of an investment property continuously appreciating in value, while being occupied by tenants paying off
the mortgage. Furthermore, Torontonians have quickly learned the notion of new and un-built condo units rapidly
appreciating in price by the time they are finished. The formula of endless riches, as accepted by the Toronto
public, is fairly simple: all you need to do to become rich is to buy a new condo with the intention of reselling as
soon as it is built. Or, if you miss the opportunity to flip an unfinished property, you buy a freshly built condo from
a person who was lucky enough to buy this unit before it was completed. Then you rent it out and wait for its
price to go up. In either case, the key is to buy, and the sooner you buy, the richer you become.
0
10,000
20,000
30,000
40,000
50,000
60,000
70,000
80,000
90,000
100,000
An
nu
al S
ale
s (u
nit
s)
Annual Sales Volumes -Toronto (1980 to 2009)
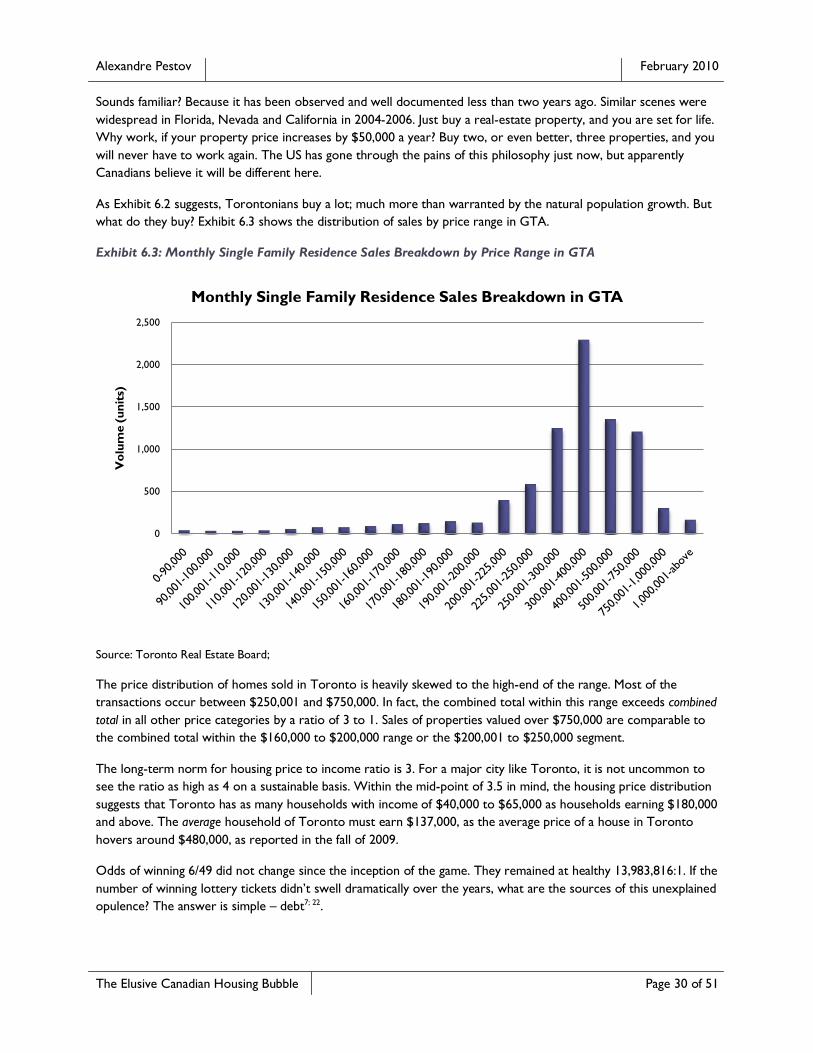
Alexandre Pestov February 2010
The Elusive Canadian Housing Bubble Page 30 of 51
Sounds familiar? Because it has been observed and well documented less than two years ago. Similar scenes were
widespread in Florida, Nevada and California in 2004-2006. Just buy a real-estate property, and you are set for life.
Why work, if your property price increases by $50,000 a year? Buy two, or even better, three properties, and you
will never have to work again. The US has gone through the pains of this philosophy just now, but apparently
Canadians believe it will be different here.
As Exhibit 6.2 suggests, Torontonians buy a lot; much more than warranted by the natural population growth. But
what do they buy? Exhibit 6.3 shows the distribution of sales by price range in GTA.
Exhibit 6.3: Monthly Single Family Residence Sales Breakdown by Price Range in GTA
Source: Toronto Real Estate Board;
The price distribution of homes sold in Toronto is heavily skewed to the high-end of the range. Most of the
transactions occur between $250,001 and $750,000. In fact, the combined total within this range exceeds combined
total in all other price categories by a ratio of 3 to 1. Sales of properties valued over $750,000 are comparable to
the combined total within the $160,000 to $200,000 range or the $200,001 to $250,000 segment.
The long-term norm for housing price to income ratio is 3. For a major city like Toronto, it is not uncommon to
see the ratio as high as 4 on a sustainable basis. Within the mid-point of 3.5 in mind, the housing price distribution
suggests that Toronto has as many households with income of $40,000 to $65,000 as households earning $180,000
and above. The average household of Toronto must earn $137,000, as the average price of a house in Toronto
hovers around $480,000, as reported in the fall of 2009.
Odds of winning 6/49 did not change since the inception of the game. They remained at healthy 13,983,816:1. If the
number of winning lottery tickets didn‟t swell dramatically over the years, what are the sources of this unexplained
opulence? The answer is simple – debt7; 22.
0
500
1,000
1,500
2,000
2,500
Vo
lum
e (
un
its)
Monthly Single Family Residence Sales Breakdown in GTA
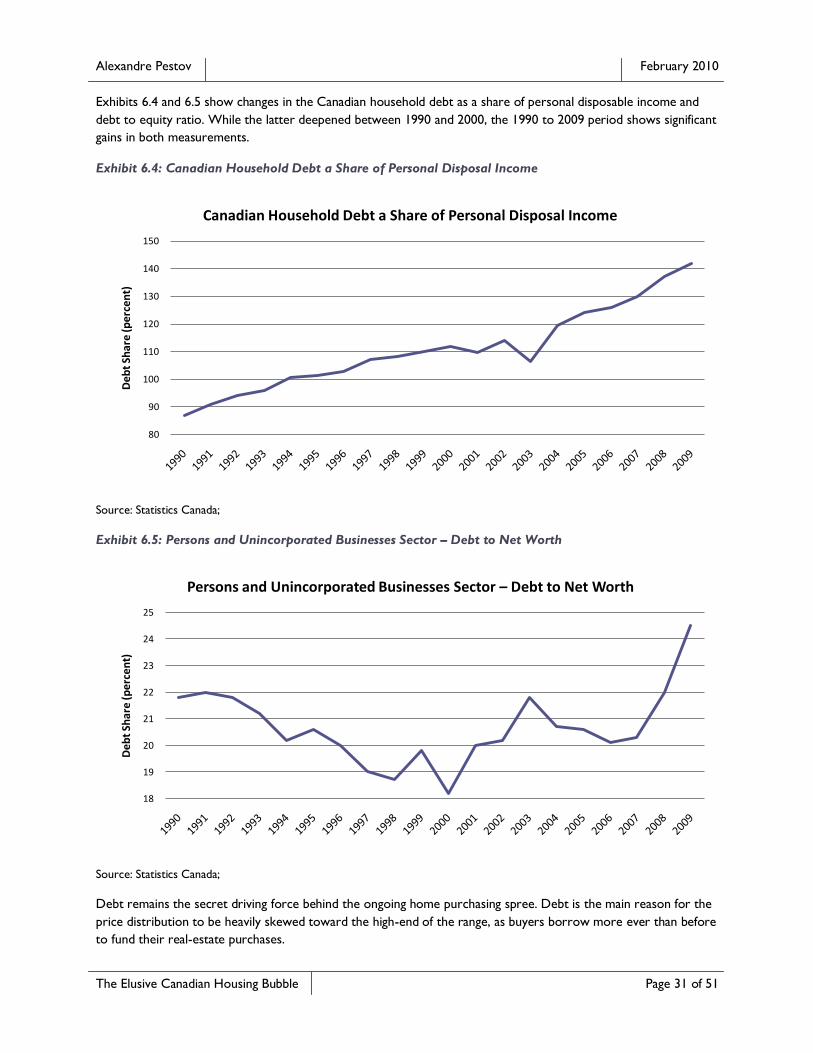
Alexandre Pestov February 2010
The Elusive Canadian Housing Bubble Page 31 of 51
Exhibits 6.4 and 6.5 show changes in the Canadian household debt as a share of personal disposable income and
debt to equity ratio. While the latter deepened between 1990 and 2000, the 1990 to 2009 period shows significant
gains in both measurements.
Exhibit 6.4: Canadian Household Debt a Share of Personal Disposal Income
Source: Statistics Canada;
Exhibit 6.5: Persons and Unincorporated Businesses Sector – Debt to Net Worth
Source: Statistics Canada;
Debt remains the secret driving force behind the ongoing home purchasing spree. Debt is the main reason for the
price distribution to be heavily skewed toward the high-end of the range, as buyers borrow more ever than before
to fund their real-estate purchases.
80
90
100
110
120
130
140
150
De
bt
Shar
e (p
erce
nt)
Canadian Household Debt a Share of Personal Disposal Income
18
19
20
21
22
23
24
25
De
bt
Shar
e (p
erc
ent)
Persons and Unincorporated Businesses Sector – Debt to Net Worth
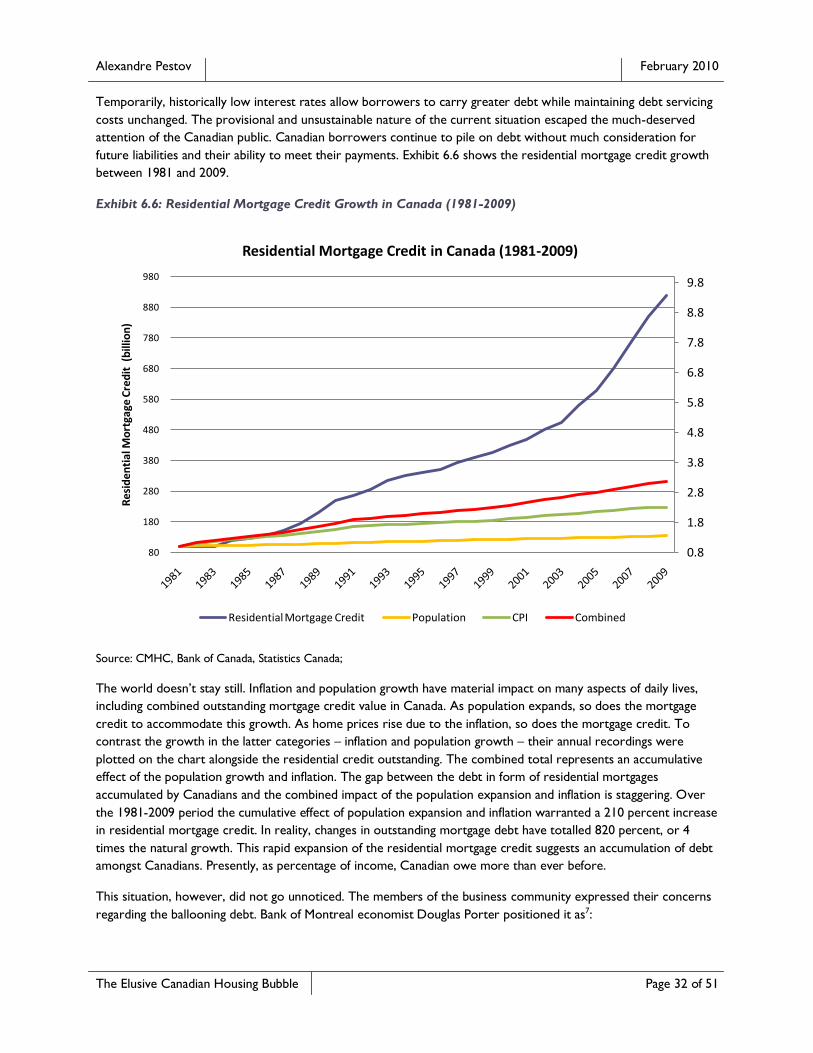
Alexandre Pestov February 2010
The Elusive Canadian Housing Bubble Page 32 of 51
Temporarily, historically low interest rates allow borrowers to carry greater debt while maintaining debt servicing
costs unchanged. The provisional and unsustainable nature of the current situation escaped the much-deserved
attention of the Canadian public. Canadian borrowers continue to pile on debt without much consideration for
future liabilities and their ability to meet their payments. Exhibit 6.6 shows the residential mortgage credit growth
between 1981 and 2009.
Exhibit 6.6: Residential Mortgage Credit Growth in Canada (1981-2009)
Source: CMHC, Bank of Canada, Statistics Canada;
The world doesn‟t stay still. Inflation and population growth have material impact on many aspects of daily lives,
including combined outstanding mortgage credit value in Canada. As population expands, so does the mortgage
credit to accommodate this growth. As home prices rise due to the inflation, so does the mortgage credit. To
contrast the growth in the latter categories – inflation and population growth – their annual recordings were
plotted on the chart alongside the residential credit outstanding. The combined total represents an accumulative
effect of the population growth and inflation. The gap between the debt in form of residential mortgages
accumulated by Canadians and the combined impact of the population expansion and inflation is staggering. Over
the 1981-2009 period the cumulative effect of population expansion and inflation warranted a 210 percent increase
in residential mortgage credit. In reality, changes in outstanding mortgage debt have totalled 820 percent, or 4
times the natural growth. This rapid expansion of the residential mortgage credit suggests an accumulation of debt
amongst Canadians. Presently, as percentage of income, Canadian owe more than ever before.
This situation, however, did not go unnoticed. The members of the business community expressed their concerns
regarding the ballooning debt. Bank of Montreal economist Douglas Porter positioned it as7:
0.8
1.8
2.8
3.8
4.8
5.8
6.8
7.8
8.8
9.8
80
180
280
380
480
580
680
780
880
980
Res
iden
tial
Mo
rtga
ge C
red
it (
bill
ion
)
Residential Mortgage Credit in Canada (1981-2009)
Residential Mortgage Credit Population CPI Combined
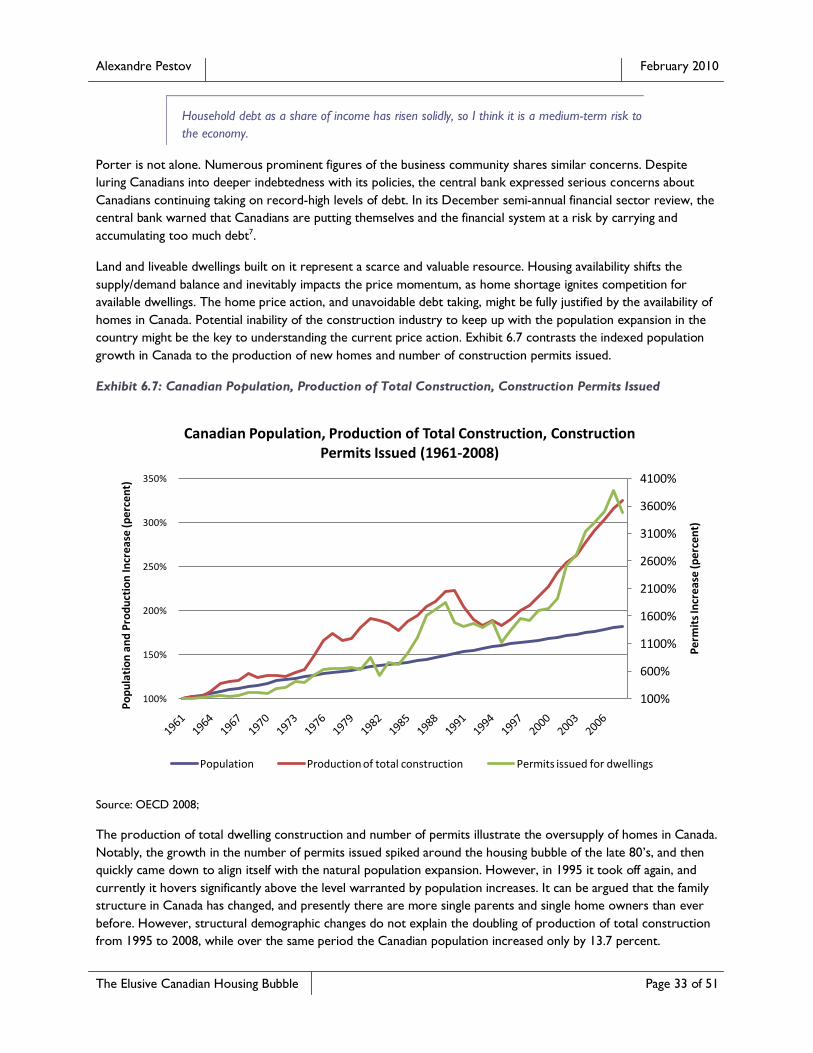
Alexandre Pestov February 2010
The Elusive Canadian Housing Bubble Page 33 of 51
Household debt as a share of income has risen solidly, so I think it is a medium-term risk to
the economy.
Porter is not alone. Numerous prominent figures of the business community shares similar concerns. Despite
luring Canadians into deeper indebtedness with its policies, the central bank expressed serious concerns about
Canadians continuing taking on record-high levels of debt. In its December semi-annual financial sector review, the
central bank warned that Canadians are putting themselves and the financial system at a risk by carrying and
accumulating too much debt7.
Land and liveable dwellings built on it represent a scarce and valuable resource. Housing availability shifts the
supply/demand balance and inevitably impacts the price momentum, as home shortage ignites competition for
available dwellings. The home price action, and unavoidable debt taking, might be fully justified by the availability of
homes in Canada. Potential inability of the construction industry to keep up with the population expansion in the
country might be the key to understanding the current price action. Exhibit 6.7 contrasts the indexed population
growth in Canada to the production of new homes and number of construction permits issued.
Exhibit 6.7: Canadian Population, Production of Total Construction, Construction Permits Issued
Source: OECD 2008;
The production of total dwelling construction and number of permits illustrate the oversupply of homes in Canada.
Notably, the growth in the number of permits issued spiked around the housing bubble of the late 80‟s, and then
quickly came down to align itself with the natural population expansion. However, in 1995 it took off again, and
currently it hovers significantly above the level warranted by population increases. It can be argued that the family
structure in Canada has changed, and presently there are more single parents and single home owners than ever
before. However, structural demographic changes do not explain the doubling of production of total construction
from 1995 to 2008, while over the same period the Canadian population increased only by 13.7 percent.
100%
600%
1100%
1600%
2100%
2600%
3100%
3600%
4100%
100%
150%
200%
250%
300%
350%
Pe
rmit
s In
cre
ase
(p
erc
en
t)
Po
pu
lati
on
an
d P
rod
uct
ion
In
cre
ase
(p
erc
en
t)
Canadian Population, Production of Total Construction, Construction Permits Issued (1961-2008)
Population Production of total construction Permits issued for dwellings
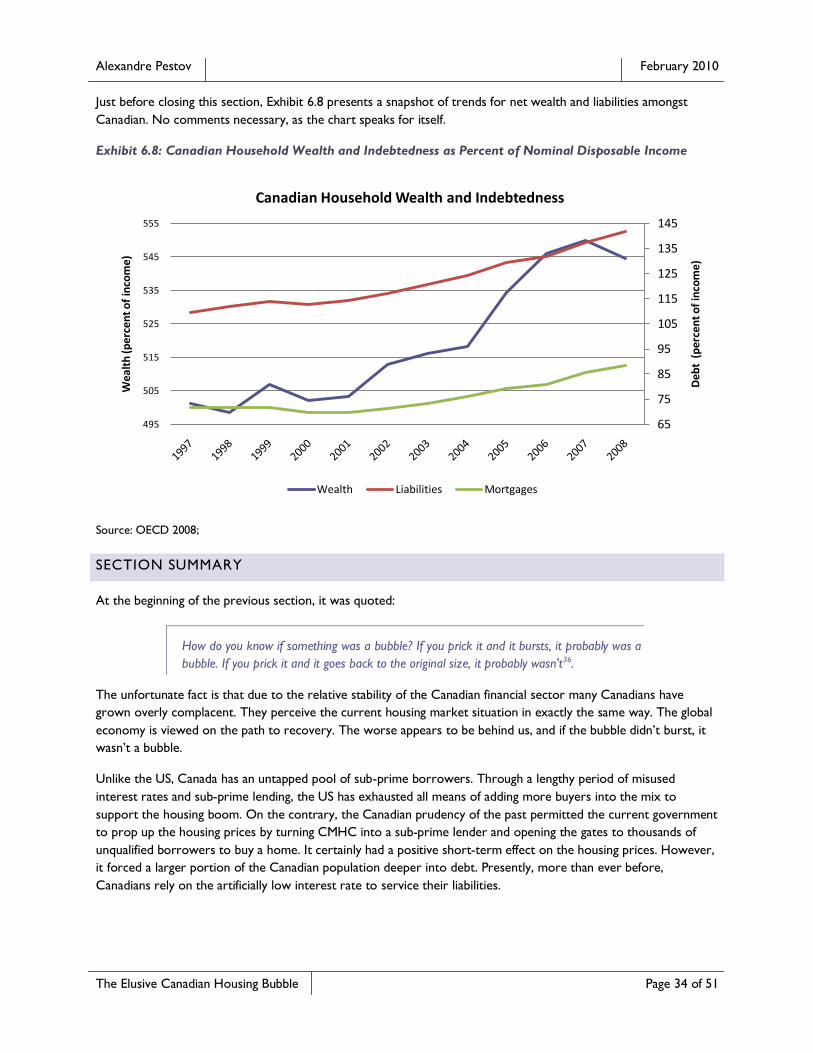
Alexandre Pestov February 2010
The Elusive Canadian Housing Bubble Page 34 of 51
Just before closing this section, Exhibit 6.8 presents a snapshot of trends for net wealth and liabilities amongst
Canadian. No comments necessary, as the chart speaks for itself.
Exhibit 6.8: Canadian Household Wealth and Indebtedness as Percent of Nominal Disposable Income
Source: OECD 2008;
SECTION SUMMARY
At the beginning of the previous section, it was quoted:
How do you know if something was a bubble? If you prick it and it bursts, it probably was a
bubble. If you prick it and it goes back to the original size, it probably wasn't36.
The unfortunate fact is that due to the relative stability of the Canadian financial sector many Canadians have
grown overly complacent. They perceive the current housing market situation in exactly the same way. The global
economy is viewed on the path to recovery. The worse appears to be behind us, and if the bubble didn‟t burst, it
wasn‟t a bubble.
Unlike the US, Canada has an untapped pool of sub-prime borrowers. Through a lengthy period of misused
interest rates and sub-prime lending, the US has exhausted all means of adding more buyers into the mix to
support the housing boom. On the contrary, the Canadian prudency of the past permitted the current government
to prop up the housing prices by turning CMHC into a sub-prime lender and opening the gates to thousands of
unqualified borrowers to buy a home. It certainly had a positive short-term effect on the housing prices. However,
it forced a larger portion of the Canadian population deeper into debt. Presently, more than ever before,
Canadians rely on the artificially low interest rate to service their liabilities.
65
75
85
95
105
115
125
135
145
495
505
515
525
535
545
555
Deb
t (
per
cen
t o
f in
com
e)
Wea
lth
(per
cen
t o
f in
com
e)
Canadian Household Wealth and Indebtedness
Wealth Liabilities Mortgages
Alexandre Pestov February 2010
The Elusive Canadian Housing Bubble Page 35 of 51
The growth of the housing prices and post-2007 period of high activity on the housing market are not surprising.
Greater demand pushed prices higher, and cheap credit allowed effortless financing of the price inflation. However,
it leads to an erroneous conclusion about the health of the system.
A comparison of the population growth to the expansion of the housing sector strongly suggests overbuilding.
Perhaps, not as severe as the housing situation was in Miami, FL or Spain, the oversupply of homes shows an
immense disconnect between the prices warranted by the supply/demand conditions and the market prices. The
decoupling of the market from its fundamentals signals a mass insanity that has engulfed Canadians. And mass
madness it is. Collectively, Canadians build more homes than they need, buy more homes than they require for
living, spend more than they can afford and finance these senseless purchases with debt they cannot service in the
long run.
At present, the Canadian economy still hasn‟t fully recovered, and fears of double-deep recessions are fully
warranted. Unemployment edges higher. The wealth of Canadians is diminishing. Yet, the housing activity remains
stronger than ever both in terms of volume and price growth. The surge of the housing market builds an illusion of
a prosperous Canadian population capable of buying pricey properties. The unfortunate reality is the purchases are
financed by mounting debt, rather than increasing wealth. Canadians are sinking deeper into debt by buying houses
they cannot afford. The driving force behind many purchases remains The Greater Fool who would eventually take
houses off the “investors‟” hands at a higher price. If everyone is waiting for a greater fool, who is left to be one?
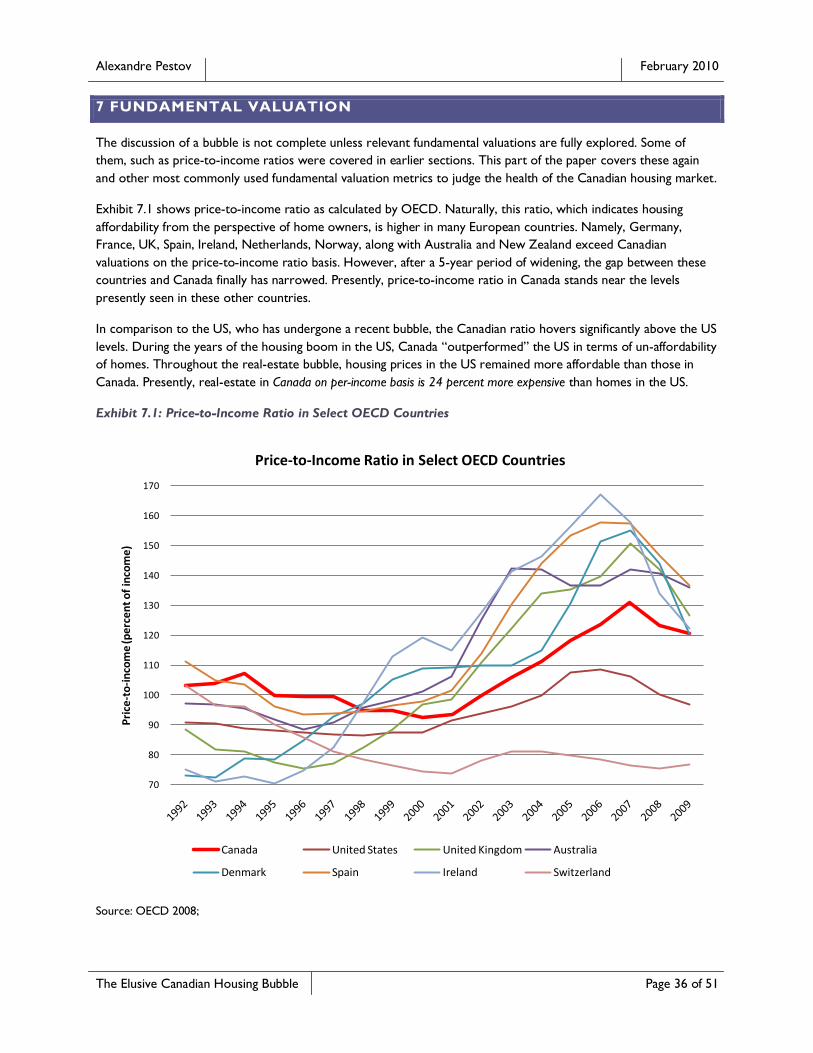
Alexandre Pestov February 2010
The Elusive Canadian Housing Bubble Page 36 of 51
7 FUNDAMENTAL VALUATION
The discussion of a bubble is not complete unless relevant fundamental valuations are fully explored. Some of
them, such as price-to-income ratios were covered in earlier sections. This part of the paper covers these again
and other most commonly used fundamental valuation metrics to judge the health of the Canadian housing market.
Exhibit 7.1 shows price-to-income ratio as calculated by OECD. Naturally, this ratio, which indicates housing
affordability from the perspective of home owners, is higher in many European countries. Namely, Germany,
France, UK, Spain, Ireland, Netherlands, Norway, along with Australia and New Zealand exceed Canadian
valuations on the price-to-income ratio basis. However, after a 5-year period of widening, the gap between these
countries and Canada finally has narrowed. Presently, price-to-income ratio in Canada stands near the levels
presently seen in these other countries.
In comparison to the US, who has undergone a recent bubble, the Canadian ratio hovers significantly above the US
levels. During the years of the housing boom in the US, Canada “outperformed” the US in terms of un-affordability
of homes. Throughout the real-estate bubble, housing prices in the US remained more affordable than those in
Canada. Presently, real-estate in Canada on per-income basis is 24 percent more expensive than homes in the US.
Exhibit 7.1: Price-to-Income Ratio in Select OECD Countries
Source: OECD 2008;
70
80
90
100
110
120
130
140
150
160
170
Pri
ce-t
o-i
nco
me
(per
cen
t o
f in
com
e)
Price-to-Income Ratio in Select OECD Countries
Canada United States United Kingdom Australia
Denmark Spain Ireland Switzerland
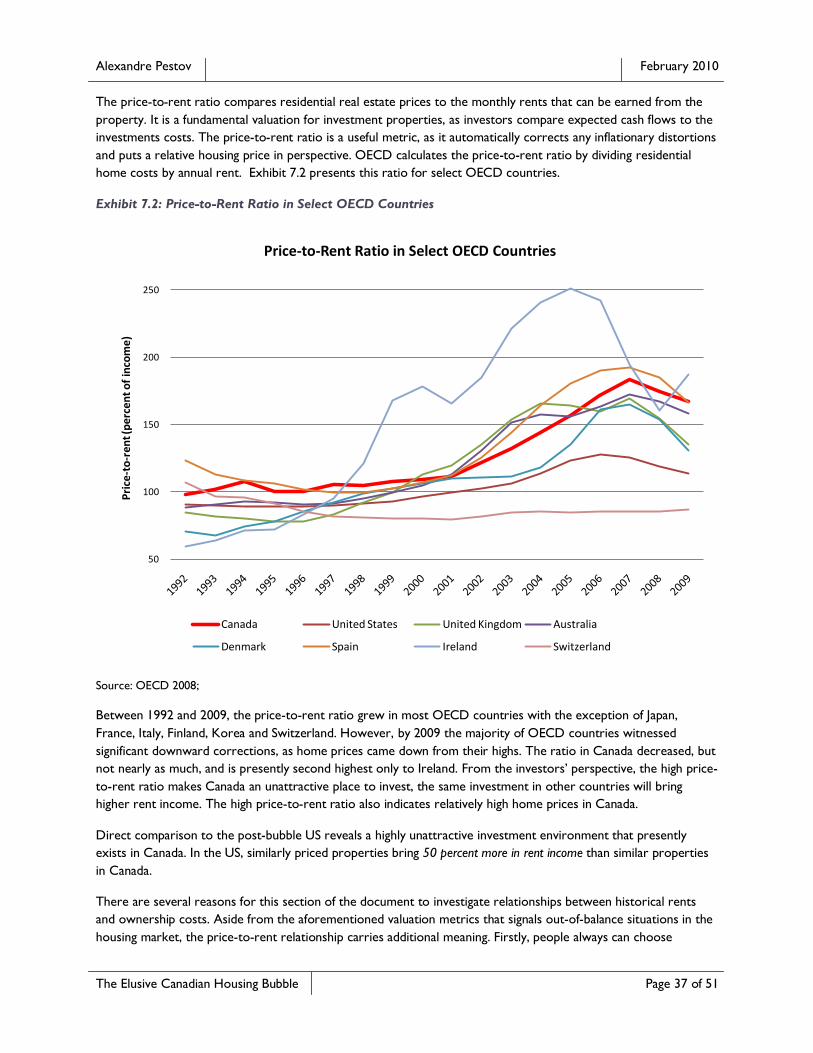
Alexandre Pestov February 2010
The Elusive Canadian Housing Bubble Page 37 of 51
The price-to-rent ratio compares residential real estate prices to the monthly rents that can be earned from the
property. It is a fundamental valuation for investment properties, as investors compare expected cash flows to the
investments costs. The price-to-rent ratio is a useful metric, as it automatically corrects any inflationary distortions
and puts a relative housing price in perspective. OECD calculates the price-to-rent ratio by dividing residential
home costs by annual rent. Exhibit 7.2 presents this ratio for select OECD countries.
Exhibit 7.2: Price-to-Rent Ratio in Select OECD Countries
Source: OECD 2008;
Between 1992 and 2009, the price-to-rent ratio grew in most OECD countries with the exception of Japan,
France, Italy, Finland, Korea and Switzerland. However, by 2009 the majority of OECD countries witnessed
significant downward corrections, as home prices came down from their highs. The ratio in Canada decreased, but
not nearly as much, and is presently second highest only to Ireland. From the investors‟ perspective, the high price-
to-rent ratio makes Canada an unattractive place to invest, the same investment in other countries will bring
higher rent income. The high price-to-rent ratio also indicates relatively high home prices in Canada.
Direct comparison to the post-bubble US reveals a highly unattractive investment environment that presently
exists in Canada. In the US, similarly priced properties bring 50 percent more in rent income than similar properties
in Canada.
There are several reasons for this section of the document to investigate relationships between historical rents
and ownership costs. Aside from the aforementioned valuation metrics that signals out-of-balance situations in the
housing market, the price-to-rent relationship carries additional meaning. Firstly, people always can choose
50
100
150
200
250
Pri
ce-t
o-r
ent (
per
cen
t o
f in
com
e)
Price-to-Rent Ratio in Select OECD Countries
Canada United States United Kingdom Australia
Denmark Spain Ireland Switzerland
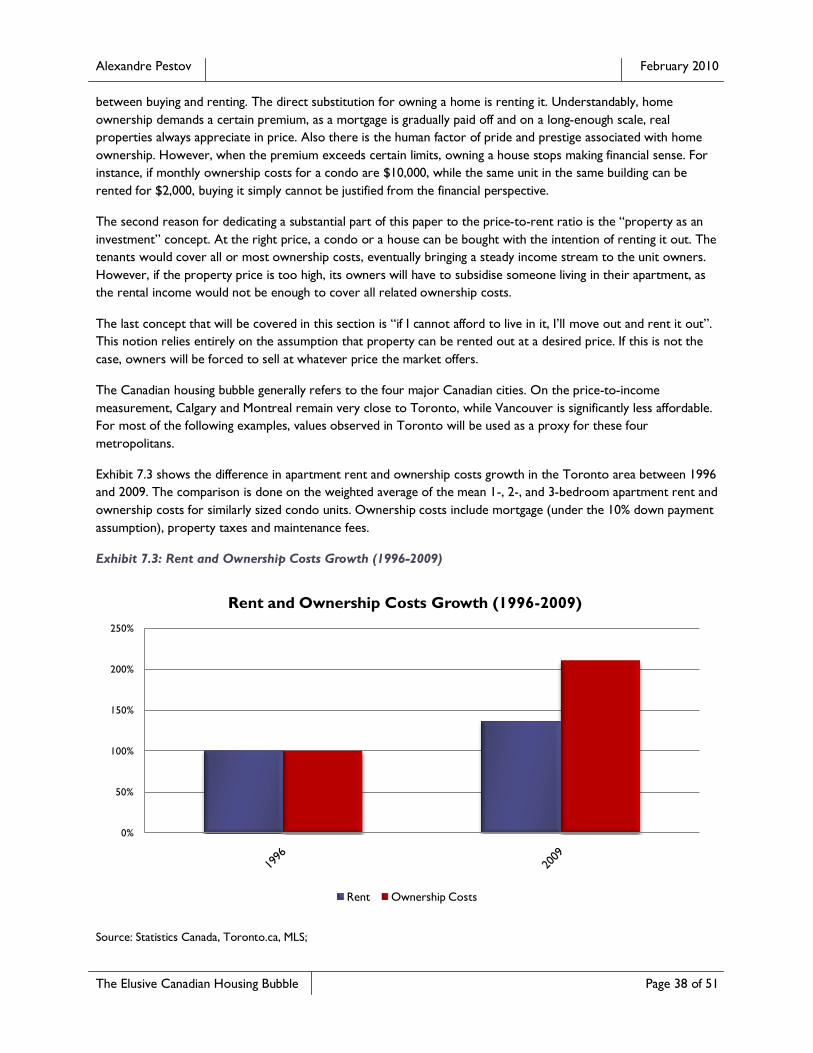
Alexandre Pestov February 2010
The Elusive Canadian Housing Bubble Page 38 of 51
between buying and renting. The direct substitution for owning a home is renting it. Understandably, home
ownership demands a certain premium, as a mortgage is gradually paid off and on a long-enough scale, real
properties always appreciate in price. Also there is the human factor of pride and prestige associated with home
ownership. However, when the premium exceeds certain limits, owning a house stops making financial sense. For
instance, if monthly ownership costs for a condo are $10,000, while the same unit in the same building can be
rented for $2,000, buying it simply cannot be justified from the financial perspective.
The second reason for dedicating a substantial part of this paper to the price-to-rent ratio is the “property as an
investment” concept. At the right price, a condo or a house can be bought with the intention of renting it out. The
tenants would cover all or most ownership costs, eventually bringing a steady income stream to the unit owners.
However, if the property price is too high, its owners will have to subsidise someone living in their apartment, as
the rental income would not be enough to cover all related ownership costs.
The last concept that will be covered in this section is “if I cannot afford to live in it, I‟ll move out and rent it out”.
This notion relies entirely on the assumption that property can be rented out at a desired price. If this is not the
case, owners will be forced to sell at whatever price the market offers.
The Canadian housing bubble generally refers to the four major Canadian cities. On the price-to-income
measurement, Calgary and Montreal remain very close to Toronto, while Vancouver is significantly less affordable.
For most of the following examples, values observed in Toronto will be used as a proxy for these four
metropolitans.
Exhibit 7.3 shows the difference in apartment rent and ownership costs growth in the Toronto area between 1996
and 2009. The comparison is done on the weighted average of the mean 1-, 2-, and 3-bedroom apartment rent and
ownership costs for similarly sized condo units. Ownership costs include mortgage (under the 10% down payment
assumption), property taxes and maintenance fees.
Exhibit 7.3: Rent and Ownership Costs Growth (1996-2009)
Source: Statistics Canada, Toronto.ca, MLS;
0%
50%
100%
150%
200%
250%
Rent and Ownership Costs Growth (1996-2009)
Rent Ownership Costs
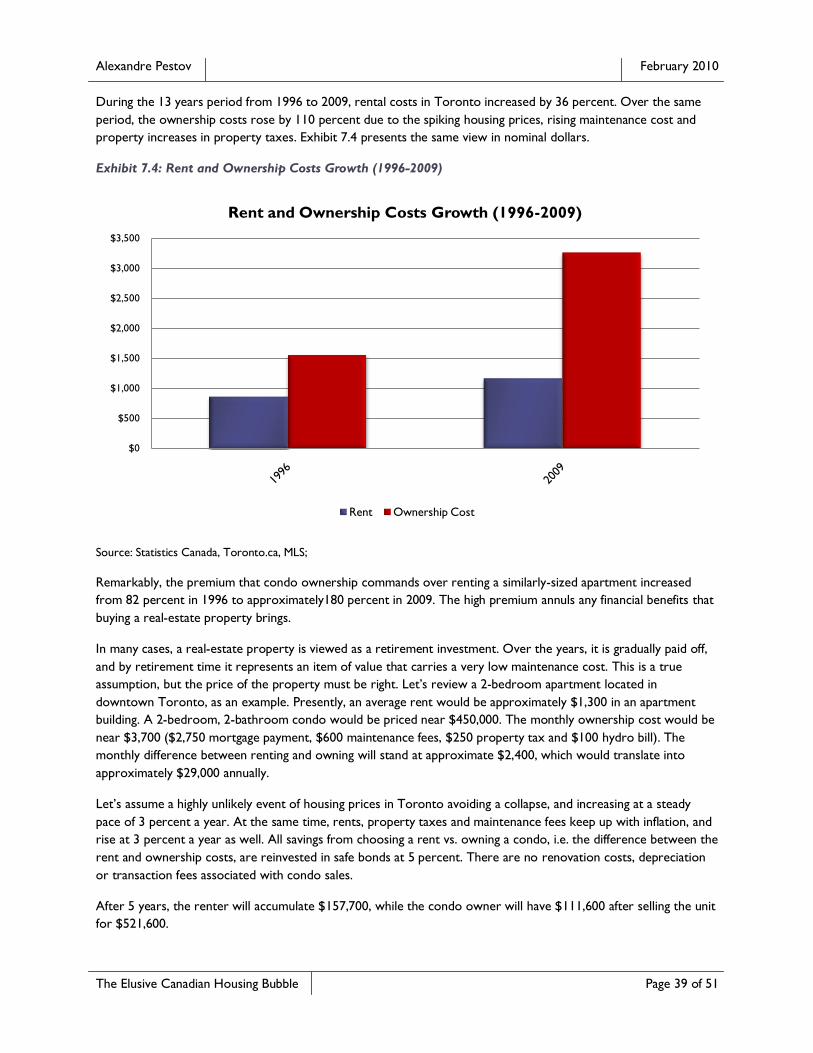
Alexandre Pestov February 2010
The Elusive Canadian Housing Bubble Page 39 of 51
During the 13 years period from 1996 to 2009, rental costs in Toronto increased by 36 percent. Over the same
period, the ownership costs rose by 110 percent due to the spiking housing prices, rising maintenance cost and
property increases in property taxes. Exhibit 7.4 presents the same view in nominal dollars.
Exhibit 7.4: Rent and Ownership Costs Growth (1996-2009)
Source: Statistics Canada, Toronto.ca, MLS;
Remarkably, the premium that condo ownership commands over renting a similarly-sized apartment increased
from 82 percent in 1996 to approximately180 percent in 2009. The high premium annuls any financial benefits that
buying a real-estate property brings.
In many cases, a real-estate property is viewed as a retirement investment. Over the years, it is gradually paid off,
and by retirement time it represents an item of value that carries a very low maintenance cost. This is a true
assumption, but the price of the property must be right. Let‟s review a 2-bedroom apartment located in
downtown Toronto, as an example. Presently, an average rent would be approximately $1,300 in an apartment
building. A 2-bedroom, 2-bathroom condo would be priced near $450,000. The monthly ownership cost would be
near $3,700 ($2,750 mortgage payment, $600 maintenance fees, $250 property tax and $100 hydro bill). The
monthly difference between renting and owning will stand at approximate $2,400, which would translate into
approximately $29,000 annually.
Let‟s assume a highly unlikely event of housing prices in Toronto avoiding a collapse, and increasing at a steady
pace of 3 percent a year. At the same time, rents, property taxes and maintenance fees keep up with inflation, and
rise at 3 percent a year as well. All savings from choosing a rent vs. owning a condo, i.e. the difference between the
rent and ownership costs, are reinvested in safe bonds at 5 percent. There are no renovation costs, depreciation
or transaction fees associated with condo sales.
After 5 years, the renter will accumulate $157,700, while the condo owner will have $111,600 after selling the unit
for $521,600.
$0
$500
$1,000
$1,500
$2,000
$2,500
$3,000
$3,500
Rent and Ownership Costs Growth (1996-2009)
Rent Ownership Cost
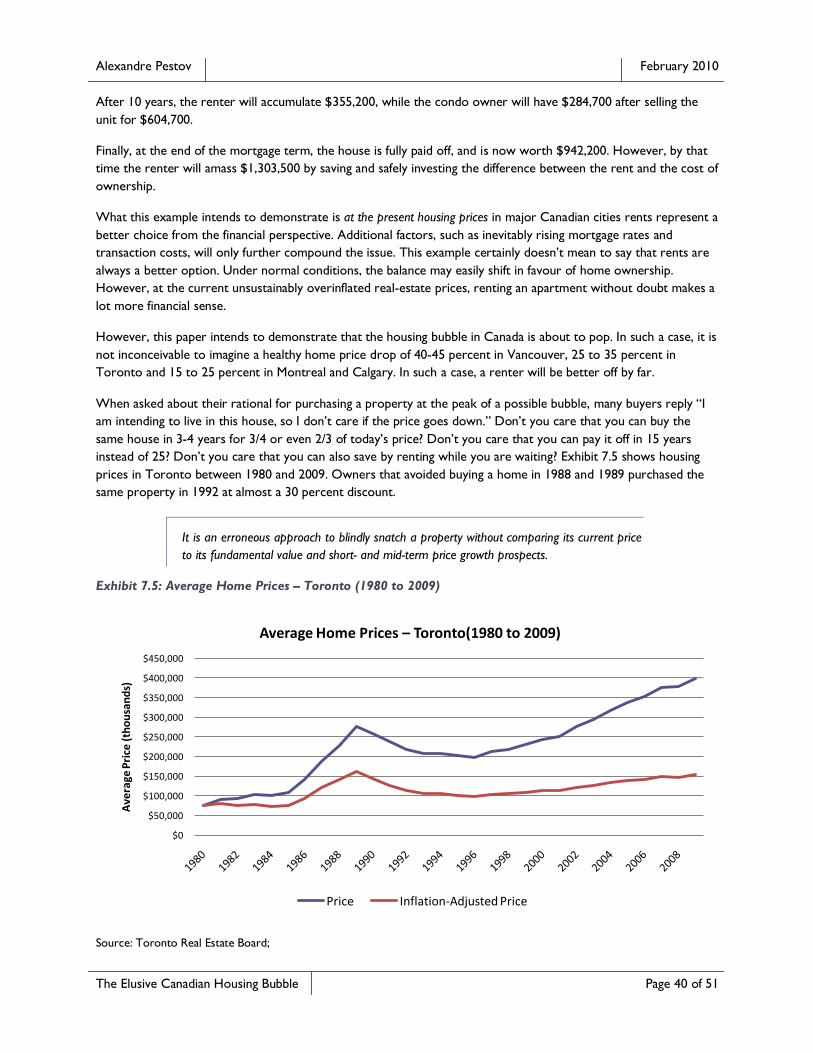
Alexandre Pestov February 2010
The Elusive Canadian Housing Bubble Page 40 of 51
After 10 years, the renter will accumulate $355,200, while the condo owner will have $284,700 after selling the
unit for $604,700.
Finally, at the end of the mortgage term, the house is fully paid off, and is now worth $942,200. However, by that
time the renter will amass $1,303,500 by saving and safely investing the difference between the rent and the cost of
ownership.
What this example intends to demonstrate is at the present housing prices in major Canadian cities rents represent a
better choice from the financial perspective. Additional factors, such as inevitably rising mortgage rates and
transaction costs, will only further compound the issue. This example certainly doesn‟t mean to say that rents are
always a better option. Under normal conditions, the balance may easily shift in favour of home ownership.
However, at the current unsustainably overinflated real-estate prices, renting an apartment without doubt makes a
lot more financial sense.
However, this paper intends to demonstrate that the housing bubble in Canada is about to pop. In such a case, it is
not inconceivable to imagine a healthy home price drop of 40-45 percent in Vancouver, 25 to 35 percent in
Toronto and 15 to 25 percent in Montreal and Calgary. In such a case, a renter will be better off by far.
When asked about their rational for purchasing a property at the peak of a possible bubble, many buyers reply “I
am intending to live in this house, so I don‟t care if the price goes down.” Don‟t you care that you can buy the
same house in 3-4 years for 3/4 or even 2/3 of today‟s price? Don‟t you care that you can pay it off in 15 years
instead of 25? Don‟t you care that you can also save by renting while you are waiting? Exhibit 7.5 shows housing
prices in Toronto between 1980 and 2009. Owners that avoided buying a home in 1988 and 1989 purchased the
same property in 1992 at almost a 30 percent discount.
It is an erroneous approach to blindly snatch a property without comparing its current price
to its fundamental value and short- and mid-term price growth prospects.
Exhibit 7.5: Average Home Prices – Toronto (1980 to 2009)
Source: Toronto Real Estate Board;
$0
$50,000
$100,000
$150,000
$200,000
$250,000
$300,000
$350,000
$400,000
$450,000
Ave
rage
Pri
ce (
tho
usa
nd
s)
Average Home Prices – Toronto(1980 to 2009)
Price Inflation-Adjusted Price
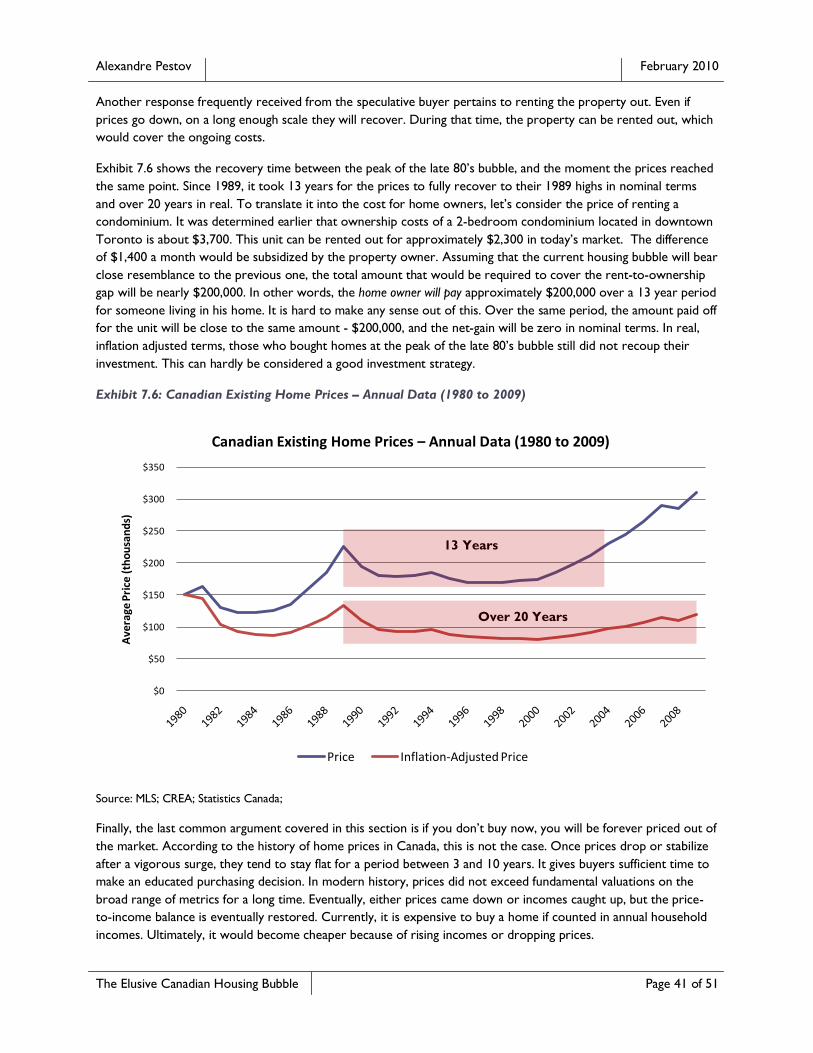
Alexandre Pestov February 2010
The Elusive Canadian Housing Bubble Page 41 of 51
Another response frequently received from the speculative buyer pertains to renting the property out. Even if
prices go down, on a long enough scale they will recover. During that time, the property can be rented out, which
would cover the ongoing costs.
Exhibit 7.6 shows the recovery time between the peak of the late 80‟s bubble, and the moment the prices reached
the same point. Since 1989, it took 13 years for the prices to fully recover to their 1989 highs in nominal terms
and over 20 years in real. To translate it into the cost for home owners, let‟s consider the price of renting a
condominium. It was determined earlier that ownership costs of a 2-bedroom condominium located in downtown
Toronto is about $3,700. This unit can be rented out for approximately $2,300 in today‟s market. The difference
of $1,400 a month would be subsidized by the property owner. Assuming that the current housing bubble will bear
close resemblance to the previous one, the total amount that would be required to cover the rent-to-ownership
gap will be nearly $200,000. In other words, the home owner will pay approximately $200,000 over a 13 year period
for someone living in his home. It is hard to make any sense out of this. Over the same period, the amount paid off
for the unit will be close to the same amount - $200,000, and the net-gain will be zero in nominal terms. In real,
inflation adjusted terms, those who bought homes at the peak of the late 80‟s bubble still did not recoup their
investment. This can hardly be considered a good investment strategy.
Exhibit 7.6: Canadian Existing Home Prices – Annual Data (1980 to 2009)
Source: MLS; CREA; Statistics Canada;
Finally, the last common argument covered in this section is if you don‟t buy now, you will be forever priced out of
the market. According to the history of home prices in Canada, this is not the case. Once prices drop or stabilize
after a vigorous surge, they tend to stay flat for a period between 3 and 10 years. It gives buyers sufficient time to
make an educated purchasing decision. In modern history, prices did not exceed fundamental valuations on the
broad range of metrics for a long time. Eventually, either prices came down or incomes caught up, but the price-
to-income balance is eventually restored. Currently, it is expensive to buy a home if counted in annual household
incomes. Ultimately, it would become cheaper because of rising incomes or dropping prices.
$0
$50
$100
$150
$200
$250
$300
$350
Ave
rage
Pri
ce (
tho
usa
nd
s)
Canadian Existing Home Prices – Annual Data (1980 to 2009)
Price Inflation-Adjusted Price
13 Years
Over 20 Years
Alexandre Pestov February 2010
The Elusive Canadian Housing Bubble Page 42 of 51
SECTION SUMMARY
Applying fundamental analysis using various valuation metrics is a useful exercise to estimate relative property
value. It eliminates distortions introduced by external factors such as inflation and puts nominal price in
perspective. From time to time, market value will deviate from the underlying fundamentals, and this situation may
last for extended periods. However, when the gap between the fundamental and market values widens to the
extreme, such a shaky state typically begins to signal an inevitable upcoming correction.
The global housing boom of the early 2000s has sent housing prices sharply higher in many developed and
developing countries. The long-term balance of home prices to other components of the economy has been
violated. The correction of 2007-2009 exposed the instability of the situation, bringing housing prices lower and
closer to the long-term trends.
Canada did not steer clear of the housing rush. Home prices in Canada rose just as quickly as those in many other
countries. And just like in many other countries, fundamental values of homes in Canada did not keep up with the
rising prices, driving key valuation metrics out of balance.
The fact that the US has done through a housing bubble is no longer questioned. Given the unique positioning of
the US with respect to Canada, it can be useful to benchmark Canada to the US to gauge a relative health of the
Canadian housing market. According to price-to-income and price-to-rent metrics, the housing boom in Canada
has contributed to a greater divergence between fundamental and market prices (Exhibits 7.1 and 7.2). The
housing affordability and balanced price-to-rent ratio deteriorated just as rapidly in Canada as they did in the US.
This strongly signals an upcoming correction. While the price correction lies in the US‟s past, it is still in the
Canadian future.
Current housing prices in Toronto, Vancouver, Montreal and Calgary are difficult to rationalize using any
combination of fundamental metrics. As history shows, this leads to a price correction. The disparity between
gains in income, growth in rental rates and home prices in Canada is quite apparent. Over the last 13 years,
growth in home prices substantially outperformed all other components. From the fundamental price-to-rent
perspective, real-estate as an investment no longer represents an attractive asset. In fact, at the current home
prices in major Canadian cities, renting an apartment makes more financial sense than owning it. This market state
leads to an array of predictable consequences. For instance, renting a property out now requires a substantial
subsidy by the home owner, which effectively eliminates renting out as a contingency measure in case of income
loss.
Alexandre Pestov February 2010
The Elusive Canadian Housing Bubble Page 43 of 51
8 PARTING WORDS
Alan Greenspan in his December 19, 2002 speech argued that asset bubbles cannot be detected. In 2007, his
successor Ben Bernanke endorsed the Greenspan doctrine, concluding that the Fed cannot reliably identify bubbles
in asset prices. This extraordinary admission made by the two Federal Reserve chairmen ignited a wildfire of
cheerful followers repeating the message. Hordes of financial advisors, portfolio managers, economists and
investments strategists joined the chorus of voices who explained performance gaps as part of the unpredictable
nature of the financial markets.
In fact, even Wikipedia in its “Economic Bubble” article states:
Within mainstream economics, many believe that bubbles cannot be identified in advance,
cannot be prevented from forming, that attempts to "prick" the bubble cause financial
crises, and that instead authorities should wait for bubbles to burst of their own accord,
dealing with the aftermath via monetary policy and fiscal policy.
Yet, there are plenty of economists and investors that saw the recent markets turmoil coming. They acted
accordingly, and shared their forecasts with the investment community. Some of them, notably Peter Schiff, toured
the country warning everyone who was willing to listen about the upcoming collapse. Nouriel Roubini was named
Dr. Doom for pointing out the cliff the US housing market was heading for. At the time, their Cassandrian
prophesies were dismissed as inappropriate. Now, they are referred to as prophets.
Schiff and Roubini saw the crisis coming. Yet, Greenspan and Bernanke, with all their infinite access to information,
did not see it. It raises the question of competence of either chairman, as Schiff and Roubini didn‟t use any mystical
powers or Voodoo techniques to predict the future direction of the economy. What they looked at were
fundamentals, and fundamentals told the full story about the disastrous sub-prime market meltdown before it
occurred. Fundamentals don‟t lie. They might be ignored, overlooked or downplayed. They might be muted by the
century-old saying “it is different this time”. But they always come back with a vengeance and take back a dollar on
a penny from every person who ignored them.
“It is different this time” works every time, as bullish messages resonate with the investors much better than
bearish news does. The nature of most human-build social systems is contingent upon positive news, and there will
be no shortage of authoritative figures preaching growth of a particular asset. It takes an enormous will and
political power to follow the path set by Roubini and Schiff. They were mocked and laughed at for years before the
crisis. It is much simpler to send good vibes and positive waves to the public, and blame it on unpredictable and
undetectable bubbles, just as the Greenspan-Bernanke pair did.
It must be remembered that most of the industry participants in the investment field feed of positive news.
Investment banks succeed through successful placement of debt and equities. Advisors, mutual fund administrators
have a vested interest in asset classes going up, as they have to report positive returns to their clients. The greater
portion of the investment industry‟s success is directly linked to the market going up. Similarly, the real-estate
industry needs prices to go up too. Real-estate agents have a direct interest in convincing their clients that the
home they‟ll buy will appreciate in value. It is difficult to sell a home on a premise “buy it now, or the price will
plunge tomorrow, and you will be able to get it at half-price in a week.” Real-estate brokers and developers,
mortgage brokers and other parties involved in real-estate transactions have a personal interest in promoting the
illusion of prices rising into perpetuity. The mass media outlets don‟t want to be labelled clueless. It is much less
problematic to go with the flow, quote industry experts and then publish Greenspan‟s infamous excuses in case
things go wrong. However, a hard look past industry experts, TV personalities and co-workers may reveal a lot
more useful information about the current state of affairs. Challenging them for the sake of being different is not an
Alexandre Pestov February 2010
The Elusive Canadian Housing Bubble Page 44 of 51
approach, but evaluating fundamentals to see where the industry “experts” and even aimlessly wondering Federal
Reserve chairmen are wrong is.
What do the fundamentals say about the Canadian housing market? The most common valuation metrics are the
price-to-income ratio, price-to-rent ratio, affordability index, median multiple and household debt. All of them
were covered relative to the long-term Canadian average in the earlier sections of this report. Benchmarking
against the US was done for most of the metrics, as the US closely resembles Canada in many respects and has just
gone through a real-estate bubble burst.
The price-to-income ratio in Canada is at a historically high level. In fact, in some cities it is the highest on record.
Over the last 13 years home prices have become decoupled from homeowners income, the mean household
income has risen by 23 to 32 percent in the four largest Canadian cities. Over the same period, the average house
prices in these cities increased between 100 and 200 percent. Based on the price-to-income ratio, the four major
Canadian cities experienced growth comparable to that of the hottest spots of the US housing bubble. Yet, the US
bubble burst, but home prices in Canada remained around these tremendously high levels.
The price-to-rent ratio in Canada is second only to Ireland amongst all OECD countries, which effectively makes
Canada the least attractive place for real-estate investments. Based on this metric, the Canadian housing market is
50 percent overvalued in comparison to the US‟s.
Affordability in Canada is approaching historically high levels. In Vancouver, the housing affordability index
exceeded the peak of the latest housing bubble of the late 80s. Adjusted for interest rates, the current affordability
index in other Canadian cities is at par or above the peak of the late 80s bubble. If interest rates went up to the
historical average, average households in Toronto and Vancouver would be paying 100 percent or more of their
gross income towards ownership costs.
On the median multiple ratio measurement, Vancouver (9.3), Toronto (5.2), Montreal (4.9), and Calgary (4.6)
hover substantially above the “normal” 3.0 level. Based on this valuation, Toronto is considered a “severely
unaffordable” city, while Montreal and Calgary lie on the border between being “seriously unaffordable” and
“severely unaffordable”. Vancouver prominently stands out even from this crowd: it is not just “severely
unaffordable, but it is also the least affordable city in Canada, the US, UK, Ireland, Australia and New Zealand.
Canadian household debt has set record highs (Exhibit 6.4). It is not surprising. After all, if incomes could not keep
up with rising home prices, somehow all these homes purchased in record volumes over the last five years had to
be paid for.
And finally, there is no shortage of new homes in Canada to justify the price levels from the supply/demand
perspective. In fact, Canada is in a period of highly pronounced overbuilding (Exhibit 6.7). Oversupply warrants
lower prices. On the contrary, the stubborn prices edge higher and set all-time high records.
On all fundamental measurements, the Canadian housing market is severely overvalued. “Severe” is the word that
describes the depth of the housing crisis Canada is currently in. Naturally, this statement is open for debate. On
almost a daily basis, rosy news about the health of the Canadian housing markets stream in from the Internet
portals and TV screens. Unsubstantiated rumours of the bubble are publicly refuted by numerous industry
professionals. Voices like those of Garth Turner1 and David Rosenberg‟s16; 23 are largely dismissed as baseless
alarmists talking. And why wouldn‟t they be ignored by the public, if all kinds of experts convincingly explain that
the current state of the market does not constitute a bubble? One or two alarmists put against hundreds, if not
thousands, of reputable and articulate experts. It is not surprising that the public continues with the buying spree.
So many experts cannot be wrong, right? Well, rewind time back to 1999 and review the headlines that dominated
the landscape of the financial press back then. “Buy stocks! Invest in dot com! There are no valuation issues!
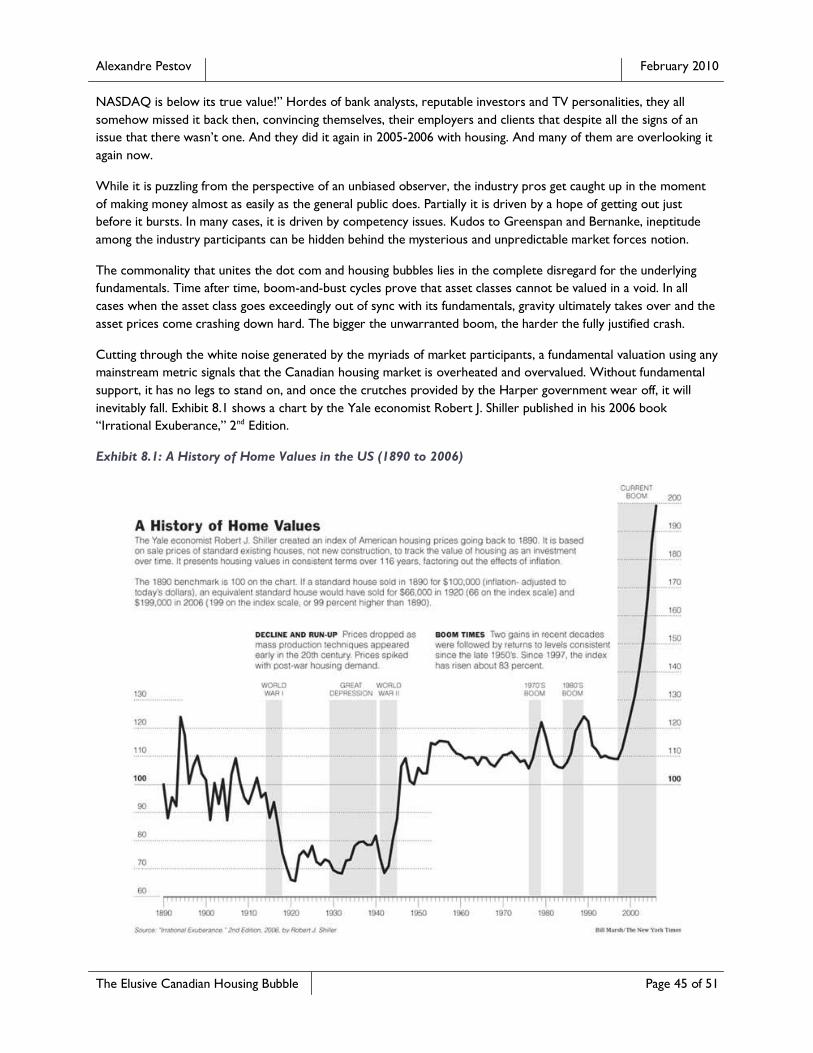
Alexandre Pestov February 2010
The Elusive Canadian Housing Bubble Page 45 of 51
NASDAQ is below its true value!” Hordes of bank analysts, reputable investors and TV personalities, they all
somehow missed it back then, convincing themselves, their employers and clients that despite all the signs of an
issue that there wasn‟t one. And they did it again in 2005-2006 with housing. And many of them are overlooking it
again now.
While it is puzzling from the perspective of an unbiased observer, the industry pros get caught up in the moment
of making money almost as easily as the general public does. Partially it is driven by a hope of getting out just
before it bursts. In many cases, it is driven by competency issues. Kudos to Greenspan and Bernanke, ineptitude
among the industry participants can be hidden behind the mysterious and unpredictable market forces notion.
The commonality that unites the dot com and housing bubbles lies in the complete disregard for the underlying
fundamentals. Time after time, boom-and-bust cycles prove that asset classes cannot be valued in a void. In all
cases when the asset class goes exceedingly out of sync with its fundamentals, gravity ultimately takes over and the
asset prices come crashing down hard. The bigger the unwarranted boom, the harder the fully justified crash.
Cutting through the white noise generated by the myriads of market participants, a fundamental valuation using any
mainstream metric signals that the Canadian housing market is overheated and overvalued. Without fundamental
support, it has no legs to stand on, and once the crutches provided by the Harper government wear off, it will
inevitably fall. Exhibit 8.1 shows a chart by the Yale economist Robert J. Shiller published in his 2006 book
“Irrational Exuberance,” 2nd Edition.
Exhibit 8.1: A History of Home Values in the US (1890 to 2006)
Alexandre Pestov February 2010
The Elusive Canadian Housing Bubble Page 46 of 51
Source: “Irrational Exuberance,” 2nd Edition, 2006 by Robert J. Shiller;
The chart plainly illustrates the point of the housing market getting out of sync with reality. After World War II,
the norm for the market was to hover around the 110 mark. During the 1970‟s and 1980‟s booms, the market
rallied above the 120-percent level, followed by a subsequent drop to its long-term average. Between 1998 and
2006 it has jumped to the 200-percent level. It is quite apparent by simply looking at the chart that such a sharp
increase in real prices could not be sustained. Between 2007 and 2009, the US housing market ended up with the
biggest drop on record, and while the bottom is in sight, it hasn‟t been reached yet. The chart of the Canadian
housing market, especially that of Vancouver, bears a striking resemblance to the US‟s29. The Canadian market
experienced a jump in home prices almost as sharp as the US housing market did (Exhibit 4.2). What does it bode
for the Canadian home prices?
From the definition, “a financial bubble is trade in high volumes at prices that are considerably at variance with
intrinsic values” (King, Ronald R.; Smith, Vernon L.; Williams, Arlington W. and van Boening, Mark V., 1993).
Canada has both components - high volumes and home prices that are considerably at variance with intrinsic
values. The fundamentals in Canada are similar to the comparative metrics in the US at their bubble peak. Of
course, despite the fundamentals and despite the “too far, too fast” factor, the existence of a housing bubble can
be challenged. However, citing David Rosenberg23, “If it walks like a duck…”
It is worth reminding ourselves that the bubble in Canada did not burst due to the massive intervention by the
Harper government. The intervention was orchestrated by injecting thousands of new buyers - many of whom
cannot afford owning the property they purchased – into the market to prop up the prices. The scheme worked,
and the disaster was temporarily averted. However, the problem was not fully or even partially rectified. By
postponing the bubble deflation, the bubble was inflated further. If a housing market collapse would have caused
pain and distress on behalf of a large and overleveraged Canadian population in 2007, the housing crash of 2011
will affect all the same buyers, plus many more of those who were sacrificed to keep the prices going up. More fire
sales and more competing properties on the sell side will cause a sharper and a deeper downturn that would have
been experienced in 2007. Furthermore, CMHC, the second largest crown corporation in Canada, would require
a bailout due to all the risky sub-prime mortgages it has insured. Every single one of the main sub-prime lenders in
the US went out of business or required a massive bailout2; 27; various sources. Unlike the US, the Canadian sub-prime
lender would not require a bailout. In Canada, the bailout is already embedded in the system. It would simply be
passed on to tax payers in the form of a larger national debt, higher taxes or tighter funds for social programs.
Amongst the most frequently asked questions is “when will it burst”. Unfortunately, calling the top or the bottom of
the market is as reliable as tossing a coin. Markets can be assessed for their intrinsic value, and bets can be placed
on the future direction of a market. Entering or exiting the market at the precise turning point is a coincidence.
However, identifying an area where it is expected to reverse is possible with some degree of certainty.
There are three main triggers that may help to set off the housing market decline. They are: HST, Olympics and
rising rates. In the Toronto area, a buying spree is influenced to a large degree by the rumours of the upcoming tax
harmonisation. The implications of it are generally not well understood, and buyers are trying to dodge the HST
introduction by buying homes now. It transfers demand from the future to the present, creating a temporary
intense upward pressure on property prices. Once the HST takes effect in Ontario, the urgency to buy will be
instantly removed. Since much of the demand was transferred to and fulfilled in the past, the post-HST demand will
drop. With no intense upward pressure and no buyers, the perception of the housing prices perpetually rising will
be broken. The changing perception of the sustainability of the housing prices rise would destabilize the myth of
real-property as a safe and profitable investment, and trigger a selling spree.
Another possible trigger is the post-Olympic hangover in Vancouver. Before the Olympics, massive investments in
the infrastructure of a host city are made. Many areas, especially construction and real-estate, benefit from the
Alexandre Pestov February 2010
The Elusive Canadian Housing Bubble Page 47 of 51
expansion that is required for the games. Once the games are done and gone, most host cities face a rude
awakening in the form of unwanted facilities that cannot be run profitably. In the case of Vancouver, the most
overvalued city in Canada and the US, a stoppage of investment flow in real-estate and infrastructure might
effortlessly translate into disillusionment about the property prices. As home prices in Vancouver are not
supported by any fundamentals and driven mostly by human misapprehensions, anything that will bring
daydreamers back to reality will destroy the prices and cause property devaluation.
Finally, the most probable cause that will trigger a housing market collapse in Canada will come in the form of a
trivial interest rate hike. It was the straw that broke the camel‟s back in the US, and it can take the same role in
Canada. Canadian homeowners are overleveraged beyond their capacity to carry mortgages under the “normal”,
by historical standards, interest rates. The government estimates that 10 percent of home owners are susceptible
to defaults once interest rates go up. Once rates go up, the events are likely to unravel just as they did in the US.
Defaulting homeowners lead to fire-sale prices and excessive inventory. Excessive inventory and price competition
pushes down prices. Lower prices dash hopes of investors who find themselves holding a highly leveraged and
money-losing asset. It leads to more fire-sales. Once the prices drop 10-15 percent, defaulting homeowners and
fearful investors are joined by people with negative equity who have given up on their property. This spiral
continues for some time, until prices finally stabilize substantially below their starting levels.
The 2010 Winter Olympics game will come to a close on February 28, 2010, HST will be rolled out on July 1,
2010, and interest rates are expected to begin rising in the second half of 201017; 18. If any, or all, of the above
scenarios materialize, 2011 will be marked by a major downturn in home prices in Canada. Only this time, the
government will not have access to the same tools to delay it, and sub-prime borrowers thrown into the mix
between 2007 and 2009 will only magnify the problem.
Wikipedia states:
Within mainstream economics, many believe that bubbles cannot be identified in advance,
cannot be prevented from forming, that attempts to "prick" the bubble cause financial
crises, and that instead authorities should wait for bubbles to burst of their own accord,
dealing with the aftermath via monetary policy and fiscal policy.
History shows that this statement fully applies to the Federal Reserve led by Greenspan and Bernanke. However, a
moderate knowledge of economics allows an observer to detect large discrepancies in asset valuation and to act
accordingly. Presently, the Canadian housing prices exhibit a tremendous shift to extreme overvaluation. It is time
to reassess purchasing decisions and act accordingly.

Alexandre Pestov February 2010
The Elusive Canadian Housing Bubble Page 48 of 51
REFERENCES
DATA RESOURCES
Bank of Canada Statistics http://www.bankofcanada.ca/en/rates/index.html
Canada - Consumer Price Index (CPI) History http://www.rateinflation.com/consumer-price-index/canada-historical-cpi.php
Canada Mortgage and Housing Corporation (CMHC) http://www.cmhc-schl.gc.ca/
Canada Mortgage and Housing Corporation (CMHC) MBS http://www.cmhc-schl.gc.ca/en/hoficlincl/mobase/index.cfm
Canada Mortgage and Housing Corporation (CMHC) Order Desk https://www03.cmhc-schl.gc.ca/b2c/b2c/init.do?language=en
Case-Shiller http://www.standardandpoors.com/home/en/us
City of Toronto http://www.toronto.ca/
City of Toronto Facts http://www.toronto.ca/toronto_facts/diversity.htm
CREA http://www.crea.ca/public/news_stats/statistics.htm#
Demographia http://www.demographia.com/dhi.pdf
MLS http://www.realtor.ca
Organisation for Economic Co-operation and Development (OECD) http://www.oecd.org
Organisation for Economic Co-operation and Development (OECD) Annex Table 60: House price ratios http://www.oecd.org/dataoecd/6/5/2483894.xls
Organisation for Economic Co-operation and Development (OECD) Production and Sales (MEI) http://stats.oecd.org/Index.aspx?DataSetCode=MEI_REAL
Organisation for Economic Co-operation and Development (OECD) Statistics http://www.oecd.org/statsportal/0,3352,en_2825_293564_1_1_1_1_1,00.html
Statistics Canada http://www.statcan.gc.ca/
Statistics Canada – CPI http://www40.statcan.ca/l01/cst01/econ46a-eng.htm
Alexandre Pestov February 2010
The Elusive Canadian Housing Bubble Page 49 of 51
Statistics Canada – Median Income http://www.statcan.gc.ca/pub/75-001-x/10504/art-1-table-1.gif
Statistics Canada – Toronto Information http://www.statcan.gc.ca/pub/89-613-m/2006010/t/4144701-eng.htm
Royal Bank of Canada - RBC http://www.rbc.com/economics/market/pdf/house.pdf
Royal LePage http://www.royallepage.ca
Teranet – National Bank House Price Index http://www.housepriceindex.ca/Default.aspx
TREB – Toronto Real Estate Board http://www.torontorealestateboard.com/consumer_info/market_news/index.htm
BOOKS
King, Ronald R.; Smith, Vernon L.; Williams, Arlington W. and van Boening, Mark V. (1993) „The Robustness of
Bubbles and Crashes in Experimental Stock Markets‟, New York: Oxford University Press
Schiff, Peter D. (2007), “Crash Proof: How to Profit From the Coming Economic Collapse”, John Wiley and Sons
Turner, G., (2010) „Money Road: Crash Proof your Wealth‟, Xurbia
Turner, G., (2008) „Greater Fool: The Troubled Future of Real Estate‟, Key Porter Books
Turner, G., (2002) „The Little Book of Real Estate Wisdom‟, Key Porter Books
ON-LINE SOURCES
1. 35 to life http://www.greaterfool.ca/
2. Almost all biggest subprime lenders have received bailout money http://www.creditwritedowns.com/2009/05/almost-all-biggest-subprime-lenders-have-received-bailout-money.html
3. Bankers get the bonus, and government takes the risk http://www.theglobeandmail.com/globe-investor/investment-ideas/features/vox/bankers-get-the-bonus-and-government-takes-the-risk/article1442688/
4. Calgary Real Estate Market Blog http://calgaryrealestatemarketblog.wordpress.com/2008/01/
5. Canada Revenue Agency http://www.cra-arc.gc.ca/tx/ndvdls/tpcs/rrsp-reer/hbp-rap/menu-eng.html
6. Canadian Real Estate in A Bubble (Again) http://www.tradersnarrative.com/canadian-real-estate-in-a-bubble-3274.html
7. Canadians taking on record levels of debt http://www.thestar.com/news/canada/article/737387--canadians-taking-on-record-levels-of-debt?bn=1
Alexandre Pestov February 2010
The Elusive Canadian Housing Bubble Page 50 of 51
8. CMHC Annual Report Consolidated Financial Statements http://www.cmhc.ca/en/corp/about/anrecopl/upload/2008-Annual-Report-Consolidated-Financial-Statements.pdf
9. CMHC bubble is 100% made in Canada http://www.financialpost.com/opinion/story.html?id=734ff73e-1f8c-4bfd-b3de-5e468913e8be
10. CMHC - Canada's Breaking Point http://americacanada.blogspot.com/2009/07/cmhc-and-our-government.html
11. CMHC: Canada's Freddie and Fannie? http://network.nationalpost.com/np/blogs/francis/archive/2009/10/21/cmhc-canada-s-freddie-and-fannie.aspx
12. CMHC Problems Part II http://network.nationalpost.com/np/blogs/francis/archive/2009/11/03/cmhc-problems-part-ii.aspx
13. Canada's Sub-Prime Mortgage Time Bomb http://www.globalresearch.ca/PrintArticle.php?articleId=16170
14. Canada's (Sub-Prime) Mortgage Market - Causing Concern for the Bank of Canada? http://network.nationalpost.com/np/blogs/fpmagazinedaily/archive/2009/11/19/canada-s-sub-prime-market-causing-concern-for-the-bank-of-canada.aspx
15. CPI History http://www.uleth.ca/analysis/CPI/PDF/canada.pdf
16. David Rosenberg: Canadian Real Estate Near Bubble http://www.tradersnarrative.com/david-rosenberg-canadian-real-estate-near-bubble-3358.html
17. Days of low-interest borrowing may soon end in Canada, economic leaders say http://english.cctv.com/20091228/103435_1.shtml
18. Days of low-interest borrowing may soon end in Canada, economic leaders say http://news.xinhuanet.com/english/2009-12/28/content_12717797.htm
19. Edmonton Housing Bust http://edmontonhousingbust.com/
20. Feds urged to go slow on mortgage tightening http://www.fftimes.com/node/229968?source=patrick.net
21. Financial Indicators http://www.statcan.gc.ca/pub/13-010-x/2008004/article01-eng.htm
22. Globe and Mail – Central Bank Warns of Rising Debt www.theglobeandmail.com/report-on-business/central-bank-warns-on-rising-debt/article1395615/
23. Gluskin Sheff + Associates Inc. https://ems.gluskinsheff.net
24. Home Buyers' Plan (HBP) http://www.cra-arc.gc.ca/tx/ndvdls/tpcs/rrsp-reer/hbp-rap/menu-eng.html
25. Homebuilders (Painful) Follow-up: Housing Market Index http://www.tradersnarrative.com/homebuilders-painful-followup-housing-market-index-1157.html
26. Is Canada's Housing Rebound Forming a Bubble? http://realtytimes.com/rtpages/20091124_bubble.htm
Alexandre Pestov February 2010
The Elusive Canadian Housing Bubble Page 51 of 51
27. The Mortgage Lender Implod-o-meter http://ml-implode.com/
28. Special investigation: How high-risk mortgages crept north http://www.theglobeandmail.com/report-on-business/article727831.ece
29. REAL ESTATE VALUES 1976 - 2009, Detached homes http://www.bcrealtor.com/Charts09.pdf
30. Subprime Lending and the Housing Bubble: Tail Wags Dog? http://papers.ssrn.com/sol3/papers.cfm?abstract_id=1262365
31. The Smoking Gun – Time to Invest Internationally http://www.thecomingdepression.net/wp-content/uploads/davidlepoidevin_2009-09.pdf
32. Toronto house prices surge http://urbantoronto.ca/showthread.php?4992-Toronto-house-prices-surge
33. TREB (Toronto Real Estate Board) Average Single Family Historical Home Prices and trends for Toronto and Mississauga
http://www.mississauga4sale.com/TREBprice.htm
34. Valuation of Rental Property: Gross Rent Multipliers http://www.thomasgoodwin.com/valuation-of-rental-property-gross-rent-multipliers
35. Why Canada's Housing Bubble Will Burst http://thetyee.ca/Opinion/2009/10/22/BubbleWillBurst/
36. Worthwhile Canadian Initiative: Don't bubbles burst when pricked? http://worthwhile.typepad.com/worthwhile_canadian_initi/2010/01/dont-bubbles-burst-when-pricked.html
FORMULAS
Basic Annuity Formula:
1. PV(A) is the value of the annuity at time=0 2. A is the value of the individual payments in each compounding period
3. i equals the interest rate that would be compounded for each period of time 4. n is the number of payment periods.

Alexandre Pestov February 2010
The Elusive Canadian Housing Bubble Page 52 of 51
REVISIONS
1.01
I wanted to thank the sharp “accounting” eyes of Dan Haroun for identifying several issues with the calculations
provided on the page 39. The issues were fixed.