canada’s wealth of natural capital rouge national park
TRANSCRIPT
Canada’s wealth of natural Capital
Rouge National Park

Suite 219, 2211 West 4th Avenue, Vancouver, B.C. V6K 4S2T: 604.732.4228 F: 604.732.4228 Toll free: 1-800-453-1533E: [email protected]
www.davidsuzuki.org
CANAdA’S WEAlTh oF NATuRAl CAPiTAl: RougE NATioNAl PARK
September 2012
By Sara Wilson, B.A., MSc.F., lEAd Fellow
Principal, Natural Capital Research & Consulting
ACKNoWlEdgEMENTS
The author would like to thank the david Suzuki Foundation for its support
and interest in pursuing natural capital research. Special thanks to Matt
hanneman and Peter lee of global Forest Watch Canada for their invalu-
able skills at spatial analysis that makes this type of project possible.
in addition, i would like to thank several people that provided input and
review including: dr. Kai Chan (university of British Columbia), david
Batker (Earth Economics), dr. Nancy olewiler (Simon Fraser university),
david harvey (Parks People), Jim Robb (Friends of the Rouge Watershed),
Maria Papoulias (Rouge Park), Mike Bender (Toronto Regional Conserva-
tion Authority/Rouge Park), and dr. Faisal Moola (university of Toronto),
Jode Roberts, lisa Rockwell, Chris dePaul and Kiruthiha Kulendiren of
the david Suzuki Foundation.
This report was made possible through the
generous support of g. Raymond Chang and family.
graphic design by Nadene Rehnby and Pete Tuepah handsonpublications.com
Cover photo: Male calico pennant, courtesy gary Yankech
This report can be downloaded free of charge at www.davidsuzuki.org

ContentsExECuTiVE SuMMARY .........................................................................................................................5
PART 1 iNTRoduCTioN ......................................................................................................................8
PART 2 dEFiNiTioN oF STudY AREA ...............................................................................................12
PART 3 iMPoRTANCE oF NATuRAl CAPiTAl ANd ECoSYSTEM SERViCES .....................................14
PART 4 METhodologiCAl APPRoACh ...........................................................................................16
PART 5 NATuRAl CAPiTAl VAluATioN FRAMEWoRK FoR ECoSYSTEM SERViCES VAluATioN .....18
PART 6 lANd CoVER oF STudY AREA ........................................................................................... 22
PART 7 ECoSYSTEM SERViCES oF ThE RougE STudY AREA .........................................................29
PART 8 SuMMARY oF ECoSYSTEM SERViCE VAluATioNS ............................................................. 44
PART 9 diSCuSSioN ....................................................................................................................... 50
PART 10 CoNCluSioNS .....................................................................................................................54
PART 11 RECoMMENdATioNS ..........................................................................................................55
APPENdix 1: Economic incentive Programs to restore and enhance the
supply of ecosystem services on agricultural lands and woodlots in Canada ..........................57
PhoTo CouRTESY Bad alley/fliCkr
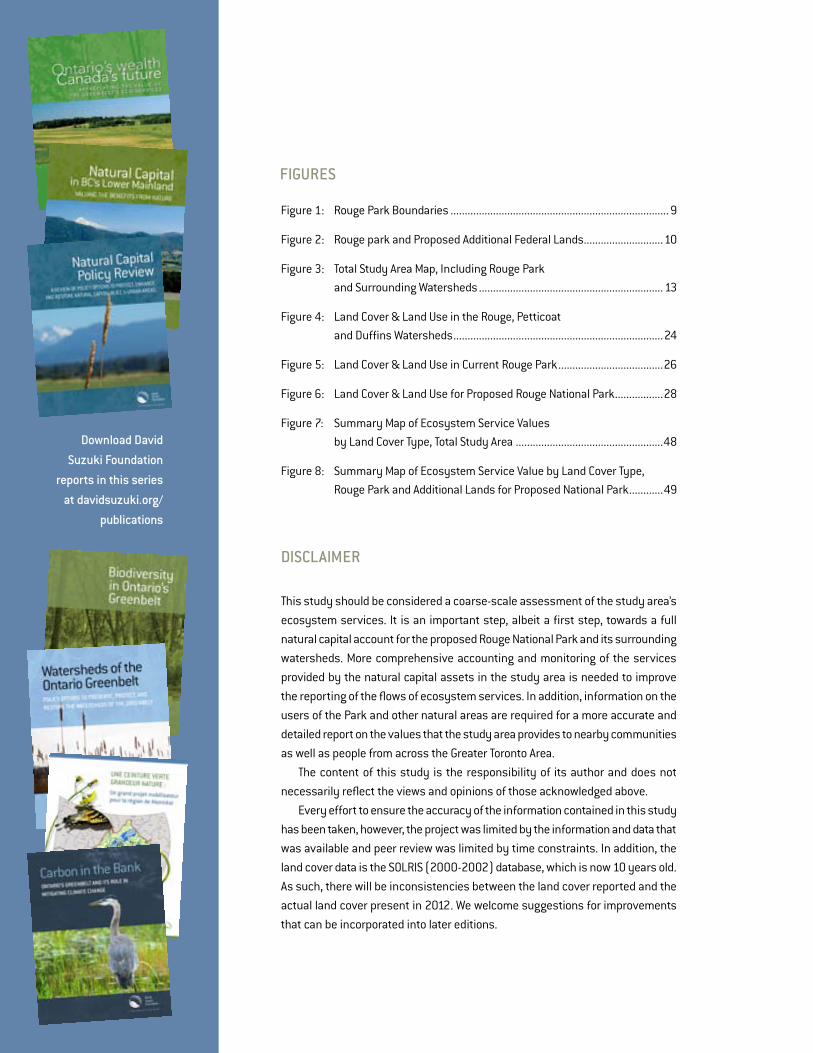
figures
download david
suzuki foundation
reports in this series
at davidsuzuki.org/
publications
disClaimer
This study should be considered a coarse-scale assessment of the study area’s
ecosystem services. it is an important step, albeit a first step, towards a full
natural capital account for the proposed Rouge National Park and its surrounding
watersheds. More comprehensive accounting and monitoring of the services
provided by the natural capital assets in the study area is needed to improve
the reporting of the flows of ecosystem services. in addition, information on the
users of the Park and other natural areas are required for a more accurate and
detailed report on the values that the study area provides to nearby communities
as well as people from across the greater Toronto Area.
The content of this study is the responsibility of its author and does not
necessarily reflect the views and opinions of those acknowledged above.
Every effort to ensure the accuracy of the information contained in this study
has been taken, however, the project was limited by the information and data that
was available and peer review was limited by time constraints. in addition, the
land cover data is the SolRiS (2000-2002) database, which is now 10 years old.
As such, there will be inconsistencies between the land cover reported and the
actual land cover present in 2012. We welcome suggestions for improvements
that can be incorporated into later editions.
Figure 1: Rouge Park Boundaries ............................................................................. 9
Figure 2: Rouge park and Proposed Additional Federal lands............................10
Figure 3: Total Study Area Map, including Rouge Park
and Surrounding Watersheds ................................................................. 13
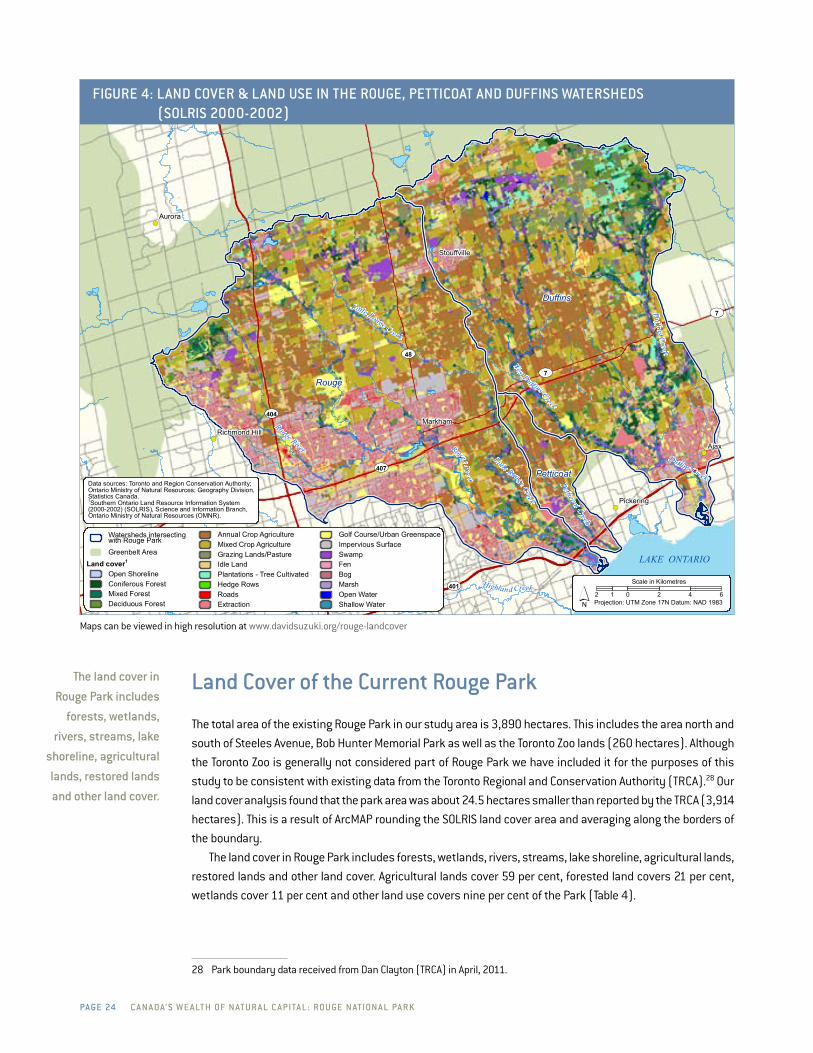
Figure 4: land Cover & land use in the Rouge, Petticoat
and duffins Watersheds ..........................................................................24
Figure 5: land Cover & land use in Current Rouge Park .....................................26
Figure 6: land Cover & land use for Proposed Rouge National Park .................28
Figure 7: Summary Map of Ecosystem Service Values
by land Cover Type, Total Study Area ....................................................48
Figure 8: Summary Map of Ecosystem Service Value by land Cover Type,
Rouge Park and Additional lands for Proposed National Park ............49
dav id s uzu ki fou n dation page 5
rouge national park
has the potential to
not only safeguard
the rouge’s immense
natural capital, it will
create opportunities
for millions of residents
to explore a nearby
wilderness gem.photo Courtesy kiril strax/fliCkr
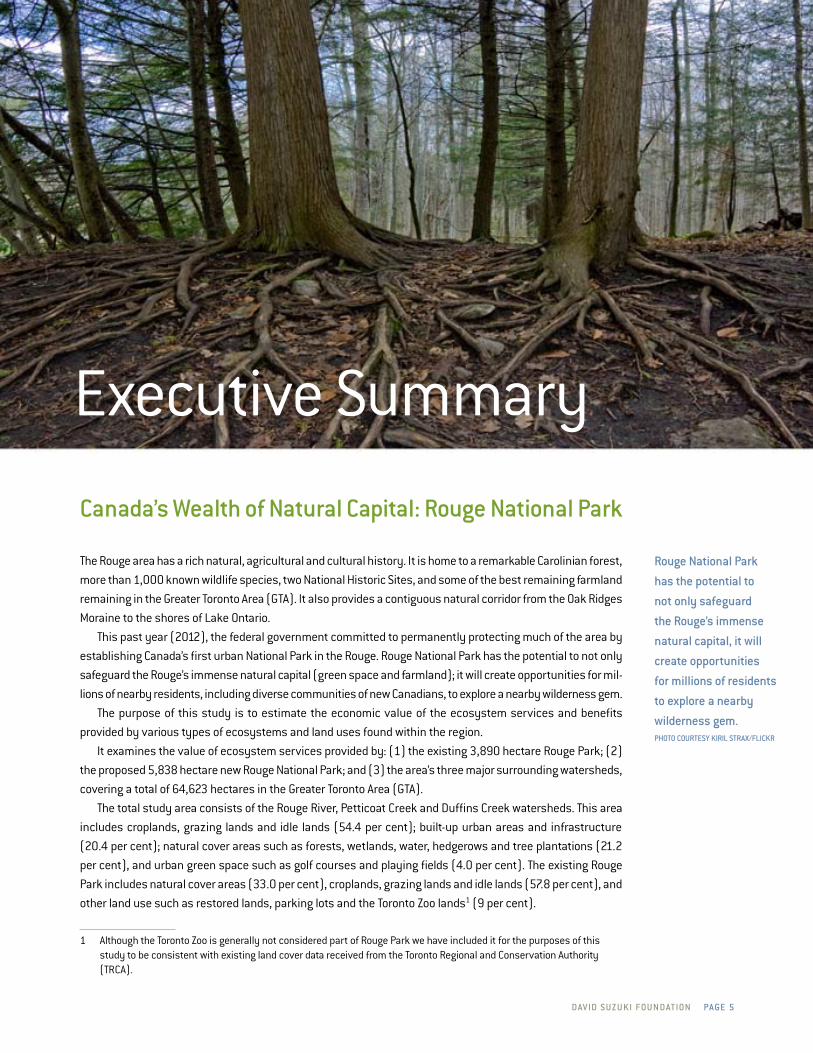
Executive Summary
Canada’s wealth of natural Capital: rouge national park
The Rouge area has a rich natural, agricultural and cultural history. it is home to a remarkable Carolinian forest,
more than 1,000 known wildlife species, two National historic Sites, and some of the best remaining farmland
remaining in the greater Toronto Area (gTA). it also provides a contiguous natural corridor from the oak Ridges
Moraine to the shores of lake ontario.
This past year (2012), the federal government committed to permanently protecting much of the area by
establishing Canada’s first urban National Park in the Rouge. Rouge National Park has the potential to not only
safeguard the Rouge’s immense natural capital (green space and farmland); it will create opportunities for mil-
lions of nearby residents, including diverse communities of new Canadians, to explore a nearby wilderness gem.
The purpose of this study is to estimate the economic value of the ecosystem services and benefits
provided by various types of ecosystems and land uses found within the region.
it examines the value of ecosystem services provided by: (1) the existing 3,890 hectare Rouge Park; (2)
the proposed 5,838 hectare new Rouge National Park; and (3) the area’s three major surrounding watersheds,
covering a total of 64,623 hectares in the greater Toronto Area (gTA).
The total study area consists of the Rouge River, Petticoat Creek and duffins Creek watersheds. This area
includes croplands, grazing lands and idle lands (54.4 per cent); built-up urban areas and infrastructure
(20.4 per cent); natural cover areas such as forests, wetlands, water, hedgerows and tree plantations (21.2
per cent), and urban green space such as golf courses and playing fields (4.0 per cent). The existing Rouge
Park includes natural cover areas (33.0 per cent), croplands, grazing lands and idle lands (57.8 per cent), and
other land use such as restored lands, parking lots and the Toronto Zoo lands1 (9 per cent).
1 Although the Toronto Zoo is generally not considered part of Rouge Park we have included it for the purposes of this study to be consistent with existing land cover data received from the Toronto Regional and Conservation Authority (TRCA).
page 6 C a n a da’ s w e a lt h of n at u r a l C a pita l : rou ge n ation a l pa r k
!(
!(
!(
!(
!(
!(
!(
!(
!(
Highland Creek
Rouge River
West Duffins Creek
Petticoat Creek
Duffins Creek
Duffins C
reek
Little Rouge CreekRouge R
iver
Little Rouge Creek
UV401
UV48
UV7
UV407
UV404
UV401
UV7
Rouge
Duffins
Petticoat
Ajax
Aurora
Markham
Newmarket
Pickering
Stouffville
Richmond Hill
Watersheds intersecting with Rouge ParkRouge ParkProposed Federal LandsGreenbelt Area
LAKE ONTARIO
Data sources: Toronto and Region ConservationAuthority; Ontario Ministry of Natural Resources;Geography Division, Statistics Canada.
2 0 2 4 6 81
Scale in Kilometres
´ Projection: UTM Zone 17N Datum: NAD 1983
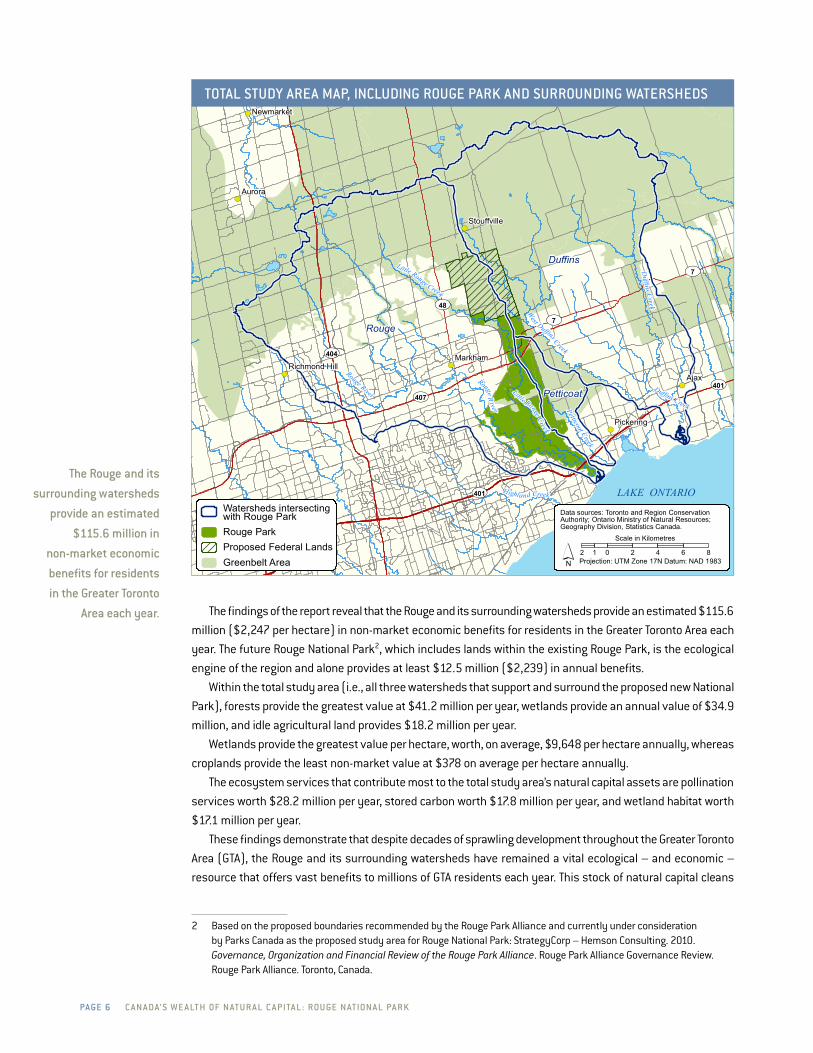
total study area map, inCluding rouge park and surrounding watersheds
The findings of the report reveal that the Rouge and its surrounding watersheds provide an estimated $115.6
million ($2,247 per hectare) in non-market economic benefits for residents in the greater Toronto Area each
year. The future Rouge National Park2, which includes lands within the existing Rouge Park, is the ecological
engine of the region and alone provides at least $12.5 million ($2,239) in annual benefits.
Within the total study area (i.e., all three watersheds that support and surround the proposed new National
Park), forests provide the greatest value at $41.2 million per year, wetlands provide an annual value of $34.9
million, and idle agricultural land provides $18.2 million per year.
Wetlands provide the greatest value per hectare, worth, on average, $9,648 per hectare annually, whereas
croplands provide the least non-market value at $378 on average per hectare annually.
The ecosystem services that contribute most to the total study area’s natural capital assets are pollination
services worth $28.2 million per year, stored carbon worth $17.8 million per year, and wetland habitat worth
$17.1 million per year.
These findings demonstrate that despite decades of sprawling development throughout the greater Toronto
Area (gTA), the Rouge and its surrounding watersheds have remained a vital ecological – and economic –
resource that offers vast benefits to millions of gTA residents each year. This stock of natural capital cleans
2 Based on the proposed boundaries recommended by the Rouge Park Alliance and currently under consideration by Parks Canada as the proposed study area for Rouge National Park: StrategyCorp – hemson Consulting. 2010. Governance, Organization and Financial Review of the Rouge Park Alliance. Rouge Park Alliance governance Review. Rouge Park Alliance. Toronto, Canada.
the rouge and its
surrounding watersheds
provide an estimated
$115.6 million in
non-market economic
benefits for residents
in the greater toronto
area each year.

dav id s uzu ki fou n dation page 7
the air, filters the water, cools nearby communities and provides a critical natural corridor from the oak Ridges
Moraine to the shores of lake ontario.
By establishing Rouge National Park, the federal government, and the many local stakeholders and Rouge
champions, are effectively protecting a bank of natural capital that will benefit communities now and for
generations to come. While protecting, restoring and managing such a wild gem on the edge of one of North
America’s fastest growing urban areas is likely to cost tens of millions, these costs should be weighed against
the value of economic and ecological benefits highlighted in this report. Even without consideration of the
Park’s market (e.g., influence on property values) and health benefits to local residents, Rouge National Park
will undoubtedly pay huge dividends.
While this valuation is an important first step in assessing the value of the Rouge area, there is much work
still to be done. To ensure the Rouge’s ecological health and economic value is maintained in the long term,
this report provides recommendations for legal, policy and conservation efforts that should be undertaken,
including establishing natural capital accounts for the new Rouge National Park and its surrounding watersheds,
carefully managing development activities in and around the Park that could negatively impact its ecosystems
(e.g., pipelines, roads) and promoting policies and programs to restore and enhance the supply of ecosystem
services in the region, especially on working agricultural lands.
to ensure the rouge’s
ecological health
and economic value
is maintained in
the long term, this
report provides
recommendations
for legal, policy and
conservation efforts.photo Courtesy laurenCe lui/fliCkr

page 8 C a n a da’ s w e a lt h of n at u r a l C a pita l : rou ge n ation a l pa r k
pa rt 1
introduction
rouge park
Rouge Park is a nationally significant ecological area located in the greater Toronto Area (gTA). it was created
in 1995 by the ontario government in response to public concerns about the protection of the Rouge River
Valley. More recently, the Park and the Rouge River watershed were included under ontario’s 2005 greenbelt
Plan (Section 3.2.6), with special recognition for providing a reservoir of biodiversity throughout the Park as
well as the only contiguous link connecting the ontario greenbelt to lake ontario.
The Park is found within the Rouge, Petticoat and West duffins watersheds on the eastern edge of the City
of Toronto and Town of Markham, running north from the shores of lake ontario to just north of 16th Ave in
Markham (Figure 1). The existing park is Canada’s largest urban wilderness park at 3,890 hectares. it sits at
the northeastern edge of the Carolinian Zone. This zone is rare in Canada, covering less than one per cent of
the country’s land mass, though providing habitat for more species than any other life zone in the country,
including: monarch butterflies, peregrine falcons, red-shouldered hawks, barn owls, red foxes, and the iconic
Canadian beaver.
Rouge Park has more than:
• 762 plant species (over one quarter of ontario’s flora)
• 225 bird species (123 breeding species)
• 55 fish species
• 27 mammal species
• 19 reptile and amphibian species
The Park also contains working farms and rural landscapes. indeed, agriculture has been an integral part
of the region’s rich cultural and economic history for over 200 years.
rouge park was
created in 1995
by the ontario
government in
response to public
concerns about the
protection of the
rouge river valley.photo Courtesy
tsar kasim/fliCkr

dav id s uzu ki fou n dation page 9
proposed rouge national park
Rouge Park Alliance is a voluntary partnership consisting of 13 organizations, including different levels of
government, agencies and not-for-profit groups. The Alliance commissioned a governance and financial review
in 2010. This report concluded that a new model of organization, funding and governance was required for
Rouge Park, which led to the recommendation to create an urban National Park.3
The current 3,890 hectare Rouge Park includes Block 1 and Block 2 shown in Figure 2. The Rouge Park
Alliance has proposed that the federal government add an additional 1,948 hectares of federally owned lands
(Block 3) west of the York-durham town-line in Markham to the existing Rouge Park lands, in order to create
the new National Park. These additional lands could be managed as an agricultural preserve or conservancy
within the new National Park.4 Parks Canada has recently adopted the Rouge Park Alliance’s proposal as its
own proposed Study Area for the creation of Rouge National Park. however, it should be noted that some local
advocates have proposed that Rouge National Park be much larger in size to include additional contiguous
lands in north Markham and Pickering within the Rouge River and duffins Creek watersheds. These federal
3 StrategyCorp – hemson Consulting. 2010. Governance, Organization and Financial Review of the Rouge Park Alliance. Rouge Park Alliance governance Review. Rouge Park Alliance. Toronto, Canada.
4 Rouge Park Alliance. 2011. Rouge National Park – A Good Idea for the Environment, Farmers and GTA Residents. Backgrounder, April 2011.
!(
!(
!(
!(
Highland Creek
Rouge River
West Duffins Creek
Petticoat Creek
Little Rouge Creek
Rouge River
Little Rouge Creek
UV48
UV7
UV407
UV401
Rouge
Duffins
Petticoat
Markham
Pickering
Watersheds intersecting with Rouge ParkRouge ParkBob Hunter Memorial ParkToronto ZooProposed Federal LandsGreenbelt Area
Data sources: Toronto and Region Conservation Authority;Ontario Ministry of Natural Resources
1 0 1 2 3 4 5
Scale in Kilometres
´ Projection: UTM Zone 17N Datum: NAD 1983
figure 1: rouge park Boundaries
Maps can be viewed in high resolution at www.davidsuzuki.org/rouge-landcover

page 10 C a n a da’ s w e a lt h of n at u r a l C a pita l : rou ge n ation a l pa r k
lands are currently designated “Natural heritage System” under ontario’s greenbelt Plan and legislation, but
remain vulnerable to development.5
The creation of Rouge National Park has popular support in the area. A poll by Nanos Research in June 2010
showed that 88 per cent of local residents surveyed support the idea of the federal government establishing
Canada’s first urban National Park in the Rouge. The government of Canada committed to the creation of a
National Park in the 2011 Speech from the Throne and has since provided multi-year funding for its establish-
ment and management.6 in 2012, Parks Canada actively developed a process for establishing the new urban
National Park based on input from federal, provincial, municipal, Aboriginal, youth and community groups, as
well as working with public landholders, such as municipalities, in developing a land transfer processes for
the creation the new National Park.
5 Friends of the Rouge Watershed. www.frw.ca/pdf/Support_Rouge_National_Park_Flyer_July_2011.pdf6 www.pc.gc.ca/apps/cp-nr/release_e.asp?id=1861&andor1=nr
figure 2: rouge park and proposed additional federal lands
the proposed
national park
would add 1,948
hectares of federal
land (Block 3) to
rouge park’s current
3,890 hectares
(Blocks 1 and 2).Maps can be viewed in high resolution at www.davidsuzuki.org/rouge-landcover

dav id s uzu ki fou n dation page 11
purpose of study
The purpose of this study is to estimate the value of the natural capital and the ecosystem services
provided by:
1) the existing Rouge Park (3,890 ha);
2) the proposed Rouge National Park7 (5,838 ha); and
3) its three major surrounding watersheds (64,623 ha) in the greater Toronto Area.
it includes analysis of built urban, agricultural and natural land cover and land use within Rouge Park and its
surrounding watersheds; the monetized values for the ecosystem services provided by each natural land cover
type; and a review of agricultural programs for restoring and enhancing the supply of ecosystem services on
working agricultural lands (see Appendix 1).
7 Based on the proposed boundaries recommended by the Rouge Park Alliance and currently under consideration by Parks Canada as the proposed study area for Rouge National Park: StrategyCorp – hemson Consulting. 2010. Governance, Organization and Financial Review of the Rouge Park Alliance. Rouge Park Alliance governance Review. Rouge Park Alliance. Toronto, Canada.
in 2012, parks Canada
actively developed
a process for
establishing the new
urban national park
based on input from
federal, provincial,
municipal, aboriginal,
youth and community
groups, as well as
working with public
landholders, such
as municipalities,
in developing a land
transfer processes
for the creation the
new national park.photo (Common green darner, anax junius) Courtesy gary yankeCh/fliCkr

page 12 C a n a da’ s w e a lt h of n at u r a l C a pita l : rou ge n ation a l pa r k
The total study area includes three watersheds that flow through Rouge Park – the Rouge River, duffins Creek
and Petticoat Creek watersheds (Figure 3). in addition, the study includes nested study areas for the current
Rouge Park and the proposed Rouge National Park Study Area proposed by Parks Canada.
rouge river watershed
The Rouge River watershed includes 33,288 hectares of land in the regions of York and durham, cities of
Toronto and Pickering, and towns of Markham, Richmond hill and Whitchurch-Stouffville. it includes all the
lands that drain to the Rouge River and its tributaries, including the little Rouge River. The lower watershed is
dominated by the existing Rouge Park, which makes up 12 per cent of the area. The middle and western parts
are experiencing rapid urban expansion and have sparse natural cover except in Rouge Park. The upper and
eastern portions of the watershed are primarily rural and agricultural with some small towns and villages.
duffins Creek and petticoat watersheds
duffins Creek is located in the Region of durham and York Region. The duffins Creek watershed covers 28,653
hectares in the communities of Whitchurch-Stouffville, Markham, uxbridge, Pickering and Ajax. The Petticoat
Creek watershed covers 2,683 hectares located between the Rouge and duffins Creek watersheds.
rouge park and rouge national park
The current 3,890 hectare Rouge Park is located in the City of Toronto and Town of Markham (Blocks 1 and 2
shown in Figure 2). The proposed Rouge National Park8 includes the existing Rouge Park plus 1,948 hectares
of additional federal lands west of the York-durham town-line in Markham (Block 3 in Figure 2).
8 ibid.
pa rt 2
definition of Study Area
the total study
area includes three
watersheds that
flow through rouge
park and nested
study areas for the
current rouge park
and the proposed
rouge national park
study area proposed
by parks Canada.photo Courtesy
vlad litvinov/fliCkr

dav id s uzu ki fou n dation page 13
!(
!(
!(
!(
!(
!(
!(
!(
!(
Highland Creek
Rouge River
West Duffins Creek
Petticoat Creek
Duffins Creek
Duffins C
reek
Little Rouge Creek
Rouge River
Little Rouge Creek
UV401
UV48
UV7
UV407
UV404
UV401
UV7
Rouge
Duffins
Petticoat
Ajax
Aurora
Markham
Newmarket
Pickering
Stouffville
Richmond Hill
Watersheds intersecting with Rouge ParkRouge ParkProposed Federal LandsGreenbelt Area
LAKE ONTARIO
Data sources: Toronto and Region ConservationAuthority; Ontario Ministry of Natural Resources;Geography Division, Statistics Canada.
2 0 2 4 6 81
Scale in Kilometres
´ Projection: UTM Zone 17N Datum: NAD 1983
figure 3: total study area map, inCluding rouge park and surrounding watersheds
Maps can be viewed in high resolution at www.davidsuzuki.org/rouge-landcover

page 14 C a n a da’ s w e a lt h of n at u r a l C a pita l : rou ge n ation a l pa r k
pa rt 3
importance of Natural Capital and Ecosystem Services
definitions
Natural capital refers to the earth’s land, water, atmosphere and resources. This capital is organized and
bundled within the earth’s natural ecosystems, which provide resources and flows of ecosystem services.
The benefits that ecosystems provide, such as ecosystem goods and services, are critical to the economic
and social well-being of humans. While Canadians recognize the importance and value of the environment
to their well-being, there is not a consistent measure of the non-market values that ecosystems provide. As
a result, a complete valuation of Canada’s natural capital has not been undertaken. Thus, these benefits are
generally not accounted for in economic decision-making and land use planning.
Ecosystem services are often defined as the benefits that people obtain either directly or indirectly from
ecological systems.9 Ecosystems provide numerous services, including the storage of flood waters, water
capture and filtration by watersheds, air pollution absorption by trees, and climate regulation from carbon
storage in trees, plants and soils. These services and benefits are undervalued in market economies, despite
being worth trillions of dollars per year, globally.
one of the most common reasons for measuring natural capital and ecosystem services is to report on
the financial implications resulting from resource and land use decisions by communities, governments and
businesses. generally, the full costs of human activities and their impacts on the environment have not been
accounted for, and as a result these costs have been externalized. however, modern societies are now facing
severe environmental problems due to the decline in ecosystem services as a direct result of ignoring these
external costs to the environment.
international reporting
The united Nations Millennium Ecosystem Assessment (MA) reported in 2005 that over the past 50 years
humans have changed the earth’s ecosystems more rapidly and extensively than in any other period of human
history. The assessment concluded that approximately 60 per cent of the world’s ecosystem services are
9 Millennium Ecosystem Assessment. 2005. Ecosystems and Human Well-being: Synthesis. island Press. Washington, d.C.
while Canadians
recognize the
importance and value
of the environment to
their well-being, there
is not a consistent
measure of the non-
market values that
ecosystems provide.photo Courtesy
john williams/fliCkr
dav id s uzu ki fou n dation page 15
being degraded or used unsustainably.10 The results are an unprecedented decline in biodiversity and precious
natural assets that provide us with life-supporting services.
More recently, the united Nations Environmental Program Finance initiative found that the total global
environmental costs resulting from global human activity was uS$6.6 trillion in 2008. This represents 11 per
cent of global gross domestic Product (gdP).11 The study also projected that environmental costs will continue to
rise over time, amounting to uS$28.6 trillion by 2050 (18 per cent of global gdP), if business as usual continues.
the importance of valuing ecosystem services
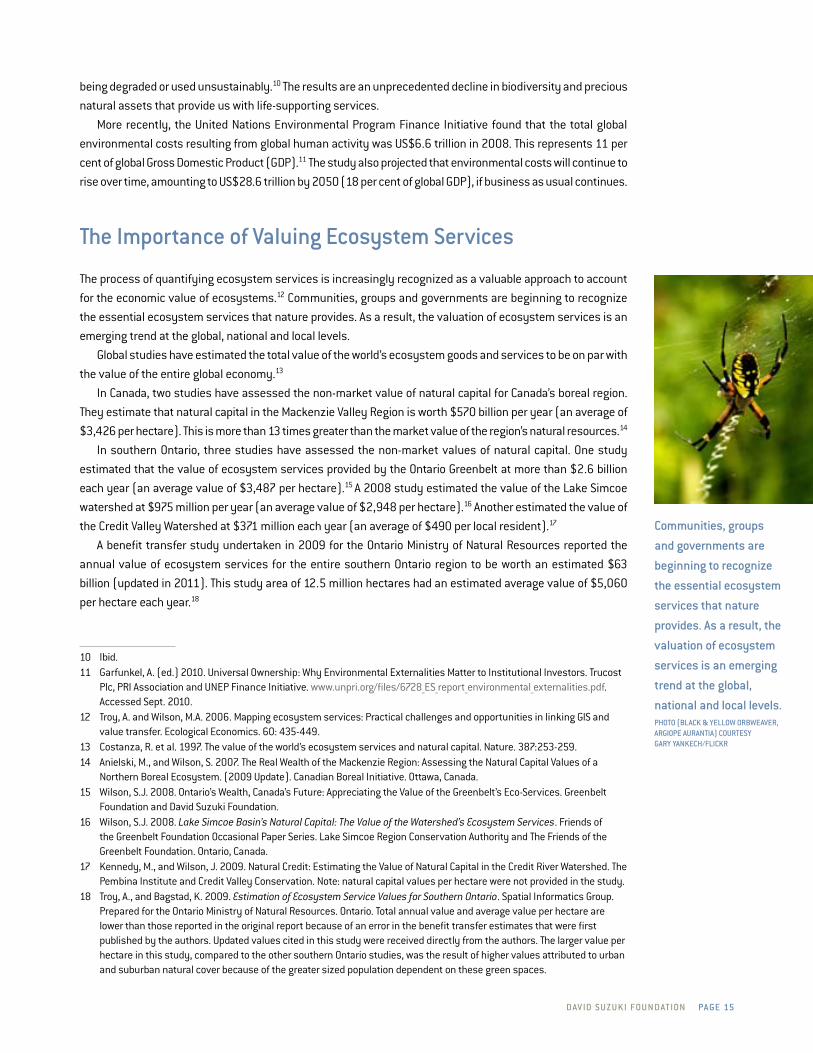
The process of quantifying ecosystem services is increasingly recognized as a valuable approach to account
for the economic value of ecosystems.12 Communities, groups and governments are beginning to recognize
the essential ecosystem services that nature provides. As a result, the valuation of ecosystem services is an
emerging trend at the global, national and local levels.
global studies have estimated the total value of the world’s ecosystem goods and services to be on par with
the value of the entire global economy.13
in Canada, two studies have assessed the non-market value of natural capital for Canada’s boreal region.
They estimate that natural capital in the Mackenzie Valley Region is worth $570 billion per year (an average of
$3,426 per hectare). This is more than 13 times greater than the market value of the region’s natural resources.14
in southern ontario, three studies have assessed the non-market values of natural capital. one study
estimated that the value of ecosystem services provided by the ontario greenbelt at more than $2.6 billion
each year (an average value of $3,487 per hectare).15 A 2008 study estimated the value of the lake Simcoe
watershed at $975 million per year (an average value of $2,948 per hectare).16 Another estimated the value of
the Credit Valley Watershed at $371 million each year (an average of $490 per local resident).17
A benefit transfer study undertaken in 2009 for the ontario Ministry of Natural Resources reported the
annual value of ecosystem services for the entire southern ontario region to be worth an estimated $63
billion (updated in 2011). This study area of 12.5 million hectares had an estimated average value of $5,060
per hectare each year.18
10 ibid.11 garfunkel, A. (ed.) 2010. universal ownership: Why Environmental Externalities Matter to institutional investors. Trucost
Plc, PRi Association and uNEP Finance initiative. www.unpri.org/files/6728_ES_report_environmental_externalities.pdf. Accessed Sept. 2010.
12 Troy, A. and Wilson, M.A. 2006. Mapping ecosystem services: Practical challenges and opportunities in linking giS and value transfer. Ecological Economics. 60: 435-449.
13 Costanza, R. et al. 1997. The value of the world’s ecosystem services and natural capital. Nature. 387:253-259. 14 Anielski, M., and Wilson, S. 2007. The Real Wealth of the Mackenzie Region: Assessing the Natural Capital Values of a
Northern Boreal Ecosystem. (2009 update). Canadian Boreal initiative. ottawa, Canada.15 Wilson, S.J. 2008. ontario’s Wealth, Canada’s Future: Appreciating the Value of the greenbelt’s Eco-Services. greenbelt
Foundation and david Suzuki Foundation.16 Wilson, S.J. 2008. Lake Simcoe Basin’s Natural Capital: The Value of the Watershed’s Ecosystem Services. Friends of
the greenbelt Foundation occasional Paper Series. lake Simcoe Region Conservation Authority and The Friends of the greenbelt Foundation. ontario, Canada.
17 Kennedy, M., and Wilson, J. 2009. Natural Credit: Estimating the Value of Natural Capital in the Credit River Watershed. The Pembina institute and Credit Valley Conservation. Note: natural capital values per hectare were not provided in the study.
18 Troy, A., and Bagstad, K. 2009. Estimation of Ecosystem Service Values for Southern Ontario. Spatial informatics group. Prepared for the ontario Ministry of Natural Resources. ontario. Total annual value and average value per hectare are lower than those reported in the original report because of an error in the benefit transfer estimates that were first published by the authors. updated values cited in this study were received directly from the authors. The larger value per hectare in this study, compared to the other southern ontario studies, was the result of higher values attributed to urban and suburban natural cover because of the greater sized population dependent on these green spaces.
Communities, groups
and governments are
beginning to recognize
the essential ecosystem
services that nature
provides. as a result, the
valuation of ecosystem
services is an emerging
trend at the global,
national and local levels.photo (BlaCk & yellow orBweaver, argiope aurantia) Courtesy gary yankeCh/fliCkr

page 16 C a n a da’ s w e a lt h of n at u r a l C a pita l : rou ge n ation a l pa r k
pa rt 4
Methodological Approach
framework
This study provides a natural capital account for the existing Rouge Park, the proposed Rouge National Park,
and its surrounding watersheds. This account includes the extent and distribution of the land cover and land
use across the study area, as well as the non-market ecosystem benefits and the agricultural market values
provided by the study area’s natural capital.
• physiCal natural Capital inventory: The physical account of natural capital and land use was based
on the extraction of land cover data using the Southern ontario land Resource information System
(SolRiS 2000-2002) to estimate the area of each land cover type, ecosystem type, and land use type.19
• typology and identifiCation of eCosystem serviCes and Benefits: The typology of ecosystem
services was based on the classification developed by the TEEB (The Economics of Ecosystems and
Biodiversity) Foundations report.20 The identification of ecosystem services was determined by
ascribing services typically provided by each land cover type. The ecosystem services were attributed
based on a review of relevant literature combined with a review of local information sources to assess
which ecosystem services were likely provided by the study area’s ecosystems and agricultural areas.
• non-market eCosystem serviCe & market values: The economic value of the benefits provided
by ecosystem services was assessed for each land cover type. The ecosystem valuation was based
on the TEEB methodology set out in their Ecological and Economic Foundations report.21 in addition,
the market value for croplands has been estimated based on average net farm revenue per hectare
in ontario.
19 Southern ontario land Resource information System (SolRiS) 2000-2002. Science and information Branch. ontario Ministry of Natural Resources.
20 www.teebweb.org/EcologicalandEconomicFoundation/tabid/1018/default.aspx Accessed June 2011.21 ibid.
the distribution of
land cover and land
use in rouge park,
the proposed rouge
national park, and the
surrounding watersheds
were mapped.photo (Buffleheads)
Courtesy gary yankeCh/fliCkr

dav id s uzu ki fou n dation page 17
• mapping of land Cover and eCosystem goods and serviCes: The distribution of land cover and land
use in Rouge Park, the proposed Rouge National Park, and the surrounding watersheds were mapped.
in addition, the average ecosystem service value per hectare by land cover type has been mapped
spatially to provide a visual display of the distribution of natural capital values across the study areas.
limitations of Benefits monetization
identifying and developing economic values for ecosystem services is challenging because of limited availability
of data and information. one of the key limitations for this study, and for non-market valuation in general, is
the difficulty with fully monetizing all ecosystem service benefits that sustain the health and well-being of
human communities.
in addition, benefits that are monetized have several limitations. Monetized values generally account
for only a portion of the total benefits in each category. Furthermore, estimated values tend to be lower and
more conservative because analysts err on the side of caution. This is most often due to the uncertainties
of transferring values from other studies. As a result, the values reported in this study are conservative and
likely under-estimate the full economic value of natural capital in the study area.
Another limitation is the application of constant values for benefit estimates. For example, values are applied
linearly across landscapes and over time. This means that we assume that a benefit is the same value for each
hectare of forest, per se, and that the value is the same each year, despite differences in forest quality and
quantity. however, given that the benefit values are based on average ecosystem service inputs and often
lower or average economic values, the valuation is applicable and meaningful.
The estimated values provided in this report are conservative for several reasons. The valuations are
imperfect because our knowledge of all the benefits provided by nature is incomplete, and because without
the earth’s ecosystems and resources, life would be not be possible (i.e., the value of nature is priceless).
it is also important to note that the value of natural capital and ecosystem services are likely to increase
over time with increasing scarcity due to land use change (e.g., the ongoing loss of nature and farmland with
urbanization) as well as the impacts of climate change.
lastly, we did not consider the benefits to individuals residing outside of the study area when evaluating
the recreational value of the Rouge’s forests and other green space, nor the cultural value of its farmlands.
As a result, our analysis tends to underestimate the total economic value of the Rouge and its surrounding
watershed’s natural capital.
we did not consider the
benefits to individuals
residing outside of the
study area, nor the
cultural value of its
farmlands. as a result,
our analysis tends to
underestimate total
economic value.photo top: (Baltimore CheCkerspot) Courtesy gary yankeCh/fliCkrphoto Bottom: Courtesy kwong yee Cheng/fliCkr

page 18 C a n a da’ s w e a lt h of n at u r a l C a pita l : rou ge n ation a l pa r k
typology of ecosystem services by land Cover & land use
The development of conceptual frameworks and methodologies for ecosystem valuation has improved the
ability to value natural capital. The united Nations’ 2005 Millennium Ecosystem Assessment (MA) reported
on the condition of the world’s ecosystems and their ability to provide services today and in the future.22 The
MA framework focused on linkages between ecosystem services and human well-being, and categorized
ecosystem services into four categories:
• Supporting services: nutrient cycling, soil formation and primary production;
• Provisioning services: food, fresh water, wood and fiber, and fuel;
• Regulating services: climate regulation, flood regulation, disease regulation and water purification;
• Cultural services: aesthetic, spiritual, educational and recreational services.
This typology provided a springboard for several subsequent initiatives and programs. however, some
experts criticized the MA framework for including supporting services, such as nutrient cycling and soil forma-
tion, arguing that these contribute to the same end uses or “ecosystem benefits.” Therefore, some ecological
economists called for the valuation of ecosystem benefits (e.g., recreation) rather than ecosystem services
to avoid “double-counting” of values for an ecosystem.
The Economics of Ecosystems and Biodiversity (TEEB) is an international initiative led by the united Nations,
the European Commission, and the german and uK governments. The 2010 TEEB framework modifies the MA
22 Millennium Ecosystem Assessment. 2005. Ecosystems and Human Well-being: Synthesis. island Press. Washington, d.C.
pa rt 5
Natural Capital Valuation Framework for Ecosystem Services Valuation
some ecological
economists called
for the valuation of
ecosystem benefits
(e.g., recreation)
rather than ecosystem
services to avoid
“double-counting”
of values for an
ecosystem.photo (Canada darner)
Courtesy gary yankeCh/fliCkr

dav id s uzu ki fou n dation page 19
approach in order to avoid “double-counting.” TEEB emphasizes the difference between ecological functions,
the services they contribute to human well-being, and the welfare benefits they generate.23 As a result, TEEB
is advancing a modified typology of ecosystem services. TEEB’s typology for ecosystem services assumes
that supporting services such as nutrient cycling are accounted for within the other ecosystem services.
As a result, their revised typology excludes supporting services as individual services that were included in
the MA typology, and adds habitat services as an additional category to reflect the importance of habitat for
migratory species and for maintaining genetic pools (Table 1).
taBle 1: typology for eCosystem serviCes
Provisioning services Regulating services habitat services Cultural services
Food
Water
Raw materials
genetic resources
Medicinal resources
ornamental resources
Air quality regulation; climate regulation; moderation of extreme events
Regulation of water flows
Waste treatment
Erosion prevention
Maintenance of soil fertility
Pollination
Biological control
Maintenance of life cycles of migratory species
Maintenance of genetic diversity
Aesthetic information
opportunities for recreation and tourism
inspiration for culture, art and design
Spiritual experience
information for cognitive development
Source: Adapted from The Economics of Ecosystems and Biodiversity: The Ecological and Economic Foundations. September 2009 draft
identification of ecosystem services
Ecosystem services are the benefits derived from ecosystems. These benefits are dependent on ecosystem
functions, which are the processes (physical, chemical and biological) or attributes that maintain ecosystems
and the people and wildlife that live within them. Services can include products received from ecosystems (e.g.,
food, fibre, clean air and water), benefits derived from processes (e.g., nutrient cycling, water purification and
climate regulation), and non-material benefits (e.g., recreation and aesthetic benefits).24 Ecosystem services
are often also referred to as ecosystem or ecological goods and services, however, this study is focused on
non-market ecosystem services, so the term ecosystem services will be used throughout the report.
Ecosystem processes or functions characterize ecosystems. using the classifications of ecosystem
function from a number of published sources, the potential ecosystem services by an ecosystem type can
be identified.
The TEEB typology for ecosystem services can be categorized by ecosystem type or landscape type. The
potential ecosystem services provided by each ecosystem or land cover type, and the benefits provided are
identified in Table 2.
23 Pascual, u., and Muradian, R. 2010. “The Economics of Valuing Ecosystem Services and Biodiversity.” (Chpt. 5) in: The Economics of Ecosystems and Biodiversity: The Ecological and Economic Foundation. www.teebweb.org/EcologicalandEconomicFoundation/tabid/1018/default.aspx Accessed Aug. 2010.
24 Millennium Ecosystem Assessment. 2003. Ecosystems and Human Well-Being: A Framework for Assessment. World Resources institute, island Press. Washington, d.C.
services can include
products received from
ecosystems (e.g., food,
fibre, clean air and water),
benefits derived from
processes (e.g., nutrient
cycling, water purification
and climate regulation),
and non-material benefits
(e.g., recreation and
aesthetic benefits).photo Courtesy Bad alley/fliCkr

page 20 C a n a da’ s w e a lt h of n at u r a l C a pita l : rou ge n ation a l pa r k
taBle 2: eCosystem serviCes and potential Benefits/values By eCosystem type
Ecosystem/landscape Type
Ecosystem Services (Typology of ES from TEEB)
Potential Benefits for human Well-being
Wetlands
Fresh water storage
Water flow regulation
Waste treatment
Carbon storage
Maintenance of life cycles of migratory species
Maintenance of genetic diversity
Cultural services
habitat services
Food provision
Water supply
Climate regulation
Flood control
Waste processing
Amenity/tourism/recreation
Cultural/heritage conservation
Biological and genetic diversity
habitat provision
lakes & Rivers
Fresh water storage
Waste treatment
Maintenance of life cycles of migratory species
Maintenance of genetic diversity
Cultural services
habitat services
Food provision
Water supply
drainage and natural irrigation
Transportation
Biological and genetic diversity
Amenity/tourism/recreation
Cultural/heritage conservation
Forests
Water flow regulation
Air quality regulation
Carbon storage
Water filtration
Erosion prevention
Soil fertility
Pollination
Biological control
Cultural services
habitat services
Food provision
Water supply
good air quality
Climate regulation
Flood control
Pest control
Erosion control
Pollination of wild and cultivated plants
Biological and genetic diversity
Amenity/tourism/recreation
Cultural/heritage conservation
habitat Provision
grassland & Shrubland
Water flow regulation
Air quality regulation
Carbon storage
Pollination
Erosion prevention
Soil fertility
habitat services
Climate regulation
Flood control
Erosion control
Air quality
Biological and genetic diversity
Amenity/tourism/recreation
Cultural/heritage conservation
Well-Managed Cultivated Areas
Pollination
Carbon storage
Erosion prevention
Soil fertility
Provision of food
Pollination of crops
Erosion control
Amenity and recreation
Cultural/heritage conservation
urban green Space
Air quality regulation
Water flow regulation
Carbon storage
habitat services
Abatement of air/noise pollution
Property enhancement
inspiration/spiritual enhancement
Amenity/tourism/recreation
Cultural/heritage conservation
habitat provision
determining the
non-market values for
ecosystem services
is much more difficult
because they do not have
an established price.photo (CraB spider)
Courtesy gary yankeCh/fliCkr
dav id s uzu ki fou n dation page 21
valuation approach
Measuring the value of goods or services is fairly straightforward when they have a market-determined value.
however, determining the non-market values for ecosystem services is much more difficult because they
do not have an established price, and there is often a lack of accurate ecological and economic information.
There are several techniques that have been developed to determine economic values for non-market
ecosystem services. These include:
1) direct market valuation approaches, such as ‘market-based’, ‘cost-based’ and ‘production function-
based’ valuations;
2) ‘Revealed preference’ approaches, such as travel cost and hedonic pricing methods; and,
3) ‘Stated preference’ approaches, such as contingent valuation, choice modeling and group valuation
methods.25
direct market valuation methods use data from actual markets and reflect preferences or costs to individ-
uals. Revealed preference techniques are based on the observation of individual choices that are related to
the ecosystem service under study. Stated preference use surveys to assess the willingness to pay or accept
compensation for a hypothetical change in supply of ecosystem services.
The TEEB framework recommends that values be derived from direct market valuation approaches where
possible. in the absence of this information, price information can be derived from market information indirectly
associated with the service. if both direct and indirect price information are not available, hypothetical scenarios
created by stated preference methods can be used.26
Cost-based valuation approaches, such as avoided cost and replacement cost, were used for this study
wherever possible. For example, avoided damage cost estimates assess the value for ecosystem services
based on what society would pay if ecosystems and their services were diminished or damaged. in other
words, the value is estimated based on the cost of damages that would be incurred in the absence of those
services. Replacement cost applies to ecosystem services that could be replaced using another natural
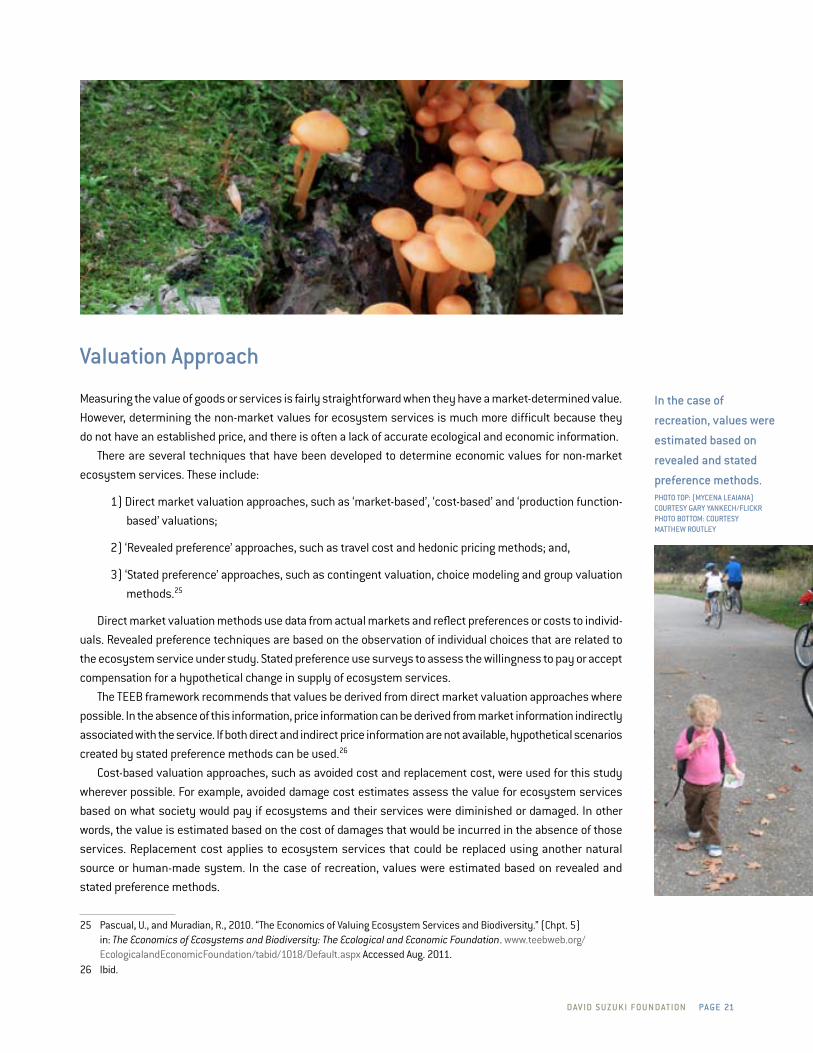
source or human-made system. in the case of recreation, values were estimated based on revealed and
stated preference methods.
25 Pascual, u., and Muradian, R., 2010. “The Economics of Valuing Ecosystem Services and Biodiversity.” (Chpt. 5) in: The Economics of Ecosystems and Biodiversity: The Ecological and Economic Foundation. www.teebweb.org/EcologicalandEconomicFoundation/tabid/1018/default.aspx Accessed Aug. 2011.
26 ibid.
in the case of
recreation, values were
estimated based on
revealed and stated
preference methods.photo top: (myCena leaiana) Courtesy gary yankeCh/fliCkrphoto Bottom: Courtesy matthew routley

page 2 2 C a n a da’ s w e a lt h of n at u r a l C a pita l : rou ge n ation a l pa r k
pa rt 6
land Cover of Study Area
land Cover & land use in study area
The total study area includes the Rouge, duffins Creek and Petticoat Creek watersheds, covering 64,623 hectares
(Table 3). land cover, ecosystems and land use within the study area were determined using geospatial data
from the 2000-2002 Southern ontario land Resource information System (SolRiS).27 The study area contains
three primary types of land cover:
• Agricultural lands (57 per cent);
• Built urban areas and roads (20 per cent) and urban green space (4 per cent);
• Natural ecosystems: forests (12 per cent) and wetlands (6 per cent).
All three watersheds have over half of their land base as agricultural lands; however, only a portion of these
lands are currently being cultivated. in the Petticoat watershed, 62 per cent of land is classified as agricultural
lands but only 42 per cent is cultivated as annual or mixed crops. in addition, 18 per cent of agricultural land
is idle land that has not been cultivated for more than 10 years, 1.5 per cent is hedgerow, and 0.7 per cent is
perennial or grazing lands. Annual and mixed croplands account for 35 per cent across all of the watersheds
in the total study area.
27 Southern ontario land Resource information System (SolRiS) 2000-2002. Science and information Branch. ontario Ministry of Natural Resources.
land cover,
ecosystems and
land use within the
study area were
determined using
geospatial data from
the 2000-2002
southern ontario
land resource
information
system (solris).photo Courtesy
Bay alley/fliCkr

dav id s uzu ki fou n dation page 23
taBle 3: land Cover in the rouge, duffins Creek and pettiCoat Creek watersheds (heCtares)
land cover Rouge
Watershed duffins Creek
Watershed Petticoat
WatershedTotal
Study Area% of Total
land Cover
Forest 2,688.1 5,060.9 256.5 8,005.5 12.4%
Coniferous Forest 510.6 1,285.1 57.9 1,853.6 2.9%
deciduous Forest 1,326.0 2,432.6 165.8 3,924.4 6.1%
Mixed Forest 851.5 1,343.2 32.7 2,227.4 3.4%
Wetland 1,684.6 1,773.0 158.6 3,616.2 5.6%
Shallow Water 8.8 0.0 0.0 8.8 0.0%
Bog 3.9 0.0 0.0 3.9 0.0%
Fen 0.6 0.0 0.0 0.6 0.0%
Marsh 101.6 115.5 14.8 231.9 0.4%
Swamp 1,569.7 1,657.5 143.9 3,371.1 5.2%
Water/shoreline 81.9 53.6 0.0 135.5 0.2%
open Water 73.1 53.6 0.0 126.7 0.2%
open Shoreline 1.2 0.5 0.0 1.7 0.0%
agricultural lands 17,488.3 17,940.6 1,667.3 37,096.2 57.4%
Annual Crop 5,845.9 5,745.6 827.4 12,418.9 19.2%
Mixed Crop 5,339.2 4,371.3 306.6 10,017.2 15.5%
grazing lands 689.6 1,445.6 18.7 2,153.9 3.3%
hedgerows 584.3 306.5 39.2 930.1 1.4%
idle land 4,880.6 5,182.0 474.2 10,536.8 16.3%
Tree Plantations 148.6 889.4 1.2 1,039.3 1.6%
other land use 11,352.2 3,824.2 600.2 15,776.6 24.4%
Built-up impervious 6,613.4 1,542.3 324.6 8,480.3 13.1%
urban green Space 1,927.1 615.8 33.0 2,575.9 4.0%
Extraction (includes restored areas within Rouge Park)
138.6 451.0 25.6 615.2 1.0%
Roads 2,673.1 1,215.1 217.1 4,105.3 6.4%
grand Total 33,287.5 28,652.7 2,682.6 64,622.8 100.0%
The Rouge watershed has the most built up areas with impervious (non-porous) surfaces, accounting
for 20 per cent of the entire watershed, compared to five per cent of duffins and 12 per cent of the Petticoat
watersheds. urban green space, including golf courses and recreational areas comprise six per cent of the
Rouge, two per cent of duffins, and one per cent of the Petticoat watersheds.
The duffins Creek watershed has the highest percentage of natural cover with 18 per cent forest cover
and six per cent wetlands.
The spatial distribution of the land cover across the study area is illustrated in the map on the following
page (Figure 4).
the duffins Creek
watershed has the
highest percentage of
natural cover with 18 per
cent forest cover and
six per cent wetlands.photo (CaliCo pennant) Courtesy gary yankeCh/fliCkr
page 24 C a n a da’ s w e a lt h of n at u r a l C a pita l : rou ge n ation a l pa r k
!(
!(
!(
!(
!(
!(
!(
!(
Highland Creek
Rouge River
West Duffins Creek
Petticoat Creek
Duffins Creek
Duffins C
reek
Little Rouge Creek
Rouge Riv er
Little Rouge Creek
UV401
UV48
UV7
UV407
UV404
UV7
Rouge
Duffins
Petticoat
Ajax
Aurora
Markham
Pickering
Stouffville
Richmond Hill
Watersheds intersecting with Rouge ParkGreenbelt Area
Land cover1
Open ShorelineConiferous ForestMixed ForestDeciduous Forest
Annual Crop AgricultureMixed Crop AgricultureGrazing Lands/PastureIdle LandPlantations - Tree CultivatedHedge RowsRoadsExtraction
Golf Course/Urban GreenspaceImpervious SurfaceSwampFenBogMarshOpen WaterShallow Water
LAKE ONTARIO
Data sources: Toronto and Region Conservation Authority;Ontario Ministry of Natural Resources; Geography Division,Statistics Canada.1Southern Ontario Land Resource Information System(2000-2002) (SOLRIS), Science and Information Branch,Ontario Ministry of Natural Resources (OMNR).
2 0 2 4 61
Scale in Kilometres
´ Projection: UTM Zone 17N Datum: NAD 1983
figure 4: land Cover & land use in the rouge, pettiCoat and duffins watersheds (solris 2000-2002)
Maps can be viewed in high resolution at www.davidsuzuki.org/rouge-landcover
land Cover of the Current rouge park
The total area of the existing Rouge Park in our study area is 3,890 hectares. This includes the area north and
south of Steeles Avenue, Bob hunter Memorial Park as well as the Toronto Zoo lands (260 hectares). Although
the Toronto Zoo is generally not considered part of Rouge Park we have included it for the purposes of this
study to be consistent with existing data from the Toronto Regional and Conservation Authority (TRCA).28 our
land cover analysis found that the park area was about 24.5 hectares smaller than reported by the TRCA (3,914
hectares). This is a result of ArcMAP rounding the SolRiS land cover area and averaging along the borders of
the boundary.
The land cover in Rouge Park includes forests, wetlands, rivers, streams, lake shoreline, agricultural lands,
restored lands and other land cover. Agricultural lands cover 59 per cent, forested land covers 21 per cent,
wetlands cover 11 per cent and other land use covers nine per cent of the Park (Table 4).
28 Park boundary data received from dan Clayton (TRCA) in April, 2011.
the land cover in
rouge park includes
forests, wetlands,
rivers, streams, lake
shoreline, agricultural
lands, restored lands
and other land cover.

dav id s uzu ki fou n dation page 25
The land cover data also provides the following characteristics for Rouge Park:
• Most of the forest lands are deciduous forest (61 per cent), with smaller areas of coniferous (16 per cent) and mixed forest (23 per cent);
• Wetlands are mostly swamps (365 ha) with a small areas of marsh (49 ha);
• Agricultural lands include 37 per cent annual crops, 34 per cent idle lands, 24 per cent mixed crops, and four per cent grazing lands, pastures, meadows and hedgerows;
• There are 103 hectares of transportation corridors within the park boundary and 52 hectares of impervious cover such as Toronto Zoo lands and parking lots.
taBle 4: land Cover types in rouge park
land Cover/land use (SolRiS 2002)a
North of Steeles Ave.
South of Steeles Ave.b
Toronto Zoo lands
Total Rouge Park Area
% of Total land Cover
Forest 141.4 552.6 110.3 804.3 20.7%
Coniferous Forest 36.7 91.9 3.0 131.6 3.4%
deciduous Forest 83.3 308.1 96.5 487.9 12.5%
Mixed Forest 21.4 152.6 10.8 184.9 4.8%
Wetland 65.2 312.1 36.2 413.5 10.6%
Shallow Water 0.0 0.0 0.0 0.0 0.0%
Bog 0.0 0.0 0.0 0.0 0.0%
Fen 0.0 0.0 0.0 0.0 0.0%
Marsh 4.5 44.3 0.0 48.8 1.3%
Swamp 60.7 267.8 36.2 364.7 9.4%
Water & shoreline 0.0 6.4 0.0 6.4 0.2%
open Water 0.0 5.5 0.0 5.5 0.1%
open Shoreline 0.0 1.4 0.0 1.4 0.0%
agricultural lands 1090.3 1167.8 52.4 2310.5 59.4%
Annual Crop 473.0 383.6 0.0 856.6 22.0%
Mixed Crop 301.6 4.7 0.0 546.7 14.1%
grazing lands/Pasture 47.5 245.1 0.0 52.2 1.3%
hedgerows 38.9 12.1 0.0 51.1 1.3%
idle land 223.5 517.4 52.4 793.3 20.4%
Tree Plantations 5.8 4.9 0.0 10.7 0.3%
other lands 14.4 278.9 60.9 354.2 9.1%
urban impervious (e.g., Toronto Zoo lands, parking lots)
9.2 35.3 7.4 51.9 1.3%
urban green Space/ golf Course
0.0 84.0 46.3 130.3 3.3%
Restored landfill 0.0 68.8 0.0 68.8 1.8%
Roads 5.2 90.9 7.2 103.4 2.7%
grand Total 1,311 2,318 260 3,890 100.0%a Southern ontario land Resource information System (SolRiS) 2000-2002. Science and information Branch.
ontario Ministry of Natural Resourcesb Excludes Toronto Zoo lands.
there are 103 hectares of transportation corridors within the park boundary and 52 hectares of impervious cover such as toronto zoo lands and parking lots.photo (sewell rd.) Courtesy lone primate/fliCkr

page 26 C a n a da’ s w e a lt h of n at u r a l C a pita l : rou ge n ation a l pa r k
Figure 5 illustrates the spatial distribution of the land cover within Rouge Park and the Toronto Zoo. Forested
areas and wetlands, mainly swamps, tend to dominate in the southern part of the park and along the Rouge
River.
!(
!(
!(
!(
Highland Creek
Rouge River
West Duffins Creek
Petticoat CreekLittle Rouge Creek
Rouge River
Little Rouge Creek
UV48
UV7
UV407
UV401
Rouge
Duffins
Petticoat
Markham
Pickering
Watersheds intersecting with Rouge ParkBob Hunter Memorial ParkToronto ZooProposed Federal LandsGreenbelt Area
Land cover1 within Rouge ParkOpen ShorelineConiferous ForestMixed ForestDeciduous ForestAnnual Crop AgricultureMixed Crop AgricultureGrazing Land/PastureIdle LandPlantations - Tree CultivatedHedge RowsRoadsRestored LandfillUrban GreenspaceImpervious SurfaceSwampMarshOpen Water
Data sources: Toronto and Region Conservation Authority;Ontario Ministry of Natural Resources1Southern Ontario Land Resource Information System (2000-2002) (SOLRIS), Science and Information Branch, OntarioMinistry of Natural Resources (OMNR).
1 0 1 2 3 4 5
Scale in Kilometres
´ Projection: UTM Zone 17N Datum: NAD 1983
figure 5: land Cover & land use in Current rouge park (solris 2000-2002)
Maps can be viewed in high resolution at www.davidsuzuki.org/rouge-landcover
photo (eastern grey tree frog) Courtesy gary yankeCh/fliCkr

dav id s uzu ki fou n dation page 27
land Cover of the proposed rouge national park
The proposed new Rouge National Park includes lands within the existing Rouge Park (3,890 hectares) plus
1,948 hectares of additional federal lands west of the York-durham town-line in Markham. This includes 1,789
hectares of agricultural lands, 71 hectares of forests, 36 hectares of wetlands and 51 hectares of land in other
land classes (e.g., parking lots) (Table 5).29 Approximately half of the additional agricultural lands are cultivated
for annual crops, 23 per cent are mixed crops and 17 per cent are classified as idle lands.
taBle 5: land Cover type and area for additional lands proposed for the rouge national park (solris 2000-2002)
land Cover/land use Types Additional Proposed Federal
Areas for National ParkTotal Proposed Area Rouge National
Park (including current Park)
Forest 71.4 875.7
Coniferous Forest 2.3 133.9
deciduous Forest 59.9 547.9
Mixed Forest 9.1 194.0
Wetland 36.4 449.9
Shallow Water 0.0 0.0
Bog 0.0 0.0
Fen 0.0 0.0
Marsh 0.0 48.8
Swamp 36.4 401.0
Water & shoreline 0.0 5.5
open Water 0.0 5.5
open Shoreline 0.0 1.4
agricultural lands 1789.0 4099.5
Annual Crop 963.5 1820.1
Mixed Crop 409.8 956.5
grazing lands/Pasture 63.1 115.3
hedgerows 54.2 105.3
idle land 297.8 1091.1
Tree Plantations 0.5 11.2
other land cover 51.5 405.7
urban impervious 2.0 53.8
urban green Space/golf Course 10.0 140.3
Restored landfill 0.0 68.8
Roads 39.5 142.8
grand Total 1948.2 5837.8
29 Based on the proposed boundaries recommended by the Rouge Park Alliance and currently under consideration by Parks Canada as the proposed study area for Rouge National Park: StrategyCorp – hemson Consulting. 2010. Governance, Organization and Financial Review of the Rouge Park Alliance. Rouge Park Alliance governance Review. Rouge Park Alliance. Toronto, Canada.
approximately half of the
additional agricultural
lands are cultivated for
annual crops, 23 per
cent are mixed crops
and 17 per cent are
classified as idle lands. photo Courtesy miChael gil/fliCkr
Maps can be viewed in high resolution at www.davidsuzuki.org/rouge-landcover
page 28 C a n a da’ s w e a lt h of n at u r a l C a pita l : rou ge n ation a l pa r k
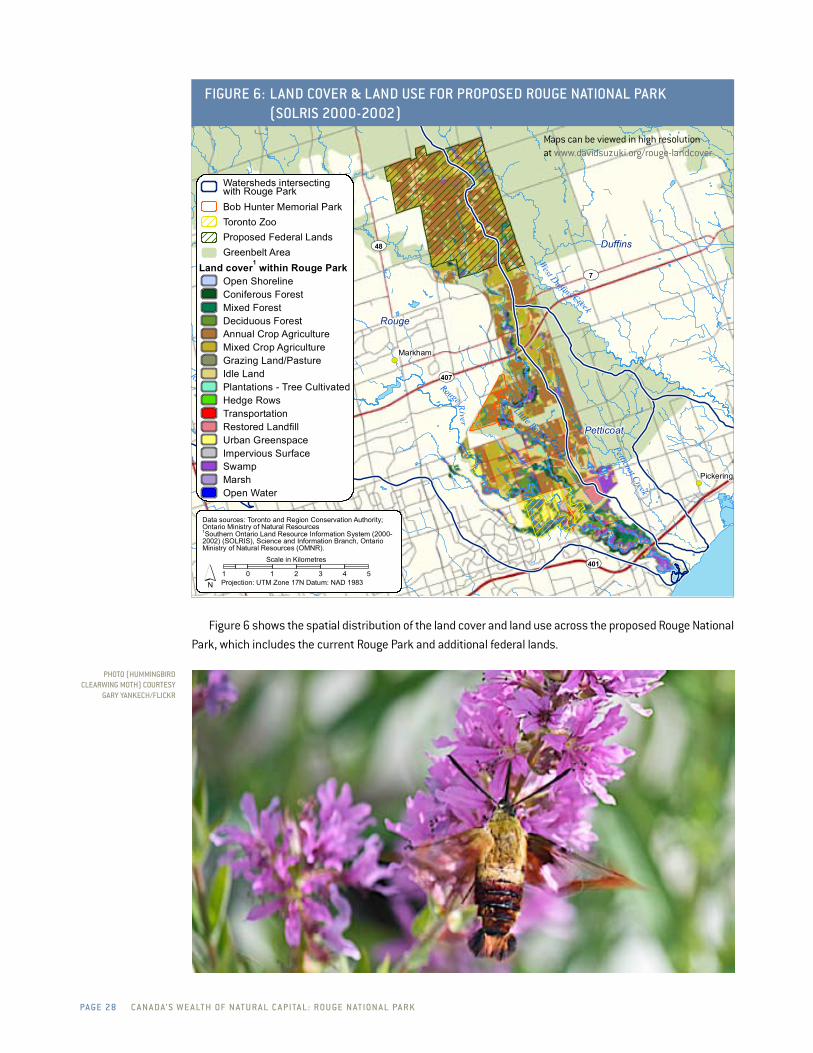
Figure 6 shows the spatial distribution of the land cover and land use across the proposed Rouge National
Park, which includes the current Rouge Park and additional federal lands.
!(
!(
!(
!(
Highland Creek
Rouge River
West Duffins Creek
Petticoat CreekLittle Rouge Creek
Rouge River
Little Rouge CreekUV48
UV7
UV407
UV401
Rouge
Duffins
Petticoat
Markham
Pickering
Watersheds intersecting with Rouge ParkBob Hunter Memorial ParkToronto ZooProposed Federal LandsGreenbelt Area
Land cover1 within Rouge ParkOpen ShorelineConiferous ForestMixed ForestDeciduous ForestAnnual Crop AgricultureMixed Crop AgricultureGrazing Land/PastureIdle LandPlantations - Tree CultivatedHedge RowsTransportationRestored LandfillUrban GreenspaceImpervious SurfaceSwampMarshOpen Water
Data sources: Toronto and Region Conservation Authority;Ontario Ministry of Natural Resources1Southern Ontario Land Resource Information System (2000-2002) (SOLRIS), Science and Information Branch, OntarioMinistry of Natural Resources (OMNR).
1 0 1 2 3 4 5
Scale in Kilometres
´ Projection: UTM Zone 17N Datum: NAD 1983
figure 6: land Cover & land use for proposed rouge national park (solris 2000-2002)
Maps can be viewed in high resolution at www.davidsuzuki.org/rouge-landcover
photo (hummingBird Clearwing moth) Courtesy
gary yankeCh/fliCkr

dav id s uzu ki fou n dation page 29
our report was designed to provide an assessment of the non-market ecosystem services provided by the
existing Rouge Park, the proposed Rouge National Park and the surrounding watersheds in the gTA. This
report focuses on non-market values for natural capital because they are generally unaccounted for as
socio-economic benefits.
Climate regulation
Climate regulation benefits include both the storage and annual sequestration of carbon. Carbon storage refers
to the carbon that is held in biomass and soils of an ecosystem. Carbon sequestration refers to the process
that removes carbon from the atmosphere and accumulates it in an ecosystem. As a result, carbon storage is
reported as tonnes of carbon per hectare, whereas carbon sequestration is reported as a rate of accumulated
tonnes of carbon per hectare per year.
over half of the global carbon stored in land-based ecosystems is currently stored in forests. Forests store
enormous amounts of carbon in standing trees and in the soil because of their cumulative years of growth.30
Trees remove carbon dioxide from the atmosphere and convert it into organic compounds, such as cellulose
and lignin – the main components of wood. About half of the weight of wood is carbon, and every kilogram of
carbon in a tree represents almost four kilograms of carbon dioxide removed from the atmosphere. As a result
forests have the ability to reduce the build-up of atmospheric greenhouse gases and contribute to efforts to
reduce global climate change.
Southern ontario’s forests are found within the Cool Temperate (CT) and Moderate Temperate (MT) eco-
climatic zones. The Rouge and surrounding watersheds are within the MT zone, which store an average of 340
30 Pregitzer, K.S., and Euskirchen, E.S. (2004). “Carbon cycling and storage in world forests: biome patterns related to forest age.” Global Change Biology. 10:2052-2077.
pa rt 7
Ecosystem Services of the Rouge Study Area
this report focuses on
non-market values for
natural capital because
they are generally
unaccounted for as
socio-economic benefits.photo Courtesy Bad alley/fliCkr
Maps can be viewed in high resolution at www.davidsuzuki.org/rouge-landcover

page 3 0 C a n a da’ s w e a lt h of n at u r a l C a pita l : rou ge n ation a l pa r k
tonnes of carbon per hectare.31 Based on this average carbon content, the total carbon stored by Rouge Park’s
forests is approximately 273,311 tonnes of carbon, or one million tonnes Co2e (carbon dioxide equivalent32).33
This is the equivalent of the greenhouse gas emissions produced by 86,765 households, or 196,498 cars
driven for one year.34 in addition, tree plantations and hedgerows were assumed to store about 50 per cent of
the carbon storage compared to natural forest cover (i.e., an average of 170 tonnes of carbon/hectare). As a
result, it was estimated that plantations and hedgerows store 10,500 tonnes of carbon.
using the average carbon value ($74.85/tonne of carbon), explained in Section 7.2 below, the 283,812
tonnes of carbon stored by Rouge Park’s forests, plantations and hedgerows was worth an estimated $21.2
million based on the 2000-2002 SolRiS data (C$2011). Carbon stored by forests was worth $920 per hectare
per year, and carbon stored by plantations and hedgerows was worth $460 per hectare per year. The annual
value of this carbon stored by forests, plantations and hedgerows was estimated to be $768,144 per year,
based on an annuity coefficient.35
Extrapolated to the total study area, the total carbon stored by forests was an estimated 2.7 million tonnes
of carbon, or 9.9 million tonnes Co2e (carbon dioxide equivalent).36 This is the equivalent of the energy used
by 857,413 households or 1.9 million cars driven over one year.37 in addition, there were 1,969 hectares of
plantations and hedgerows, estimated to store 334,593 tonnes of carbon.
using the average carbon value ($74.85/tonne of carbon) defined in Section 7.2, the carbon stored by the
total study area’s forests, plantations and hedgerows was worth an estimated $228.6 million based on the
2000-2002 SolRiS data (C$2011). The annual value of the carbon stored by forests, plantations and hedgerows
was estimated to be $8.3 million per year, based on an annuity coefficient.38
31 Kurz, and Apps 1999. “A 70-Year Retrospective of Carbon Fluxes in the Canadian Forest Sector.” Ecological Applications. 9:526-547.
32 A metric measure used to compare the emissions from various greenhouse gases based upon their global warming potential.
33 Author’s calculations: multiplied the area for forested lands from SolRiS (2000-2002) in the Rouge Park derived by spatial land cover analysis by the carbon content estimates for the Moderate Temperate eco-climatic province (340 tonnes of carbon/hectare). Estimated that plantations and hedgerows store about 50 per cent of average stored by natural forest cover (170 tonnes of carbon/hectare). Carbon estimated from: Kurz, and Apps 1999. “A 70-Year Retrospective of Carbon Fluxes in the Canadian Forest Sector.” Ecological Applications. 9: 526-547.
34 Calculated using The u.S. EPA greenhouse gas Equivalencies Calculator; 5.1 metric tons Co2E /passenger car/year; Source: EPA (2009). inventory of u.S. greenhouse gas Emissions and Sinks: 1990-2007. Chapter 3 (Energy), Tables 3-12, 3-13 and 3-14. u.S. Environmental Protection Agency, Washington, d.C. u.S. EPA #430-R-09-004 (PdF). www.epa.gov/cleanenergy/energy-resources/calculator.html
35 in order to assess the annual value, the carbon stored by forests was considered as an investment over 100 years at 3.5 per cent. An annuity calculation was used, so that the annuity coefficient (0.03616) was multiplied by the total carbon value amount to estimate a yearly value for the carbon stored. Adapted from the annuity approach developed by Mark Anielski in: Anielski, M., and Wilson, S.J. 2009 (update). Counting Canada’s Natural Capital: Assessing the Real Value of Canada’s Boreal Ecosystems. Pembina institute and The Canadian Boreal initiative. Canada. www.pembina.org/pub/204 Accessed March 2012.
36 Author’s calculations: multiplied the area for forested lands from SolRiS (2000-2002) in the Rouge Park derived by spatial land cover analysis by the carbon content estimates for the Moderate Temperate eco-climatic province (340 tonnes of carbon/hectare). Carbon estimated from: Kurz, and Apps 1999. “A 70-Year Retrospective of Carbon Fluxes in the Canadian Forest Sector.” Ecological Applications. 9: 526-547.
37 Calculated using The u.S. EPA greenhouse gas Equivalencies Calculator; 4.62 metric tons Co2E /passenger car/year; Source: EPA (2003). U.S. Inventory of Greenhouse Gas Emissions and Sinks 1990-2001. office of Atmospheric Programs, u.S. Environmental Protection Agency, Washington, d.C. EPA 430-R-03-004. www.epa.gov/cleanenergy/energy-resources/calculator.html
38 in order to assess the annual value, the carbon stored by forests was considered as an investment over 100 years at 3.5 per cent. An annuity calculation was used. So that the annuity coefficient (0.03616) was multiplied by the total carbon value amount to estimate a yearly value for the carbon stored. Adapted from the annuity approach developed by Mark Anielski in: Anielski, M., and Wilson, S.J. 2009 (update). Counting Canada’s Natural Capital: Assessing the Real Value of Canada’s Boreal Ecosystems. Pembina institute and The Canadian Boreal initiative. Canada. www.pembina.org/pub/204 Accessed March 2012.
extrapolated to
the total study area,
the total carbon
stored by forests
was an estimated
2.7 million tonnes of
carbon, or 9.9 million
tonnes Co2e. this
is the equivalent of
the energy used by
857,413 households
or 1.9 million cars
driven over one year.photo Courtesy
spiritflare/fliCkr

dav id s uzu ki fou n dation page 31
economic value of Carbon
The economic value of carbon can be estimated based on several different valuation methods. These include
estimating the avoided costs of climate change impacts, the replacement cost to replace natural carbon storage
and sequestration services, or the market price of carbon.
in order to estimate the value of carbon for this study, an average value was calculated based on multiple
sources of market and social carbon cost estimates. The estimated carbon value, inflated to 2011 dollars, is
$74.85 per tonne of carbon. The following carbon values were included in this estimate:
• The Alberta government’s Emission Reduction Regulations for large industrial emitters has set a carbon
price (as a contribution to Climate Change and Emissions Management Fund) at $15 per tonne of Co2e
(carbon dioxide equivalent), which is equal to
$55.05 per tonne of carbon (constant price).39
• in British Columbia, the 2011 carbon tax rate
was $25 per tonne of Co2 or $91.75 per tonne
of carbon. 40
• Environment Canada has used a social carbon
cost estimate of $25 per tonne of Co2e, equal
to $91.75 per tonne of carbon ($93.86/tonne in
2011 dollars), in its Regulatory impact Analysis
Statement on the Renewable Fuels Regulations.41
• The u.S. government social carbon cost esti-
mates range from $5 to $65 per u.S. ton of Co2e
(2007 u.S. dollars), with a central value of $21
per u.S. ton of Co2e (2007 u.S. dollars), equal
to $75.15 per metric tonne of carbon (2011
Canadian dollars).42
• The united Nations intergovernmental Panel on Climate Change reported that the average social cost
of carbon (including environmental, economic and social costs), based on the impacts of climate
change, was C$52 per tonne of carbon in 2005 ($58.09/tonne in 2011 dollars).43
39 Specified gas Emitters Regulation (SgER), under Alberta’s Emission Reduction Regulations, requires 12 per cent reduction in emissions intensity from facilities that emit greater than 100,000 tonnes of Co2e. Compliance may be achieved through emissions performance credits, generation or purchase of offsets or contribution to the Climate Change Technology Fund at a price of $15 per tonne of carbon dioxide equivalent. http://environment.alberta.ca/02486.html other country programs in comparison have higher prices: Finland at $89.39/t carbon (uS dollars) and Sweden at $150/t carbon.
40 B.C. Ministry of Finance, “how the Carbon Tax Works,” www.fin.gov.bc.ca/tbs/tp/climate/A4.htm 41 Environment Canada. 2011. Regulatory impact Analysis Statement. Regulations Amending the Renewable Fuels
Regulation.145: 9. (February 26, 2011) www.gazette.gc.ca/rp-pr/p1/2011/2011-02-26/html/reg3-eng.html#REF22 Sensitivity analysis ranging from $10 to $100 per tonne of Co2e, equal to $36.70 to $367.00 per tonne of carbon (2010 dollars).
42 in the u.S., carbon and Co2e is reported per ton, rather than metric tonne. The value per ton of Co2e was converted to dollars per metric tonne (1 ton = 0.907 metric tonne), then converted to Canadian dollars (www.bankofcanada.ca/rates/exchange/10-year-converter/), then converted to Canadian dollars per tonne of carbon (1 tC = 3.67 tCo2), and then converted to 2011 Canadian dollars per tonne of carbon (using Bank of Canada online inflation calculator).
43 M.l Parry, o.F. Canziani, J.P. Palutikof, P.J. van der linden and C.E. hanson, (Eds.). 2007. Summary for Policymakers. in: Climate Change 2007: Impacts, Adaptation and Vulnerability. Contribution of Working group ii to the Fourth Assessment Report of the intergovernmental Panel on Climate Change. iPCC. Cambridge university Press. Cambridge, uK, 7-22.
the carbon stored by
the total study area’s
forests, plantations
and hedgerows was
worth an estimated
$228.6 million.photo Courtesy vlad litvinov/fliCkr

page 32 C a n a da’ s w e a lt h of n at u r a l C a pita l : rou ge n ation a l pa r k
annual Carbon uptake (sequestration) by forests
Carbon sequestration refers to the annual amount of carbon uptake by an ecosystem. in the 2008 ontario
greenbelt study, the annual uptake of carbon was assessed using a spatially based geographic information
Systems software tool called CiTYgreen.44 CiTYgreen’s carbon module quantifies the removal of carbon dioxide by
trees based on the estimated age distribution of forest land cover by assigning three Age distribution Types.45
Type 1 represents a distribution of young trees, type 2 represents older trees, and type 3 describes a site with
a balanced distribution of ages. Each type is associated with a multiplier (i.e., tonnes of carbon taken up per
hectare), which is used to calculate the site’s canopy and to estimate how much carbon is sequestered on an
annual basis.
The CiTYgreen analysis for the greenbelt study estimated that the carbon annually sequestered is an aver-
age of 0.75 tonnes of carbon per hectare. Rouge Park is part of the greenbelt, so the average results from the
CiTYgreen analysis were applied to our study area. Therefore, the annual carbon sequestered by the forest cover
in Rouge Park is an estimated 603 tonnes of carbon; a value of $45,153 per year or $56.14 per hectare. in addition,
plantations and hedgerows sequestered an estimated 46 tonnes of carbon per year, worth $3,470 per year.
The total study area’s forest cover sequestered an estimated 6,004 tonnes of carbon per year; a value of
$449,406 per year or $56.14 per hectare. in addition, plantations and hedgerows sequestered an estimated
1,477 tonnes of carbon, worth $110,555 per year.
Carbon stored by wetlands
Wetlands store carbon in their soils and peat. Carbon storage by wetlands was determined for this study based
on results from the 2008 ontario greenbelt study, which extracted data from the 1996 Canada’s Soil organic
Carbon database.46 According to this database, the greenbelt’s wetlands stored between 111 tonnes and 334
tonnes of carbon per hectare, depending on the type of wetland (i.e., bog, marsh, swamp and fen).47
This study area is part of the greenbelt, so we have applied the average carbon stored per hectare by wetland
type. Rouge Park wetlands cover is made up of swamps (365 hectares) and marshes (49 hectares). As a result
we estimated that the total carbon stored by Rouge Park’s wetlands is 47,254 tonnes (111 tonnes of carbon per
hectare of swamp; 137.8 tonnes of carbon per hectare of marsh). This carbon storage is worth over $3.5 million
based on the 2000-2002 SolRiS wetland cover data ($74.85 per tonne of carbon; see Section 7.2), or $127,894
per year when converted to an annual value.48
The total study area’s wetlands cover a total of 3,616 hectares, including 3,371 hectares of swamps, 232
hectares of marshes, 8.8 hectares of shallow water wetlands, 3.9 hectares of bog, and 0.6 hectares of fen.
These wetlands stored an estimated 409,321 tonnes of carbon based on the 2000-2002 SolRiS wetland cover
data, worth over $30.6 million or 1.1 million per year.49
44 Wilson, S.J. 2008. Ontario’s Wealth, Canada’s Future: Appreciating the value of the Greenbelt’s eco-services. david Suzuki Foundation. Vancouver, B.C.
45 American Forests. CiTYgreen software ArcgiS 8.x http://rfflibrary.wordpress.com/2009/08/04/citygreen-a-free-windows-based-arcgis-extention-for-ecosystem-services-valuation/
46 Tarnocai, C., and B. lacelle. 1996. Soil organic Carbon database of Canada. Eastern Cereal and oilseed Research Centre, Research Branch, Agriculture and Agri-Food Canada, ottawa, Canada.
47 Wilson, S.J. 2008, supra note 44.48 To assess the annual value, the carbon stored by forests was considered as an investment over 100 years at 3.5 per cent.
An annuity calculation was used. The annuity coefficient (0.03616) was multiplied by the total carbon value amount to estimate a yearly value for the carbon stored. Adapted from the annuity approach developed by Mark Anielski in: Anielski, M., and Wilson, S.J. 2009 (update). Counting Canada’s Natural Capital: Assessing the Real Value of Canada’s Boreal Ecosystems. Pembina institute and The Canadian Boreal initiative. www.pembina.org/pub/204 Accessed March 2012.
49 ibid.
rouge park
wetlands cover is
made up of swamps
(365 hectares) and
marshes (49 hectares).photo (mallards) Courtesy
gary yankeCh/fliCkr
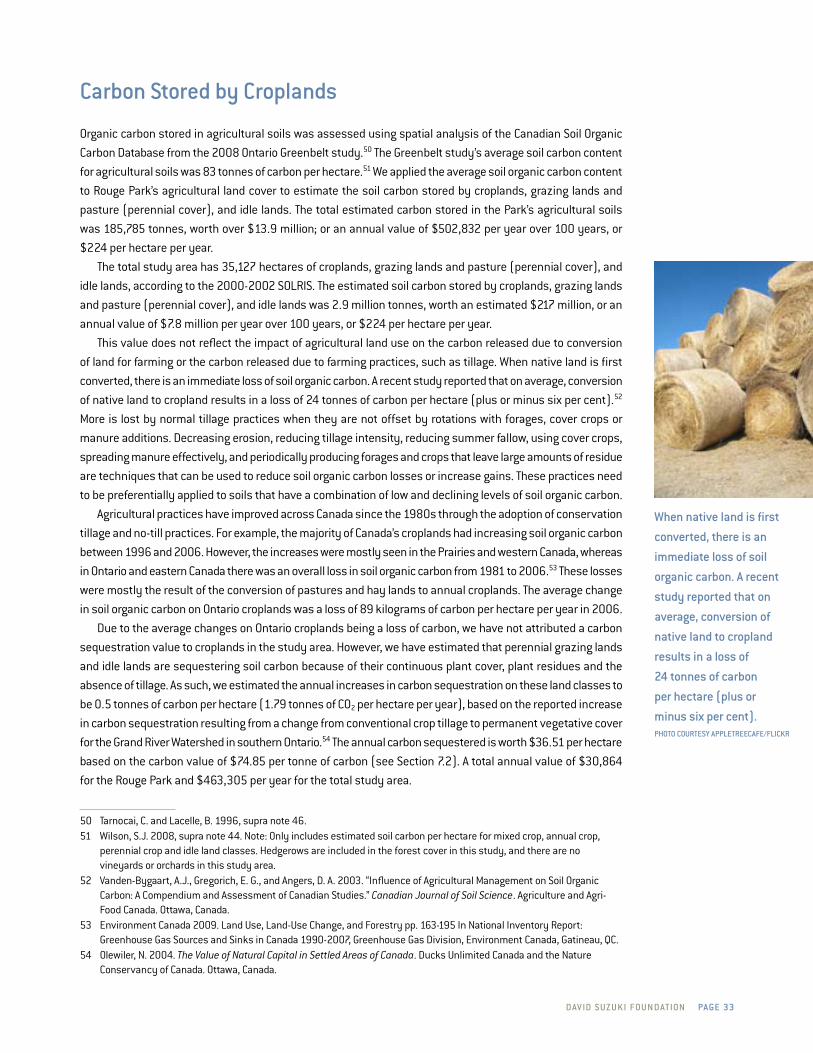
dav id s uzu ki fou n dation page 33
Carbon stored by Croplands
organic carbon stored in agricultural soils was assessed using spatial analysis of the Canadian Soil organic
Carbon database from the 2008 ontario greenbelt study.50 The greenbelt study’s average soil carbon content
for agricultural soils was 83 tonnes of carbon per hectare.51 We applied the average soil organic carbon content
to Rouge Park’s agricultural land cover to estimate the soil carbon stored by croplands, grazing lands and
pasture (perennial cover), and idle lands. The total estimated carbon stored in the Park’s agricultural soils
was 185,785 tonnes, worth over $13.9 million; or an annual value of $502,832 per year over 100 years, or
$224 per hectare per year.
The total study area has 35,127 hectares of croplands, grazing lands and pasture (perennial cover), and
idle lands, according to the 2000-2002 SolRiS. The estimated soil carbon stored by croplands, grazing lands
and pasture (perennial cover), and idle lands was 2.9 million tonnes, worth an estimated $217 million, or an
annual value of $7.8 million per year over 100 years, or $224 per hectare per year.
This value does not reflect the impact of agricultural land use on the carbon released due to conversion
of land for farming or the carbon released due to farming practices, such as tillage. When native land is first
converted, there is an immediate loss of soil organic carbon. A recent study reported that on average, conversion
of native land to cropland results in a loss of 24 tonnes of carbon per hectare (plus or minus six per cent).52
More is lost by normal tillage practices when they are not offset by rotations with forages, cover crops or
manure additions. decreasing erosion, reducing tillage intensity, reducing summer fallow, using cover crops,
spreading manure effectively, and periodically producing forages and crops that leave large amounts of residue
are techniques that can be used to reduce soil organic carbon losses or increase gains. These practices need
to be preferentially applied to soils that have a combination of low and declining levels of soil organic carbon.
Agricultural practices have improved across Canada since the 1980s through the adoption of conservation
tillage and no-till practices. For example, the majority of Canada’s croplands had increasing soil organic carbon
between 1996 and 2006. however, the increases were mostly seen in the Prairies and western Canada, whereas
in ontario and eastern Canada there was an overall loss in soil organic carbon from 1981 to 2006.53 These losses
were mostly the result of the conversion of pastures and hay lands to annual croplands. The average change
in soil organic carbon on ontario croplands was a loss of 89 kilograms of carbon per hectare per year in 2006.
due to the average changes on ontario croplands being a loss of carbon, we have not attributed a carbon
sequestration value to croplands in the study area. however, we have estimated that perennial grazing lands
and idle lands are sequestering soil carbon because of their continuous plant cover, plant residues and the
absence of tillage. As such, we estimated the annual increases in carbon sequestration on these land classes to
be 0.5 tonnes of carbon per hectare (1.79 tonnes of Co2 per hectare per year), based on the reported increase
in carbon sequestration resulting from a change from conventional crop tillage to permanent vegetative cover
for the grand River Watershed in southern ontario.54 The annual carbon sequestered is worth $36.51 per hectare
based on the carbon value of $74.85 per tonne of carbon (see Section 7.2). A total annual value of $30,864
for the Rouge Park and $463,305 per year for the total study area.
50 Tarnocai, C. and lacelle, B. 1996, supra note 46.51 Wilson, S.J. 2008, supra note 44. Note: only includes estimated soil carbon per hectare for mixed crop, annual crop,
perennial crop and idle land classes. hedgerows are included in the forest cover in this study, and there are no vineyards or orchards in this study area.
52 Vanden-Bygaart, A.J., gregorich, E. g., and Angers, d. A. 2003. “influence of Agricultural Management on Soil organic Carbon: A Compendium and Assessment of Canadian Studies.” Canadian Journal of Soil Science. Agriculture and Agri-Food Canada. ottawa, Canada.
53 Environment Canada 2009. land use, land-use Change, and Forestry pp. 163-195 in National inventory Report: greenhouse gas Sources and Sinks in Canada 1990-2007, greenhouse gas division, Environment Canada, gatineau, QC.
54 olewiler, N. 2004. The Value of Natural Capital in Settled Areas of Canada. ducks unlimited Canada and the Nature Conservancy of Canada. ottawa, Canada.
when native land is first
converted, there is an
immediate loss of soil
organic carbon. a recent
study reported that on
average, conversion of
native land to cropland
results in a loss of
24 tonnes of carbon
per hectare (plus or
minus six per cent).photo Courtesy appletreeCafe/fliCkr

page 34 C a n a da’ s w e a lt h of n at u r a l C a pita l : rou ge n ation a l pa r k
A review of innovative government programs that can be employed to support better soil carbon-
management and other practices by agricultural producers is presented in Appendix 1.
Clean air
Trees produce oxygen and improve air quality by absorbing pollution and airborne particles in their leaves. By
absorbing and filtering nitrogen dioxide, sulfur dioxide, ozone, carbon monoxide, and particulate matter less
than 10 microns (PM10) in their leaves, urban trees perform a vital service that directly affects the well-being
of humans. Studies show that trees can remove eight to 12 grams of air pollutants per square metre of tree
canopy cover.55
in the ontario greenbelt study, CiTYgreen software was used to assess the amount of air pollutants
removed by the tree canopy cover across the greenbelt study area, based on the air quality within the greater
Toronto Area.56 it calculated that trees in the greenbelt removed about 60 kilograms of pollutants per hectare
per year, including 1.2 kg of carbon monoxide, 4.2 kg of sulfur dioxide, 7.5 kg of nitrogen dioxide, 16.8 kg of
particulate matter and 30.3 kg of ozone.57 To calculate the value of filtering these pollutants, CiTYgreen used
the united States Public Services Commission’s estimates of national average indirect costs of reduced air
quality, including rising health care expenditures and reduced tourism revenue.
We applied the removal rates and values to our study area’s forests, tree plantations and hedgerows, as-
signing only 50 per cent of the removal rate to the latter two cover types. using these rates, we estimated that
48,260 kilograms of pollutants were removed by the Rouge Park’s forests and 1,854 kilograms by plantations
and hedgerows.
55 Nowak, d.J., Wang, J., and Endreny, T. 2007. “Environmental and Economic Benefits of Preserving Forests within urban Areas: Air and Water Quality.” in: The Economic Benefits of Land Conservation. The Trust for Public land. San Francisco, California. www.tpl.org/publications/books-reports/park-benefits/the-economic-benefits-of-land.html Accessed April 2012.
56 Nowak, d.J. and Crane, d.E. 2000. The urban Forest Effects (uFoRE) Model: quantifying urban forest structure and functions. in M. hansen and T. Burk, eds. Proceedings: integrated tools for natural resources inventories in the 21st century. iuFRo Conference, 16-20 August 1998, Boise, id; general Technical Report NC-212, u.S. department of Agriculture, Forest Service, North Central Research Station, St. Paul, MN. pp. 714-720.
57 Wilson, S.J. 2008. Ontario’s Wealth, Canada’s Future: Appreciating the value of the Greenbelt’s eco-services. david Suzuki Foundation. Vancouver, B.C.
By absorbing and
filtering nitrogen
dioxide, sulfur
dioxide, ozone,
carbon monoxide,
and particulate
matter in their leaves,
urban trees perform
a vital service that
directly affects the
well-being of humans.photo (Cedar waxwing)
Courtesy pearl vas/fliCkr

dav id s uzu ki fou n dation page 35
The total estimated annual value provided by this service is equal to $382,057 per year, or $475 per hectare
per year of natural forest cover plus $14,679, or $237.50 per hectare of plantation and hedgerow cover (2011$).
The forest cover across the total study area removed an estimated 480,343 kilograms of pollutants, and
plantation and hedgerow cover removed an additional 59,082 kilograms. The annual value of this service for
the total study area was an estimated $3.8 million per year for forests, plus $467,730 for plantations and
hedgerows.
flood prevention & water regulation
Forests and wetlands regulate the flow of water in a watershed. This provides protection against flooding, soil
loss and erosion. The loss of forest and wetland cover also leads to reduced infiltration and increased peak
flows. in other words, forest and wetland loss can result in: lower water levels in dry seasons; higher than
normal water levels in wet seasons or storms; increased soil erosion and sedimentation; and increases in
water temperatures, which all can negatively affect aquatic ecosystems.58
Research demonstrates that forests and tree cover significantly improve the quality of water in a watershed.
Studies by the united States Environmental Protection Agency show that forests in rural areas improve water
quality because trees divert rainwater through the soil where bacteria and micro-organisms filter out pollut-
ants.59 This filtering significantly reduces the sediment, pollutants and organic matter that reach streams and
rivers. Riparian forests (i.e., forested buffers along waterways) are especially effective at reducing non-point
source pollution, such as nitrogen in agricultural runoff.
Forest cover and wetlands, therefore, provide green infrastructure services for the Rouge study area. For
this study, we have adopted the average additional water storage provided by forest cover, and the replacement
cost converted to 2011$ ($64.02/cubic metre) from the greenbelt study based on the conversion of forest/
tree cover for urban development.60 As a result, Rouge Park forest cover provides storage for 246,510 cubic
metres of storm water runoff, worth $15.8 million, or $570,651 per year ($709.47/hectare/year) over 100
years at 3.5 per cent. We used the annuity calculation applied to the carbon value, to estimate the annual
value for the storm water runoff benefit. Applied to the total study area’s forested land cover area, the benefit
is equal to $5.7 million per year.
This value was also attributed to plantations and hedgerows at 50 per cent ($354.74/hectare/year). As a
result, the plantation and hedgerow cover provides a benefit of $21,925 per year in Rouge Park, and a total of
$698,588 in the total study area ($354.74/hectare/year).
if we wanted to assess the costs for a loss in a portion of forest cover, the benefit value for storm water
regulation could be used to assess the costs of proposed land use change. For example, if 10 per cent of
the study area’s forest land cover was converted to urban land use, the replacement cost in terms of water
regulation (i.e., stormwater management) would be an estimated $567,966 (calculated as 10 per cent of total
study area forest cover multiplied by annual benefit of $709.47 per hectare).
The CiTYgreen program also evaluated the cost of conversion of forest cover to cropland. The additional
stormwater storage when forest land cover is compared to cropland is 118.5 cubic metres per hectare. Therefore,
the annual value is an estimated $274.40 per hectare of forest cover, when comparing additional benefits
between these two land cover types. As a result, if 10 per cent of forest cover were converted to croplands,
the cost would be $219,669. All values are in 2011 dollars.
58 Committee on hydrologic impacts of Forest Management. 2008. hydrological Effects of a Changing Forest landscape. Water Science and Technology Board. National Research Council of the National Academies. Washington, d.C. http://dels.nas.edu/Report/hydrologic-Effects-Changing-Forest/12223 Accessed: April 2012
59 u.S. EPA 2007. Reducing Stormwater Costs Through Low Impact Development Strategies and Practices. Nonpoint Source Control Branch. US Environmental Protection Agency. www.epa.gov/owow/NPS/lid/costs07/ Accessed April, 2012.
60 Wilson, S.J. 2008, supra note 57.
research demonstrates
that forests and tree
cover significantly
improve the quality of
water in a watershed.photo Courtesy Bay alley/fliCkr

page 36 C a n a da’ s w e a lt h of n at u r a l C a pita l : rou ge n ation a l pa r k
value of flood Control by wetlands
Wetlands also regulate the flow of water providing protection against flooding and erosion. Wetlands act as
natural retention reservoirs for water, slowing the release of water and replenishing base flows for groundwater.
The annual value of flood control by wetlands is based on a conservative global average ($867.95 per hectare;
2011$) derived from a global meta-analysis of values provided by wetlands.61 Based on this average, the
annual value of flood control services provided by wetlands is an estimated $358,902 per year within Rouge
Park and over $3.1 million annually for the total study area.
waste treatment
Wetlands can absorb nutrients such as nitrogen and phosphorus that run-off farmlands because of fertilizer
and manure use, and from livestock. The amount that a wetland can absorb varies depending on the wetland
type, size, plants and soils.
Estimates range from 80 to 770 kilograms per hectare per year for phosphorus removal, and 350 to 32,000
kilograms per hectare per year for nitrogen removal.62 We applied the lower removal rates to the wetland
cover in Rouge Park and the surrounding watersheds, to estimate the wetlands capacity for waste removal.63
As a result, wetland cover in Rouge Park has an estimated capacity to remove 33,204 kg of phosphorus and
144,727 kg of nitrogen. Wetlands across the total study area have an estimated capacity to remove 290,381
kilograms of phosphorus and 1.3 million kilograms of nitrogen each year, based on the low-end removal rates.
For the study area, we estimated nitrogen loss from croplands based on an annual loss of 10 to 20 kilograms
nitrogen per hectare (i.e., the risk class reported for the majority of ontario’s farmlands).64 As a result, the
estimated nitrogen loss from croplands in Rouge Park ranges from 14,033 to 28,066. Estimated nitrogen
losses from croplands across the study area range from 224,361 kilograms to 448,722 kilograms of nitrogen.
The costs of removing nitrogen and phosphorus by waste treatment plants have been estimated to range
from $3.49 to $9.90 per kilogram of nitrogen, and $25.62 to $71.05 (2011$) per kilogram of phosphorus
(2011$).65 using the low-end cost ($3.49 per kilogram) as a proxy for the value of wetland waste treatment
services for excess nitrogen, the annual value is $118.44 per hectare of wetland in Rouge Park. Based on the
wetland and cropland area across the total study area, the value of nitrogen removal is $216.53 per hectare
(range of $216.53 to $433.06/hectare/year).
information on the risk of water contamination by phosphorus is not available at the provincial level for
ontario. however, the Canadian national average for excess phosphorus runoff from croplands is 14.3 kilograms
per hectare per year. using the national average, an estimated 320,836 kilograms of excess phosphorus may
run off croplands in the Rouge study area, including 20,067 kilograms from croplands in Rouge Park. Based on a
low-end estimate, the wetland area in the total study area has the capacity to absorb at least 290,381 kilograms
of phosphorus per year. Based on the above calculations and the low-end cost of phosphorus removal ($25.62/
61 Schuyt, K., and Brander, l. 2004. The Economic Values of the Worlds’ Wetlands. World Wildlife Fund and the institute for Environmental Studies, Vrije universiteit, Amsterdam, The Netherlands. http://awsassets.panda.org/downloads/wetlandsbrochurefinal.pdf The average value from a World Wildlife Fund global wetland study ($773) per hectare per year in u.S. dollars (2000$).
62 olewiler, N. 2004. The Value of Natural Capital in Settled Areas of Canada. ducks unlimited Canada and the Nature Conservancy of Canada
63 Calculated 413.5 hectares of wetlands in Rouge Park multiplied by the low-end estimates of removal rates of 80.3 kg/ha/year of phosphorus and 350 kg/ha/yr of nitrogen.
64 Wilson, S.J. 2008, supra note 57.65 olewiler, N. 2004, supra note 62.
wetlands across the
total study area have
an estimated capacity
to remove 290,381
kilograms of phosphorus
and 1.3 million kilograms
of nitrogen each year,
based on the low-end
removal rates.photo Courtesy friends of the rouge watershed

dav id s uzu ki fou n dation page 37
kg), the value of phosphorus removal provided by wetlands is $2,273.06 per hectare per year across the total
study area and $1,243.31 in Rouge Park, based on the costs of water treatment to remove excess phosphorus.
Therefore, the estimated annual total value for the waste treatment of nitrogen and phosphorus provided
by wetlands in Rouge Park is $563,089 per year, or $1,361.75 per hectare. in the total study area these
ecosystem services are worth an estimated $9 million per year or $2,489.59 per hectare, annually. All values
are reported in 2011 dollars.
Clean water: filtration services provided by forests & wetlands
Water pollution comes from point sources, such as industrial discharges and wastewater treatment plants,
and non-point sources, including run-off from agricultural lands and facilities, urban areas, construction sites,
and septic tanks. in the united States, it has been estimated that the economic damages to surface water from
sediment and nutrient run-off from croplands costs between $2.2 billion and $7 billion each year.66
Poor water quality degrades recreational areas and fish habitats, which affects human health by increasing
insect and waterborne diseases. it also leads to odour problems and diminished aesthetic values. Forests
and wetlands can reduce non-point source water pollution because they filter, store and transform pollutants
into non-harmful forms.
ontario’s drinking water comes from lakes, rivers, streams or underground sources like aquifers. All of
these drinking water sources are linked in watersheds or drainage basins by the ecosystems that capture,
filter and deliver water. The Walkerton inquiry recommended source protection as one of the most effective
and efficient means of protecting the safety of ontario’s drinking water.67
Forested watersheds are vital for a clean and regular supply of drinking water. Protected forests provide
higher quality water with less sediment and fewer pollutants than water from watersheds with unprotected
forests.68 A u.S. study concluded that the cost of treatment for surface water supplies varies depending on the
per cent forest cover in the water source area.69 They found that based on a survey of numerous cities across
the united States, there is a 20 per cent increase in water treatment costs for each 10 per cent loss in forest
cover. in other words, where forest cover is low in municipal watersheds, municipal water treatment costs more.
The ontario greenbelt study used this correlation to estimate the value of forest and wetland cover for
water quality benefits in terms of the potential increases in drinking water treatment costs if the combined
forest and wetland cover declined. The lake ontario watershed was used for the greenbelt study, which
includes this study area’s watersheds. The combined forest and wetland cover in the lake ontario watershed
was 30 per cent according to SolRiS 2000-2002 land cover data. Based on the 2007 cost for drinking water
treatment in the City of Toronto ($0.60 per cubic metre), water treatment costs were estimated to increase
to $0.94 per cubic metre if the overall forest and wetland cover declined from 30 per cent of land cover to
10 per cent within the lake ontario watershed. Based on this proxy, the greenbelt study reported that forest
66 lovejoy, S. B., J. g. lee, T. o. Randhir, and B. A. Engel. 1997. Research Needs for Water Quality Management in the 21st Century. Journal of Soil and Water Conservation. January-February 1997: 18-21.
67 ontario Ministry of the Environment. 2004. White Paper on Water on Watershed-based Source Protection Planning. integrated Environmental Planning division, Strategic Policy Branch. Ministry of the Environment. Queen’s Printer for ontario. www.waterprotection.ca/download/swp_background_whitepaper.pdf Accessed April 2012.
68 dudley, N. and Stolton, S. 2003. Running Pure: The importance of forest protected areas to drinking water. World Bank/WWF Alliance for Forest Conservation and Sustainable use. Washington d.C.
69 Ernst, C., gullick, R. and Nixon, K. 2007. “Protecting the Source: Conserving forest to protect water.” in The Economic Benefits of Land Conservation. The Trust for Public land. www.tpl.org.
ontario’s drinking water
comes from lakes, rivers,
streams or underground
sources like aquifers.
all of these drinking
water sources are
linked in watersheds or
drainage basins by the
ecosystems that capture,
filter and deliver water.photo Courtesy vlad aging aCCozzglia/fliCkr
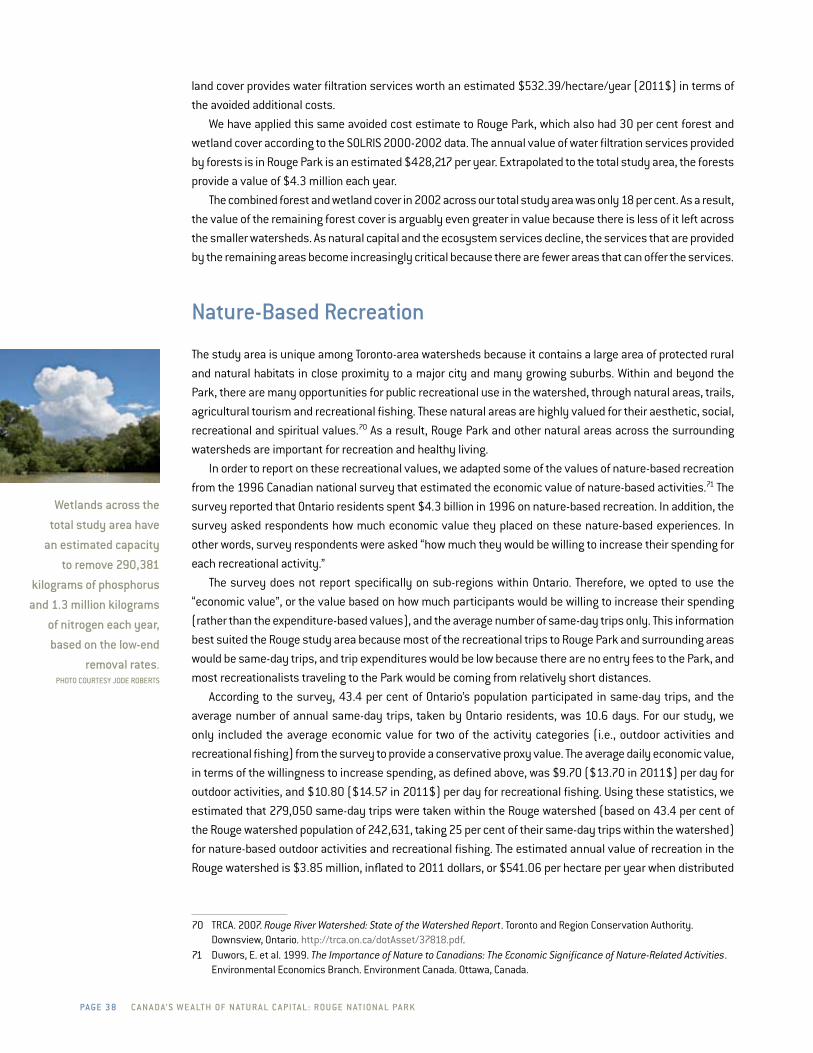
page 38 C a n a da’ s w e a lt h of n at u r a l C a pita l : rou ge n ation a l pa r k
land cover provides water filtration services worth an estimated $532.39/hectare/year (2011$) in terms of
the avoided additional costs.
We have applied this same avoided cost estimate to Rouge Park, which also had 30 per cent forest and
wetland cover according to the SolRiS 2000-2002 data. The annual value of water filtration services provided
by forests is in Rouge Park is an estimated $428,217 per year. Extrapolated to the total study area, the forests
provide a value of $4.3 million each year.
The combined forest and wetland cover in 2002 across our total study area was only 18 per cent. As a result,
the value of the remaining forest cover is arguably even greater in value because there is less of it left across
the smaller watersheds. As natural capital and the ecosystem services decline, the services that are provided
by the remaining areas become increasingly critical because there are fewer areas that can offer the services.
nature-Based recreation
The study area is unique among Toronto-area watersheds because it contains a large area of protected rural
and natural habitats in close proximity to a major city and many growing suburbs. Within and beyond the
Park, there are many opportunities for public recreational use in the watershed, through natural areas, trails,
agricultural tourism and recreational fishing. These natural areas are highly valued for their aesthetic, social,
recreational and spiritual values.70 As a result, Rouge Park and other natural areas across the surrounding
watersheds are important for recreation and healthy living.
in order to report on these recreational values, we adapted some of the values of nature-based recreation
from the 1996 Canadian national survey that estimated the economic value of nature-based activities.71 The
survey reported that ontario residents spent $4.3 billion in 1996 on nature-based recreation. in addition, the
survey asked respondents how much economic value they placed on these nature-based experiences. in
other words, survey respondents were asked “how much they would be willing to increase their spending for
each recreational activity.”
The survey does not report specifically on sub-regions within ontario. Therefore, we opted to use the
“economic value”, or the value based on how much participants would be willing to increase their spending
(rather than the expenditure-based values), and the average number of same-day trips only. This information
best suited the Rouge study area because most of the recreational trips to Rouge Park and surrounding areas
would be same-day trips, and trip expenditures would be low because there are no entry fees to the Park, and
most recreationalists traveling to the Park would be coming from relatively short distances.
According to the survey, 43.4 per cent of ontario’s population participated in same-day trips, and the
average number of annual same-day trips, taken by ontario residents, was 10.6 days. For our study, we
only included the average economic value for two of the activity categories (i.e., outdoor activities and
recreational fishing) from the survey to provide a conservative proxy value. The average daily economic value,
in terms of the willingness to increase spending, as defined above, was $9.70 ($13.70 in 2011$) per day for
outdoor activities, and $10.80 ($14.57 in 2011$) per day for recreational fishing. using these statistics, we
estimated that 279,050 same-day trips were taken within the Rouge watershed (based on 43.4 per cent of
the Rouge watershed population of 242,631, taking 25 per cent of their same-day trips within the watershed)
for nature-based outdoor activities and recreational fishing. The estimated annual value of recreation in the
Rouge watershed is $3.85 million, inflated to 2011 dollars, or $541.06 per hectare per year when distributed
70 TRCA. 2007. Rouge River Watershed: State of the Watershed Report. Toronto and Region Conservation Authority. downsview, ontario. http://trca.on.ca/dotAsset/37818.pdf.
71 duwors, E. et al. 1999. The Importance of Nature to Canadians: The Economic Significance of Nature-Related Activities. Environmental Economics Branch. Environment Canada. ottawa, Canada.
wetlands across the
total study area have
an estimated capacity
to remove 290,381
kilograms of phosphorus
and 1.3 million kilograms
of nitrogen each year,
based on the low-end
removal rates.photo Courtesy jode roBerts

dav id s uzu ki fou n dation page 39
amongst all natural cover (7,116 hectares; included forest, wetland, water, shoreline, hedgerows, plantations
and urban pervious areas).72
The annual recreational per hectare value for the Rouge watershed was extrapolated to the total study area’s
natural cover. As a result, the total recreational value provided by natural areas in the study is an estimated
$8.8 million annually (2011$) or $541 per hectare of natural area. The total recreational value within Rouge
Park is an estimated $1.2 million for the total natural cover area (2,210 hectares).
wildlife habitat: wetlands
Wetlands are well known for the important habitat they provide for many species, especially birds, amphibians
and reptiles. Most of ontario’s species at risk are located in the southern part of the province, which includes
our study area. For example, the southern ontario greenbelt is home to 72 species at risk, and provides habitat
for more than one-third of all of ontario’s species at risk.73
Forests, wetlands, grasslands, pastures, lakes, rivers and streams all provide important habitat types for
wildlife. Although, all these cover types provide habitat values, we were only able to provide a monetary value
for wetland habitat. The value for wetland habitat is an estimated $4,724.83 per hectare based on the average
annualized wetland habitat restoration costs for Rouge Watershed Wetland Creation Projects.74 The annualized
value of habitat restoration represents the value of wetland habitat in terms of the avoided costs associated with
degradation to, or loss of, habitat. This is particularly important for wetland habitat in southern ontario where
over 70 per cent of wetlands have been drained for other land use such as agriculture and urban development.75
Based on the estimated dollar value, the total value for wetland habitat is worth $1.9 million per year in
Rouge Park, and $17.1 million across the total study area.
72 Proxy value is based on the assumption that 50 per cent of trips were for outdoor activities and 50 per cent for recreational fishing, These values were adopted to represent the overall recreational value for the area, given the lack of information on the number of visitors to the Rouge Park and surrounding areas as well as the type of activities that recreationalists are participating in.
73 Biodiversity in ontario’s greenbelt. 2011. ontario Nature and the david Suzuki Foundation. Available at: www.davidsuzuki.org/publications/downloads/2011/REPoRT-gB_habitat-dec2011.pdf.
74 iJC Study Board. 2006. Valuating Wetland Benefits compared with Economic Benefits and losses. international lake ontario – St. lawrence River Study. www.losl.org/PdF/Wetland-Value-Paper-April-27-2006-e.pdf. Accessed June 2012.
75 ducks unlimited Canada. 2010. Southern ontario Wetland Conversion Analysis. ontario, Canada. www.ducks.ca/aboutduc/news/archives/prov2010/101012.html. Accessed July 2012.
wetlands are well
known for the
important habitat
they provide for many
species, especially
birds, amphibians
and reptiles. photo (song sparrow) Courtesy gary yankeCh/fliCkr
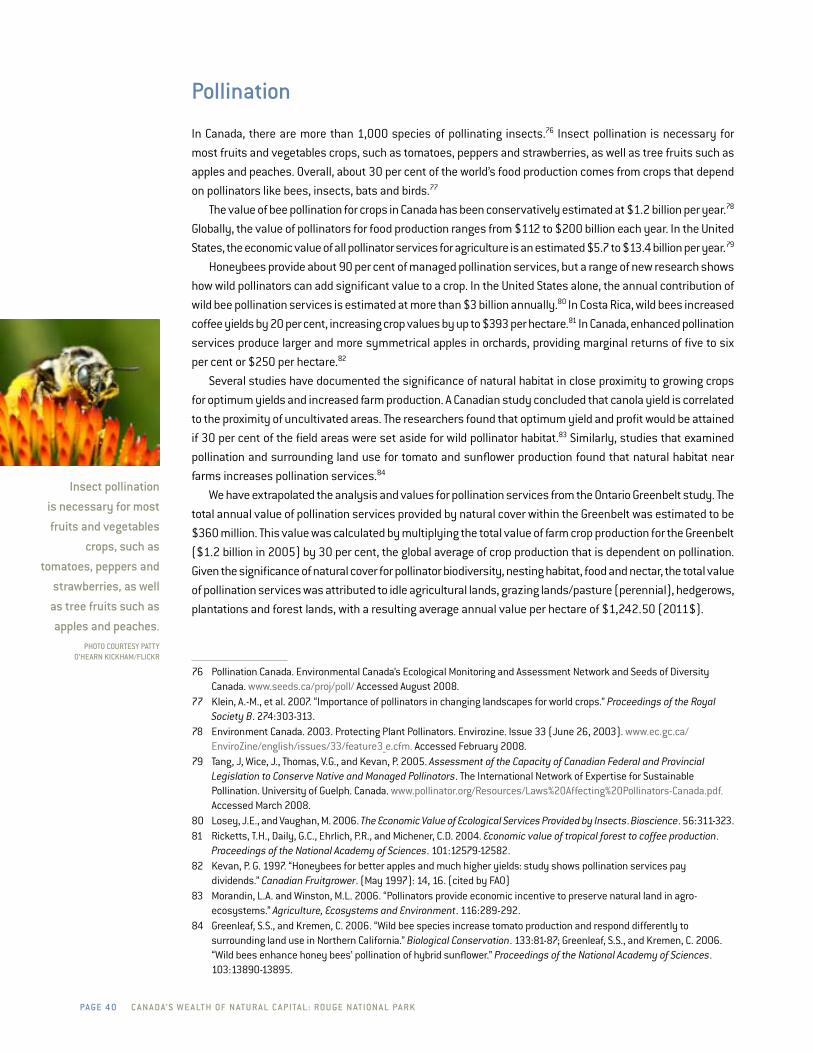
page 40 C a n a da’ s w e a lt h of n at u r a l C a pita l : rou ge n ation a l pa r k
pollination
in Canada, there are more than 1,000 species of pollinating insects.76 insect pollination is necessary for
most fruits and vegetables crops, such as tomatoes, peppers and strawberries, as well as tree fruits such as
apples and peaches. overall, about 30 per cent of the world’s food production comes from crops that depend
on pollinators like bees, insects, bats and birds.77
The value of bee pollination for crops in Canada has been conservatively estimated at $1.2 billion per year.78
globally, the value of pollinators for food production ranges from $112 to $200 billion each year. in the united
States, the economic value of all pollinator services for agriculture is an estimated $5.7 to $13.4 billion per year.79
honeybees provide about 90 per cent of managed pollination services, but a range of new research shows
how wild pollinators can add significant value to a crop. in the united States alone, the annual contribution of
wild bee pollination services is estimated at more than $3 billion annually.80 in Costa Rica, wild bees increased
coffee yields by 20 per cent, increasing crop values by up to $393 per hectare.81 in Canada, enhanced pollination
services produce larger and more symmetrical apples in orchards, providing marginal returns of five to six
per cent or $250 per hectare.82
Several studies have documented the significance of natural habitat in close proximity to growing crops
for optimum yields and increased farm production. A Canadian study concluded that canola yield is correlated
to the proximity of uncultivated areas. The researchers found that optimum yield and profit would be attained
if 30 per cent of the field areas were set aside for wild pollinator habitat.83 Similarly, studies that examined
pollination and surrounding land use for tomato and sunflower production found that natural habitat near
farms increases pollination services.84
We have extrapolated the analysis and values for pollination services from the ontario greenbelt study. The
total annual value of pollination services provided by natural cover within the greenbelt was estimated to be
$360 million. This value was calculated by multiplying the total value of farm crop production for the greenbelt
($1.2 billion in 2005) by 30 per cent, the global average of crop production that is dependent on pollination.
given the significance of natural cover for pollinator biodiversity, nesting habitat, food and nectar, the total value
of pollination services was attributed to idle agricultural lands, grazing lands/pasture (perennial), hedgerows,
plantations and forest lands, with a resulting average annual value per hectare of $1,242.50 (2011$).
76 Pollination Canada. Environmental Canada’s Ecological Monitoring and Assessment Network and Seeds of diversity Canada. www.seeds.ca/proj/poll/ Accessed August 2008.
77 Klein, A.-M., et al. 2007. “importance of pollinators in changing landscapes for world crops.” Proceedings of the Royal Society B. 274:303-313.
78 Environment Canada. 2003. Protecting Plant Pollinators. Envirozine. issue 33 (June 26, 2003). www.ec.gc.ca/EnviroZine/english/issues/33/feature3_e.cfm. Accessed February 2008.
79 Tang, J, Wice, J., Thomas, V.g., and Kevan, P. 2005. Assessment of the Capacity of Canadian Federal and Provincial Legislation to Conserve Native and Managed Pollinators. The international Network of Expertise for Sustainable Pollination. university of guelph. Canada. www.pollinator.org/Resources/laws%20Affecting%20Pollinators-Canada.pdf. Accessed March 2008.
80 losey, J.E., and Vaughan, M. 2006. The Economic Value of Ecological Services Provided by Insects. Bioscience. 56:311-323.81 Ricketts, T.h., daily, g.C., Ehrlich, P.R., and Michener, C.d. 2004. Economic value of tropical forest to coffee production.
Proceedings of the National Academy of Sciences. 101:12579-12582.82 Kevan, P. g. 1997. “honeybees for better apples and much higher yields: study shows pollination services pay
dividends.” Canadian Fruitgrower. (May 1997): 14, 16. (cited by FAo)83 Morandin, l.A. and Winston, M.l. 2006. “Pollinators provide economic incentive to preserve natural land in agro-
ecosystems.” Agriculture, Ecosystems and Environment. 116:289-292.84 greenleaf, S.S., and Kremen, C. 2006. “Wild bee species increase tomato production and respond differently to
surrounding land use in Northern California.” Biological Conservation. 133:81-87; greenleaf, S.S., and Kremen, C. 2006. “Wild bees enhance honey bees’ pollination of hybrid sunflower.” Proceedings of the National Academy of Sciences. 103:13890-13895.
insect pollination
is necessary for most
fruits and vegetables
crops, such as
tomatoes, peppers and
strawberries, as well
as tree fruits such as
apples and peaches.photo Courtesy patty
o’hearn kiCkham/fliCkr

dav id s uzu ki fou n dation page 41
in Rouge Park, the natural cover for pollinators (as defined above) totals 1,712 hectares, which provides
a value of $2.1 million per year in pollination services. in the total study area, the natural cover attributed for
pollinators is 22,666 hectares, providing pollination services worth $28.2 million.
Biological Control: Birds as pest Control
Studies show that birds provide valuable biological control services for farmlands and forests. it is estimated
that birds can eat up to 98 per cent of pest species, such as spruce budworms, cicadas and crickets.85 These
services have been valued at as much as $5,000 per year per square mile of forest. Farmers benefit from the
role birds play in helping to control agricultural pests.
A 1998 united States Forest Service study estimated the annual cost to replace the pest control services
provided by birds with chemical pesticides or genetic engineering at uS$7.34 per acre.86 We have transferred
this annual value at $36.48 per hectare in 2011 Canadian dollars, for forest cover, as well as other important
habitat for birds including plantations, perennial lands, idle land and hedgerows. Based on the annual value,
the total value provided by these cover types across the study area, in terms of biological control, is estimated
to be worth $826,839 annually; $62,437 per year within Rouge Park.87
85 Wenny, d.g., deVault, T.l. Johnson, M.d., Kelly, d., Sekercioglu, C.h., Tomback, d.F., Whelan, C.J. 2011. The Need to Quantify Ecosystem Services Provided by Birds. The Auk. 128: 1, pp. 1-14. www.jstor.org/stable/10.1525/auk.2011.10248.
86 Moskowitz, K. and Talberth, J. 1998. The Economic Case Against Logging our National Forests. Forest guardians. Santa Fe, New Mexico. Cited in: Krieger, d.J. 2001. Economic Value of Forest Ecosystem Services: A Review. The Wilderness Society. Washington, d.C. http://wilderness.org/files/Economic-Value-of-Forest-Ecosystem-Services.pdf.
87 includes forest, plantation, idle land, perennial cover and hedgerow area.
studies show that
birds provide valuable
biological control
services for farmlands
and forests. it is
estimated that birds can
eat up to 98 per cent
of pest species, such
as spruce budworms,
cicadas and crickets.photo (savannah sparrow) Courtesy gary yankeCh/fliCkr

page 4 2 C a n a da’ s w e a lt h of n at u r a l C a pita l : rou ge n ation a l pa r k
soil formation and erosion Control
Soil formation and erosion control are very important for maintaining the productivity of agricultural areas,
especially croplands. Erosion control is also a key ecosystem service provided by trees, plants and other
vegetation cover, because when vegetative cover is present soils have a protective layer that prevents soil
erosion. Soil erosion is a problem because losses in soil reduce productivity and contribute to increases in
sedimentation in streams, rivers and lakes. however, it is difficult to quantify the value of soil formation and
erosion control.
unfortunately, no valuation was possible for soil formation. in terms of erosion control, we have included
the value of erosion control for agricultural lands that have permanent cover in terms of the savings in water
treatment due to reduced sedimentation. This value was reported for the grand River Watershed in southern
ontario (average value of $5.60 in 2003 dollars).88 We transferred the average annual value at $6.55 per hectare
(2011$) for grazing land/pasture (perennial land) and idle agricultural lands. The total value for Rouge Park
was $5,537 each year, and the total value for the total study area was worth $83,125 per year.
Cultural value of farmlands
The aesthetic and cultural value of agricultural lands has traditionally included the draw of their visual at-
tractiveness. This value is reflected today in terms of property values, tourism values and weekend visits to
the countryside and its communities. The willingness to pay for farmland preservation has been examined
through studies that utilize surveys to determine what nearby residents will pay to protect farmland.
in the greenbelt study, assuming that a minimum of 10 per cent of the region’s households placed a
monetary value on farmland preservation, the cultural value of the greenbelt’s farmlands was estimated at
$138 per hectare per year (2005$). This value was based on a 1994 study that surveyed the willingness of
residents in Eastern Canada to pay for farmland preservation.89 This value was applied in 2011 dollars ($154.79
per hectare per year) to the croplands, perennial lands (grazing and pasture lands), idle agricultural lands
and hedgerows in this study area. The cultural value attributed to farmlands in the Rouge Park is estimated
at $355,981, and in the total study area, a value of $5.6 million
local food production
Agricultural lands in close proximity to cities and towns can provide local grown food that is fresh and full of
nutrients because it has not been shipped hundreds or thousands of kilometres. Preference for local food is
growing in Canada’s urban areas.
For this report, the value of local food production was estimated using a survey for residents within the
City of Abbotsford and Metro Vancouver in British Columbia. First, the survey reported the value of food
production in terms of the number of local farm visits by residents of Abbotsford. The survey determined
that local residents buy from local farms an average of 12 times per year and each round trip was on average
9.4 kilometres. The average travel cost per trip was estimated as $4.50, or $54.14 per year.90 in addition, a
survey of local farm stand owners reported that the average sale per customer visit was $20.83, an amount
88 olewiler, N. 2004. The Value of Natural Capital in Settled Areas of Canada. ducks unlimited Canada and the Nature Conservancy of Canada.
89 Bowker, J. Michael; didychuk, d.d. 1994, Estimation of nonmarket benefits of agricultural land retention in Eastern Canada. Agricultural and Resource Economics Review: 218-225.
90 ibid. Based on assumption that travel cost is $0.48/km.
the aesthetic
and cultural value of
agricultural lands has
traditionally included
the draw of their visual
attractiveness. this
value is reflected today
in terms of property
values, tourism values
and weekend visits to
the countryside and
its communities.photo Courtesy
reza vaziri/fliCkr

dav id s uzu ki fou n dation page 43
similar to an estimated per visit sales for farmers markets throughout the province of B.C.91 The survey also
asked Abbotsford residents how much more they were willing to pay for Abbotsford-grown corn rather than
California-grown corn. The average response was $0.91 per dozen cobs of corn (a 46 per cent premium over
corn from California).
Based on these findings, the value of local food production for the entire B.C. lower Mainland’s agricultural
lands were conservatively estimated to be worth $24 million each year. The total estimated travel costs were
estimated at $24 million per year, which equalled $382.48 per hectare when the total value was divided by
the total agricultural lands in the study area.
The majority of crops grown within the existing Rouge Park are cash crops such as corn, soy, and wheat,
with some hay fields.92 These fields currently do not provide a significant contribution to local food production
in terms of fresh produce to local residents. Croplands in the surrounding watersheds, including those in
Markham, would contribute to local food production. however, information on the value of local production
was not available for the study area.
market value of Croplands
The market value of crops grown in Rouge Park was not available, so we have estimated the value based on the
average farm receipts reported for croplands in the Town of Markham, the greater Toronto Area, and ontario.
The average gross farm receipts in 2006 were $1,272 per acre in Markham ($3,436.17 per hectare; 2011$),
$999 per acre in the gTA ($2,698.69 per hectare; 2011$), and $777 per acre across ontario ($2,098.98 per
hectare; 2011$); and, the average net revenue was $118 per acre in Markham ($318.77 per hectare; 2011$),
$136 per acre in the gTA ($367.39 per hectare; 2011$), and $113 per acre across ontario ($306.76 per hectare
(2011$).93 Because most of the crops currently grown in Rouge Park are cash crops, this report uses the lower
gross farm receipts and net revenue value, which is an average across ontario. These values converted to
2011 dollars are $2,098.98 and $306.76 per hectare, respectively.
91 2007. Public Amenity Benefits and Ecological Services Provided by Farmland to Local Communities in the Fraser Valley: A Case Study in Abbotsford, B.C. Strengthening Farming Report. File Number 800-100-1. British Columbia Ministry of Agriculture and lands. Victoria, B.C.
92 Personal communication. Vicki Macdonald. Biologist, Rouge Park. April 23, 2012.93 Planscape. 2009. The Town of Markham: A Recommended Strategy for Markham – Phase 3. Markham, ontario.
agricultural lands
in close proximity
to cities and towns
can provide local
grown food that
is fresh and full of
nutrients because
it has not been
shipped hundreds
or thousands
of kilometres.
preference for local
food is growing in
Canada’s urban areas.photo Courtesy vlad dgrieBeling/fliCkr

page 4 4 C a n a da’ s w e a lt h of n at u r a l C a pita l : rou ge n ation a l pa r k
summary tables of ecosystem service value by land Cover type
in the existing Rouge Park, the total value provided by ecosystem services is an estimated $10.4 million
annually, an average of $2,846 per hectare. The land cover types that provide the greatest total value are
forests at $4.1 million per year, followed by wetlands which provide $4 million per year and idle land which
provides $1.4 million per year. Wetlands provide the greatest value per hectare, worth an average of $9,651
per year (Table 6).
The cumulative ecosystem service value for the total study area (i.e., all three major watersheds) is
$115.6 million annually, an average each year of $2,247 per hectare. Forests provide the greatest value at
$41.2 million per year, wetlands provide an annual value of $34.9 million and idle agricultural lands provide
$18.2 million per year. Wetlands provide the greatest annual value worth, on average, $9,648 per hectare
(Table 7). The dollar value per hectare of each wetland varies depending on the type of wetland because of
varying amounts of soil carbon stored. Therefore, the average value per hectare is based on the total value
for all wetlands divided by the overall total area. The annual dollar value per hectare for each type of wetland
varies, ranging from $9,642 for swamps to $10,245 for fens per hectare.
The non-market ecosystem values provided by the designated additional federal lands for the proposed
National Rouge Park are worth an estimated $2.0 million, each year an average of $1,070 per hectare per year,
making the total value for the proposed Rouge National Park an estimated $12.5 million annually, an average
value of $2,239 per hectare (Table 8 on page 46).
pa rt 8
Summary of Ecosystem Service Valuations
the total value
for the proposed
rouge national park
is an estimated
$12.5 million annually,
an average value of
$2,239 per hectarephoto Courtesy
Bad alley/fliCkr

dav id s uzu ki fou n dation page 45
taBle 6: annual eCosystem serviCe value By land Cover type for rouge park (2011$)
land Cover Type Area (hectares)Value per hectare
($/ha/year)Total Value ($/year)
Forest 804.3 $5,149 $4,141,841
Plantations 11 $3,802 $40,804
Wetlands 414 $9,651* $3,990,727
Croplands 1,403 $378 $531,002
grazing land/Pasture 52 $1,728 $90,106
hedgerows 51 $3,110 $158,861
idle land 793 $1,728 $1,370,482
urban green Space 130 $785 $102,521
Water (Rivers) 6 $1,241 $6,839
Shoreline (Beach) 1.4 $541 $779
Total 3,666 $10,433,962
Average $/hectare $2,846
Notes: Total Area only includes land cover types reported in this table (excludes built-up impervious, extraction and transportation land use). This is the total area used to calculate the overall average dollar value per hectare for each study area.
*Wetland value per hectare is an average value calculated as the total value for all wetland types divided by the total wetland area. As a result, the average value for wetlands varies between the Rouge Park and the total study area.
taBle 7: annual eCosystem serviCe value By land Cover type for the total study area (rouge, pettiCoat and duffins watersheds, inCluding rouge park; 2011$)
land Cover Type Area (hectares)Value per hectare
($/ha/year)Total Value ($/year)
Forest 8,006 $5,149 $41,223,528
Plantations 1,039 $3,802 $3,951,193
Wetlands 3,616 $9,648* $34,889,234
Croplands 22,436 $378 $8,489,832
grazing land/Pasture 2,154 $1,728 $3,721,284
hedgerows 930 $3,110 $2,892,807
idle land 10,537 $1,728 $18,204,015
urban green Space 2,576 $787 $2,027,441
Water (Rivers Streams) 127 $1,241 $157,238
Shoreline (Beach) 1.7 $541 $901
Total 51,422 $115,557,474
Average $/hectare $2,247
Notes: Total Area only includes land cover types reported in this table (excludes built-up impervious, extraction and transportation land use). This is the total area used to calculate the overall average dollar value per hectare for the study area.
*Wetland value per hectare is an average value calculated as the total value for all wetland types divided by the total wetland area. As a result, the average value for wetlands varies between the Rouge Park and the total study area.
wetlands provide
the greatest value
per hectare, worth
an average of
$9,651 per year.photo (male ameriCan goldfinCh) Courtesy patty o’hearn kiCkham/fliCkr

page 4 6 C a n a da’ s w e a lt h of n at u r a l C a pita l : rou ge n ation a l pa r k
taBle 8: total annual eCosystem serviCe value By land Cover type for the proposed rouge national park (in 2011$)
land Cover TypeAdditional lands for National Park
(hectares)
Value per hectare ($/ha/year)
Total Value for Additional lands
($/year)
Total Value for Proposed Rouge
National Park ($/year)
Forest 71.4 $5,149 $367,1631 $4,509,471
Plantations 0.5 $3,802 $1,796 $42,601
Wetlands 36.4 $9,642* $350,599 $4,341,326
Croplands 1,373 $378 $519,678 $1,050,680
grazing land/Pasture 63 $1,728 $109,037 $199,143
hedgerows 54 $3,110 $168,728 $327,589
idle land 298 $1,728 $514,553 $1,885,034
urban green Space 10 $787 $7,898 $110,419
Water (Rivers) 0 $1,241 $0 $6,839
Shoreline (Beach) 0 $541 $0 $779
Total 1,907 $2,039,921 $12,473,882
Average $/hectare $1,070 $2,239
Note: Total Area only includes land cover types reported in this table (excludes built-up impervious, extraction and transportation land use). This is the total area used to calculate the overall average dollar value per hectare for the study area.
*Wetland value per hectare reported in this table is the value for swamps only because that is the only wetland type in the additional proposed lands for the National Park. however, the total wetland value for the total proposed National Park area reports the total value of all wetland types across this area, based on the respective dollar per hectare for each wetland type.

dav id s uzu ki fou n dation page 47
taBle 9: total annual value of eCosystem serviCes in rouge park, the proposed rouge national park, and the total study area (rouge, pettiCoat and duffins watersheds (in 2011$)
Ecosystem ServiceValue per hectare
($/ha/year)
Total Value ($/year)
Rouge Park Proposed
National Park Total
Study Area
Removal of Air Pollutants
$475
($237.50 for plantations/ hedgerows)
$396,736 $443,643 $4,270,303
Stored Carbon (annual value)
$223.61 – $919.68 $1,427,996 $1,919,301 $17,806,553
Annual Carbon uptake $18.71 – $56.21 $87,287 $108,233 $1,091,655
Wetland Flood Control $867.95 $358,902 $390,460 $3,138,681
Forest/green Space Water Flow Regulation
$22.41 – $709.47 $595,495 $665,783 $6,435,973
drinking Water (filtration) $236.99 – $699.54 $723,880 $787,436 $7,126,656
Erosion Control and Sediment Retention
$6.55 $5,537 $7,902 $83,125
Waste Treatment $27.22 – $2,489.59 $1,081,384 $1,185,634 $9,679,043
Pollination $1,242.50 $2,126,604 $2,731,773 $28,161,924
Seed dispersal (birds) $603 $491,369 $534,693 $5,452,692
Biological Control $36.48 $62,437 $80,205 $826,839
Wetland habitat $4,724.83 $1,953,739 $2,125,534 $17,085,912
Recreation $541.07 $766,614 $859,952 $8,816,867
Cultural $154.79 $355,981 $632,831 $5,581,251
Total $10,433,962 $12,473,882 $115,557,474
summary table of ecosystem services total values
Table 9 shows the total value for each ecosystem service for Rouge Park, the proposed National Park area,
and for the total study area (Rouge, duffins Creek and Petticoat Creek watersheds). The ecosystem services
with the greatest values are pollination worth $28.2 million per year, stored carbon worth $17.8 million per
year and wetland habitat worth $17.1 million.
the ecosystem services
with the greatest values
are pollination worth
$28.2 million per year,
stored carbon worth
$17.8 million per year
and wetland habitat
worth $17.1 million.photo Courtesy eskimo_jo/fliCkr
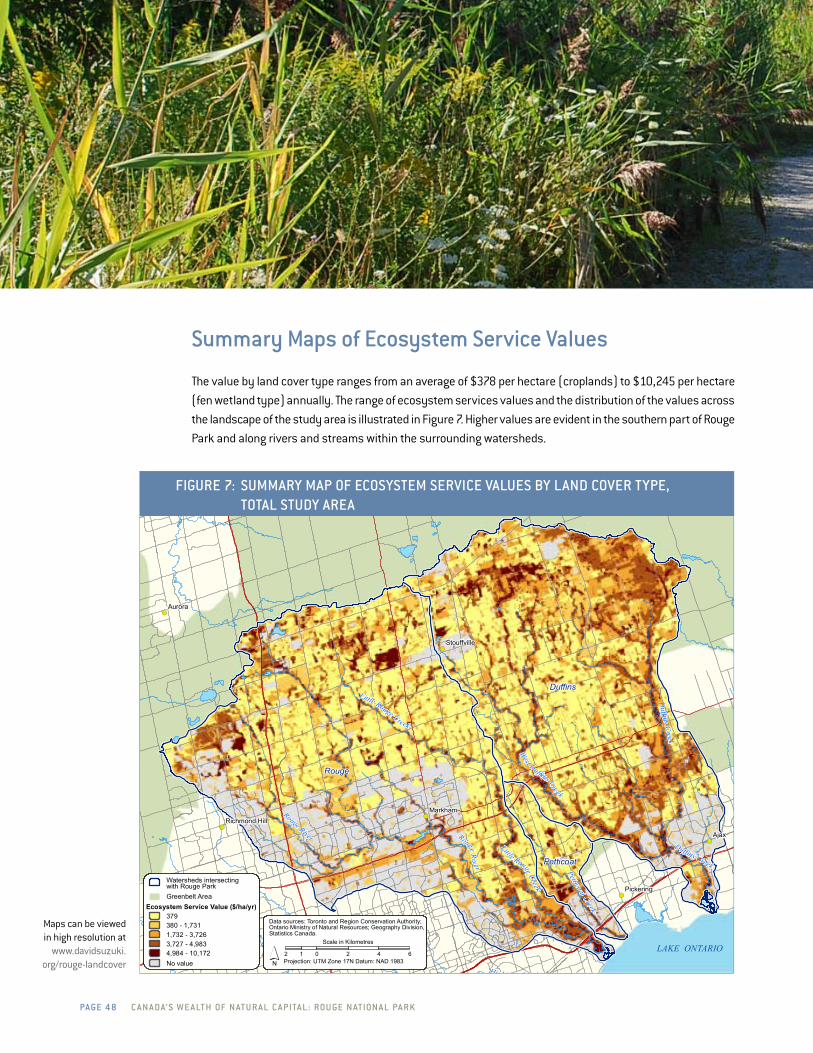
page 48 C a n a da’ s w e a lt h of n at u r a l C a pita l : rou ge n ation a l pa r k
!(
!(
!(
!(
!(
!(
!(
!(
!(
Highlan d Creek
Rouge River
West Duffins Creek
Petticoat Creek
Duffins Creek
Duffins Creek
Little Rouge Creek
Rouge River
Little Rouge Creek
Rouge
Duffins
Petticoat
Ajax
Aurora
Markham
Pickering
Stouffville
Richmond Hill
Watersheds intersecting with Rouge ParkGreenbelt Area
Ecosystem Service Value ($/ha/yr)379380 - 1,7311,732 - 3,7263,727 - 4,9834,984 - 10,172No value
LAKE ONTARIO2 0 2 4 61
Scale in Kilometres
´ Projection: UTM Zone 17N Datum: NAD 1983
Data sources: Toronto and Region Conservation Authority;Ontario Ministry of Natural Resources; Geography Division,Statistics Canada.
summary maps of ecosystem service values
The value by land cover type ranges from an average of $378 per hectare (croplands) to $10,245 per hectare
(fen wetland type) annually. The range of ecosystem services values and the distribution of the values across
the landscape of the study area is illustrated in Figure 7. higher values are evident in the southern part of Rouge
Park and along rivers and streams within the surrounding watersheds.
figure 7: summary map of eCosystem serviCe values By land Cover type, total study area
Maps can be viewed in high resolution at
www.davidsuzuki.org/rouge-landcover

dav id s uzu ki fou n dation page 49
!(
!(
!(
Highland Creek
Rouge River
West Duffins Creek
Petticoat Creek
Little Rouge Creek
Rouge River
Little Rouge Creek
UV48
UV7
UV407
UV401
Rouge
Duffins
Petticoat
Markham
Pickering
Watersheds intersecting with Rouge ParkBob Hunter Memorial ParkToronto ZooProposed Federal LandsGreenbelt Area
Ecosystem Service Value ($/ha/yr)1 - 379380 - 1,7311,732 - 3,7263,727 - 4,9834,984 - 9,642No value
Data sources: Toronto and Region Conservation Authority;Ontario Ministry of Natural Resources
1 0 1 2 3 4 5
Scale in Kilometres
´ Projection: UTM Zone 17N Datum: NAD 1983
Figure 8 illustrates the same range and distribution of ecosystem service values but only for the current
Rouge Park plus the designated federal lands for the proposed National Park. The greatest values are shown
along the Rouge River and within the southern part of the park where forest and wetland cover is greatest.
figure 8: summary map of eCosystem serviCe value By land Cover type, rouge park and additional lands for proposed national park
photo Courtesy tsar kasim/fliCkr
Maps can be viewed in high resolution at www.davidsuzuki.org/rouge-landcover
page 50 C a n a da’ s w e a lt h of n at u r a l C a pita l : rou ge n ation a l pa r k
importance of Conserving natural Capital in southern ontario
Natural capital and ecosystem services are in decline worldwide.94 The current and projected impacts of
population growth and climate change will place additional pressure on our ecosystems in terms of their
ability to supply regular services such as water for drinking supplies and irrigation for crops, flood control
and pollination. Communities with diminished natural capital and “green living infrastructure” will have more
difficulty adapting to a changing climate, making them more vulnerable to adverse and costly outcomes.
As a result, communities and governments are beginning to recognize the essential services that natural
areas provide. The recognition and valuation of ecosystem services are emerging trends at the global, national
and local level. For example, the united Nations Millennium Ecosystem Assessment reported on the condition
of the world’s ecosystems and their ability to provide services today and in the future.95 it found that over the
past 50 years humans have changed the earth’s ecosystems more rapidly and extensively than in any other
period in human history. The assessment concluded that approximately 60 per cent of the world’s ecosystem
services are being degraded or used unsustainably, including fresh water, air and water purification, and the
regulation of regional and local climate. The full costs of these losses are difficult to measure, but the report
concludes that they are substantial.96
one of the main reasons for ecosystem degradation is the exclusion of natural capital in our current
measures of progress and decision-making. in general, we measure progress and well-being using an economic
indicator – called gdP (gross domestic product) – as the primary marker of national or provincial performance.
The gdP measures what we buy and sell, or the market value of goods and services. Values not reflected in
market prices are considered externalities.97 For example, the value of a forest in controlling stream bank
94 Millennium Ecosystem Assessment. 2005. Ecosystems and Human Well-being: Synthesis. island Press. Washington, d.C.95 www.millenniumassessment.org/en/Condition.aspx96 Millennium Ecosystem Assessment, 2005, supra note 94..97 An externality is a value that is not reflected in that commodity’s market price.
pa rt 9
discussion
the recognition
and valuation of
ecosystem services
are emerging trends
at the global, national
and local level.photo (Cedar waxwing)
Courtesy pearl vas/fliCkr

dav id s uzu ki fou n dation page 51
erosion and sediment load in a river is not reflected in the market price of forested land. Nor is the value of a
swamp or marsh in recharging an aquifer reflected in the price of water. Therefore, cutting forests and converting
land for development result in a problematic scenario where timber is counted as monetary income without
accounting for losses in natural capital resulting from deforestation.
in most cases, we do not recognize the non-market value of natural capital until services become so
degraded or scarce that we have to pay to replace what had been previously provided for free. Similarly, the
costs of our impact on the environment, such as losses in ecosystem services from pollution, go unaccounted.
As a result, the way in which we measure and count our environmental, social and economic well-being is
currently misleading.
Natural capital and ecosystem service accounts provide resources that can inform decision making at all
jurisdictional levels, in regards to how policy and land use planning will affect economic and social well-being.
For example, such an account can provide an inventory of the ecosystem services provided by a forest as well
as its estimated value, such as the value of stormwater management, erosion control and carbon storage.
This information can be used to assess the impact of human communities such as land use change and the
effects of pollution.
importance of Conserving Carbon stored in ecosystems
Maintaining the integrity of natural ecosystems is important for conservation and for mitigating and adapting
to the impacts of climate change. As the earth’s climate continues to change, the conservation of natural
ecosystems will become even more vital. Their immense stores of carbon and for their provision habitat and
migration corridors for wildlife, marine and plant species. When a forest is converted to a housing development
or other built infrastructure, the disturbance of natural vegetation and soil results in the release of carbon
dioxide to the atmosphere. Consequently, protecting the carbon stores that exist in our natural ecosystems
will minimize the loss of ecosystem carbon.
ontario’s forests cover a vast area (712,200 km2) representing two per cent of the world’s forests and
therefore are important to the global carbon cycle.98
wetlands
Wetlands are one of the most productive, and yet threatened, ecosystems on the earth. Recent analysis by
ducks unlimited determined that there were over two million hectares of wetlands throughout southern ontario
in the early 1800s. By 2002, only 506,844 hectares remained – a loss of 72 per cent of the pre-settlement
wetlands. The decline in wetlands has been most dramatic in southwestern ontario, parts of eastern ontario,
Niagara and the Toronto area, where 85 per cent of the original wetlands have been converted for urban
development and agricultural lands.99 despite the important role that wetlands play in watersheds, the loss
in wetland cover in southern ontario has continued.100
ontario’s wetlands are vital natural assets that provide numerous ecological services while directly
supporting a range of economic benefits. Beyond providing habitat for plants and wildlife, wetlands enhance
98 Colombo, S.J., Chen, J. and Ter-Mikaelian, T. 2007. Carbon Storage in Ontario’s Forests, 2000-2100. Climate Change Research information Note. Note Number 6. ontario Ministy of Natural Resources. ontario, Canada.
99 ducks unlimited Canada. 2010. Southern Ontario Wetland Conversion Analysis. ducks unlimited Canada. Barrie, ontario. www.ducks.ca/aboutduc/news/archives/prov2010/pdf/duc_ontariowca.pdf.
100 Pattison, J.K., Yang, W., liu, Y., and gabor, S. 2011. A Business Case for Wetland Conservation: The Black River Subwatershed. ducks unlimited Canada and Environment Canada. www.ducks.ca/blackriver2011
maintaining the
integrity of natural
ecosystems is important
for conservation and
for mitigating and
adapting to the impacts
of climate change. photo (hairy Caterpillar) Courtesy gary yankeCh/fliCkr

page 52 C a n a da’ s w e a lt h of n at u r a l C a pita l : rou ge n ation a l pa r k
water quality, ground water recharge, flood and drought prevention and mitigate the impacts of climate change.
Wetlands also offer ecotourism opportunities and provide important social and cultural benefits.
There is support among southern ontario residents for wetland protection and restoration. A recent survey
for the Credit Valley found that 83 per cent of households in the watershed would be willing to pay for wetland
protection and restoration – between $229 and $259 per household each year over five years to support
wetland restoration and conservation efforts.101
agriculture in rouge park study area
Agriculture has been a part of the Rouge River area for over 200 years. Currently, agricultural land covers 59
per cent of the Park’s lands, rented to farmers on one-year leases from the Toronto Regional Conservation
Authority (TRCA). These short-term leases have prevented long-term investment in the maintenance of soil
quality and croplands because they do not provide the security farmers need to rationalize investing in farm
infrastructure, enhanced environmental practices and perennial crops that have longer growth cycles (e.g.,
orchards and vineyards).102 Therefore, innovative governance and economic mechanisms will be needed to
ensure sustainable farming practices that will enhance the natural capital of the Rouge. Rouge Park and TRCA
staff have initiated discussions with farm tenants regarding longer-term leases.
Two recent studies have undertaken surveys to assess the importance of farmland to nearby communities.
in 2007, residents in Abbotsford, British Columbia were surveyed about the value of benefits provided by
farmland in their community. This study estimated that benefits and ecological services were an estimated
$72,815 per hectare of farmland (not an annual value).103 it also benefits from industrial land use at $14,000,
and a value of $13,960 for residential lands, because residential land users received more services that the
benefits that they paid.
101 lantz, V., Boxall, P., Kennedy, M., and Wilson, J. 2010. Valuing Wetlands in Southern ontario’s Credit River Watershed: a Contingent Valuation Analysis. The Pembina institute. drayton Valley, Alberta. www.creditvalleyca.ca/wp-content/uploads/2011/01/ValuingWetlandsPhase2-final.pdf. Accessed April 2012.
102 StrategyCorp and hemson Consulting. 2010. governance, organization and Finance Review of the Rouge Park Alliance. Rouge Park Alliance. Toronto, Canada.
103 Public Amenity Benefits and Ecological Services Provided by Farmland to local Communities in the Fraser Valley: A Case Study in Abbotsford, B.C. 1997. Strengthening Farming Report. File Number 800.100-1. B.C. Ministry of Agriculture and lands. Victoria, B.C.
there is support
among southern
ontario residents for
wetland protection
and restoration. a
recent survey for the
Credit valley found
that 83 per cent of
households in the
watershed would
be willing to pay for
wetland protection
and restoration.photo Courtesy
tsar kasim/fliCkr
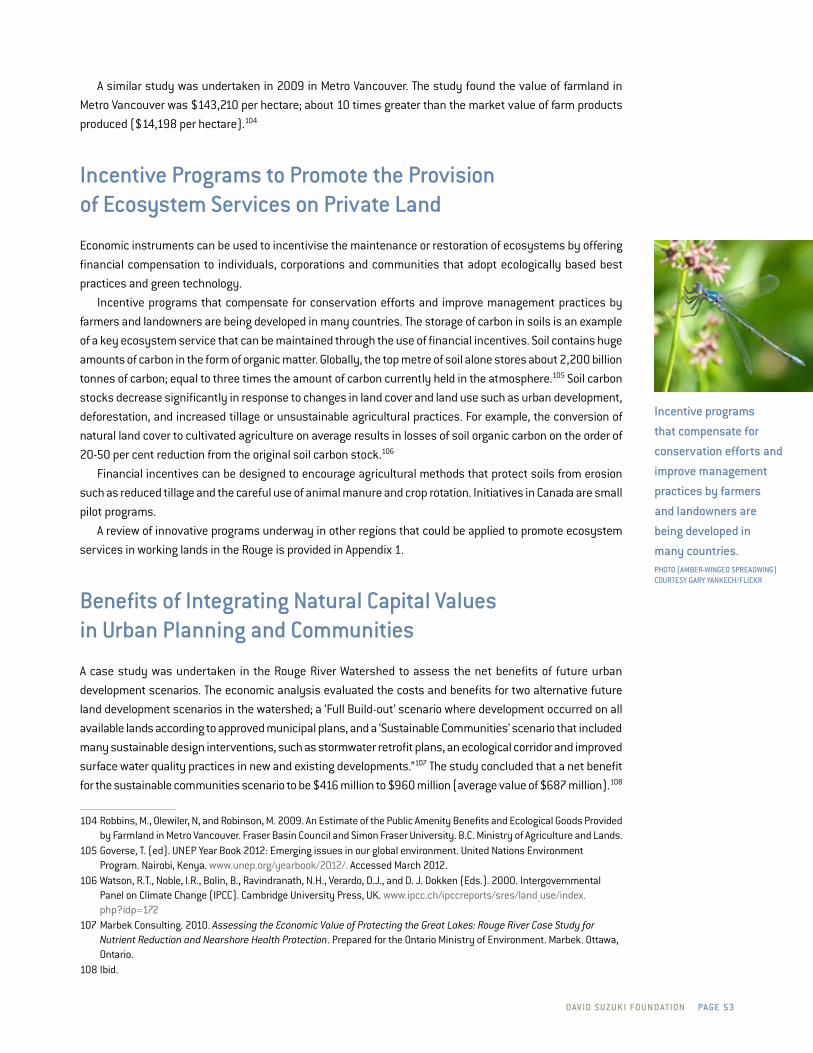
dav id s uzu ki fou n dation page 53
A similar study was undertaken in 2009 in Metro Vancouver. The study found the value of farmland in
Metro Vancouver was $143,210 per hectare; about 10 times greater than the market value of farm products
produced ($14,198 per hectare).104
incentive programs to promote the provision of ecosystem services on private land
Economic instruments can be used to incentivise the maintenance or restoration of ecosystems by offering
financial compensation to individuals, corporations and communities that adopt ecologically based best
practices and green technology.
incentive programs that compensate for conservation efforts and improve management practices by
farmers and landowners are being developed in many countries. The storage of carbon in soils is an example
of a key ecosystem service that can be maintained through the use of financial incentives. Soil contains huge
amounts of carbon in the form of organic matter. globally, the top metre of soil alone stores about 2,200 billion
tonnes of carbon; equal to three times the amount of carbon currently held in the atmosphere.105 Soil carbon
stocks decrease significantly in response to changes in land cover and land use such as urban development,
deforestation, and increased tillage or unsustainable agricultural practices. For example, the conversion of
natural land cover to cultivated agriculture on average results in losses of soil organic carbon on the order of
20-50 per cent reduction from the original soil carbon stock.106
Financial incentives can be designed to encourage agricultural methods that protect soils from erosion
such as reduced tillage and the careful use of animal manure and crop rotation. initiatives in Canada are small
pilot programs.
A review of innovative programs underway in other regions that could be applied to promote ecosystem
services in working lands in the Rouge is provided in Appendix 1.
Benefits of integrating natural Capital values in urban planning and Communities
A case study was undertaken in the Rouge River Watershed to assess the net benefits of future urban
development scenarios. The economic analysis evaluated the costs and benefits for two alternative future
land development scenarios in the watershed; a ‘Full Build-out’ scenario where development occurred on all
available lands according to approved municipal plans, and a ‘Sustainable Communities’ scenario that included
many sustainable design interventions, such as stormwater retrofit plans, an ecological corridor and improved
surface water quality practices in new and existing developments.”107 The study concluded that a net benefit
for the sustainable communities scenario to be $416 million to $960 million (average value of $687 million).108
104 Robbins, M., olewiler, N, and Robinson, M. 2009. An Estimate of the Public Amenity Benefits and Ecological goods Provided by Farmland in Metro Vancouver. Fraser Basin Council and Simon Fraser university. B.C. Ministry of Agriculture and lands.
105 goverse, T. (ed). uNEP Year Book 2012: Emerging issues in our global environment. united Nations Environment Program. Nairobi, Kenya. www.unep.org/yearbook/2012/. Accessed March 2012.
106 Watson, R.T., Noble, i.R., Bolin, B., Ravindranath, N.h., Verardo, d.J., and d. J. dokken (Eds.). 2000. intergovernmental Panel on Climate Change (iPCC). Cambridge university Press, uK. www.ipcc.ch/ipccreports/sres/land_use/index.php?idp=172
107 Marbek Consulting. 2010. Assessing the Economic Value of Protecting the Great Lakes: Rouge River Case Study for Nutrient Reduction and Nearshore Health Protection. Prepared for the ontario Ministry of Environment. Marbek. ottawa, ontario.
108 ibid.
incentive programs
that compensate for
conservation efforts and
improve management
practices by farmers
and landowners are
being developed in
many countries. photo (amBer-winged spreadwing) Courtesy gary yankeCh/fliCkr
page 54 C a n a da’ s w e a lt h of n at u r a l C a pita l : rou ge n ation a l pa r k
Conclusions
pa rt 10
ConclusionsThe Rouge and its surrounding watersheds provide essential ecosystem services and economic benefits for
residents throughout the greater Toronto Area. This report conservatively estimates that these services provide
an economic value of at least $115.6 million each year. The future Rouge National Park, including lands within
the existing Rouge Park, is the ecological engine of the region and provides at least $12.5 million annually in
non-market economic benefits for residents.
These findings demonstrate that despite decades of sprawling development in the greater Toronto Area, the
Rouge and its surrounding watersheds have remarkably remained a vital ecological – and economic – resource
that offers vast benefits each year that contribute to the health and well-being of the region’s communities.
This stock of natural capital cleans the air, filters the water, cools nearby communities and provides a critical
natural corridor from the oak Ridges Moraine to the shores of lake ontario.
By establishing Rouge National Park, the federal government, and the many local stakeholders and Rouge
champions, are effectively protecting a bank of natural capital that will benefit communities now and for
generations to come. While protecting, restoring and managing such a wild gem on the edge of one of North
America’s fastest growing urban areas is likely to cost tens of millions, these costs should be weighed against
the value of economic and ecological benefits highlighted in this report. Even without consideration of the Park’s
market and health benefits, the future Rouge National Park will undoubtedly pay huge dividends.
this report
conservatively
estimates that
the rouge and
its surrounding
watersheds provide
services of an
economic value
of at least $115.6
million each year.
dav id s uzu ki fou n dation page 55
Recommendations
pa rt 11
RecommendationsWhile this valuation is an important first step in assessing the value of the Rouge area, there is much work
still to be done. To ensure the Rouge’s ecological health and economic value is maintained in the long term as
a National Park, there are several legal, policy and management efforts that should be undertaken.
governance and management
1. given the significant economic and ecological values of the Rouge and its surrounding watersheds,
the Federal government should work quickly to establish Rouge National Park under legislation.
2. The legislation and management plans governing Rouge National Park must:
a) give priority to the protection and restoration of ecological health and water quality;
b) ensure that existing and new development activities that impact natural capital, such as infrastructure (e.g., pipelines, roads), are minimized and managed to the highest standards of sustainability;
c) mandate the achievement of a “net gain” in natural capital (e.g., biodiversity) as a result of any activity that degrades the ecological health of the Park;109
d) ensure that resource extraction in the Park is prohibited; and
e) ensure that First Nations are fully involved with the establishment and management of the new National Park.
109 A potential template could be the ‘overall benefit’ clause in ontario’s Endangered Species Act. ESA, s. 17.2.c.i., a permit may be granted if, among other criteria, “the Minister is of the opinion that an overall benefit to the species will be achieved within a reasonable time through requirements imposed by conditions of the permit”.
while this valuation
is an important first
step in assessing the
value of the rouge
area, there is much
work still to be done.photo Courtesy hanadi traifeh/fliCkr

page 56 C a n a da’ s w e a lt h of n at u r a l C a pita l : rou ge n ation a l pa r k
3. The close interrelationships between First Nations peoples and the lands and waters of Rouge
National Park and surrounding areas must be recognized. First Nations must be engaged and
recognized throughout the process as keepers of traditional botanical and ecological knowledge,
included in public education and interpretive programming.
4. Parks Canada should work collaboratively with the Province, municipalities and regional conservation
authorities to protect natural capital outside of the new National Park through the establishment
of special management zones (i.e., protected buffers and connected corridors contiguous to the
park), expanding the surrounding greenbelt to protect vulnerable farmland, and identifying and
protecting sensitive hydrological and natural heritage features within the surrounding Rouge River,
Petticoat Creek and duffins Creek watersheds.
stewardship
5. Programs and incentives that support farm and land stewardship should be made available to
farmers to support local food production and promote sustainable agricultural practices that restore
and enhance ecosystem services (e.g. carbon storage, habitat for pollinators) in the new Rouge
National Park and surrounding lands. Examples of innovative programs that could be applied in the
Rouge (e.g., the AluS program in ontario) are presented in Appendix 1.
6. Municipalities, regional conservation authorities and other agencies should continue to support
conservation and ecological restoration programs (e.g., tree planting, invasive species removal)
to expedite recovery of wetlands, forests, rivers and other elements of natural capital within the
new National Park and its surrounding watersheds.
monitoring
7. Programs should be established to identify, measure and monitor natural capital (e.g., wildlife
habitat) in the new Rouge National Park and its primary watersheds on a regular basis.
8. detailed land cover data for the new Rouge National Park and its primary watersheds should be
updated on an annual basis.
9. The results of monitoring programs should be reported to the public and monitoring data should be
made publicly available.
education and public awareness
10. it is important that all levels of government, as well as regional conservation authorities and
non-governmental organizations, continue to fund and deliver public education programs that build
awareness of natural capital and its role in providing clean air, clean water, healthy food and wildlife
protection.
it is important that
all levels of government,
as well as regional
conservation authorities
and non-governmental
organizations, continue
to fund and deliver
public education
programs that build
awareness of natural
capital and its role in
providing clean air, clean
water, healthy food and
wildlife protection.photo (tree swallow)
Courtesy gary yankeCh/fliCkr

dav id s uzu ki fou n dation page 57
ecological gifts program (federal)
The Ecological gifts federal program encourages individual and corporate landowners to protect nature in
perpetuity by donating ecologically sensitive lands or a partial interest in their lands (i.e., through land transfer,
conservation easements, covenants or servitudes) to environmental charities or government bodies.110 donors
can receive income tax benefits in return. The financing mechanism is a tax credit or deduction to donors and
a reduction in the taxable capital gain realized on the disposition of the property. Corporate donors may deduct
the amount of their gift directly from their taxable income, while the value of an individual’s gift is converted
to a non-refundable tax credit.
intergenerational Capital gains exemption and rollovers for transfers of Commercial farms/woodlots (federal)
This federal program allows for the exemption and/or deferment of the capital gains tax on the transfer of
woodlots from one generation to another.111 Before the establishment of this incentive, the burden of the
inheritance tax would result in the new owners paying the capital gains by harvesting the timber on the woodlot.
This tax therefore had been a perverse incentive, encouraging landowners to harvest.
managed forest tax incentive program (ontario)
This provincial program encourages landowners, who own four hectares or more of forest, to carry out specific
management activities and to prepare and follow a Managed Forest Plan for their property.112 Management
activities approved under this program include: tree planting or harvesting; recreational activities; wildlife
management involving habitat work or participating in monitoring programs; protecting environmentally
sensitive areas; and education. under this program the property is reassessed and classified as a Managed
Forest, and is eligible for a tax reduction at 25 per cent of the municipal tax rate set for residential properties. A
Five-Year Progress Report must be submitted in the fifth year of the agreement, and Ministry audits including
field visits can take place at any time.
110 Ecological gifts Program. Environment Canada. government of Canada. www.ec.gc.ca/pde-egp/111 www.omafra.gov.on.ca/english/busdev/facts/09-015.htm112 www.mnr.gov.on.ca/en/Business/Forests/Publication/MNR_E000245P.html
a ppe n dix 1
economic incentive programs to restore and enhance the supply of ecosystem services on agricultural lands and woodlots in Canada

page 58 C a n a da’ s w e a lt h of n at u r a l C a pita l : rou ge n ation a l pa r k
alternative land use services (alus)
The AluS concept recognizes that farmers and ranchers can play an important role in producing benefits to
Canadians through land stewardship practises. The program builds on the stewardship ethic by recognizing
that farmers are in a unique position to restore and enhance nature’s benefits to society.
AluS supports the conservation, restoration, and management of native habitat on working farms and
ranches by providing project start up assistance, technical expertise and support, and incentive payments.
The AluS concept is a “fee for service” proposal that recognizes and rewards farmers and ranchers for the
role they play in creating healthy, sustainable landscapes vital to healthy human populations. AluS sees the
production of agricultural crops and livestock as compatible with the production of nature’s benefits; and seeks
to assist farmers and ranchers in continuing to employ land management practises that create productive
agricultural systems and healthy rural landscapes.
alternative land use (prince edward island)
The P.E.i. AluS (Alternative land use Services) program was designed to protect or restore the provision of
ecosystem goods and services such as the purification of water by wetlands; the filtering of soil and other
contaminates from run-off entering watercourses by riparian ecosystems; and the provision of fish and wildlife
habitat by forests and rivers. in this program, financial compensation can be obtained for actions taken to
reduce levels of soil erosion, stream siltation, or improve water quality and enhance wildlife habitat. These
activities include: retiring sensitive land, taking land out of production, and maintaining livestock fences
adjacent to water courses and wetlands. Payment is through annual compensation/payments that are subject
to audits to verify compliance.113
alternative land use (alberta)
The AluS (Alternative land use Services) program in Alberta pays producers/farmers to provide ecosystem
services such as clean air, water and wildlife from their land. The program’s goal is to protect and restore
wetlands, create buffers along creeks and waterways to improve water quality and enhance fish habitat,
plant native grasses around wetlands and uplands for bird-nesting habitat, re-introduce flowering plants for
native pollinators, and improve habitat for grouse and other species along shelterbelts, and in restored, natural
areas.114 Providers include farmers, ranchers and hunters. Buyers and brokers include governments, farming
and ranching organizations, conservation groups and others. Among the current partners of the program are:
the Alberta Conservation Association, Alberta Sustainable Resource development, County of Vermilion River,
Cows and Fish, delta Waterfowl, and Wildlife habitat Canada.
norfolk alternative land use (ontario)
The Norfolk AluS (Alternative land use Services) Pilot Project in ontario is a voluntary, incentive-based project
testing the concept of providing payments to farmers for returning marginal, environmentally sensitive or
inefficient farmland to native vegetative cover and wetlands.115 Norfolk AluS supports the conservation,
restoration and management of native habitat on working farms and ranches by providing project start-up
assistance, technical expertise and support, and incentive payments. The program provides a “fee for service”
that recognizes and rewards farmers and ranchers for the changes they make in land use and practices.
113 www.gov.pe.ca/growingforward/AluS114 www.deltawaterfowl.org/media/pr/2010/100120-AluSCanada.php115 www.norfolkalus.com/index.php?option=com_content&view=article&id=9&itemid=2

dav id s uzu ki fou n dation page 59
Conservation land tax incentive program (ontario)
This program encourages the protection of ontario’s provincially significant conservation lands as determined
by the ontario Ministry of Natural Resources by providing property tax relief to landowners who agree to carry
out specific activities to conserve the natural heritage values of their properties.116 landowners participating in
this program retain full ownership and property rights. The financing mechanism is a 100 per cent tax-exemption
on the eligible portion of the property.
habitat Conservation through Conservation easements (ducks unlimited Canada)
This program focuses on wetland rehabilitation and wetland protection through land conservation ease-
ments, donations or purchase.117 The government or a conservation organization can purchase conservation
easements. landowners can receive tax benefits if the conservation easement is donated to a qualified
conservation organization.
riparian tax Credit (manitoba)
This program recognizes farm operators who take actions to upgrade their management of lakeshores and
river and stream banks (mostly to prevent soil erosion and to improve water quality). Agricultural and livestock
producers across Manitoba who have a lake or waterway running through their property and who voluntarily
commit to protect a strip of agricultural land along a waterway (i.e., riparian land) can receive a credit for a
five-year commitment period.118
landowners must commit, on former grazing land, to:
i) set up a livestock exclusion zone 100 feet wide along each side of the lake or waterway;
ii) maintain permanent fencing to separate grazing livestock from land in the exclusion zone; and,
iii) use the livestock exclusion zone only for haying.
Payments and tax reductions include the following:
• Former cropland that is no longer cultivated, but that is maintained with native and tame forage,
bushes and trees: $20 annually for five years, for a total of $100 per riparian acre.
• Former grazing land used only for haying: $20 annually for five years, for a total of $100 per riparian
acre.
• Former grazing land with no agricultural activity: $28 annually for five years, for a total of $140 per
riparian acre.
• The basic tax reduction is paid on acreage within the 100-foot strip along the waterway. The basic
tax reduction yearly amount cannot exceed 120% of the 2010 property taxes on your farm property.
116 www.mnr.gov.on.ca/en/Business/ClTiP/index.html117 www.ducks.ca/aboutduc/how/conserve.html118 www.gov.mb.ca/finance/tao/pdf/riparian/info_for_taxpayers.pdf
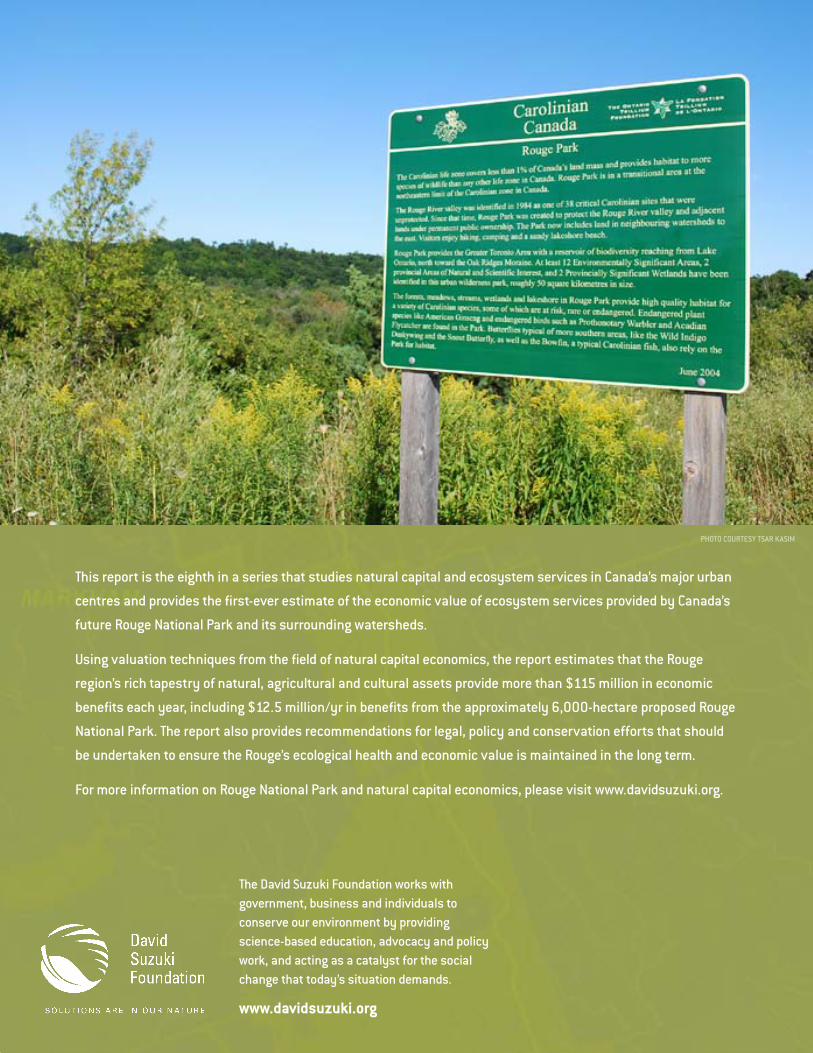
the david suzuki foundation works with government, business and individuals to conserve our environment by providing science-based education, advocacy and policy work, and acting as a catalyst for the social change that today’s situation demands.
www.davidsuzuki.org
this report is the eighth in a series that studies natural capital and ecosystem services in Canada’s major urban
centres and provides the first-ever estimate of the economic value of ecosystem services provided by Canada’s
future rouge national park and its surrounding watersheds.
using valuation techniques from the field of natural capital economics, the report estimates that the rouge
region’s rich tapestry of natural, agricultural and cultural assets provide more than $115 million in economic
benefits each year, including $12.5 million/yr in benefits from the approximately 6,000-hectare proposed rouge
national park. the report also provides recommendations for legal, policy and conservation efforts that should
be undertaken to ensure the rouge’s ecological health and economic value is maintained in the long term.
for more information on rouge national park and natural capital economics, please visit www.davidsuzuki.org.
photo Courtesy tsar kasim