canada: selected issues paper
TRANSCRIPT
© 2011 International Monetary Fund December 2011 IMF Country Report No. 11/365
Januaryxdfg 29, 2001 January 29, 2001 January 29, 2001 January 29, 2001 January 29, 2001
Canada: Selected Issues Paper This selected issues paper on Canada was prepared by a staff team of the International Monetary Fund as background documentation for the periodic consultation with the member country. It is based on the information available at the time it was completed on December 6, 2011. The views expressed in this document are those of the staff team and do not necessarily reflect the views of the government of Canada or the Executive Board of the IMF. The policy of publication of staff reports and other documents by the IMF allows for the deletion of market-sensitive information.
Copies of this report are available to the public from
International Monetary Fund Publication Services 700 19th Street, N.W. Washington, D.C. 20431
Telephone: (202) 623-7430 Telefax: (202) 623-7201 E-mail: [email protected] Internet: http://www.imf.org
Price: $18.00 a copy
International Monetary Fund
Washington, D.C.

INTERNATIONAL MONETARY FUND
CANADA
Selected Issues
Prepared by Oya Celasun, Jihad Dagher, Paulo Medas, Gian Maria Milesi-Ferretti (all WHD), Alejo Costa (MCM), and Guilhem Blondy (FAD)
Approved by Western Hemisphere Department
December 5, 2011
Contents Page
I. House Prices and Household Wealth in Canada ............................................................3 A. Introduction ...............................................................................................................3 B. The Evolution of House Prices ..................................................................................7 C. Housing Wealth and Consumption .........................................................................10 D. Conclusion ..............................................................................................................11
References ...................................................................................................................12 II. The Role of the CMHC in the Canadian Mortgage Market ........................................15 A. Introduction ............................................................................................................15 B. Overview of the Mortgage Market .........................................................................15 C. The Role of CMHC ................................................................................................17 III. Dynamics and Composition of Gross and Net Government Debt ..............................20 A. Introduction ............................................................................................................20 B. General Government Gross and Net Debt in Canada ............................................20 C. Federal Government ...............................................................................................23 D. Provinces and Local Governments ........................................................................25 IV. Bilateral Financial Linkages in an International Perspective .....................................28 A. Introduction ............................................................................................................28 B. Canada’s External Position ....................................................................................28 C. Bilateral Claims and Liabilities ..............................................................................34 D. Cross-Border Activity of Canadian Banks: A Consolidated Perspective ..............37 E. Conclusions ............................................................................................................39 References ...................................................................................................................41

2
Tables I.1. Estimates of House Price Equations .............................................................................9 III.1. Gross Debt Dynamics, 2007–2010 .............................................................................21 IV.1. International Financial Integration and Net External Position, 2010 .........................30 IV.2. Share of Foreign Portfolio Investment in Total Financial Assets ...............................34 IV.3. Consolidated Claims of Canadian Banks by Nationality, 2007Q2 and 2011Q1 ........38 IV.4. Foreign Claims of Canadian Banks by Sector of Borrower .......................................40 Figures I.1. Homeownership, Household Debt, Owners’ Equity, and House Prices ........................4 I.2a. Household Assets in Advanced Economies ..................................................................5 I.2b. Household Liabilities in Advanced Economies .............................................................6 I.3. House Prices in Canada, Its Major Provinces, and Major Metropolitan Areas ............7 II.1 Overview of the Mortgage Market .............................................................................16 III.1. Gross and Net Debt of the Federal Government .........................................................24 III.2. Provinces and Local Governments: Gross and Net Debt ............................................27 IV.1. Cross-Border Bank Assets and Liabilities by Residence of the Reporting Entity, June 2011 ....................................................................................................................30 IV.2. International Bank Assets and Liabilities by Nationality of the Reporting Bank, June 2011 ....................................................................................................................31 IV.3. Foreign Claims of Selected Banking Systems, by Nationality of the Reporting Bank, Ultimate Risk and Immediate Borrower Basis, June 2011 ...............................31 IV.4. Composition of External Assets and Liabilities ..........................................................33 IV.5. External Assets and Liabilities, Bilateral Basis, 2010 ................................................36 IV.6. Net External Position, Bilateral Basis, 2010 ...............................................................37 Boxes II.1 Mortgage Regulations (as of April 18, 2011) .............................................................19 Appendices I.1. Data Sources and Estimation Method ..........................................................................13 IV.1. Data Sources and Estimation Methods for Bilateral Claims and Liabilities ..............42
3
I. HOUSE PRICES AND HOUSEHOLD WEALTH IN CANADA1 Like many other advanced economies, Canada experienced an upswing in household debt and house prices in the 2000s. Our estimates suggest that house prices are higher than levels consistent with current fundamentals in some provinces. We study the impact of a potential correction in house prices on consumption through household wealth effects. Our empirical estimates suggest that a ten percent decline in house prices would lead to a 1¼ percent decline in private consumption.
A. Introduction
1. Like many other advanced economies, Canada experienced an upswing in household debt and house prices in the 2000s (Figures 1 and 2). The household sector’s debt-to-income ratio climbed to historic highs, reflecting in part a marked increase in homeownership. The increase in household debt was moderate in comparison to many other industrialized countries in the decade preceding the 2008–09 crisis, but in contrast to the sustained price corrections in most other countries, house prices resumed their upward trend by mid-2009 in most Canadian provinces. The growth of household debt has outpaced households’ real estate assets since 2007, but the Canadian household sector as a whole still has a comfortable level of net housing equity at current prices.
2. The high level of household leverage and house prices could prove to be a source of vulnerability. The rebound in debt and house prices after the crisis largely reflects the resilience of the financial system and the stronger economic recovery in Canada, as well as historically low interest rates. However, further increases in leverage could set the stage for a large correction down the road, triggered for instance by an adverse external shock. Against this backdrop, this paper examines regional house prices relative to their equilibrium levels and the sensitivity of consumption to housing wealth in Canada.
1 Prepared by Oya Celasun, Alejo Costa, and Jihad Dagher.

4
Figure 1. Homeownership, Household Debt, Owners' Equity, and House Prices
-20
-10
0
10
20
30
40
50
60
70
80
-20
-10
0
10
20
30
40
50
60
70
80
Ger
man
y
Jap
an
Sw
itze
rlan
d
Au
stri
a
Bel
giu
m
Fra
nce
Ital
y
Can
ada
No
rway
Un
ited
Sta
tes
Fin
lan
d
Sw
eden
Un
ited
Kin
gd
om
Po
rtu
gal
Au
stra
lia
Gre
ece
Sp
ain
Net
her
lan
ds
Den
mar
k
Irel
and
(200
1-09
)
Increases in Household Debt, 1999-2009(Percent of GDP)
0
2
4
6
8
10
12
14
62
63
64
65
66
67
68
69
70
71
72
1991Q1 1995Q1 1999Q1 2003Q1 2007Q1 2011Q1
Owner's Equity, left
Residential Assets Growth, rightMortgage Debt Growth, right
Equity, Asset, and Debt Growth(Percent of residential assets and percentage growth from one year ago)
55
65
75
55
65
75
1970 1975 1980 1985 1990 1995 2000 2005 2010
U.S.
Canada
Canada and United States Homeownership Rates(Percent of occupied units)
Estimate
-40
-20
0
20
40
60
80
100
-40
-20
0
20
40
60
80
100
Ger
man
y
Jap
an
Sw
itze
rlan
d
Au
stri
a
Bel
giu
m
Fra
nce
Ital
y
Can
ada
No
rway
Un
ited
Sta
tes
Fin
lan
d
Sw
eden
Un
ited
Kin
gd
om
Po
rtu
gal
Au
stra
lia
Gre
ece
Sp
ain
Net
her
lan
ds
Den
mar
k
Irel
and
2000-07
2000-10
House Prices in Advanced Economies, 2000-07 & 2000-10(Y/Y percent change in CPI-deflated national house price indices)
Sources: Bank for International Settlements; Canadian Real Estate Association: Global Property Guide; Eurostat; Haver Analytics; National Bank Financial; OECD; Statistics Canada: Census 2006, and Fund staff calculations.

5
Figure 2a. Household Assets in Advanced Economies
200
300
400
500
600
700
200
300
400
500
600
700
1999 2001 2003 2005 2007 2009
Canada(Percent of disposable income)
Non-financial assets
Financial assets
200
300
400
500
600
700
200
300
400
500
600
700
1999 2001 2003 2005 2007 2009
Non-financial assets
Financial assets
France(Percent of disposable income)
200
300
400
500
600
700
200
300
400
500
600
700
1999 2001 2003 2005 2007 2009
Non-financial assets
Financial assets
Germany(Percent of disposable income)
200
300
400
500
600
700
200
300
400
500
600
700
1999 2001 2003 2005 2007 2009
Non-financial assets
Financial assets
Italy(Percent of disposable income)
200
300
400
500
600
700
200
300
400
500
600
700
1999 2001 2003 2005 2007 2009
Non-financial assets
Financial assets
Japan(Percent of disposable income)
200
300
400
500
600
700
200
300
400
500
600
700
1999 2001 2003 2005 2007 2009
Non-financial assets
Financial assets
United Kingdom(Percent of disposable income)
200
300
400
500
600
700
200
300
400
500
600
700
1999 2001 2003 2005 2007 2009
Non-financial assets
Financial assets
United States(Percent of disposable income)
Sources: Banca d'Italia, Banque de France, Board of Governors of the Federal Reserve System, Cabinet Office for the Government of Japan, Deutsche Bundesbank, Economic and Social Research Institute, Haver Analytics, INSEE, OECD, Office for National Statistics of the U.K., Statistics Canada, and Fund staff calculations.

6
0
25
50
75
100
125
150
0
25
50
75
100
125
150
1999 2001 2003 2005 2007 2009
Mortgages
Other liabilities
United States(Percent of disposable income)
0
25
50
75
100
125
150
0
25
50
75
100
125
150
1999 2001 2003 2005 2007 2009
Mortgages
Other liabilities
United Kingdom(Percent of disposable income)
0
25
50
75
100
125
150
0
25
50
75
100
125
150
1999 2001 2003 2005 2007 2009
Mortgages
Other liabilities
Japan(Percent of disposable income)
0
25
50
75
100
125
150
0
25
50
75
100
125
150
1999 2001 2003 2005 2007 2009
Mortgages
Other liabilities
Germany(Percent of disposable income)
0
25
50
75
100
125
150
0
25
50
75
100
125
150
1999 2001 2003 2005 2007 2009
Medium andlong-term loans
Other liabilities
Italy(Percent of disposable income)
0
25
50
75
100
125
150
0
25
50
75
100
125
150
1999 2001 2003 2005 2007 2009
Long-termloans
Other liabilities
France(Percent of disposable income)
Figure 2b. Household Liabilities in Advanced Economies
0
25
50
75
100
125
150
0
25
50
75
100
125
150
1999 2001 2003 2005 2007 2009
Mortgages
Other liabilities
Canada(Percent of disposable income)
Sources: Banca d'Italia, Banque de France, Board of Governors of the Federal Reserve System, Cabinet Office for the Government of Japan, Deutsche Bundesbank, Economic and Social Research Institute, Haver Analytics, INSEE, OECD, Office for National Statistics of the U.K., Statistics Canada, and Fund staff calculations.

7
B. The Evolution of House Prices
3. House prices in Canada have more than doubled over the past decade, notwithstanding a 11 percent correction after the 2008 crisis.2 British Columbia has witnessed the highest increases, with prices higher by 163 percent relative to the second quarter of 2001. In British Columbia and Ontario, house prices have grown by around 41 and 29 percent since their crisis trough (after falling by 10 and 13 percent after their pre-crisis peaks in Q1 2009 and Q4 2008, respectively). Growth rates of house prices have outpaced those of incomes and rents, leading price-to-income and price-to-rent ratios to historic highs. Given the high urbanization rate in Canada, house prices at the provincial level are mainly driven by the major metropolitan areas in the province. Price-to-rent ratios are elevated in the largest metropolitan areas, particularly in Vancouver (Figure 3).
2 The Canadian Real Estate Association (CREA) national house price index shows an increase of 115 percent between Q2 2001 and Q2 2011; the Teranet national index shows an increase of around 96 percent over the same period. The CREA national and provincial price indices are compiled from statistics of existing homes and properties sold through the Multiple Listing Service; changes in the indices could potentially reflect compositional shifts. By contrast, the Teranet national house price index is constructed using a repeat sales methodology. House price indices based on repeat sales are not available at the provincial level.
Figure 3. House Prices in Canada, Its Major Provinces, and Major Metropolitan Areas
Sources: Canada Real Estate Association and Fund staf f calculations.
90
140
190
240
290
2000Q1 2002Q1 2004Q1 2006Q1 2008Q1 2010-Q1
Canada
British Columbia
Ontario
Quebec
Alberta
House Prices in Canada and Its Major Provinces, 2000Q1-2011Q2(Index: 100=2000Q1)
10
15
20
25
30
35
40
45
50
55
60
1988 1991 1994 1997 2000 2003 2006 2009
Montreal
Toronto
Calgary
Vancouver
Price to Rent Ratio in Major Metropolitan Areas, 1988-2010(Ratio of average prices on average yearly rent, current prices)

8
4. We estimate models of long-run equilibrium house prices for Canada. We assume that the equilibrium level of house prices in period t, , is determined by fundamentals: , where is a vector of variables that affect either the supply or demand of housing. We consider the following variables as the fundamental determinants of house prices: employment, immigration, real income per household, the mortgage interest rate, commodity prices, urbanization, and the borrowing capacity of households.3 Using data from 1980 to 2011 (with data for the first half of 2011 annualized), we estimate various long-run equilibrium house price models for the four major provinces: Alberta, British Columbia, Ontario, and Quebec.
5. The estimates suggest that house prices are associated with income, employment, commodity prices, immigration, and borrowing costs. The regression presented in the first column of Table 1 (Model 0) includes all the explanatory variables we consider. For this specification, the estimated coefficients of employment, income, commodity prices, and immigration are statistically significant; the coefficients on mortgage interest rates, households’ borrowing capacity, and urbanization are not.4 We run regressions with the four explanatory variables that are significant in Model 0 for the pooled sample and for each province individually (Models 1 and 2, respectively). As mortgage interest rates and households’ borrowing capacity are conceptually strongly linked to the demand for owner-occupied housing, and exhibit a significant bi-variate correlation with house prices, we also estimate parsimonious specifications linking house prices to mortgage rates and borrowing capacity (Models 3 and 4, respectively). These regressions suggest that the extraordinarily low level of interest rates is among the factors that have spurred the recent growth in mortgage debt and house prices.
3 The data sources are listed in Table 1. McQuinn and O’Reilly (2008) develop a model in which house prices depend on households’ maximum borrowing capacity, which in turn depends on income, the maximum debt service ratio, the maximum allowed amortization period, and mortgage interest rates.
4 Borrowing costs tend not to be significant in house price regressions that also control for employment and commodity prices since the negative co-movement between borrowing costs and house prices is confounded by the Bank of Canada’s policy reaction to the economic cycle (for example, in the 1990’s mortgage interest rates dropped with the monetary easing that followed an episode of house price declines).

9
6. We use the estimated models to gauge the level of house prices that would be consistent with the long-run determinants of house prices. The residuals from the long-run equilibrium regressions suggest house prices in 2011 to be above the levels consistent with the current levels of fundamentals in British Columbia, with some signs of overvaluation also in Ontario, and to a lesser degree, in Quebec. By contrast, the estimated models suggest house prices to be mildly undervalued in Alberta. A weighted average of our estimates (with weights based on provincial GDP levels) suggest that house prices in Canada are on average ten percent above the level consistent with current fundamentals. We also run estimations on sub-samples to perform out-of-sample forecasts of house prices. Our findings (not shown here) indicate that the earlier the cutoff for the subsample, the larger is the implied overvaluation in British Columbia, Ontario, and Quebec.
Model 0 Model 1 Model 3 Model 4
All provinces
All provinces Alberta
British Columbia Ontario Quebec
All provinces
All provinces
Employment 0.522** 0.299*** -0.178 0.532** 0.354 0.437Real personal income 0.885*** 0.821*** 1.498*** 1.128*** 0.834** 0.328 1.754***Commodity price index 0.307*** 0.281*** 0.253*** 0.311** 0.225* 0.246***Immigration 0.253*** 0.259*** 0.169*** 0.251*** 0.239*** 0.207***Mortgage rate (real) 0.013 -0.039***Borrowing capacity -0.003 0.587***Urbanization -0.003
Model 2
Table 1. Estimates of House Price Equations(Dependent variable: log of real house prices; annual observations, 1980-2011)
Sources: Haver Analytics, Statistics Canada, and Fund staff estimates based on data from Canada Mortgage and Housing Corporation.
Notes: All variables are in logarithms except for the mortgage rate and urbanization. Real house prices at the provincial level are given by the CREA average existing home price index deflated by the provincial CPI. Real personal income per household at the provincial level is proxied by "average real market income" from Statistics Canada and includes earnings from employment and self-employment, investment income, private retirement income, and items under "Other income". The commodity price index, produced by the Bank of Canada, is a chain Fisher price index of the spot or transaction U.S. dollar prices of 24 commodities produced in Canada and sold in world markets. Immigration is the the number of new immigrants in a province. Mortgage rate is the average residential mortgage rate from which the inflation rate was substracted. Borrowing capacity estimates the maximum borrowing capacity of an average borrower based on the current amortization limit, the actual mortgage rate (which is sometimes below the posted rate) and real personal income. Urbanization at the provincial level, produced by the Census of Population, is the share of population in cities. *, **, and *** indicate significance at the 10, 5, and 1 percent level, respectively. Model 0 and 1 are fixed-effect panel regressions, Model 2 consists of OLS regressions at the provincal level, Model 3 is a fixed effect panel regression on income and real mortgage rate, and Model 4 is a fixed effect panel regression on maximum borrowing capacity.
-20 -10 0 10 20 30 40
British Columbia
Ontario
Quebec
Model 4Model 3Model 2Model 1
Estimated House Price Overvaluation in Major Provinces(In percent of equilibrium prices implied by the models)
Alberta
Source: Fund staff estimates.

10
C. Housing Wealth and Consumption
7. We update estimates of the sensitivity of private consumption to housing wealth in Canada using data for 1990–2011. Following Pichette and Tremblay (2004) and Lettau and Ludvigson (2001), we first estimate a long run relationship between consumption, disposable income (a proxy for human wealth), net housing wealth, financial wealth, and other non-human wealth (mostly the stock of durable goods). We then estimate a vector-error-correction model that differentiates between the responses of consumption to permanent versus temporary changes in wealth (using the method proposed by Gonzalo and Granger, 1995). The average marginal propensity to consume (MPC) out of each type of wealth (i) is given by:
ΦT 1 ΦP
where π is the weight on the wealth variation that is transitory and Φ is the MPC from transitory (T) or permanent (P) changes in wealth. Further details on the data and our estimation method are provided in Appendix 1.
8. Our estimate of the MPC out of average changes in housing wealth is 4.3 cents per dollar. Our findings suggest that consumption responds primarily to permanent changes in wealth; responses to transient changes are negligible. For consumption, disposable income, housing wealth, and other wealth, most of the variation is explained by permanent shocks. In the particular case of housing wealth, permanent shocks represent 97 percent of the variation, implying that π = 0.85. The MPC for permanent changes in housing wealth, ΦP, is estimated at 5.4 cents per dollar. The MPC for housing wealth is a weighted average of zero and 5.4, where the weight on the latter is given by π. The sensitivity of consumption to changes in financial wealth is estimated to be lower, around 2.5 cents per dollar on average, in part given the relatively higher importance of transient shocks to financial wealth and the relative importance of real estate assets compared to financial assets in households’ portfolios. The estimates are broadly comparable to those reported in Pichette (2004) for Canada based on a sample for 1965–2003; our estimate of a higher sensitivity to financial wealth relative to Pichette (2004) is likely to be due to the relatively higher importance of financial wealth in the more recent sample period.
9. The housing MPC estimates for Canadian households presented in this paper are similar to estimates based on cross-country datasets but somewhat lower than those recently estimated for the United States. Carroll et al. (2010) find long-run MPCs of 9 and 4 cents per dollar for housing and financial wealth in the United States, respectively. Estimates in IMF (2002) and Case et al (2001) suggest average long-run MPC out of housing wealth of about 4–5 cents per dollar for a group of advanced economies—very close to our estimates for the Canadian economy.
11
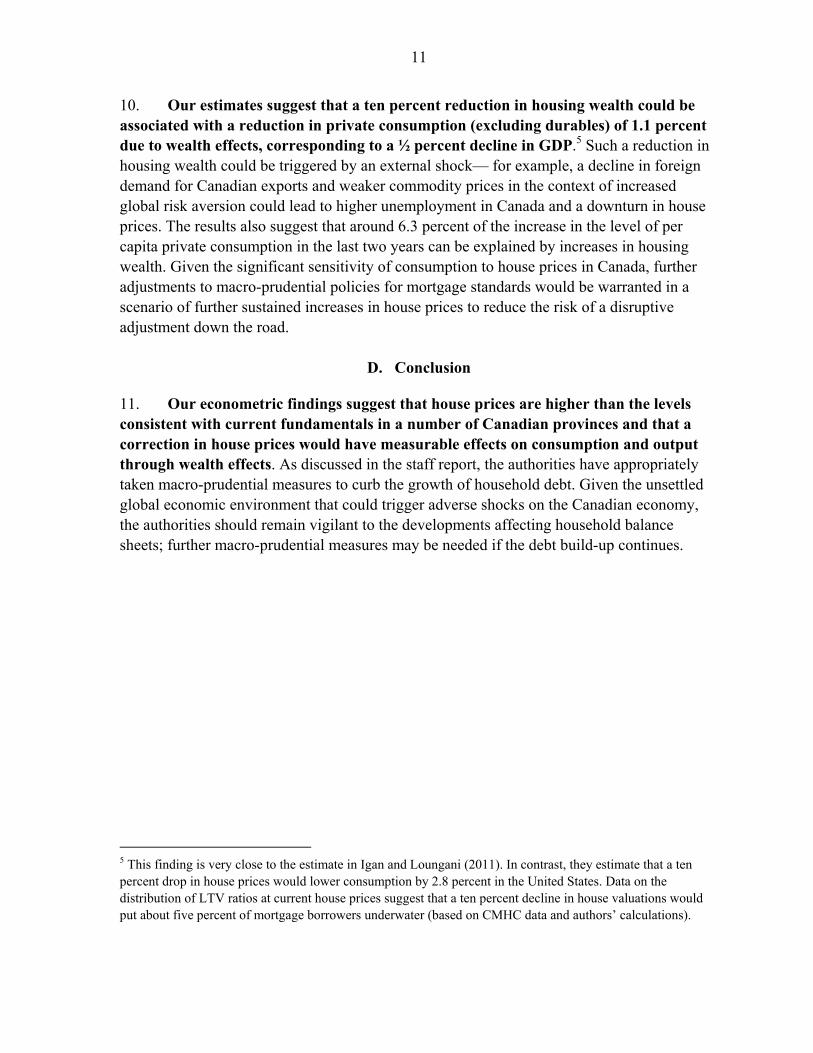
10. Our estimates suggest that a ten percent reduction in housing wealth could be associated with a reduction in private consumption (excluding durables) of 1.1 percent due to wealth effects, corresponding to a ½ percent decline in GDP.5 Such a reduction in housing wealth could be triggered by an external shock— for example, a decline in foreign demand for Canadian exports and weaker commodity prices in the context of increased global risk aversion could lead to higher unemployment in Canada and a downturn in house prices. The results also suggest that around 6.3 percent of the increase in the level of per capita private consumption in the last two years can be explained by increases in housing wealth. Given the significant sensitivity of consumption to house prices in Canada, further adjustments to macro-prudential policies for mortgage standards would be warranted in a scenario of further sustained increases in house prices to reduce the risk of a disruptive adjustment down the road.
D. Conclusion
11. Our econometric findings suggest that house prices are higher than the levels consistent with current fundamentals in a number of Canadian provinces and that a correction in house prices would have measurable effects on consumption and output through wealth effects. As discussed in the staff report, the authorities have appropriately taken macro-prudential measures to curb the growth of household debt. Given the unsettled global economic environment that could trigger adverse shocks on the Canadian economy, the authorities should remain vigilant to the developments affecting household balance sheets; further macro-prudential measures may be needed if the debt build-up continues.
5 This finding is very close to the estimate in Igan and Loungani (2011). In contrast, they estimate that a ten percent drop in house prices would lower consumption by 2.8 percent in the United States. Data on the distribution of LTV ratios at current house prices suggest that a ten percent decline in house valuations would put about five percent of mortgage borrowers underwater (based on CMHC data and authors’ calculations).
12
REFERENCES Case, K.E., J.M. Quigley, and R.J. Shiller. 2001. “Comparing Wealth Effects: The Stock Market
Versus the Housing Market.” National Bureau of Economic Research. NBER Working Paper Series No. 8606.
Carroll, Christopher D., Misuzu Otsuka, and Jiri Slacalek, 2011. “How Large Are Housing and
Financial Wealth Effects? A New Approach,” Journal of Money, Credit and Banking, Blackwell Publishing, vol. 43(1), pages 55–79, 02.
Cochrane, John H., 1994. “Permanent and Transitory Components of GDP and Stock Prices,”
Quarterly Journal of Economics, 1994, 109, 241–265. Gonzalo, J. and C. Granger, 1995. “Estimation of Common Long-Memory Components in
Cointegrated Systems,” Journal of Business and Economic Statistics, 1995, 13, 27–35. Igan, Deniz, and Prakash Loungani (2011) “Global Housing Cycles,” forthcoming IMF Working
Paper. IMF World Economic Outlook, 2002. “Chapter 2: Three essays on how financial markets affect
real activity”. Lettau, M. and S. Ludvigson, 2001. “Understanding Trend and Cycle in Asset Values: Bulls,
Bears, and the Wealth Effect on Consumption.” Centre for Economic Policy Research Discussion Paper No. 3104.
______ and _____ , 2001. “Consumption, Aggregate Wealth and Expected Stock Returns,”
Journal of Finance, June 2001, 56(3), 815–849. ______ and _____ , 2004. “Understanding Trend and Cycle in Asset Values: Reevaluating the
Wealth Effect on Consumption,” American Economic Review, 2004, March, 94(1), pp. 276–299.
McQuinn, K. and O’Reilly G., 2008, “Assessing the Role of Income and Interest Rates in
Determining House Prices, Empirical Modelling, Vol. 25, pp.377–390. Pichette, L., 2004. “Are Wealth Effects Important for Canada?” Bank of Canada Review, Spring
2004. Pichette, L. and D. Tremblay, 2003. “Are Wealth Effects Important for Canada?” Bank of
Canada Working Paper No. 2003–30. Stock, J. and M. Watson, 1993. “A Simple Estimator of Cointegrating Vectors in Higher Order
Integrated Systems,” Econometrica, 1993, 61, 783–820.

13
APPENDIX 1. DATA SOURCES AND ESTIMATION METHOD
Data Data on household wealth are from Statistics Canada National Balance Sheets for the period 1990Q1 to 2011Q2. We divide non-human wealth into three components: housing wealth, financial wealth, and other non-human wealth. Housing is defined as the market value of land plus residential structures, net of mortgage debt. Financial wealth includes all financial wealth such as equity holdings and deposits at market values. The remaining wealth in market value, such as durable goods, is included in other non-human wealth. Disposable income is used as a proxy of human wealth. Data is expressed in per capita, real terms. Consumer expenditure, our dependent variable, is defined as the sum non-durable expenditure components, including services. Durable consumption is not included since the flow of services from durable goods rather than their purchases would be the appropriate measure in our analysis. Method We estimate a cointegrating system for nondurables consumption, , income, , housing wealth, , financial wealth, , and other wealth, . We use lower case letters to denote logarithmic transformations, e.g., ln . Lettau and Ludvigson (2001b) derive an approximate equation for the ratio of log consumption to aggregate wealth (W) using observable variables, which we express, after approximating total non-human wealth (At) as the sum of housing, financial and other wealth, as:
1 Δ Δ
∞
where 1 exp , ν is the steady state share of human wealth in aggregate wealth and is the average return of non-human wealth. If labor income follows a random walk and human capital returns are constant, the left hand side is a proxy of the log consumption-wealth ratio. The cointegrating residual on the left-hand side should forecast changes in asset wealth (returns), changes in labor income, changes in consumption growth, or a combination of the three. Lettau and Ludvigson (2001a, 2001b) find this residual to be a strong predictor of excess returns on aggregate stock market indexes but not consumption or labor income growth. The estimated long-run relationship is (following the method of Stock and Watson, 1993) is:
0.12 0.51 0.13 0.15 0.08

14
This relationship determines the error correction term in the estimation of the reduced-form vector error-correction model (VECM):
Δ Δ ′ ′
Where x is the vector of cointegrated variables, with x , , , , ′ . All variables in the vector are first order integrated, I(1), as confirmed by unit root tests. Our tests also reveal the presence of a single cointegrating vector for the five variables, a result we impose on the VECM. Newey-West corrected errors show significance at 1 percent for the parameters estimated. The estimated adjustment coefficients to the error correction term are 0.0931, 0.0539,0.0213, 0.9242, 0.1439 . Following Gonzalo and Granger (1995), the
permanent and transitory components of the shocks are identified and the fraction of forecast-error variance attributable to permanent and transitory shocks are obtained ( and
, respectively). The relative importance of permanent shocks is for average MPC for a
given type of wealth (i) is given by:

15
II. THE ROLE OF THE CMHC IN THE CANADIAN MORTGAGE MARKET1
The Canadian housing market has experienced a boom over the last decade with increased mortgage credit and mortgage securitization. The Canada Mortgage and Housing Corporation (CMHC), a Crown corporation, plays a central role in the mortgage market insuring loans and guaranteeing the main securitization channels. This paper gives an overview of the main characteristics of the Canadian mortgage market with a focus on the role of the CMHC.
A. Introduction
1. Over the last decade, homeownership has increased by nearly four percent in Canada, with a booming mortgage market leading also to an increase in the size and role of the CMHC. As of 2010, the homeownership rate in Canada is estimated to be just under 70 percent. The booming house prices and homeownership rate have led to an increase in the residential assets of Canadian households, which grew in real terms at a yearly average of more than 7 percent between 2000 and 2010. In parallel, mortgage liabilities grew at an average rate of around 8 percent over the same period. The outstanding value of residential mortgages estimated at around C$1 trillion.2 Against this backdrop, CMHC has seen a substantial increase in its activity and size—its assets increased more than twelve-fold between 2000 and 2010, and it is currently one of the largest financial institutions in Canada.
B. Overview of the Mortgage Market
2. Key features of the standard Canadian mortgage contract are the short mortgage term, refinancing penalties, and the full recourse on the mortgage loan in most provinces. The typical Canadian mortgage has a fixed rate (currently, around 68 percent of mortgages), a five-year term (borrowers can renegotiate their mortgage at the end of the 5-year term), and an amortization period of 25 years. The short term of the mortgage could be a result of federal regulation giving homeowners the right to prepay mortgages with a term to maturity greater than five years after five years of payments for a fixed prepayment penalty (see Kiff (2009)).3, 4 Unlike in the U.S., Canadian borrowers
1 Prepared by Jihad Dagher.
2 The average Canadian home is more expensive than its U.S. counterpart and is estimated to be worth C$374,159 as of Q2 2011 (based on data from The Canadian Real Estate Association).
3 Kiff, John, 2009: “Canadian Mortgage Markets: Boring but Effective?,” IMF WP/09/130.
4 It is also argued that the popularity of five-year retail term deposits, which is due to the 5-year insurance limit by Canada Deposit Insurance Corporation, is also a factor as it gives incentives for banks to match the maturity of their assets and liabilities.

16
typically have to pay a penalty to prepay their loans.5 Mortgage loans are full recourse loans in Canada, meaning that the borrower remains responsible for the full amount of the mortgage even in the case of foreclosure. It is argued that the ability of banks to pursue other assets by the borrower and garnish their future wages has kept delinquency rates in check even during episodes of house price declines.
3. Due to regulatory requirements and capital incentives, banks insure a significant share of their mortgage loans. Federal legislation requires all federally-regulated lenders to insure the residential mortgage loans they originate with a loan-to-value ratio (LTV) of more than 80 percent. Federally-regulated Canadian deposit-taking institutions comprise the largest 5 Borrowers have nevertheless the option to pay up to 10–20 percent of the outstanding mortgage balance, annually, without penalties.
Figure 1. Canada: Overview of the Mortgage Market
Sources: Canada Bankers' Association, Canadian Mortgage and Housing Corporation, Genworth, Haver Analytics, Statistics Canada, and Fund staf f calculations.
0
200
400
600
800
1000
1200
1400
1600
1990 1995 2000 2005 2010
Residential Assets
Outstanding Mortgages
Residential Assets and Outstanding Mortgages,1990-2010(Billions of 2002 CAD)
0
20
40
60
80
100
120
140
1990 1995 2000 2005 2010
NHA-MBS Issuance, 1990-2011M10(Billions of 2002 CAD)
0.1
0.2
0.3
0.4
0.5
0.6
0.7
0.8
Jan-90 Jun-93 Nov-96 Apr-00 Sep-03 Feb-07 Jul-10
1990-2011 average
Mortgage Delinquency rate
Mortgage Delinquency Rate (90 days or more),1990M1-2011M8(Percent of outstanding loans)
49%
24%
1%
26%
CMHC-insuredGenworth-insuredOther-insuredUninsured
Share of Insured and Uninsured Mortgages, Q2 2011(In percent of outstanding loans)

17
share of originations (including indirect originations through brokers). Overall, around 70 percent of mortgages in Canada are funded through deposits. Insurance on mortgage loans is purchased by the lender and passed on to borrower either as an upfront fee or as an add-on to the mortgage principal. Banks also insure loans below the 80 percent LTV threshold to reduce capital requirements and for securitization purposes. While uninsured mortgages with LTV less than 80 percent have a capital risk weight of 35 percent, CMHC-insured mortgages have a capital risk weight of zero and mortgages insured by private insurers have a slightly higher risk weight (5 percent in the case of Genworth, the main private insurer), given the 90 percent government guarantee for private insurers. Recent regulations have imposed new limits on amortization periods and loan-to-value ratios (LTV) on newly originated mortgages (Box 1). The combined “insurance in force” of the two main insurers, CMHC and the Genworth (around C$790 billion) covers nearly 75 percent of outstanding mortgages.
C. The Role of CMHC
4. CMHC is a Crown corporation wholly owned by the Canadian government that operates, among other activities, the largest mortgage insurance business in Canada. The CMHC’s liabilities constitute a direct and unconditional obligation of the government. It is mainly through the CMHC that the government implements its housing policies. The core activity of the CMHC is its mortgage insurance business, which is expected to be self-funded and operated on a commercial basis. Specifically, mortgage insurance is expected to be priced to cover potential mortgage defaults and to ensure a commercial rate of return. The amount of reserves is also expected to be determined on an actuarial basis. CMHC insures the lender against a mortgage default by the borrower. In the event of a default, the lender could force a foreclosure and sell the property. CMHC (like any other mortgage insurer in Canada) is required to pay the shortfall between the sale proceeds and the remaining loan amount, plus up to 18 months of accrued interest and other foreclosure-related costs. The CMHC accounts for about 70 percent of the mortgage insurance market. At the end of Q2 2011, CMHC’s total insurance-in-force amounted to C$536 billion, approximately half of the outstanding mortgage debt in Canada.6
6 According to CMHC, the average equity in their insured mortgage portfolio is 45 percent.
0
0.05
0.1
0.15
0.2
0.25
0.3
0.35
0
0.05
0.1
0.15
0.2
0.25
0.3
0.35
1997 1999 2001 2003 2005 2007 2009
Insurance-in-ForceGuarantees in Force
Insurance and Guarantees, 1997-2010(Percent of GDP)
Sources: Canada Mortgage and Housing Corporation and Fund staff calculations.

18
5. The CMHC is subject to government oversight; it has a well-defined (albeit complex) regulatory framework but is not currently subject to the same financial supervision as private mortgage insurers. The legislative framework governing the CMHC consists primarily of the Canada Mortgage and Housing Corporation Act, the National Housing Act (NHA) and the Financial Administration Act. The stewardship of the CMHC is the responsibility of the Board of Directors, comprising the Chairperson, the President and Chief Executive Officer of CMHC, and eight other directors appointed by the Minister designated for the purposes of the CMHC Act. The CMHC reports to Parliament through its responsible Minister (the Minister of Human Resources and Skills Development) and must submit an annual five-year corporate plan, recommended by its responsible minister and the Minister of Finance. While CMHC’s mortgage insurance forms the largest part of CMHC’s activities, CMHC is not supervised by the Office of the Superintendent of Financial Institutions (OSFI), unlike private mortgage insurers. Nevertheless, it sets a target of 200 percent of OSFI’s Minimum Capital Test (MCT) and reported, as of Q2 2011, capital holdings above that target. Furthermore, CMHC engages in regular dialogue with the Department of Finance and members of the Senior Advisory Committee which includes OSFI, the Bank of Canada, the Canada Deposit Insurance Corporation, and Financial Consumer Agency of Canada.
6. CMHC also plays an important role in the securitization market by facilitating an adequate supply of low-cost funding for mortgage lending. CMHC provides a guarantee of principal and interest payments on NHA Mortgage Backed-Securities (NHA-MBS) and Canada Mortgage Bonds (CMB)—the two main funding channels for mortgages in Canada.
The NHA-MBS program started in 1987. Under this program, approved issuers (e.g., banks, credit unions, and life insurance companies) assemble and administer a pool of mortgages and issue securities backed by these mortgage loans. The underlying mortgages have to be insured by CMHC or other CMHC-approved insurers. These securities are then sold to investors with a guarantee, provided by CMHC, on the timely payment of the principal and interest.7 As of Q2 2011, NHA-MBS outstanding stood at C$294 billion (27½ percent of outstanding mortgages).
Canada Mortgage Bond program: CMHC established the CMB program to complement the NHA-MBS program. Under the CMB program, a special purpose vehicle name the Canada Housing Trust (CHT) sells non-amortizing Canada Mortgage Bonds to investors and uses the proceeds to purchase NHA-MBSs. As of
7 The CMHC’s guarantee fees are typically in the range of 20–40 basis points.

19
Q2 2011, total CMB outstanding was C$204 billion (69 percent of all NHA-MBS issues).
7. During the global financial crisis the Canadian government put in place a program to support the availability of mortgage credit though CMHC-managed purchases of NHA MBS. Under the Insured Mortgage Purchase Program (IMPP), created in October 2008, CMHC purchased $69 billion in NHA MBS, financed by a government loan. The program, which authorized purchases of up to $125 billion in MBS, expired in March 2010. Given that the program involved purchases of NHA-MBS, the underlying mortgage loans were already insured by CMHC or private insurers backed by the government. The bulk of the government loan to CMHC that financed these purchases is expected to be repaid by 2015.
Box 1. Mortgage Regulations (as of April 18, 2011)
High-Ratio Mortgages Low-Ratio Mortgages (loan-to-value (LTV) above 80 percent) (LTV equal to or below 80 percent)
A minimum down payment of five percent. Property value verification requirement.
For non-owner occupied properties, a minimum down payment of 20 percent.
If LTV is between 60 and 80 percent, credit score must be above 580.
A maximum loan-to-value ratio of 85 percent for refinancings.
Non-amortizing lines of credit secured by homes, such as home equity lines of credit (HELOCs) not allowed.
A maximum amortization period of 30 years.
Credit score floor at 600 with some exceptions.
Loan documentation requirements.
All borrowers must meet debt servicing standards based on interest rates for five-year fixed rate mortgages, even if they choose a mortgage with a shorter term or a lower interest rate.
Lines of credit secured by homes, such as home equity lines of credit (HELOCs) not allowed.
Source: Canadian Authorities.

20
III. DYNAMICS AND COMPOSITION OF GROSS AND NET GOVERNMENT DEBT1
A. Introduction
1. Canada’s net public debt has remained low in recent years relative to its international peers. This partially reflects large holdings of financial assets, which have increased significantly in recent years (up 11 percent of GDP since 2007). This chapter describes the composition and the dynamics of gross and net debt at different levels of government, with the main focus on the post-2007 period and the effects of the international financial crisis. The first section provides an overview of main trends in the consolidated general government gross and net debt. The next section discusses the composition and recent changes in the balance sheet at the federal level. The final section focuses on sub-national governments as they account for the largest share of gross debt and financial assets.
B. General Government Gross and Net Debt in Canada
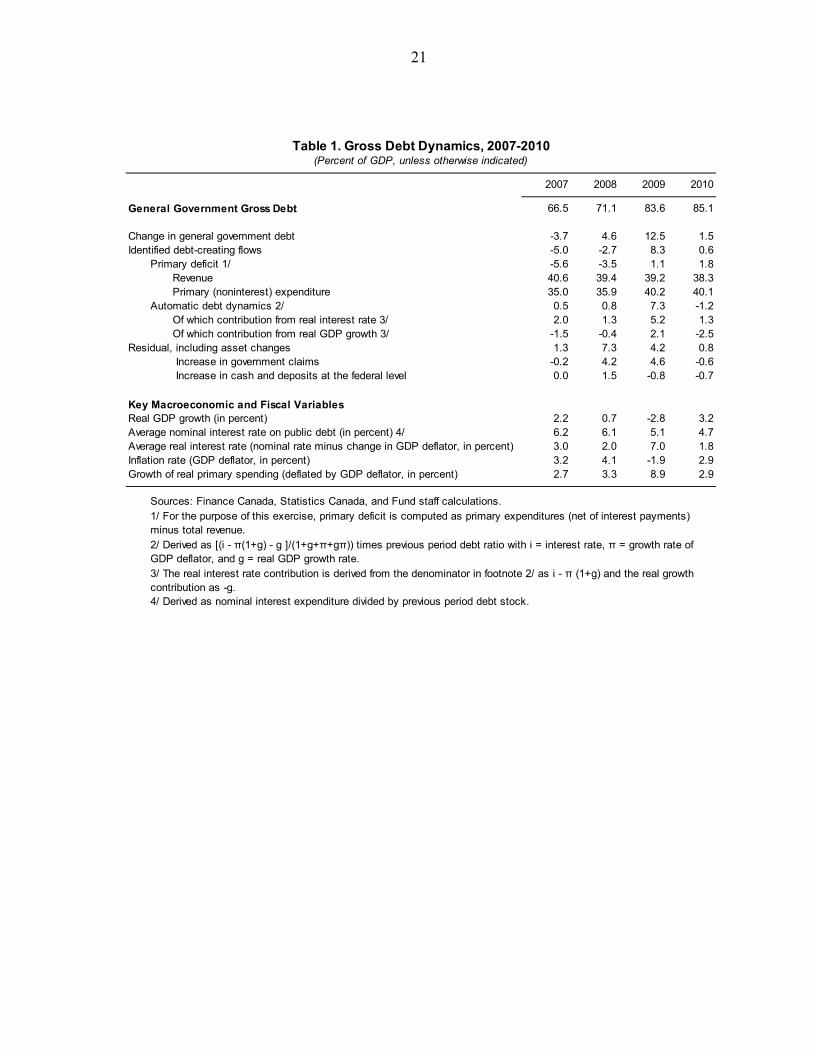
2. Gross debt increased significantly after 2007, as in other countries, reflecting the economic recession and the response to the international crisis. After surpassing more than 100 percent of GDP in the early 1990s, gross debt fell steadily since 1997 as Canada went through a large fiscal adjustment. By 2007, gross debt was down to 66 percent of GDP, below the OECD average.2 As the international crisis intensified, gross debt surged in 2008 and 2009 reflecting both the deteriorating economic conditions and the stimulus measures. In 2008, the rise in gross debt was mainly due to non-budgetary operations, reflecting large loans to state-owned enterprises (SOEs) and the accumulation of cash reserves at the federal level (both linked to crisis-related measures to provide support to the financial sector and the economy). In 2009, on the other hand, the sharp economic contraction played a key role in driving the increase in gross (and net) debt, although the deterioration in the fiscal deficit and loans to SOEs also continued to be a factor. By 2010, gross debt reached 85 percent of GDP, remaining below other advanced economies.
1 Prepared by Paulo Medas and Guilhem Blondy.
2 The definition of general government gross debt is based on the national accounts balance sheet (which differs from the definition/coverage in the public accounts) but excludes unfunded pension liabilities.
0
20
40
60
80
100
2000 2002 2004 2006 2008 2010
Canada Gross Debt
Canada Net Debt
OECD Average Gross Debt
OECD Average Net Debt
General Government Debt in Canada and the OECD, 2000-2010(Percent of GDP)
Sources: OCED and Fund staff calculations.
21
2007 2008 2009 2010
General Government Gross Debt 66.5 71.1 83.6 85.1
Change in general government debt -3.7 4.6 12.5 1.5Identified debt-creating flows -5.0 -2.7 8.3 0.6
Primary deficit 1/ -5.6 -3.5 1.1 1.8Revenue 40.6 39.4 39.2 38.3Primary (noninterest) expenditure 35.0 35.9 40.2 40.1
Automatic debt dynamics 2/ 0.5 0.8 7.3 -1.2Of which contribution from real interest rate 3/ 2.0 1.3 5.2 1.3Of which contribution from real GDP growth 3/ -1.5 -0.4 2.1 -2.5
Residual, including asset changes 1.3 7.3 4.2 0.8 Increase in government claims -0.2 4.2 4.6 -0.6 Increase in cash and deposits at the federal level 0.0 1.5 -0.8 -0.7
Key Macroeconomic and Fiscal VariablesReal GDP growth (in percent) 2.2 0.7 -2.8 3.2Average nominal interest rate on public debt (in percent) 4/ 6.2 6.1 5.1 4.7Average real interest rate (nominal rate minus change in GDP deflator, in percent) 3.0 2.0 7.0 1.8Inflation rate (GDP deflator, in percent) 3.2 4.1 -1.9 2.9Growth of real primary spending (deflated by GDP deflator, in percent) 2.7 3.3 8.9 2.9
4/ Derived as nominal interest expenditure divided by previous period debt stock.
Sources: Finance Canada, Statistics Canada, and Fund staff calculations.
3/ The real interest rate contribution is derived from the denominator in footnote 2/ as i - π (1+g) and the real growth contribution as -g.
2/ Derived as [(i - π(1+g) - g ]/(1+g+π+gπ)) times previous period debt ratio with i = interest rate, π = growth rate of GDP deflator, and g = real GDP growth rate.
Table 1. Gross Debt Dynamics, 2007-2010(Percent of GDP, unless otherwise indicated)
1/ For the purpose of this exercise, primary deficit is computed as primary expenditures (net of interest payments) minus total revenue.

22
3. Net debt fell rapidly up to 2008 and has remained well below OECD average since 2003, reflecting Canada’s relatively stronger fiscal stance. Financial assets have also increased faster in Canada than in most other countries in the OECD since 2007, although an international comparison is hindered by the different coverage of financial assets.3 The consolidated financial assets of the general government in Canada, at 55 percent of GDP, are larger than the OECD average of 40 percent of GDP. There is wide cross-country dispersion in the size of government financial assets. Economies with large commodity-based exports also tend to have large financial assets—in some cases much larger than in Canada. For example, Norway has more than 200 percent of GDP in financial assets.
4. Sub-national governments have the largest share of financial assets among the different levels of government in Canada. Provinces and local governments hold about 37 percent of GDP in financial assets, while the federal government had 16 percent of GDP and Social Security (Canada and Quebec pension plans) accounted for another 11 percent of GDP. Government claims on Crown corporations and other state-owned enterprises (SOEs) represent the largest share of government financial assets, about 40 percent—these include loans to SOEs and equity positions. Other significant assets include market instruments, such as holdings in domestic and foreign securities and equity.
3 For example some countries do not include equity holdings on state owned enterprises as financial assets.
-20
-10
0
10
20
30
40
50
60
Federal Government Provinces and Local Governments
CPP/QPP
Gross Debt
Financial Assets
Net Debt
Gross and Net Debt, 2010(Percent of GDP)
Sources: Finance Canada, Statistics Canada, and Fund staff calculations.
-200
-150
-100
-50
0
50
100
150
Norway Australia Canada New Zealand
Russia
Gross debt Net debt
General Government Debt in Selected Economies(Percent of GDP, 2010 except Russia which refersto 2009)
Sources: IMF Government Finance Statistics, OECD, and Fund staff calculations.

23
C. Federal Government
5. Federal government debt rose with the crisis, but remains relatively low by international standards. Net debt increased by about 5 percentage points after 2008 to 25 percent of GDP in 2010 given the large fiscal deficit and the economic contraction. At the same time, the increase in gross debt has been more noticeable—from around 30 percent in 2007 to 41 percent of GDP in 2009–10—as the government financial assets have jumped by 8.5 percent of GDP after 2007, largely financed by issuance of government paper. Market debt instruments (bonds and short-term paper) account for the vast majority of gross federal debt (Figure 1). Total liabilities also include around 9 percent of GDP in unfunded pension liabilities.
6. The rise in financial assets mainly reflects substantial loans to Crown corporations in recent years. Government claims on Crown corporations (loans, equity position) and foreign exchange reserves held in the Exchange Fund Account have increased rapidly and now represent ¾ of total financial assets of the federal government. Large loans to the Canadian Mortgage and Housing Corporation (CMHC), the Development bank, and Farm Canada were the main cause of the growth in financial assets since 2008. In particular, the government’s claims on CMHC represent almost ⅓ of the central government financial assets. The loans to the Crown corporations were mainly directed to help support credit, especially to fund the purchase of insured mortgages under the Insured Mortgage Purchase Program, during the financial crisis and are expected to be largely unwound over the next years.4 However, the government is also now borrowing in the markets to on-lend to some Crown corporations, towards reducing the funding costs of those SOEs. At the same time, the share of more liquid assets, such as cash and holdings in securities, has remained relatively small except in 2008–09 when the government kept large cash balances to help provide liquidity to the financial system, as needed, in coordination with the Bank of Canada (special liquidity facilities put in place during the crisis).
4 The largest loan, to CMHC, amounting to 4 percent of GDP, financed the acquisition of securitized mortgages and is expected to be paid in full by the fiscal year 2014/15 as the loans mature, with the main tranche to be paid in 2013/14.
0
10
20
30
40
50
60
0
2
4
6
8
10
12
14
16
18
2000 2002 2004 2006 2008 2010
Financial Assets, leftGross Debt, rightNet Debt, right
Sources: Finance Canada, Statistics Canada, and Fund staff calculations.
Central Government Gross and Net Debt, 2000-2010(Percent of GDP)

24
Figure 1. Canada: Gross and Net Debt of the Federal Government
0
20
40
60
80
100
120
140
2005 2006 2007 2008 2009 2010
Other AssetsBonds, Short-term Paper, and SharesCashLoansGovernment Claims
Composition of Financial Assets, 2005-2010(Percent of Total Financial Assets)
Sources: Statistics Canada, and Fund staff calculations.
0
1
2
3
4
5
6
7
2004-05 2005-06 2006-07 2007-08 2008-09 2009-10
Other loans Farm Credit
Loans to Dev Bank Loans to CMHC
Government Loans to Crown Corporations, 2004/05-2009/10(Percent of GDP)
Sources: Finance Canada and Fund staff calculations.
2009 2010
LiabilitiesBonds 23.5 25.2Short-term paper 12.2 10.8Life insurance and pensions 9.5 9.1Other liabilities 5.3 5.1
Total Liabilities 50.4 50.2Less: Unfunded Pension liabilities 9.3 8.9
Gross Debt 41.1 41.3
Financial AssetsCanadian currency and deposits 0.9 0.2Loans 0.9 1.2Bonds and short-term paper 0.4 0.4Government claims 12.4 12.1Other financial assets 1.7 1.9
Total Financial Assets 16.5 15.9
Net Debt 24.7 25.5
Federal Government Gross and Net Debt
Sources: Finance Canada, Statistics Canada, and Fund staff calculations.

25
D. Provinces and Local Governments
7. Net debt at the sub-national level (provinces and local governments) was on a declining trend from 1997 to 2007, reflecting an improved fiscal position. After declining steadily since 1997, driven by a period of low deficits/surpluses, net debt reached a historically low 11½ percent of GDP in 2007. At the same time, gross debt remained broadly stable below 50 percent of GDP between 2000 and 2007, while sub-national governments accumulated large financial assets in the same period.
8. As the fiscal position deteriorated in recent years, sub-national debt shifted to an upward trend. Since the financial crisis, the fiscal position of sub-national governments quickly deteriorated, moving to larger deficits (consolidated deficit of sub-nationals rose to 3½ percent of GDP in 2009–10). As a result sub-national gross debt surpassed 50 percent of GDP in 2009–10, and more than 200 percent of fiscal revenues at the provincial and local levels. Net debt has also increased rapidly, although remaining at low levels; while financial assets continued to increase at a more moderate pace and reached 37 percent of GDP in 2009–10.5 The liabilities at the sub-national level are mainly concentrated at the provincial level6 and in market instruments (bonds and short-term paper), which represented 63 percent of gross debt in 2010. The share of payables and other liabilities increased from 26 percent of GDP back in 2000 to 33 percent in 2010. Since the financial crisis, the increase in provincial and local gross debt (7¼ percent of GDP) was mainly via market instruments (Figure 2).
5 The accumulation of assets during a period of rising net debt is in part explained by the heterogeneity in the provinces’ fiscal positions. Some provinces, especially those benefiting from the high commodity prices, remain in a relatively strong financial position, while other have been hit harder by the crisis and will need a longer period to reduce their deficits and debt levels. Some provinces have also taken advantage of low funding costs to issue debt and build up some financial assets.
6 Provinces account for close to 90 percent of total financial assets and liabilities at the sub-national level.
0
5
10
15
20
25
40
42
44
46
48
50
52
54
56
2000 2002 2004 2006 2008 2010
Net debt (RHS)
Gross debt (LHS)
Sub-national Gross and Net Debt, 2000-2010(Percent of GDP)
Sources: Statistics Canada and Fund staff calculations.

26
9. Sub-national governments have a more diverse composition of financial assets. The share of bonds and short-term paper has been relatively stable in recent years around 30 percent of total financial assets. Shares and foreign investments have averaged around 16 percent, in part reflecting investments of the Alberta’s Heritage Savings Trust Fund. Government claims on public sector entities represent 20 percent of financial assets (down from 25 percent in 2000). Receivables (including accrued taxes collected by the federal government and yet to be distributed) account for another 20 percent. Mortgages and other loans have risen in recent years in part reflecting loans provided by the government of Ontario to support to the auto industry.

27
Figure 2. Canada: Provinces and Local Governments: Gross and Net Debt
Sources: Statistics Canada and Fund staf f calculations.
0
10
20
30
40
50
60
2000 2001 2002 2003 2004 2005 2006 2007 2008 2009 2010
Claims, public sectorOther loans and mortgagesPayables and othersBonds and short-term paper
Provincial and Local Gross Debt, 2000-2010(Percent of GDP)
0
5
10
15
20
25
30
35
40
45
2000 2001 2002 2003 2004 2005 2006 2007 2008 2009 2010
Other loans and mortgagesCurrency and depositsShares and foreign investmentsReceivables and othersClaims, public sectorBonds and short-term paper
Provincial and Local Financial Assets, 2000-2010(Percent of GDP)

28
IV. BILATERAL FINANCIAL LINKAGES IN AN INTERNATIONAL PERSPECTIVE1
A. Introduction
1. This note provides a snapshot of Canada’s international financial integration at the end of 2010. It characterizes the size and composition of Canada’s external assets and liabilities and their evolution over time, and compares Canada with other advanced economies. It then examines these claims and liabilities by the residence of the counterpart, to provide a broad assessment of the sensitivity of Canada’s external balance sheet to shocks originating in different countries and regions.
B. Canada’s External Position
2. Canada’s external assets and liabilities at market value totaled C$1.76 trillion (108 percent of GDP) and C$1.94 trillion (120 percent of GDP) respectively as of end-2010. As in other advanced economies, these ratios have increased significantly over the past two decades (text Chart). Canada’s net international investment position (NIIP), which turned progressively less negative between the early 1990s and 2006, reflecting in particular a string of current account surpluses during 1999–2008, has deteriorated somewhat since the crisis, with net liabilities of around 12 percent of GDP at end-2010 (and a similar level in Q2 2011). Canadian external assets have grown steadily as a share of total Canadian financial assets from around 8 percent in 1990 to over 12 percent during the 1990s, and have remained broadly in that range since then, with fluctuations partly reflecting exchange rate movements.2 Canadian external liabilities have instead declined from a peak of 16 percent of total financial liabilities to around 13½ percent in 2010, in line with the reduction in Canada’s net external liabilities.
1 Prepared by Gian Maria Milesi-Ferretti.
2 Most Canadian external assets are denominated in foreign currency and hence increase (decrease) in value relative to domestic assets when the exchange rate depreciates (appreciates).
0
20
40
60
80
100
120
140
0
20
40
60
80
100
120
140
1990 1993 1996 1999 2002 2005 2008
Total Assets
Total Liabilities
External Assets and Liabilities, 1990-2010(Percent of GDP, market value)
0
2
4
6
8
10
12
14
16
18
20
0
2
4
6
8
10
12
14
16
18
20
1990 1993 1996 1999 2002 2005 2008
External assets External liabilities
External Assets and Liabilities, 1990-2010(Percent of total financial assets and liabilities)
Sources: IMF International Financial Statistics and Fundstaff calculations.
Sources: IMF International Financial Statistics and Fund staff calculations.

29
3. Canada’s external assets and liabilities are comparable in size to those of other non-EU advanced economies (Table 1). Specifically, Canada’s external portfolio in relation to GDP is broadly comparable in size to Australia, Japan, and the United States. Advanced economies with financial centers (such as the Netherlands, Switzerland, and the United Kingdom) have instead ratios of external assets and liabilities of 500 percent and above; also, other European countries (such as France and Germany) have much larger ratios.
International activity of Canadian banks
4. The lower level of external assets and liabilities relative to several other advanced economies reflects in part smaller cross-border positions by Canadian banks (Figure 1). Balance of payments statistics record external assets and liabilities on the basis of the residence principle, with external bank claims being defined as claims by a banking entity resident in the country (including the affiliate of a foreign bank) on a nonresident (including a banking affiliate domiciled in a different jurisdiction). On this “locational” basis, Canada’s external bank assets and liabilities are around 25 percent of GDP, a level similar to the United States but much lower than in most European advanced economies, where those ratios at times exceed 100 percent of GDP. A number of small international financial centers, such as the Cayman Islands, Luxembourg, and the Bahamas, also report high bank claims and liabilities, reflecting the activity of affiliates of banks from other countries.
5. Locational banking statistics based on the nationality of the reporting bank show higher international activity of Canadian banks (Figure 2). These statistics capture cross-border claims and liabilities based on the nationality of the reporting bank, regardless of the location of the office booking the claims. They show much larger claims and liabilities for countries whose banks book significant international activity through affiliates domiciled in other countries (such as France, Germany, and Switzerland). For Canada as well, claims vis-à-vis foreign offices booked through affiliates outside Canada are substantial.
6. The consolidated foreign assets of Canadian banks are also much larger than the locational cross-border claims (Figure 3). This measure of foreign assets consolidates claims of banks vis-à-vis their foreign offices and includes lending activity by these offices in the country in which they are located (for example, claims by a Canadian bank affiliate in the United States on U.S. residents). For Canada, “local” claims of Canadian bank affiliates (denominated in the currency of the country where the affiliate is located) account for the lion share of these claims, as discussed further below.

30
CountrySum of external assets and
liabilities Net IIP
United Kingdom 1291 -13.7Switzerland 984 133.0Netherlands 868 26.7France 518 -13.5Germany 460 37.1Spain 340 -86.2United States 292 -16.9Italy 254 -24.3Australia 239 -58.1Canada 229 -11.5Japan 182 52.5Russia 157 1.1Korea 149 -13.3China,P.R.: Mainland 115 29.8Turkey 99 -49.5Mexico 97 -35.1Brazil 89 -31.1India 87 -14.2Indonesia 84 -40.5
Table 1. International Financial Integration and Net External Position, 2010 (Percent of GDP)
Sources: IMF International Financial Statistics and Fund staff calculations.
Figure 1. Cross-Border Bank Assets and Liabilities by Residence of the Reporting Entity, June 2011
(Billions of U.S. dollars)
0 1000 2000 3000 4000 5000 6000 7000
United KingdomUnited States
JapanGermany
FranceCayman Islands
NetherlandsHong Kong SAR
SingaporeLuxembourgSwitzerland
BelgiumIreland
ItalySpain
BahamasCanada Bank liabilities
Bank assets
Sources: Bank for International Settlements and Fund staf f calculations.

31
Sources: Bank for International Settlements and Fund staf f calculations.0 1000 2000 3000 4000 5000 6000
United KingdomFrance
GermanyUnited States
JapanSwitzerlandNetherlands
ItalyCanadaSweden
SpainBelgiumAustralia
IrelandAustria
Hong Kong SAR Bank liabilities
Bank assets
Figure 2. International Bank Assets and Liabilities by Nationality of the Reporting Bank, June 2011
(Locational basis, billions of U.S. dollars)
Figure 3. Foreign Claims of Selected Banking Systems, by Nationality of the Reporting Bank, Ultimate Risk and Immediate Borrower Basis, June 2011
(Billions of U.S. dollars)
Sources: Bank for International Settlements and Fund staf f calculations.0 500 1000 1500 2000 2500 3000 3500 4000 4500
United KingdomFrance
GermanyUnited States
JapanSwitzerland
SpainNetherlands
ItalyCanadaSwedenAustralia
AustriaBelgium
Ireland Immediate borrowerUltimate risk

32
The composition of Canadian external assets and liabilities
7. Canada’s overseas assets reflect primarily equity-related claims, while portfolio debt instruments and foreign direct investment are the most important liability categories (Figure 4). On the external asset side, foreign direct investment and portfolio equity are almost double the size of debt-related claims (portfolio debt securities and other investment assets). On the liabilities side, portfolio debt—which has risen significantly since the start of the global financial crisis—and FDI are the most important components. The current level of foreign holdings of Canadian debt securities (40 percent of GDP as of end-2010) is, however, not unprecedented: during the 1990s, a period when Canada had significant net external liabilities, nonresidents’ holdings of Canadian debt securities were around 50 percent of GDP.
8. Overall, the structure of the Canadian external position (“long equity, short debt”) resembles the one of the United States. Specifically, Canada has a positive net FDI and net portfolio equity position, more than offset by a large negative position in portfolio debt instruments. Hence Canada’s IIP tends to improve in periods of strong global stock market performance and worsen during global stock market downturns. In terms of currency composition, Canada is ‘long” in foreign currency and “short” in domestic currency, as most other advanced economies, reflecting the fact that most external assets are foreign-currency-denominated while a sizable fraction of external liabilities are denominated in Canadian dollars. As a result, Canada’s net IIP tends to improve when the Canadian dollar depreciates and viceversa.
Canadian external position by sector
9. Canadian pension funds and mutual funds are the biggest holders of foreign portfolio assets, which account for over 20 percent of their total portfolio as of Q2 2011 (Table 2), while direct holdings of foreign portfolio instruments by banks and households are modest. The largest component of outward foreign direct investment is in finance and insurance, followed by mining and manufacturing. Finally, banks’ holdings are the largest component of other investment assets.
10. On the liability side, according to Canadian-source data nonresidents held about 17 percent of Canadian shares and 28 percent of outstanding bonds.3 Around 60 percent of Canadian bonds held by nonresidents are issued by the federal government, provincial governments, and public enterprises, with the remainder issued by private corporations. Foreign direct investment in Canada is concentrated in manufacturing and mining, followed by finance and insurance, and other investment liabilities reflect primarily cross-border borrowing by banks.
3 Data reported by partner countries suggests larger foreign holdings of Canadian equities (a share closer to 25 percent). See the discussion in the Appendix.

33
0
20
40
60
80
100
120
140
0
20
40
60
80
100
120
140
2007 2010
FX reservesOther investment assetsPortfolio debtPortfolio equityFDI abroad
Figure 4. Canada: Composition of External Assets and Liabilities(percent of GDP, 2007 and 2010)
Source: Statistics Canada.
0
20
40
60
80
100
120
140
0
20
40
60
80
100
120
140
2007 2010
Other investment liabilitiesPortfolio debt liabilitiesPortfolio equity liabilitiesFDI in reporting economy
Liabilities
Assets

34
Foreign portfolio
investmentTotal financial
assetsShare of
FPI
Households 66 2845 2.3Chartered banks 89 2419 3.7Nonfinancial corporations 12 1845 0.7Other private financial institutions 15 1193 1.2Trusteed pension plans 227 1042 21.8Mutual funds 188 787 24.0Provincial governments 21 534 3.8Government financial business enterprises 9 248 3.8Social security funds 53 196 27.1
All sectors 695 4579 15.2
Sources: Statistics Canada: National Balance Sheet Accounts.
Table 2. Share of Foreign Portfolio Investment in Total Financial Assets (Q2 2011, billions of Canadian dollars)
C. Bilateral Claims and Liabilities
11. This section presents a decomposition of Canada’s external position by financial trading partner (see Milesi-Ferretti, Strobbe, and Tamirisa, 2010 for a global view of bilateral financial linkages at the eve of the financial crisis). The decomposition can provide a rough measure of the sensitivity of Canada’s external balance sheets to shocks originating in different countries. A general caveat is, however, the absence of data on positions in derivatives, which makes it impossible to assess the extent to which cross-border positions are hedged. In light of the comprehensiveness of Canadian bilateral international investment statistics, the bilateral decomposition relies primarily on Canadian-source data. For example, Canada reports a bilateral international investment position vis-à-vis the United States by type of instrument. For other partner countries, the estimation of bilateral positions relies on Canadian data for Canadian FDI assets abroad, FDI in Canada, Canada’s portfolio investment assets, and Canada’s bank claims and liabilities. These data are complemented with partner-country data for Canada’s portfolio investment liabilities (from the IMF’s Coordinated Portfolio Investment Survey—CPIS), other investment assets and liabilities of Canadian nonbanks vis-à-vis foreign banks (from the Bank for International Settlements—BIS) and bilateral positions by instrument vis-à-vis Canada reported by the euro area. Additional details are provided in the Appendix.

35
12. Around half of Canadian external assets are vis-à-vis the United States, a share considerably lower than the share of exports (Figure 5). The largest portion of claims on the United States is in the form of portfolio equity, with FDI claims also significant (mostly in banking and insurance). Conversely, Canadian residents have lower holdings of U.S. debt securities, reflecting a more general orientation of their portfolio holdings towards equity instruments. Among remaining countries, three groups account each for around C$200bn or 10 percent of total Canadian claims: the euro area, and other advanced economies in Europe (such as the Sweden, Switzerland, and especially the United Kingdom), and the Caribbean and other small financial centers. The composition of claims on the euro area and advanced European countries is broadly similar to the composition of claims in the United States, while claims on Caribbean and small financial centers reflect mostly FDI. Claims on Asia and Pacific economies are around C$150bn (over half of which in portfolio equity claims), while claims vis-à-vis Central and Latin American countries are around C$70bn (with FDI accounting for over half of the total).
13. Over 60 percent of claims on Canada are held by U.S. residents (Figure 5). Claims from the euro area and other advanced European countries represent a significant portion of the remainder. For these countries, the majority of the claims are in the form of securities, with holdings of Canadian debt larger than holdings of Canadian equities, with sizable claims in the form of FDI as well. Asian and Pacific economies that report the geographical distribution of their portfolio claims hold about C$160bn in Canadian assets, most in the form of securities.4
14. Canada has net liabilities vis-à-vis the United States and advanced European economies (including the euro area), partly offset by net claims vis-à-vis the Caribbean and small financial centers as well as Central and Latin America (Figure 6). The negative net position vis-à-vis the United States reflects primarily the large holdings of Canadian equities and bonds by U.S. residents.
4 Total holdings of Canadian instruments from that region may well be higher, given that some large holders of foreign securities, such as China and Taiwan province of China, do not participate in the CPIS.

36
Figure 5. Canada External Assets and Liabilities, Bilateral Basis, 2010(Billions of Canadian dollars)
Sources: Fund staff estimates (see Appendix).
0
100
200
300
400
500
600
700
800
900
0
100
200
300
400
500
600
700
800
900
United States
Central and Latin
America
Caribbean and Small Financial Centers
Euro Area Other Advanced Europe
Other Europe
AUS, JPN, NZE
Other Asia and Pacific
FX ReservesOther investmentPortfolio debtPortfolio equityFDI
0
200
400
600
800
1,000
1,200
1,400
0
200
400
600
800
1,000
1,200
1,400
United States
Central and Latin
America
Caribbean and Small Financial Centers
Euro Area Other Advanced
Europe
Other Europe
AUS, JPN, NZE
Other Asia and Pacific
Other investmentPortfolio debtPortfolio equityFDI
Canadian Assets
Canadian Liabilities

37
Figure 6. Canada Net External Position, Bilateral Basis, 2010(Billions of Canadian dollars)
Sources: Fund staff estimates (see Appendix).
-400
-300
-200
-100
0
100
200
-400
-300
-200
-100
0
100
200
United States Central and Latin
America
Caribbean and Small Financial Centers
Euro Area Other Advanced
Europe
Other Europe AUS, JPN, NZE
Other Asia and Pacific
Other investment
Portfolio debt+reserves
Portfolio equity
FDI
D. Cross-Border Activity of Canadian Banks: A Consolidated Perspective
15. As noted earlier, statistics on external claims and liabilities based on the residence principle (balance of payments) understate the extent of cross-border activity of Canadian banks. For example, the “local” claims and liabilities of the affiliate of a Canadian bank in, say, the United States are not reflected in Canada’s IIP because the affiliate is considered a resident of the United States.5 Table 3 uses consolidated banking statistics by nationality to provide information on the geographical allocation of foreign claims by Canadian banks. These claims are divided into international claims (comprising cross-border claims and local claims in foreign currency) and local claims (claims in the country of residence of the affiliate or branch denominated in that country’s currency). The
5 The exception is the portion of the accumulated reinvested earnings of the U.S. affiliate channeled back to the parent. Claims and liabilities of the Canadian bank “parent” on the affiliate are classified as foreign direct investment by Canada in the United States. As of end-2010, Canadian chartered banks had FDI claims overseas totaling C$150 billion.

38
counterpart is reported both in terms of immediate borrower and in terms of ultimate risk (taking into account any risk transfer between the immediate borrower and a guarantor).
2007Q2 2011Q1 2007Q2 2011Q1 2007Q2 2011Q1
United States 388 586 110 106 278 481Euro Area 64 78 57 74 7 4Other advanced Europe 82 112 60 87 22 25Other Europe 2 2 2 2 0 0Carib. and small fin. ctrs. 40 39 34 29 5 10Central and Latin America 49 68 21 26 28 42Japan, Australia, New Zealand 20 33 9 22 11 11Other Asia 10 22 8 18 2 4Africa and Middle East 3 2 2 2 1 0
Total 662 952 307 375 355 577
United States 378 568 104 102 273 466Euro Area 74 94 61 88 13 6Other advanced Europe 80 114 38 53 43 61Other Europe 1 2 1 2 0 0Carib. and small fin. ctrs. 39 43 21 20 18 22Central and Latin America 48 68 10 15 38 52Japan, Australia, New Zealand 21 33 10 22 11 11Other Asia 10 22 6 15 4 7Africa and Middle East 3 2 3 2 0 0
Total 661 951 260 329 401 622
International claims
Table 3. Consolidated Claims of Canadian Banks by Nationality, 2007Q2 and 2011Q1(Billions of U.S. dollars)
Local claims
Sources: Bank for International Settlements and Fund staff calculations.
Foreign claims
Immediate Borrower
Ultimate Risk
16. Affiliates of Canadian banks have sizable “local” claims in the United States, which have expanded significantly relative to the pre-crisis period. These claims—booked in the United States and denominated in U.S. dollars—have increased by some C$200bn between 2007Q2 and 2011Q1, reflecting acquisitions of U.S. banks by Canadian financial institutions, and represent about half of total foreign claims by Canadian banks. Cross-border claims on the United States are instead considerably smaller. Claims on the euro area and other advanced European countries are mostly of a cross-border nature (indeed, cross-border claims on advanced European economies exceed those on the United States). The increase in cross-border claims on European economies explains almost the entirety of the expansion in Canadian banks’ cross-border claims on a consolidated basis since the pre-crisis period. However, the overall size of those claims remains modest if compared with total assets of Canadian banks (over C$3.1 trillion at end-March 2011). With regard to other

39
regions, Canadian banks’ local presence in other regions is particularly high in Central and Latin America (for example in Mexico, Chile, and Peru). In contrast, consolidated claims on offshore and small financial centers are smaller than locational statistics suggest, with the latter likely reflecting positions of Canadian banks vis-à-vis affiliates in such centers on-lent to other countries.
E. Conclusions
17. Canada’s extent of international financial integration has increased sharply over the past two decades, as in other advanced economies. External assets and liabilities are broadly in line with those in other non-European advanced economies, but remain much lower than in most European advanced economies, also reflecting smaller cross-border activity by Canadian banks on a residence basis. In the years since the crisis the expansion in the United States has been important for Canadian banks.
18. Canada has strong financial linkages to the United States. On a balance of payments basis, Canadian claims on the United States reflect portfolio holdings, primarily of equity instruments, mostly held by Canadian pension funds and mutual funds, as well as bank claims, both in the form of FDI and other cross-border claims. On a consolidated basis, claims of Canadian banks on U.S. residents are larger, reflecting a significant local presence of Canadian banks in the U.S. market. Overall, claims on U.S. residents account for under 20 percent of total claims by Canadian banks. Conversely, there is substantial U.S. investment in Canada, reflecting primarily large holdings of Canadian debt and equity securities. Indeed, U.S. source data indicates that Canada is the second largest destination for U.S. portfolio investment abroad, after the United Kingdom.
19. Canadian assets in advanced European countries reflect primarily equity-related claims (portfolio and FDI). On a consolidated basis, Canadian bank claims in advanced Europe were around C$200bn as of March 2011, reflecting a combination of claims on banks, nonbank private sector, and to a lesser extent government bonds (Table 4). These claims are primarily vis-à-vis United Kingdom borrowers, and to a lesser extent vis-à-vis France, Germany, and the Netherlands, with more modest exposures to Greece, Ireland, Italy, Portugal, and Spain.

40
Country Group Total Banks PublicNon-bank
Private
Total Developed Europe 209 78 57 74 Total Other Developed Countries (excluding Canada) 601 67 206 327 Offshore centers 43 4 5 33 Total Developing Countries 95 21 17 57 World 951 173 287 492
Sources: Bank of Canada and Statistics Canada.
Table 4. Foreign Claims of Canadian Banks by Sector of Borrower(Ultimate risk basis, 2011 Q1, billions of Canadian dollars)
20. In the current unsettled external environment, the main risks for the external portfolio of Canada would come from the global ramifications of financial distress in the euro area, as well as its U.S. exposure. Given the large trade and financial linkages, Canada is naturally exposed to U.S. shocks. While direct exposures of Canadian banks to the more vulnerable countries in the euro area are modest, indirect spillovers could be significant, operating through a decline in equity prices and higher funding costs for banks. Direct losses on the external portfolio for non-leveraged investors (for example, households and pension funds) would occur primarily through declining foreign equity values (for example, a 20 percent decline in the value of foreign equity holdings would imply a loss on Canadian equity claims overseas of some C$100bn, some 5½ percent of Canadian GDP). However, severe global financial market turbulence would likely imply more significant declines in Canadian wealth through domestic equity valuations and potentially house prices, as discussed in the Staff Report—particularly should turmoil propagate to U.S. financial markets.

41
REFERENCES
Lane, Philip R. and Gian Maria Milesi-Ferretti, 2011, “Cross-Border Investment in Small Financial Centers,” International Finance 14 No. 2, pp. 301–30.
Milesi-Ferretti, Gian Maria, Francesco Strobbe and Natalia Tamirisa, 2010, “Bilateral Cross-
Border Holdings and Global Imbalances: A View on the Eve of the Financial Crisis,” IMF Working Paper 10/257.

42
APPENDIX
DATA SOURCES AND ESTIMATION METHODS FOR BILATERAL CLAIMS AND LIABILITIES Foreign direct investment abroad. Bilateral data as provided in CANSIM Table 376-0051 (all countries).
Portfolio investment abroad, equity instruments. IMF, Coordinated Portfolio Investment Survey 2010 (Table 1.1 for Canada).
Portfolio investment abroad, debt instruments. IMF, Coordinated Portfolio Investment Survey 2010 (Table 1.2 for Canada).
Other investment assets. United States: bilateral international investment position vis-à-vis the United States (CANSIM). Euro Area: bilateral international investment position vis-à-vis Canada reported by the European Central Bank. For remaining countries:
Banks, bilateral BIS data on claims in the form of loans and deposits net of estimated
FDI abroad by Canadian banks.
Nonbanks: BIS data on bank liabilities vis-à-vis Canadian nonbanks reported by Canadian partner countries.
Foreign exchange reserves: United States: bilateral international investment position vis-à-vis the United States (CANSIM). Euro Area: share of reserves held in euros as reported in European Central Bank, 2011, “The International Role of the Euro.”
Foreign direct investment in Canada. Bilateral data as provided in CANSIM Table 376-0051 (all countries).
Portfolio investment in Canada, equity instruments. United States: bilateral international investment position vis-à-vis the United States (CANSIM). Other countries: 2010 holdings as reported by these countries in the IMF’s Coordinated Portfolio Investment Survey (Table 5.1 for Canada).
Portfolio investment in Canada, debt instruments: United States: bilateral international investment position vis-à-vis the United States (CANSIM). Other countries: 2010 holdings as reported by these countries in the IMF’s Coordinated Portfolio Investment Survey (Table 5.2 for Canada).

43
Other investment liabilities. For the United States, bilateral international investment position vis-à-vis the United States (CANSIM). For the euro area, bilateral international investment position vis-à-vis Canada reported by the European Central Bank. For remaining countries:
Banks, bilateral BIS data on liabilities of Canadian banks (locational basis) in the
form of loans and deposits.
Nonbanks: BIS data on bank assets vis-à-vis Canadian nonbanks reported by Canadian partner countries.
A. Data Issues In bilateral international investment statistics, discrepancies between data reported by different countries in the same country pair can be substantial (see Milesi-Ferretti et al., 2011, for a discussion). For Canada, reported total portfolio liabilities are lower than the portfolio claims on Canada reported by countries participating to the Coordinated Portfolio Investment Survey (the difference was some C$90 billion at end-2010), even though several countries with large investment in portfolio instruments through foreign exchange reserves, sovereign wealth funds, and investment fund activity (such as China, Saudi Arabia, the United Arab Emirates, and the Cayman Islands) do not participate in the survey or do so only partially. The reason for the discrepancy lies in portfolio equity liabilities, which are considerably lower than the portfolio equity claims on Canada reported by CPIS countries. For 2010 Canada reported portfolio equity liabilities of C$358 billion, of which C$318 billion vis-à-vis the United States. However, partner countries participating in the CPIS reported C$544 billion in portfolio equity claims on Canada, of which over C$400 billion reported by the United States.6 Conversely, Canada reports larger holdings of Canadian bonds by U.S. residents than the U.S. does.
B. Country Groups
Euro Area: Austria, Belgium, Cyprus, Finland, France, Germany, Greece, Ireland, Italy, Luxembourg, Malta, Netherlands, Portugal, Slovakia, Slovenia, Spain. Advanced Europe: Denmark, Iceland, Sweden, Switzerland, United Kingdom. Other European Countries: remaining European countries (also excluding those classified under “small financial centers” below).
6 The gap with the United States is even larger in 2010, with the Treasury survey of U.S. portfolio assets reporting over $400bn in equity claims on Canada, while Canada reports $318bn in liabilities vis-à-vis the United States.

44
Small Financial Centers: Bahamas, Barbados, Bermuda, British Virgin Islands, Cayman Islands; U.K. Channel Islands; Gibraltar; Liechtenstein; Macao S.A.R. of China; Mauritius; and others (see Lane and Milesi-Ferretti, 2011). Central and Latin America: Argentina, Belize, Bolivia, Brazil, Chile, Colombia, Costa Rica, Ecuador, El Salvador, French Guiana, Guatemala, Guyana, Honduras, Mexico, Nicaragua, Panama, Paraguay, Peru, Suriname, Uruguay, Venezuela. Other Asia: Asian and Pacific countries excluding Japan, Australia, New Zealand, and small financial centers.