can you spare some change for charity? · pdf filecan you spare some change for charity?...
TRANSCRIPT

ISSN 1178-2293 (Online)
University of Otago Economics Discussion Papers
No. 1318
November 2013
CAN YOU SPARE SOME CHANGE FOR CHARITY?
EXPERIMENTAL EVIDENCE ON VERBAL CUES AND
LOOSE CHANGE EFFECTS IN A DICTATOR GAME
David Fielding and Stephen Knowles
Address for correspondence: David Fielding/Stephen Knowles Department of Economics University of Otago PO Box 56 Dunedin NEW ZEALAND Email: [email protected] Email: [email protected] Telephone: 64 3 479 8653 / 64 3 479 8350
CAN YOU SPARE SOME CHANGE FOR CHARITY?
EXPERIMENTAL EVIDENCE ON VERBAL CUES AND
LOOSE CHANGE EFFECTS IN A DICTATOR GAME∗
David Fielding and Stephen Knowles
There is some evidence from field studies and natural experiments that levels of charitable
donation depend on the method in which donations are solicited. There is also some
experimental evidence that spending on private consumption depends on how much loose
change people have. We use a simple laboratory experiment to measure the effect on donor
choices of (i) whether the choices are presented verbally or non-verbally, and (ii) whether the
participants have a large amount of loose change. We find strong evidence for both effects.
These effects may explain some of the variation in the average level of generosity found in
different Dictator Game results, and why laboratory experiments elicit levels of generosity
that are often much higher than in non-laboratory settings.
Key words: charitable giving; Dictator Game; power of asking; loose change effects
JEL classification: C91; D64
∗ Corresponding author: David Fielding, Department of Economics, University of Otago, Dunedin 9054,
New Zealand. We are grateful to Reece Pomeroy and Robbie Bell for their invaluable work as research assistants on this
project, and to Phillip Hall and Maroš Servátka for helpful suggestions on our experimental design.
1
Most laboratory experiments on altruistic behaviour – such as Fehr and Schmidt (1999),
Bolton and Ockenfels, (2000) and Andreoni and Miller (2002) – find significant levels of
altruism and inequality aversion, which is a puzzle when charitable giving in industrialized
countries represents only 1-2% of income (Andreoni, 2006). In this paper we present results
from an experiment designed to shed light on this difference, with treatments in which we
vary (i) the amount of verbal communication between the experimenters and the participants
and (ii) the means of payment available to participants wishing to make a donation.
One common characteristic of many laboratory experiments is that written
instructions to participants are reinforced by verbal instructions read out by the
experimenters. Verbal invitations to consider making a charitable donation do have an
analogue outside of the laboratory, in the form of door-to-door collections or telephone
campaigns. However, much of the communication by charitable organizations to the wider
population is in written form, through on-line or newspaper advertisements, or through mail
campaigns. One possible explanation for high levels of altruism in the laboratory is that
verbal communication elicits altruism more readily than visual or written communication,
even when the donor’s decision is anonymous. One theory of the evolution of spoken
language is that it developed out of a need to co-ordinate mutually beneficial actions
(Tomasello, 2008), and it is possible that speech is associated with neural mechanisms that
also have a role to play in empathy. Gazzola et al. (2006) find that certain areas of the brain
respond both during the execution of an action and when hearing sounds associated with that
action, an example of “mirror neuron” activity (Kohler et al., 2002) thought to be important
both in language acquisition and in the expression of empathy. Gazzola et al. report that
auditory mirror neuron activity is stronger in subjects who score more highly on an empathy
scale. We conduct an experiment to test whether verbal communication elicits more
2
generosity than visual communication, maintaining donor anonymity in both treatments, and
find a very large verbal communication effect.
A second characteristic of many laboratory experiments on altruism is that at least
some of the payment to participants is in the form of small denomination units, partly so that
their choice about how much to donate is from a wide range of options. There is evidence that
people’s propensity to consume sometimes depends on how much loose change they have
(Raghubir and Srivastava, 2009; Vandoros, 2013), and we design a second treatment to
measure the effect of this “loose change effect” on individual generosity. Again we find a
large effect.
1. Literature Review
1.1. The power of asking: field studies and survey data
Our paper relates to a wider literature, based on household survey data and donation data
from specific charities, which finds that asking for donations (either verbally or in writing)
does have an effect. For example, Yörük (2009) finds evidence from the US Survey of
Giving and Volunteering that asking someone for a charitable donation significantly
increases the propensity to donate. (The probability of being asked could be endogenous to an
individual’s inherent level of generosity, but a significant effect appears even when Yörük
uses an IV estimator.1) Similarly, Leslie and Ramey (1988) and Gottfried and Johnston
(2006) find a positive correlation between total donations received by US universities and the
amount of solicitation, at least for some types of donor.2
Another branch of the literature explores whether there are diminishing returns to
asking (Diamond and Noble, 2001), and even a turning point beyond which donors become 1 However, it is possible that in such surveys people overestimate how much money they have given to
charity. The average donation in Yörük’s data is higher than the average in data from other sources. 2 As noted by Meer and Rosen (2011), there is a possible endogeneity problem here too: universities with
more resources may be able to approach more alumni.
3
so irritated by requests that their generosity is reduced. Van Diepen et al. (2009a,b) address
this question using individual-level data on donations to Dutch charities and the number of
letters the donors receive. The authors use both a field experiment (with random variation in
the number of letters sent to each donor) and statistical modelling of historical data provided
by some of the charities. Results from the field experiment indicate that increasing the
number of letters does increase the amount of irritation expressed by the donors, but this
irritation is not correlated with the level of generosity. However, results from the statistical
model indicate that the return to a given letter is negatively correlated with the number of
previous letters, at least in the short run.
More directly related to our work are the studies which explore the effect of different
types of solicitation on the level of generosity. For example, Schervish and Havens (1997)
analyze survey data in the Survey of Giving and Volunteering, finding that verbal requests
from people the donor knows personally tend to increase donations, while verbal requests
from strangers (for example in telephone calls or door-to-door collections) tend to reduce
donations. Meer (2011) finds a similar result using university donation data. Meer and Rosen
(2011) take advantage of a natural experiment to explore whether telephone calls are a more
effective means of solicitation than e-mails. Volunteers making calls on behalf of a particular
university are given an alphabetical list of alumni, but often do not reach the bottom of the
list in the time allocated; the remainder of alumni receive only an e-mail. The significantly
lower number of donations from alumni with surnames towards the end of the alphabet
indicates that the verbal request makes a difference. In addition, several studies report the
results of field experiments on the method of solicitation. These studies include Landry et al.
(2006), who find that donations are positively correlated with the physical attractiveness of
the volunteer making the verbal request, and Andreoni et al. (2011), who conduct an
experiment using street collectors positioned at entrances to a supermarket and ringing a bell
4
as part of a regular fund-raising event. When the bell ringing, which is a normal part of the
event, is accompanied by a verbal request which is not normally part of the event (“Hi, how
are you? Merry Christmas: please give today”), there is a 65% increase in donations.3
1.2. The power of asking: a laboratory experiment
There is no existing laboratory study on the power of asking in the context of charitable
donations, and the results of laboratory experiments on charity (such as ours) are not directly
comparable with the results of field studies.4 However, there is one laboratory study of the
power of asking: Andreoni and Rao (2011). This study is based on a standard Dictator Game,
with no communication between participants, plus four treatments in which some
communication is permitted. There is an Ask treatment in which the game begins with the
Recipient sending a written message to the Dictator that includes a request for a certain
amount of money, and an Explain treatment in which the Dictator’s transfer to the Recipient
is accompanied by a message with an explicit statement of how much money is being
transferred. There is also an Ask then Explain treatment which combines the Ask and Explain
messages, and an Explain then Ask treatment in which the Dictator first sends a message
explaining how much she plans to send, then the Recipient responds as in the Ask treatment, 3 Field experiments are also used explore the effect of financial mechanisms designed to increase
donations, such as seed money and announcing the existence of a lead donor. Examples include List and
Lucking-Reiley (2002) and Huck and Rasul (2011). Since these studies do not vary the manner in which
requests are made, they are less directly relevant to our work. 4 There are two existing studies of charitable giving that compare laboratory and field results, although
they do not investigate communication effects directly: Benz and Meier (2008) and Carlsson et al. (2013).
Benz and Meier find that university students are more likely to give to a certain set of charities when
invited to do so in a Dictator Game than when they are invited to do so while paying their tuition fees each
semester. Here the laboratory versus field effect may be confounded by the fact that the Dictator Game
earnings are a windfall gain, so Carlsson et al. use a 2 × 2 design to test for both the windfall effect and
the laboratory versus field effect. They find that generosity is significantly higher when the income is a
windfall rather than earned, but in addition, generosity is significantly higher in the laboratory than in the
field.
5
and then finally the Dictator decides how much money to transfer. Andreoni and Rao find
that transfers are higher in the Ask treatment than in either the standard Dictator Game or the
Explain treatment. However, transfers are highest in the two treatments allowing two-way
communication. There are some similarities between Adreoni and Rao’s experiment and our
own. However, our experiment differs from theirs in two main ways: (i) it involves charitable
donations rather than Dictator Game transfers between participants; (ii) our treatments are
specifically designed to explore the effect of verbal versus visual communication on the level
of generosity.
1.3. Loose change
The loose change literature focuses on spending habits rather than on charitable giving.5
Loose change effects could arise in two different ways. The first is termed a “bias for the
whole” (Mishra et al., 2006) or a “denomination effect” (Raghubir and Srivastava, 2009): this
is when the propensity to spend money depends on whether the money is held as a single
large unit (for example, a $20 note) or as a bundle of smaller units (for example, four $5
notes). The second arises when people have a preference for holding a given sum of money in
notes rather than coins (Vandoros, 2013).
Mishra et al. (2006) argue that a bias for the whole arises from greater processing
fluency of the whole compared with the part – for example, one $20 note is more clearly
recognizable as $20 than are four $5 notes – and present survey data consistent with this
5 Some experimental results on charitable giving are suggestive of a loose change effect. For example, in
Brown et al. (2013), which is about whether people prefer to give time or money, participants earn an
amount which depends on how well they complete a manual task. In one treatment they cannot donate any
money to charity until they have completed the task, and in this case many participants choose to donate
coins but keep notes for themselves. In Etang et al. (2012), participants are paid $20 made up of a $10
note, $5 note, two $2 coins and a $1 coin, and then invited to donate some or all of the payment to charity.
Among participants choosing to donate anything the modal donation is $5, and the vast majority of those
giving $5 use all of their coins.
6
hypothesis. Raghubir and Srivastava (2009) argue that people place large denominations in a
“real money” mental account and smaller denominations in a “petty cash” mental account
(Heath and Soll, 1996). Those people who know they are likely to overspend may prefer
holding large denominations as a commitment device to limit their spending. However, if this
commitment device fails and people do spend the money, then there is a “what-the-hell”
effect with more spending than in the absence of any attempt at pre-commitment. Raghubir
and Srivistava conduct three separate field experiments with large denomination and small
denomination treatments, finding that in all three cases spending is higher with small
denominations.6 In two out of three of the experiments, those individuals who do spend any
money at all spend more in the large denomination treatment, which is consistent with a
what-the-hell effect.7
Vandoros (2013) explores whether people have a preference for holding notes rather
than coins. This might be because coins are heavier and bulkier, or because they are more
likely to make a noise in one’s pocket, or because they are easier to lose, or because notes can
be folded and kept more easily in a wallet. In the first of two field experiments, subjects are
approached in a London park and asked to complete a survey for which they will be paid £5.
Having completed the survey, they are given the option of a £5 note or £5.10 made up of £1,
50p, 20p and 10p coins. About half the subjects choose the note, but those with a higher
reported income and those carrying a bag or purse are more likely to choose the coins. In the
second experiment, people leaving a store are asked to take part in the same survey, and then
6 Of the three field experiments, the one most relevant to our study involves drivers at a gas station being
paid either five $1 notes, five 1$ coins, or one $5 note. In principle these treatments could be used to
distinguish a coins-versus-notes effect from a denomination effect. However, as the authors note, the coin
treatment is confounded by the fact that such coins are uncommon in the US and might be valuable as
souvenirs. In fact, spending is lowest in the coin treatment. 7 Raghubir and Srivastava (2009) also report results from a number of survey-based studies which confirm
their hypothesis that individuals choose larger denominations in cases where self-control is required.

7
randomly paid one of the same two cash endowments as in the first experiment. Subjects paid
in coins are more likely to make a purchase from the store before leaving than those paid the
note, which is consistent with a loose change effect.
2. Experimental Design
2.1. Overview
Some of the field studies and natural experiments discussed in section 1.1 suggest that the
form in which a request is made can affect the donor’s level of generosity. One key
distinction is between verbal requests (for example, telephone calls to alumni) and visual /
written ones (for example, letters to alumni). The advantage of studying this effect in the
laboratory is that we can design treatments that are unaffected by extraneous conditions (for
example, letters mostly being opened in the morning over breakfast and telephone calls
mostly being made in the evening after dinner). We can also use a double-blind protocol that
removes the possibility of verbal requests eliciting more generosity because the participant
does not wish to appear selfish in front of an interlocutor. In addition, we can include
treatments with more or less loose change in order to test whether loose change effects apply
to charitable donations as well as to spending on personal consumption. Our experimental
design differs slightly from the design of the experiments discussed in section 1.3, because
we wished to mirror a standard Dictator Game in which participants can choose from a wide
range of different possible transfers. Therefore, all our participants were given some loose
change, but some were given more than others. We used a 2 × 2 design to test the following
hypotheses:
A. Verbal invitations to consider a charitable donation elicit more generosity than visual
ones.
B. Having more loose change raises the level of generosity.

8
Among the four treatments, the Standard Less Change treatment (SLC) took the form of a
standard Dictator Game. The participants, all of whom were students at a New Zealand
university, were paid $19 for taking part in a survey on spending habits. They were then
verbally invited to consider donating some of their payment to a particular charity. In the
Donation Box Less Change treatment (DBLC), participants did not hear any verbal invitation.
Instead, they were asked to place their completed surveys in a box outside the room, and a
donation box for the charity was placed next to the survey box. In this way, the invitation to
consider a charitable donation took the form of a visual cue. In these first two treatments, the
participants’ $19 payment was made up of one $10 note, one $5 note, one $2 coin and two $1
coins.8 This meant that participants were able to donate any whole dollar amount between
zero and $19. The Standard More Change treatment (SMC) was the same as SLC, except that
the $19 payment was made up of one $10 note, three $2 coins and three $1 coins. The
Donation Box More Loose Change treatment (DBMC) was the same as DBLC, but with the
$19 payment being made up in the same way as in SMC. We refer to SLC and SMC
collectively as the “standard” treatments and to DBLC and DBMC as the “donation box”
treatments. Note that all participants received $19, but the payments to participants in SMC
and DBMC included a larger proportion of coins and a smaller proportion of notes. We chose
to pay participants $19 and not $20 so as to avoid questions about why the payment wasn’t
made up of just one $20 note. We test Hypothesis A by comparing donations in SLC (SMC)
with those in DBLC (DBMC); we test Hypothesis B by comparing donations in SLC (DBLC)
with those in SMC (DBMC).9
8 In New Zealand, the smallest denomination note is the $5 note. At the time of the experiment, one New
Zealand dollar was worth about 0.8 US dollars. 9 The sessions were run on two different days. On the morning of the first day we ran the four sessions for
the donation box treatments. We determined by the toss of a coin whether to hold DBLC or DBMC at 9am,
with the other treatment being held at 10am, and followed the same process to determine which treatment
9
2.2. The research location
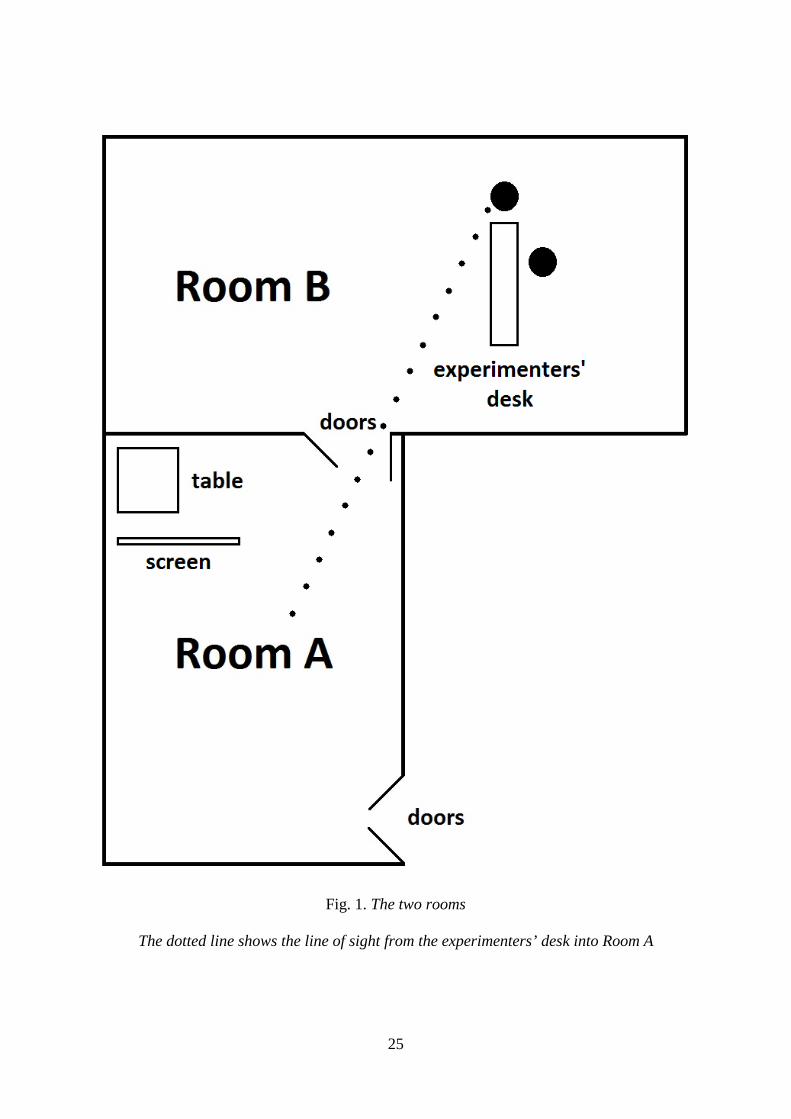
Participants completed the survey and decision-making tasks in the room designated “Room
B” in Figure 1. Each participant sat at a separate desk, so written answers to the survey and
decision-making tasks were anonymous. Entry into Room B is via the room designated
“Room A” in Figure 1. Note that there is only one entrance to Room A and only one set of
doors connecting Room A to Room B. Using these two rooms enabled us to place the survey
box and donation box on a table in a corner of Room A which could not be seen by anyone in
Room B. We also placed a screen next to the table, so that survey and donation boxes could
not be seen by anyone standing in the corridor outside Room A. Note that although a
participant standing alone at the table in Room A could not be seen by anyone else, the
experimenters could see when the participant left Room A.10 This was important in ensuring
that only one participant at a time was in Room A.
2.3. Recruitment of participants
Lectures and tutorials at the university are held on the hour and last for 50 minutes. In order
to fit in with participants’ timetables, it made sense to hold research sessions on the hour. We
needed to make sure that participants from one session had left before participants for the
to hold at 11am and which at 12 noon. There were a roughly equal proportion of men and women in DBLC
and DBMC. On the afternoon of the first day we ran one session for each of the standard treatments, again
determining by the toss of a coin which of the two treatments was held at 2pm and which at 3pm. The
remaining two standard treatment sessions were held two days later at 9am and 10am. We had observed
that in the first two standard treatment sessions the majority of SMC participants were women. Some
previous research suggests that altruism is correlated with gender (Carpenter et al., 2008; de Oliveira et al.,
2011), so on the final day we chose the session with more women as the SLC session, ensuring a roughly
equal proportion of men and women across SMC and SLC. 10 Figure 1 shows the position of the experimenters’ desk in Room B. It was the experimenter sitting on the
short side of the desk who watched to see when subjects had left Room A. As indicated by the dotted line
in the figure, the experimenter could see when subjects left the room, but could not see the table in Room
A. Participants were seated at desks in the left-hand side of Room B, so they could not see the table in
Room A either.

10
next session arrived, and to give ourselves time to prepare for the next session, so each
session needed to last no longer than 40 minutes.11 As will become clear, it was necessary for
participants to leave the rooms at approximately one minute intervals. Given these
constraints, it was decided to have 16 participants per session, with two sessions per
treatment. Based on previous experience, we expected the attendance rate at sessions to be
below 100%, so we aimed to recruit 22 participants per session.
Participants were recruited from a number of first and second year classes in
economics or business statistics at the university. A brief announcement was made at the
beginning of class, and a follow-up e-mail was sent to students in each class. A copy of the e-
mail is included in the Appendix. The e-mail informed students that they would be paid $19
for completing a survey on spending habits and for completing a small number of decision
making tasks, and that this would take no longer than 50 minutes. Students wishing to take
part were asked to e-mail a Research Assistant. The Research Assistant randomly assigned
students to a session,12 and e-mailed students to let them know the session to which they had
been assigned. A reminder e-mail was sent out the day before the session.
On arrival outside Room A, the participants were met by a Research Assistant who
signed them in and asked them to take a seat in Room B, where the two experimenters were
waiting. Once 16 participants had arrived, the doors between Rooms A and B were closed.
Any additional participants turning up were paid $19 but did not take part in the experiment.
11 The sessions were advertised as lasting no longer than 50 minutes. As it turned out, sessions typically
lasted 35-40 minutes. 12 Participants had been asked to let the Research Assistant know which sessions they were able to attend.
Participants who were only available for one session were allocated to that session. Participants who were
available for more than one session were randomly assigned to one of these sessions using the random
number generator in Excel.
11
2.4. The survey and written decision-making tasks
Participants were welcomed and asked to read an information sheet about the research. They
were then asked to sign a consent form, and told that at the end of the session they would be
invited one at a time to come up the experimenters’ desk to receive their payment and sign a
receipt. Next, they were given 15 minutes to complete the survey and written decision-
making tasks. The survey and tasks were completed using pen and paper. Participants in all
treatments completed the same survey and written decision-making tasks, copies of which are
included in the Appendix, along with a copy of the instructions read out be the experimenters.
The survey included questions about participants’ recent spending habits and a few socio-
demographic questions (for example, gender; age; intended major subject), and was followed
by the written decision-making tasks. In the first task, participants were asked who and what
they would take with them, if they were to spend a week on a tropical island. In the second
task, participants were given a list of items that might be useful for surviving after a plane
crash in a remote location, and asked to choose the most important. The need to complete
these tasks before being paid meant that the participants had earned their payment through
effort, although payment was not contingent on the answers they gave. In the donation box
treatments, participants did not realise that there was a third decision-making task – about a
charitable donation – until they had left Room B.13
While the survey was being completed, one of the experimenters remained in Room
B. The other experimenter left the room for a few minutes and placed the survey box (and in
the donation box treatments the donation box) on the table in Room A. When the
experimenter returned, the doors between Room A and Room B were opened. One of the
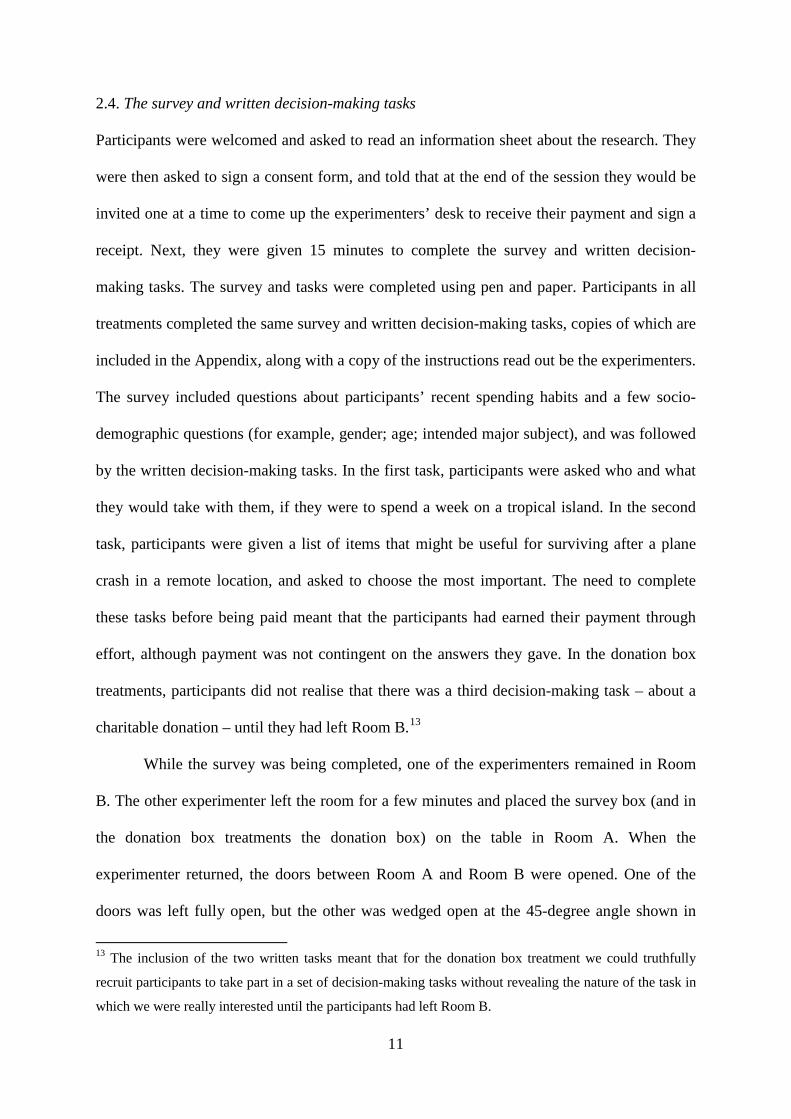
doors was left fully open, but the other was wedged open at the 45-degree angle shown in
13 The inclusion of the two written tasks meant that for the donation box treatment we could truthfully
recruit participants to take part in a set of decision-making tasks without revealing the nature of the task in
which we were really interested until the participants had left Room B.
12
Figure 1. This ensured that no-one in Room B could see within two metres of the table in
Room A. At the end of the 15 minutes, participants were asked to place their completed
survey in the brown envelope on the desk in front of them. It was explained to participants
that a red box had been placed on the table in the corner of Room A (described to participants
as “the room next door”), and that once they had received their payment they should place the
brown envelope in this red box as they left. What happened next differs across treatments.
2.5. The standard treatments
Participants were told that they would now be given the opportunity to make a charitable
donation by giving part or all of their $19 payment to World Vision New Zealand, which
would then be forwarded to the charity; the precise wording used appears in the Appendix.
(We did not provide any additional information about the charity, because we did not want
participants in the standard treatments to have more information about the charity than those
in the donation box treatments. However, World Vision is the largest international
development charity in New Zealand, especially well known for its advocacy work with high
school students.) It was then explained that when they came to the front to receive their
payment, each participant would be given a blue envelope. If they wished to donate any
money to World Vision, they should wait until they were in Room A before placing their
donation in the blue envelope. The blue envelope should then be placed in the same box as
the survey. If they did not wish to make a donation (and they were under no obligation to do
so), they were to place the empty blue envelope in the survey box. There was a space on the
front of the blue envelope to indicate how much, if anything, they had donated, and
participants were asked to fill this in, once they were in Room A. Although our procedures
ensured a double-blind protocol, we did not say this explicitly during the experiment, because
we could not say this in the donation box treatments. However, the recruitment e-mail and
13
information sheet both assured participants that whatever decisions they made would be
completely anonymous.
The participants then came one at a time to the experimenters’ desk to receive their
payment. At this stage some music (the beginning of Glenn Gould’s recording of the Bach
Goldberg Variations) was played so that the participants remaining in Room B could not hear
what the participant in Room A was doing. Once at the experimenters’ desk, participants
were asked to choose a white envelope from a larger manila envelope, with all envelopes
containing $19. They were asked to open the envelope and check that it contained $19. Once
they had confirmed that the amount of money in the envelope was correct, they were asked to
sign a receipt. They then went through to Room A to place both their brown envelope
(containing their completed survey) and blue envelope (containing any donation) in the red
survey box. The experimenter who had read the instructions also made the payments. The
other experimenter was sitting to the side of the desk and could see when participants had left
Room A.14 On the small number of occasions when a participant was ready to leave Room B
before the previous one had left Room A, a discrete signal was made to the first
experimenter, who briefly engaged the participant at the desk in conversation.
2.6. The donation box treatments
The protocols for the donation box treatments were the same as for the standard treatments
except that the opportunity to make a charitable donation was not verbalized; instead, there
was just a visual cue. A donation box for World Vision was placed beside the red box for the
survey envelopes. It is extremely unlikely that any participant would have failed to see the
donation box or to have realized what it was. The donation box was identical to those
14 In each session one of the experimenters read the instructions and distributed payments, while the other
was responsible for checking that Room A was empty before the next subject was allowed to leave Room
B. The experimenters’ roles were reversed for the second session of each treatment.
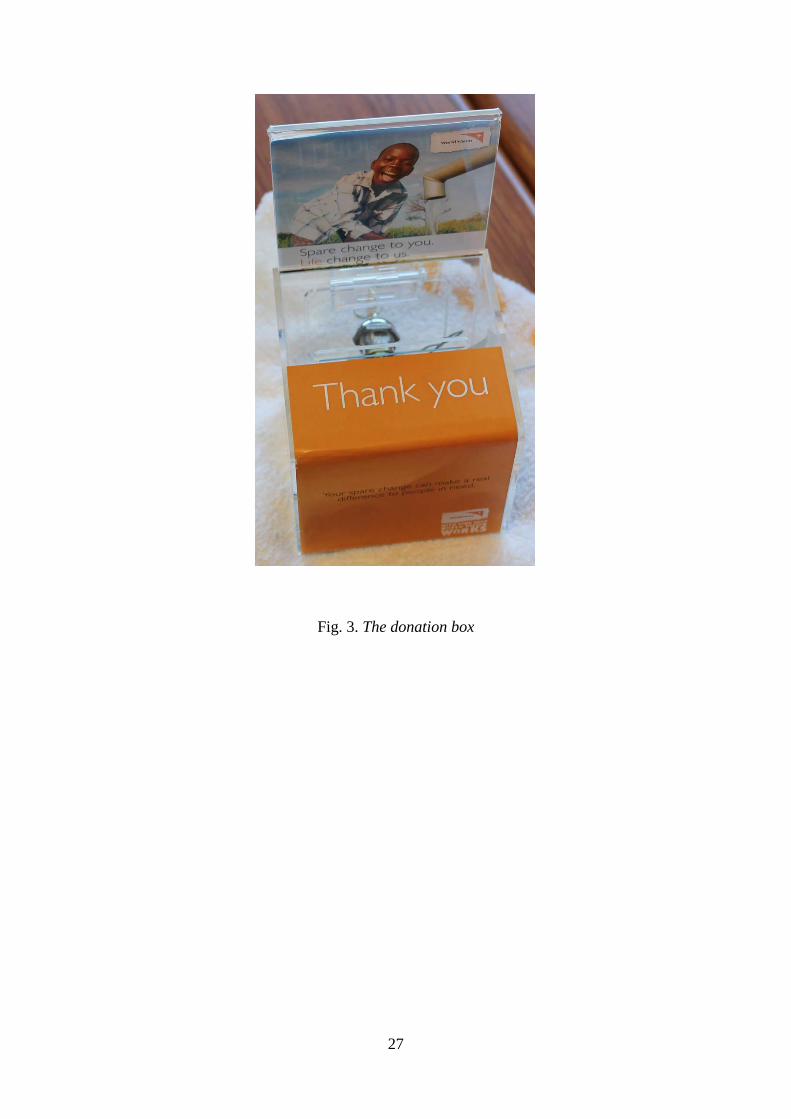
14
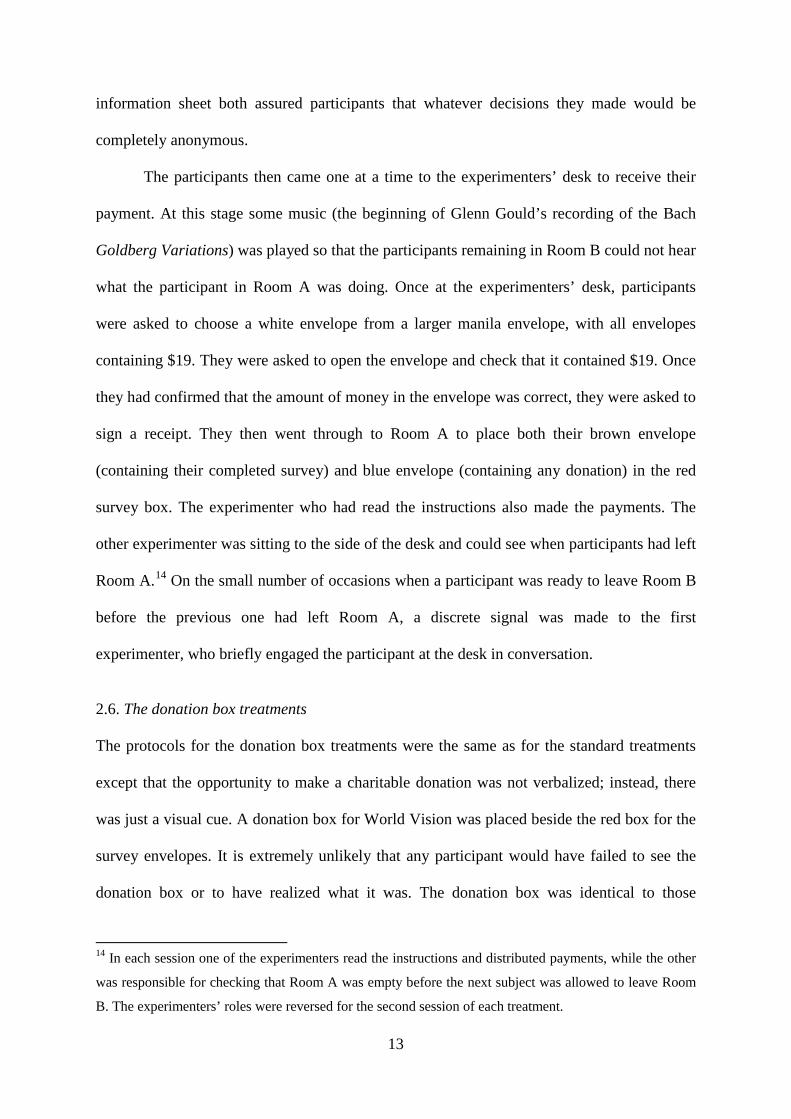
regularly seen in New Zealand stores. It was transparent, and was partly filled with the same
number of notes and coins before each session. A sticker on the front of the box displayed the
charity’s name and logo, including the words, “Thank you. Your spare change can make a
real difference to people in need.” A card attached to the top of the box showed a photograph
of a child next to the slogan, “Spare change to you. Life change to us,” along with the
charity’s name and logo.15 The donation box was padlocked and wired to a leg of the table, in
order to minimize any concern participants might have had about the box being stolen. A
folded towel was placed under the box, in order to dampen the sound of coins being dropped
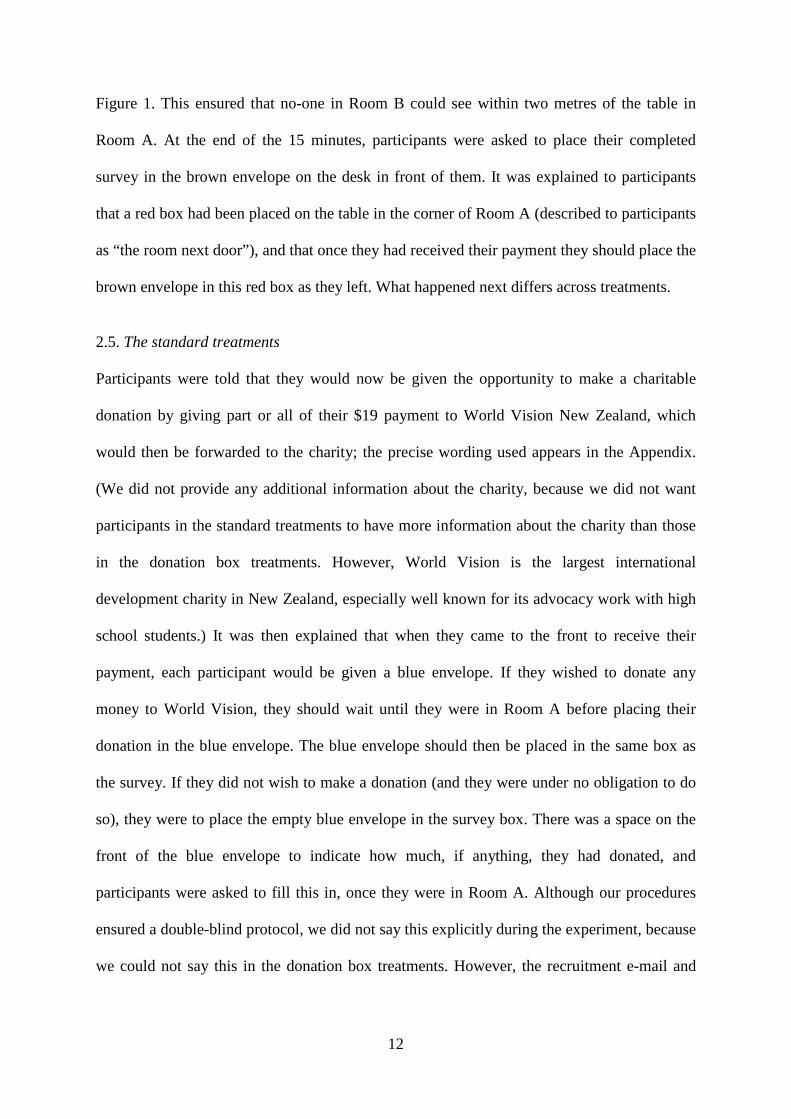
into it. Figure 2 shows a photograph of the donation box next to the survey box; this is the
view participants would have had after walking around the half open door from Room B into
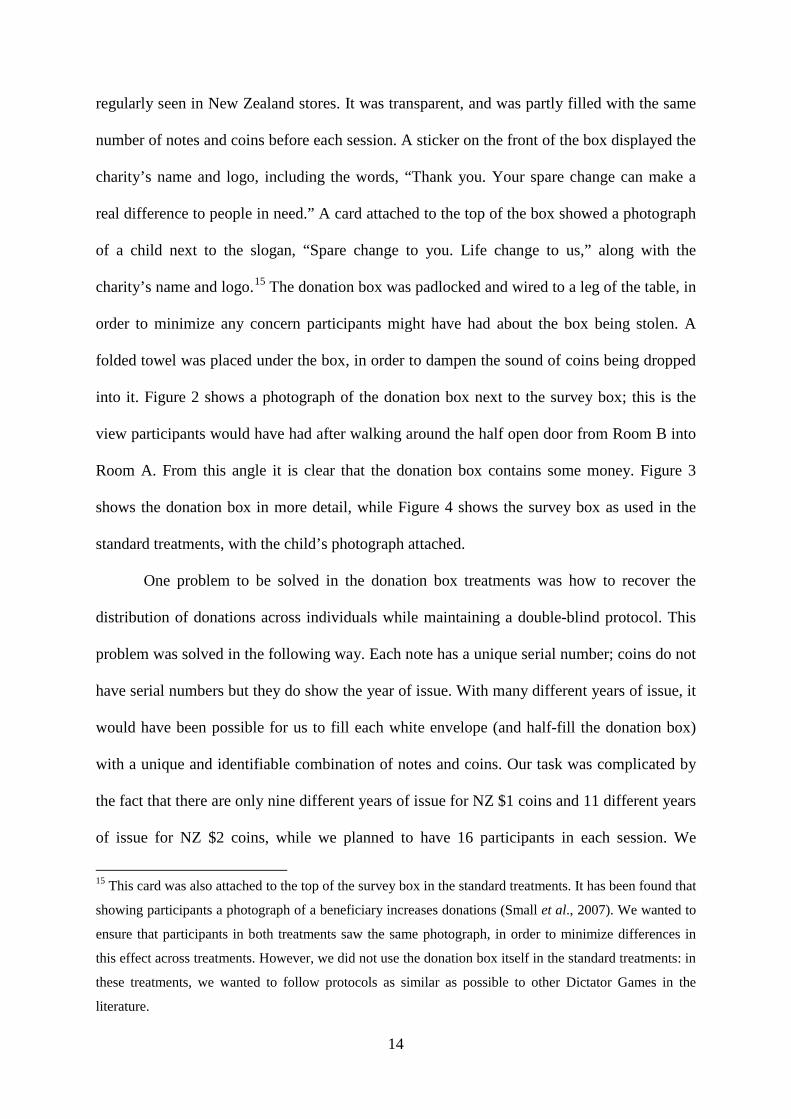
Room A. From this angle it is clear that the donation box contains some money. Figure 3
shows the donation box in more detail, while Figure 4 shows the survey box as used in the
standard treatments, with the child’s photograph attached.
One problem to be solved in the donation box treatments was how to recover the
distribution of donations across individuals while maintaining a double-blind protocol. This
problem was solved in the following way. Each note has a unique serial number; coins do not
have serial numbers but they do show the year of issue. With many different years of issue, it
would have been possible for us to fill each white envelope (and half-fill the donation box)
with a unique and identifiable combination of notes and coins. Our task was complicated by
the fact that there are only nine different years of issue for NZ $1 coins and 11 different years
of issue for NZ $2 coins, while we planned to have 16 participants in each session. We
15 This card was also attached to the top of the survey box in the standard treatments. It has been found that
showing participants a photograph of a beneficiary increases donations (Small et al., 2007). We wanted to
ensure that participants in both treatments saw the same photograph, in order to minimize differences in
this effect across treatments. However, we did not use the donation box itself in the standard treatments: in
these treatments, we wanted to follow protocols as similar as possible to other Dictator Games in the
literature.
15
created the necessary variation across coins by polishing one or both sides of each $2 coin
and polishing different segments around the edges of the $1 coins.16 Polishing all of coins
also allowed us to check whether any of the participants had donated coins other than the
ones we had given them (which was not the case).
One possible concern in the donation box treatment is that the last participant to leave
Room B may have assumed that the money in the box had been put there by participants
leaving earlier. In this case, different participants may have been subject to different framing
effects. This would be consistent with results reported in Alpizar et al. (2008), who show that
people’s donations can be influenced by information about what others have donated. In
order to mitigate this concern, we made sure that at the beginning of each session there were
more notes and coins in the donation box than could have been put there by the participants.
Also, in each session we placed the white envelopes in two different manila envelopes, one
for the first eight participants to leave and one for the second eight. In this way, we could
check whether donations by the first eight were significantly different from donations by the
second eight, while maintaining anonymity by allowing each participant to choose an
unmarked white envelope.17
3. Results
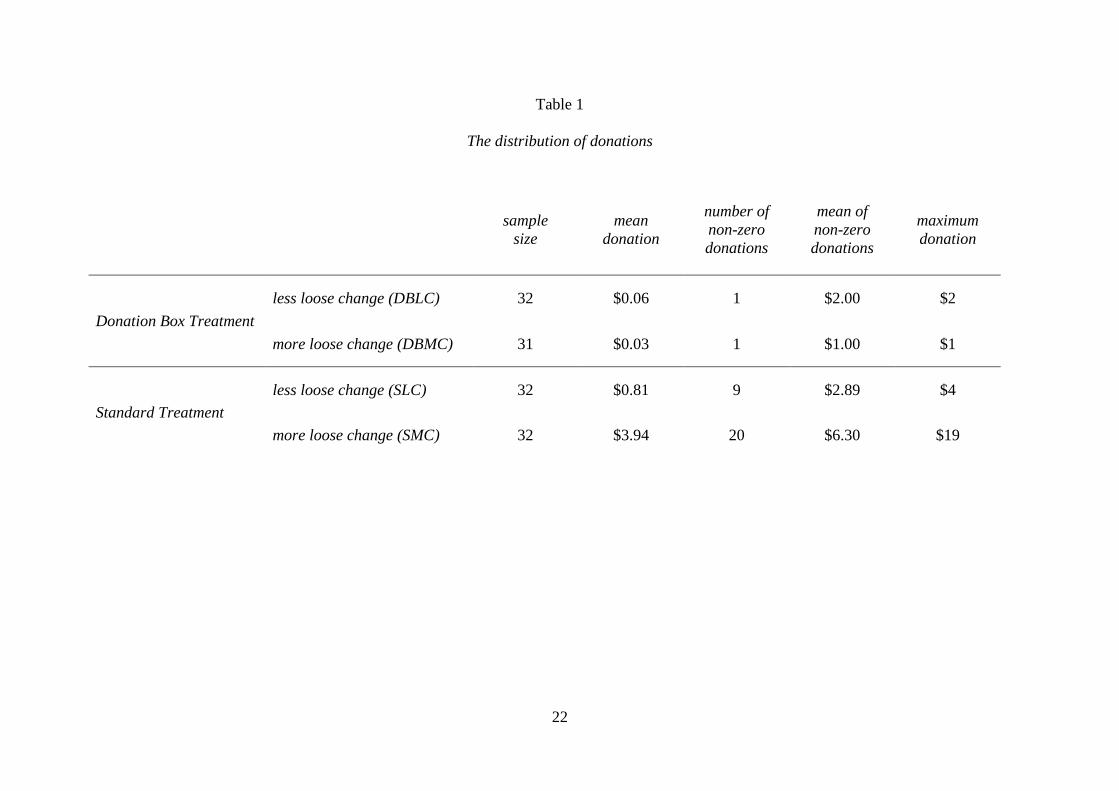
Table 1 reports summary statistics for donations under each of the four treatments. Note that
we only have 31 observations in DBMC, because one participant failed to hand in the survey
16 The edge of the $2 coin is serrated. The edge of the $1 coin has four alternate smooth and serrated
sections. We polished one or two of the four smooth sections around the edge of each $1 coin, using
different patterns in relation to the Queen’s head on the front. 17 For consistency we also used two manila envelopes in the standard treatments. Note that our protocols
did not allow us to match participants’ survey responses to the amount donated. We could have done this
in the standard treatments by having participants place their donation in the same envelope as their survey,
but no analogous method was possible in the donation box treatments.
16
form;18 in the other three treatments we have 32 observations. Statistics for individual
sessions within each treatment are not shown: in no case is there any significant intra-
treatment difference in the distribution of donations (p > 0.25 in all cases). This suggests that
there are no experimenter effects, or differences in donations due to the day or time of
particular sessions.
The most striking feature of Table 1 is the very large difference between the donation
box treatments and the standard treatments. Only two out of the 63 participants in the
donation box treatments gave any money at all: there was a single $2 coin donation in DBLC
and a single $1 coin donation in DBMC.19 By contrast, nine participants in SLC and 20
participants in SMC made some donation; overall, the mean donation in SLC was $0.81 while
the mean donation in SMC was $3.94.20 In other words, the verbal invitation to consider a
donation raised the level of generosity from almost zero to a substantial fraction of the
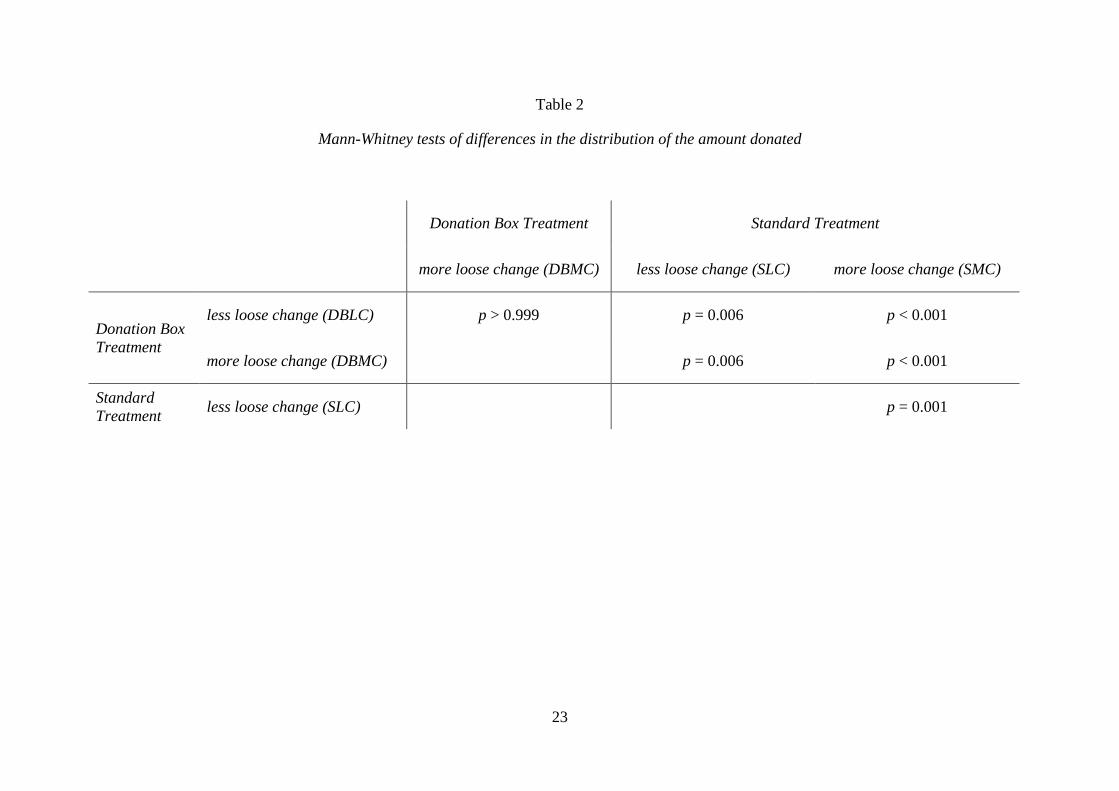
endowment, and this effect was greater when participants had more loose change. Tables 2-3
report tests of the level of significance of the differences across the treatments: Table 2 shows
Mann-Whitney tests for differences in distribution of the amount donated, while Table 3
shows Fisher exact tests for the number of participants making a donation. Of course there is
no significant difference between DBLC and DBMC, but in all other cases the differences are
significant at the 5% level (in fact the largest p-value is 0.013). In other words, the verbal
invitation to consider making a donation had a significant effect, and when the verbal
invitation was accompanied by more loose change this effect was significantly greater. 18 The participant failed to follow instructions and left Room A without even looking towards the table. 19 Therefore, the care we took to facilitate the recovery of the donation distributions in the donation box
treatments turned out to be unnecessary. 20 The average donation across the standard treatments represents 12.5% of a participant’s endowment.
This is lower than in some other Dictator Games in which the recipient is a charity, but is very similar to
Reinstein and Reiner’s (2012) “performance / cash” treatment. As in our standard treatment, the
performance / cash treatment has a strict double-blind protocol, participants are not paid a show-up fee,
they have to earn their endowment, and they are paid before making a donation decision.
17
Since all participants were given some coins, we might have expected the number of
people making a donation to be similar across the two standard treatments. However, paying
participants more loose change increased not only the average donation conditional on
donating, but also doubled the number of participants making a donation. One possible
explanation for this is that people are happy to hold some coins, but not too many. Note that
the majority of people who donated money kept some coins for themselves. Of the nine
people who donated some money in SLC, three gave their full $4 endowment of coins, but six
gave only some of the coins. In SMC, three out of the 20 participants making a donation gave
the full $19, two gave their full $9 endowment of coins but kept the $10 note, and 15 gave
some of the coins but kept the rest.
4. Summary and Conclusion
A simple laboratory experiment on charitable giving produces some stark results: although a
verbal invitation to consider making a donation produces a level of generosity similar to those
found in previous Dictator Game studies, replacing the verbal invitation with a visual cue
reduces the level of generosity to almost zero. Moreover, the effect of the verbal invitation is
greatly increased when participants have more loose change. Our results may help to explain
why donations to charity in the laboratory are typically much higher than donations to charity
in everyday life, since laboratory experiments typically involve verbal instructions and a
large amount of loose change.21
Our results also have an important policy implication for charitable organisations.
Charity boxes such as the one used in our experiment are often seen in stores. Our results
suggest that these boxes are likely to raise much less money than a verbal invitation to
donate. Moreover, the effect that we find, with a verbal request versus an impersonal visual
21 Of course this does not invalidate the inferences made from inter-treatment differences in existing
laboratory experiments.
18
cue, is much larger than in Andreoni et al. (2011), whose treatment effect involves face-to-
face contact with a verbal request versus face-to-face contact without one. Our results suggest
that even when the amount donated is completely anonymous, personal verbal
communication can have a large effect on people’s behaviour.
References
Alpizar, F., Carlsson, F. and Johansson-Stenman, O. (2008). ‘Anonymity, reciprocity, and
comformity: evidence from voluntary contributions to a national park in Costa Rica’,
Journal of Public Economics, vol. 92, pp. 1047-1060.
Andreoni, J. (2006). ‘Philanthropy’, in (S. Kolm and J. Ythier, eds.) Handbook on the
Economics of Giving, Reciprocity and Altruism, pp. 1201-1269. Amsterdam: Elsevier.
Andreoni, J. and Miller, J.H. (2002). ‘Giving according to GARP: An experimental test of the
consistency of preferences for altruism’, Econometrica, vol. 70, pp. 737-753.
Andreoni, J. and Rao, J.M. (2011). ‘The power of asking: how communication affects
selfishness, empathy, and altruism’, Journal of Public Economics, vol. 95, pp. 513-520.
Andreoni, J., Rao, J.M. and Trachtman, H. (2011). ‘Avoiding the ask: a field experiment on
altruism, empathy, and charitable giving’, mimeo.
Benz, M. and Meier, S. (2008). ‘Do people behave in experiments as in the field? Evidence
from donations’, Experimental Economics, vol. 11, pp. 268-281.
Bolton, G.E. and Ockenfels, A. (2000). ‘ERC: a theory of equity, reciprocity, and
competition’, American Economic Review, vol. 90(1), pp. 166-193.
Brown, A.L., Meer, J. and Williams, J.F. (2013). ‘Why do people volunteer? An
experimental analysis of preferences for time donations’, NBER working paper No.19066
(www.nber.org/papers/w19066.ack).
Carpenter, J., Connolly, C. and Myers, C.K. (2008). ‘Altruistic behavior in a representative
dictator experiment’, Experimental Economics, vol. 11, pp. 282-298.
19
Carlsson, F., He, H. and Martinsson, P. (2013). ‘The role of windfall money in lab and field
experiments’, Experimental Economics, vol. 16, pp. 190-207.
de Oliveira, A.C.M., Croson, R.T.A. and Eckel, C. (2011). ‘The giving type: identifying
donors’, Journal of Public Economics, vol. 95(5-6), pp. 428-435.
Diamond, W.D. and Noble, S.M. (2001). ‘Defensive response to charitable direct mail
solicitations’, Journal of Interactive Marketing, vol. 15(3), pp. 2-12.
Etang, A., Fielding, D. and Knowles, S. (2012). ‘Giving to Africa and perceptions of
poverty’, Journal of Economic Psychology, vol. 33, pp. 819-832.
Fehr, E. and Schmidt, K. (1999). ‘A theory of fairness, competition and cooperation’,
Quarterly Journal of Economics, vol. 114(3), pp. 817-868.
Gazzola, V., Aziz-Zadeh, L. and Keysers, C. (2006). ‘Empathy and the somatotopic auditory
mirror system in humans’, Current Biology, vol. 16, pp. 1824-1829.
Gottfried, M.A. and Johnson, E.L. (2006). ‘Solicitation and donation: An econometric
evaluation of alumni generosity in higher education’, International Journal of Educational
Advancement, vol. 8(4), pp. 268-281.
Heath, C. and Soll, J. (1996). ‘Mental budgeting and consumer decisions’, Journal of
Consumer Research, vol. 23, pp. 40-52.
Huck, S. and Rasul, I. (2011). ‘Matched fundraising: Evidence from a natural field
experiment’, Journal of Public Economics, vol. 95, pp. 351-362.
Kohler, E., Keysers, C., Umiltá, M.A., Fogassi, L., Gallese, V. and Rizzolatti, G. (2002).
‘Hearing sounds, understanding actions: Action representation in mirror neurons’, Science,
vol. 297, pp. 846-848.
Landry, C.E., Lange, A., List, J.A., Price, M.K. and Rupp, N.G. (2006). ‘Toward an
understanding of the economics of charity: evidence from a field experiment’, Quarterly
Journal of Economics, vol. 121, pp. 747-782.
20
Leslie, L.L. and Ramey, G. (1988). ‘Donor behaviour and voluntary support for higher
education institutions’, Journal of Higher Education, vol. 59, pp. 115-32.
List, J. and Lucking-Reiley, D. (2002). ‘The effects of seed money and refunds on charitable
giving: experimental evidence from a university campus campaign’, Journal of Political
Economy, vol. 110(1), pp. 215-233.
Meer, J. (2011). ‘Brother, can you spare a dime? Peer pressure in charitable solicitation’,
Journal of Public Economics, vol. 95, pp. 926-941.
Meer, J. and Rosen, H.S. (2011). ‘The ABCs of charitable solicitation’, Journal of Public
Economics, vol. 95, pp. 363-371.
Mishra, H., Mishra, A. and Nayakankuppam, D. (2006). ‘A bias for the whole’, Journal of
Consumer Research, vol. 32(4), pp. 541-549.
Schervish, P.G. and Havens, J.J. (1997). ‘Social participation and charitable giving: A
multivariate analysis’, Voluntas, vol. 8(3), pp. 235-60.
Raghubir, P. and Srivastava, J. (2009). ‘The denomination effect’, Journal of Consumer
Research, vol. 36(4), pp. 701-713.
Small, D., Loewenstein, G. and Slovic, P. (2007). ‘Sympathy and callousness: The impact of
deliberative thought on donations to identifiable and statistical victims’, Organizational
Behaviour and Human Decision Processes, vol. 102, pp. 143-153.
Tomasello, M. (2008). Origins of Human Communication. Boston: MIT Press.
van Diepen, M., Donkers, B. and Franses, P.H. (2009a). ‘Does irritation induced by
charitable direct mailings reduce donations?’, International Journal of Marketing
Research, vol. 26, pp. 180-88.
van Diepen, M., Donkers, B. and Franses, P.H. (2009b). ‘Dynamic and competitive effects of
direct mailings: a charitable giving approach’’ Journal of Marketing Research, vol. 46(1),
pp. 120-33.
21
Vandoros, S. (2013). ‘My five pounds are not as good as yours, so I will spend them’,
Experimental Economics, vol. 16(4): pp. 546-559.
Yörük, B.K. (2009). ‘How responsive are charitable donors to requests to give?’, Journal of
Public Economics, vol. 93, pp. 1111-17.
22
Table 1
The distribution of donations
sample size
mean donation
number of non-zero donations
mean of non-zero donations
maximum donation
Donation Box Treatment less loose change (DBLC) 32 $0.06 1 $2.00 $2
more loose change (DBMC) 31 $0.03 1 $1.00 $1
Standard Treatment less loose change (SLC) 32 $0.81 9 $2.89 $4
more loose change (SMC) 32 $3.94 20 $6.30 $19
23
Table 2
Mann-Whitney tests of differences in the distribution of the amount donated
Donation Box Treatment Standard Treatment
more loose change (DBMC) less loose change (SLC) more loose change (SMC)
Donation Box Treatment
less loose change (DBLC) p > 0.999 p = 0.006 p < 0.001
more loose change (DBMC) p = 0.006 p < 0.001
Standard Treatment less loose change (SLC) p = 0.001

24
Table 3
Fisher exact tests of differences in the number of non-zero observations
Donation Box Treatment Standard Treatment
more loose change (DBMC) less loose change (SLC) more loose change (SMC)
Donation Box Treatment
less loose change (DBLC) p > 0.999 p = 0.013 p < 0.001
more loose change (DBMC) p = 0.013 p < 0.001
Standard Treatment less loose change (SLC) p = 0.011
25
Fig. 1. The two rooms
The dotted line shows the line of sight from the experimenters’ desk into Room A

26
Fig. 2. The donation and survey boxes in the donation box treatments
The room is on the fourth floor and no-one can see in through the window.
27
Fig. 3. The donation box

28
Fig. 4. The survey box in the standard treatments
i
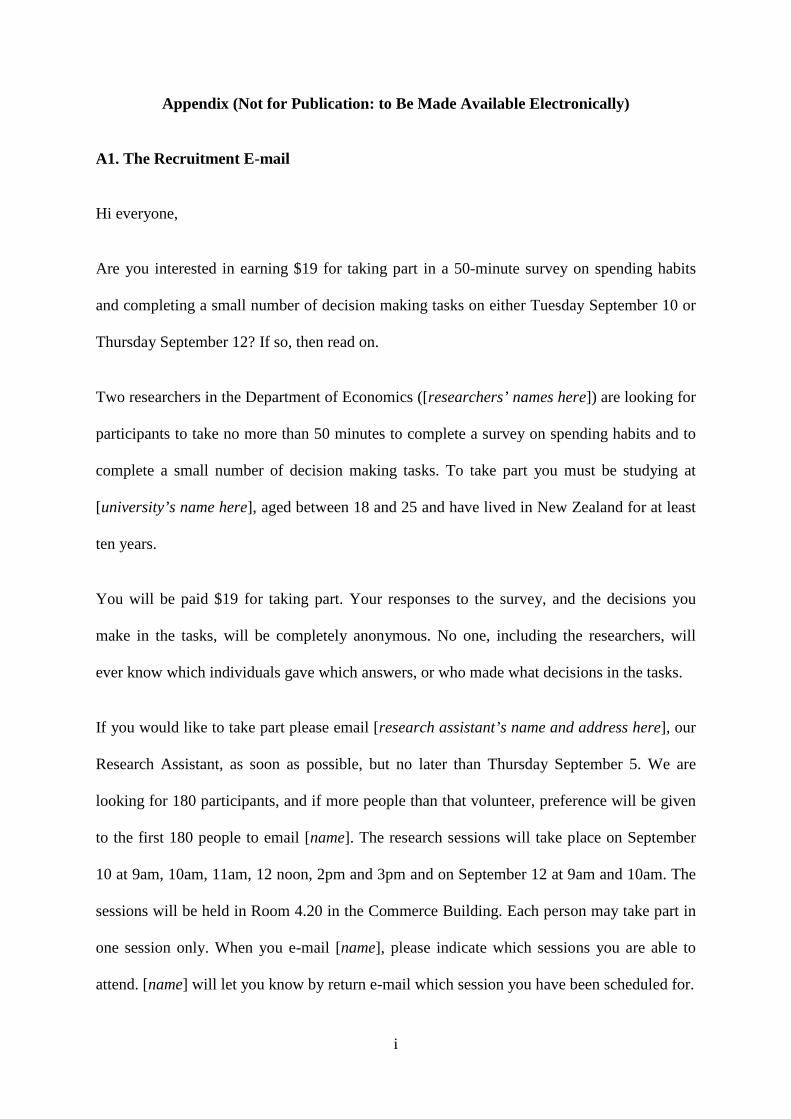
Appendix (Not for Publication: to Be Made Available Electronically)
A1. The Recruitment E-mail
Hi everyone,
Are you interested in earning $19 for taking part in a 50-minute survey on spending habits
and completing a small number of decision making tasks on either Tuesday September 10 or
Thursday September 12? If so, then read on.
Two researchers in the Department of Economics ([researchers’ names here]) are looking for
participants to take no more than 50 minutes to complete a survey on spending habits and to
complete a small number of decision making tasks. To take part you must be studying at
[university’s name here], aged between 18 and 25 and have lived in New Zealand for at least
ten years.
You will be paid $19 for taking part. Your responses to the survey, and the decisions you
make in the tasks, will be completely anonymous. No one, including the researchers, will
ever know which individuals gave which answers, or who made what decisions in the tasks.
If you would like to take part please email [research assistant’s name and address here], our
Research Assistant, as soon as possible, but no later than Thursday September 5. We are
looking for 180 participants, and if more people than that volunteer, preference will be given
to the first 180 people to email [name]. The research sessions will take place on September
10 at 9am, 10am, 11am, 12 noon, 2pm and 3pm and on September 12 at 9am and 10am. The
sessions will be held in Room 4.20 in the Commerce Building. Each person may take part in
one session only. When you e-mail [name], please indicate which sessions you are able to
attend. [name] will let you know by return e-mail which session you have been scheduled for.
ii
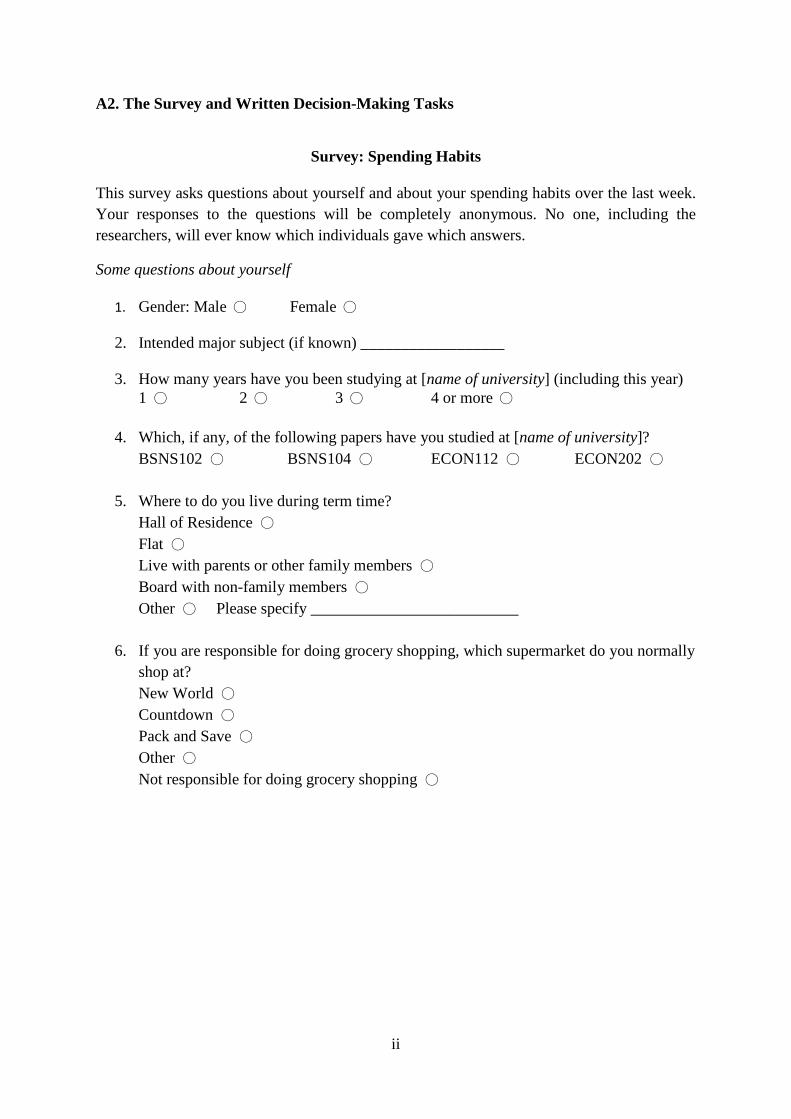
A2. The Survey and Written Decision-Making Tasks
Survey: Spending Habits
This survey asks questions about yourself and about your spending habits over the last week. Your responses to the questions will be completely anonymous. No one, including the researchers, will ever know which individuals gave which answers.
Some questions about yourself
1. Gender: Male ◯ Female ◯
2. Intended major subject (if known) __________________
3. How many years have you been studying at [name of university] (including this year) 1 ◯ 2 ◯ 3 ◯ 4 or more ◯
4. Which, if any, of the following papers have you studied at [name of university]?
BSNS102 ◯ BSNS104 ◯ ECON112 ◯ ECON202 ◯
5. Where to do you live during term time? Hall of Residence ◯
Flat ◯
Live with parents or other family members ◯ Board with non-family members ◯ Other ◯ Please specify __________________________
6. If you are responsible for doing grocery shopping, which supermarket do you normally shop at? New World ◯ Countdown ◯ Pack and Save ◯ Other ◯ Not responsible for doing grocery shopping ◯
iii
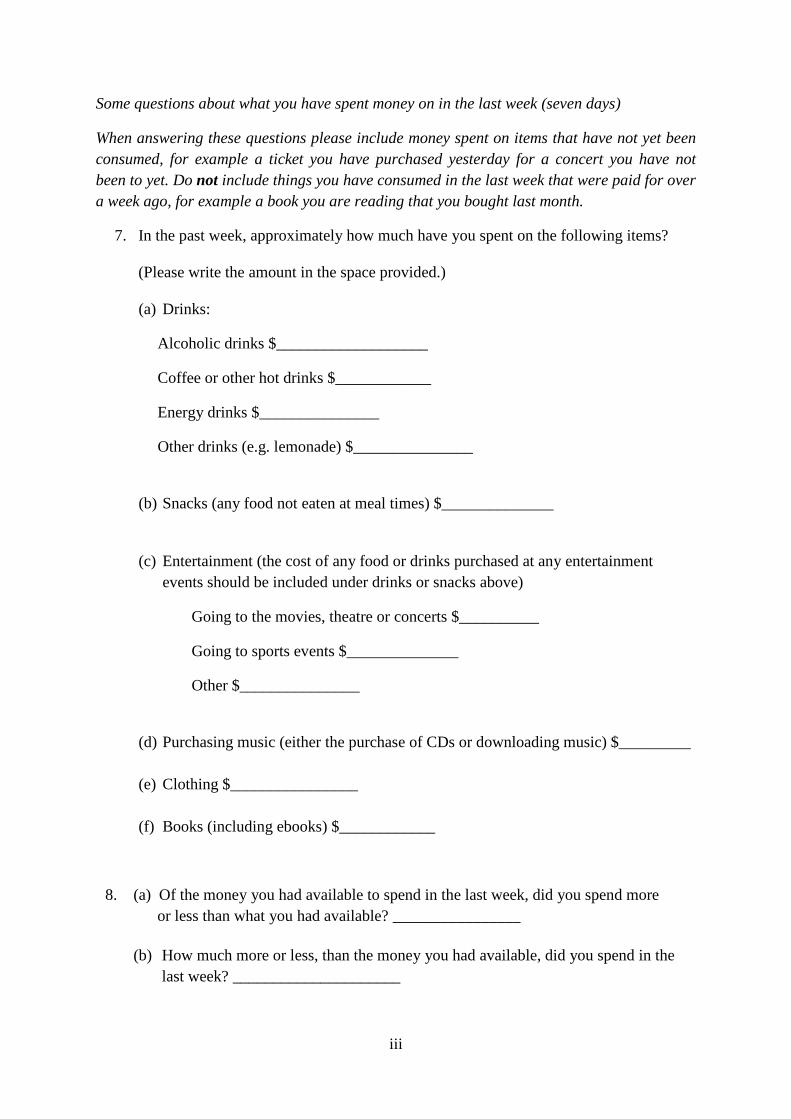
Some questions about what you have spent money on in the last week (seven days)
When answering these questions please include money spent on items that have not yet been consumed, for example a ticket you have purchased yesterday for a concert you have not been to yet. Do not include things you have consumed in the last week that were paid for over a week ago, for example a book you are reading that you bought last month.
7. In the past week, approximately how much have you spent on the following items?
(Please write the amount in the space provided.)
(a) Drinks:
Alcoholic drinks $___________________
Coffee or other hot drinks $____________
Energy drinks $_______________
Other drinks (e.g. lemonade) $_______________
(b) Snacks (any food not eaten at meal times) $______________
(c) Entertainment (the cost of any food or drinks purchased at any entertainment events should be included under drinks or snacks above)
Going to the movies, theatre or concerts $__________
Going to sports events $______________
Other $_______________
(d) Purchasing music (either the purchase of CDs or downloading music) $_________
(e) Clothing $________________
(f) Books (including ebooks) $____________
8. (a) Of the money you had available to spend in the last week, did you spend more ___or less than what you had available? ________________
(b) How much more or less, than the money you had available, did you spend in the
last week? _____________________

iv
Decision Making Tasks
Your responses will be completely anonymous. No one, including the researchers, will ever know which individuals gave which responses.
One: Spending Time on a Tropical Island
Imagine you have just won a trip to spend a week on a tropical island in the Pacific. The island is uninhabited. You and the one person you choose to take with you will be the only people staying there (apart from a caretaker who also does all the cooking and cleaning). Accommodation and food and drinks will be supplied, but other than clothing you are only allowed to take five things with you.
Who would you choose to take with you? _______________________________________
What five items would you choose to take with you?
1.________________________________________________________________________
2.________________________________________________________________________
3.________________________________________________________________________
4.________________________________________________________________________
5.________________________________________________________________________
v
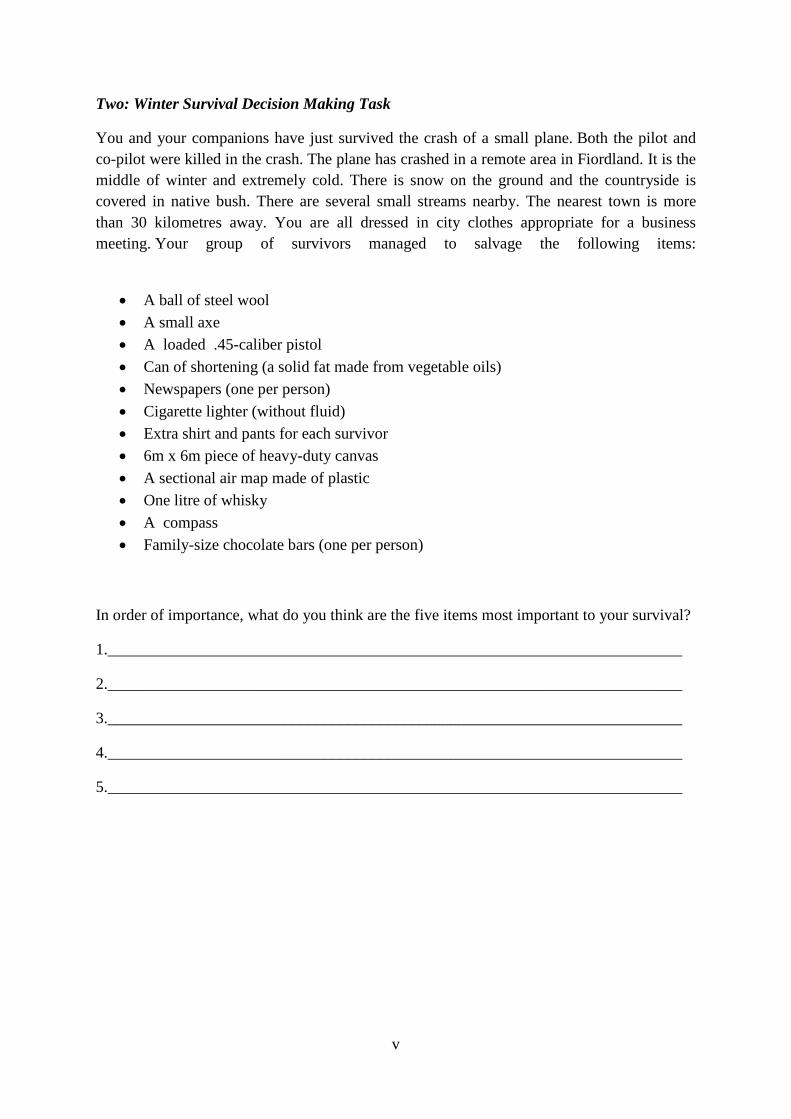
Two: Winter Survival Decision Making Task
You and your companions have just survived the crash of a small plane. Both the pilot and co-pilot were killed in the crash. The plane has crashed in a remote area in Fiordland. It is the middle of winter and extremely cold. There is snow on the ground and the countryside is covered in native bush. There are several small streams nearby. The nearest town is more than 30 kilometres away. You are all dressed in city clothes appropriate for a business meeting. Your group of survivors managed to salvage the following items:
• A ball of steel wool • A small axe • A loaded .45-caliber pistol • Can of shortening (a solid fat made from vegetable oils) • Newspapers (one per person) • Cigarette lighter (without fluid) • Extra shirt and pants for each survivor • 6m x 6m piece of heavy-duty canvas • A sectional air map made of plastic • One litre of whisky • A compass • Family-size chocolate bars (one per person)
In order of importance, what do you think are the five items most important to your survival?
1.________________________________________________________________________
2.________________________________________________________________________
3.________________________________________________________________________
4.________________________________________________________________________
5.________________________________________________________________________
vi
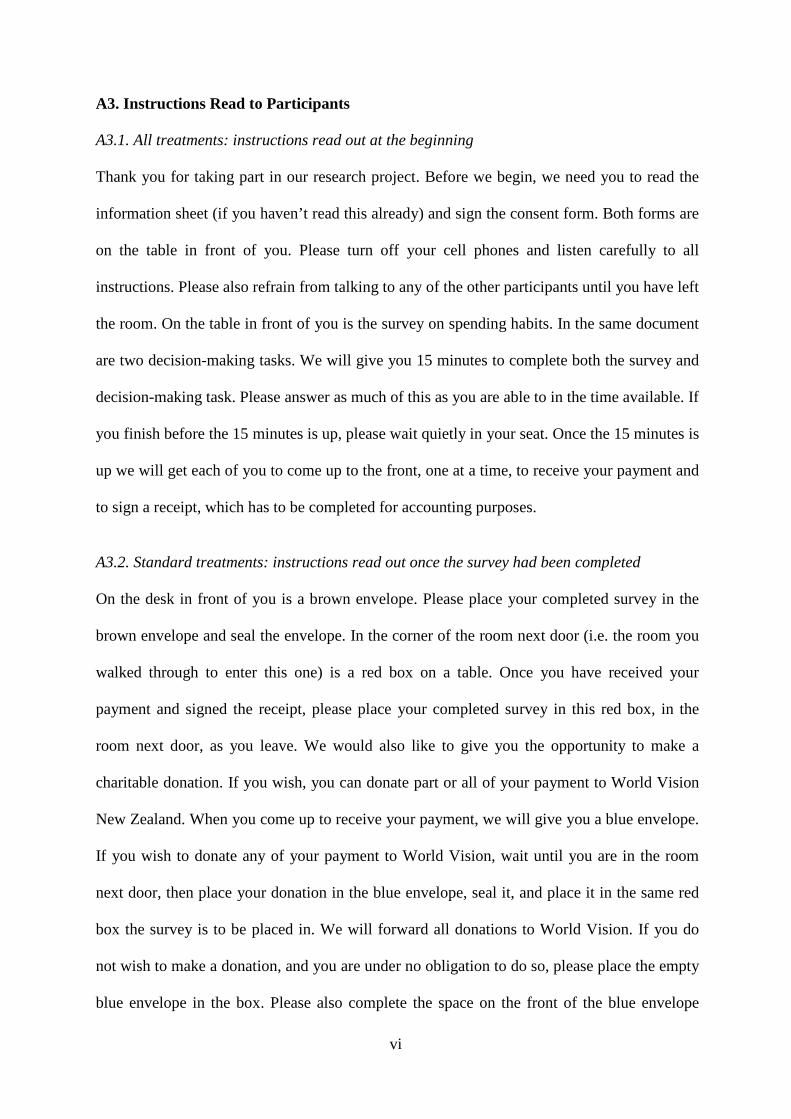
A3. Instructions Read to Participants
A3.1. All treatments: instructions read out at the beginning
Thank you for taking part in our research project. Before we begin, we need you to read the
information sheet (if you haven’t read this already) and sign the consent form. Both forms are
on the table in front of you. Please turn off your cell phones and listen carefully to all
instructions. Please also refrain from talking to any of the other participants until you have left
the room. On the table in front of you is the survey on spending habits. In the same document
are two decision-making tasks. We will give you 15 minutes to complete both the survey and
decision-making task. Please answer as much of this as you are able to in the time available. If
you finish before the 15 minutes is up, please wait quietly in your seat. Once the 15 minutes is
up we will get each of you to come up to the front, one at a time, to receive your payment and
to sign a receipt, which has to be completed for accounting purposes.
A3.2. Standard treatments: instructions read out once the survey had been completed
On the desk in front of you is a brown envelope. Please place your completed survey in the
brown envelope and seal the envelope. In the corner of the room next door (i.e. the room you
walked through to enter this one) is a red box on a table. Once you have received your
payment and signed the receipt, please place your completed survey in this red box, in the
room next door, as you leave. We would also like to give you the opportunity to make a
charitable donation. If you wish, you can donate part or all of your payment to World Vision
New Zealand. When you come up to receive your payment, we will give you a blue envelope.
If you wish to donate any of your payment to World Vision, wait until you are in the room
next door, then place your donation in the blue envelope, seal it, and place it in the same red
box the survey is to be placed in. We will forward all donations to World Vision. If you do
not wish to make a donation, and you are under no obligation to do so, please place the empty
blue envelope in the box. Please also complete the space on the front of the blue envelope
vii
indicating how much, if anything, you wish to donate. If you don’t wish to donate anything,
please write zero in the space provided. There are pens beside the red box, in the room next
door, which you can use to fill this in. We will now call you up one at a time to receive your
payment and sign the receipt form. Once you have finished in the room next door, please
leave the room and do not wait in the corridor outside.
A3.4. Donation box treatments: instructions read out once the survey had been completed
On the desk in front of you is a brown envelope. Please place your completed survey in the
brown envelope and seal the envelope. In the corner of the room next door (i.e. the room you
walked through to enter this one) is a red box on a table. Once you have received your
payment and signed the receipt, please place your completed survey in this red box, in the
room next door, as you leave. We will now call you up one at a time to receive your payment
and sign the receipt form. Once you have finished in the room next door, please leave the
room and do not wait in the corridor outside.