can we reach 100 million electric cars ... we reach 100 million electric cars worldwide by 2030? a...
TRANSCRIPT

CAN WE REACH 100 MILLION ELECTRIC CARS WORLDWIDE BY 2030? A modelling/scenario analysis
Working Paper 16

Acknowledgements This publication was co-authored by Lew Fulton, Alan Jenn and Gil Tal of the Institute of Transportation
Studies, University of California, Davis.
This work was funded by the FIA Foundation.
Publication date: May 17, 2017

Table of Contents
Executive summary ...................................................................................................................................... 3
Introduction .................................................................................................................................................. 6
Data and recent trends ................................................................................................................................. 8
Model descriptions and scenarios .............................................................................................................. 14
Results ........................................................................................................................................................ 16
Discussion ................................................................................................................................................... 20
Policy instruments .................................................................................................................................. 20
Future work with the current data sets and models .............................................................................. 20
Appendix 1: methods and data analysis ..................................................................................................... 22
Methods .................................................................................................................................................. 22
Consumer choice model approach ......................................................................................................... 22
Diffusion of innovation approach ........................................................................................................... 23
Regression of trends approach ............................................................................................................... 24
Appendix ii: results in detail ....................................................................................................................... 26
Model fitting ........................................................................................................................................... 26
Diffusion of innovation model ................................................................................................................ 31
Regression model .................................................................................................................................... 32

3
Executive summary This report is part 2 of a study of the potential to achieve a particular target of electric and plug-in hybrid vehicle sales worldwide by 2030. That target is 100 million for 4 wheel road vehicles (cars and LDVs) as a cumulative sales (or roughly a stock) target in that year, consistent with the Paris Declaration on Electro-mobility1. The previous report2 provided an overview of trends and some of the key considerations in getting to the 100 million target. This report takes a more rigorous approach, considering formalized models and scenario development and projecting key factors to 2030 to gain a sense of whether they suggest that sales of 100 million over that time frame are realistic or even plausible.
We undertake three different model development strategies and compare the projections from these models, using the same dataset and same basic approach to calibrating the models. From that point of view this work provides both a comparison of methodologies and a multi-pronged approach to testing the 100 million hypothesis, perhaps increasing the rigor of the projections (at least allowing for 3 different ways to see if it can be done, and how similar these projections are).
The data used in this study are frim HIS, with considerable improvement both by IEA and UC Davis. It covers vehicle registrations in 35 countries over a 6-year period (2010-2015), and includes a range of details about each vehicle model/configuration sold, to allow tracking of attributes such as vehicle price, efficiency, and driving range, among other things. Details of the dataset are provided in an appendix, along with details on the methods used to develop, calibrate, and project with the three models.
The basic findings of this study include:
x While fewer than 2 percent of vehicles sold in the covered countries in 2015 were BEV or PHEV, there are good prospects for these sales to increase further in the future. Increases are likely due to reductions in battery costs (and thus model retail prices), increases in vehicle driving range, and – very importantly – increases in the numbers of makes/models available, and thus in the choices available to consumers. This includes models likely to appear in market segments where currently they basically don’t exist, such as pickup trucks and minivans.
x However, the prospects for a very rapid increase in sales consistent with a cumulative sales target of 100 million in 2030 are far less bright. Given a rough projection of global car sales of 120 million in that year, this is about 25% of global car/LDV sales. From the actual global sales level in 2015 of about 500,000 worldwide, sales will have to reach about 30 million per year in 2030 to hit the cumulative target (with the area under that 15-year curve representing cumulative sales). This means an annual sales growth rate of over 30% per year (or much higher growth initially and declining over time, is more likely).
x The three approaches used in our projection model all take into account a range of important “drivers”, or explanatory variables. These include vehicle costs, operating costs, driving range, the numbers of makes/models available, and country-specific factors. We find that assuming strong improvements in all these areas over the next 15 years can increase the demand for vehicles dramatically, but none of our models/scenarios hits the 100 million target.
x In particular, our projections using the models includes an assumption that the cost of vehicles drops steadily to 2030 and beyond, which could relate either to reduced vehicle production costs or policies that cut the retail prices (such as subsidies). This change and a steady increase in the
1 UNFCCC, 2015, Paris Declaration on e-mobility, http://newsroom.unfccc.int/media/521376/paris-electro-mobility-declaration.pdf 2 GFEI, 2016, “Can we achieve 100 million plug-in cars by 2030?”, Working Paper 13, authored by UC Davis, Fulton, Lewis et al, https://www.globalfueleconomy.org/data-and-research/publications/gfei-working-paper-13
4
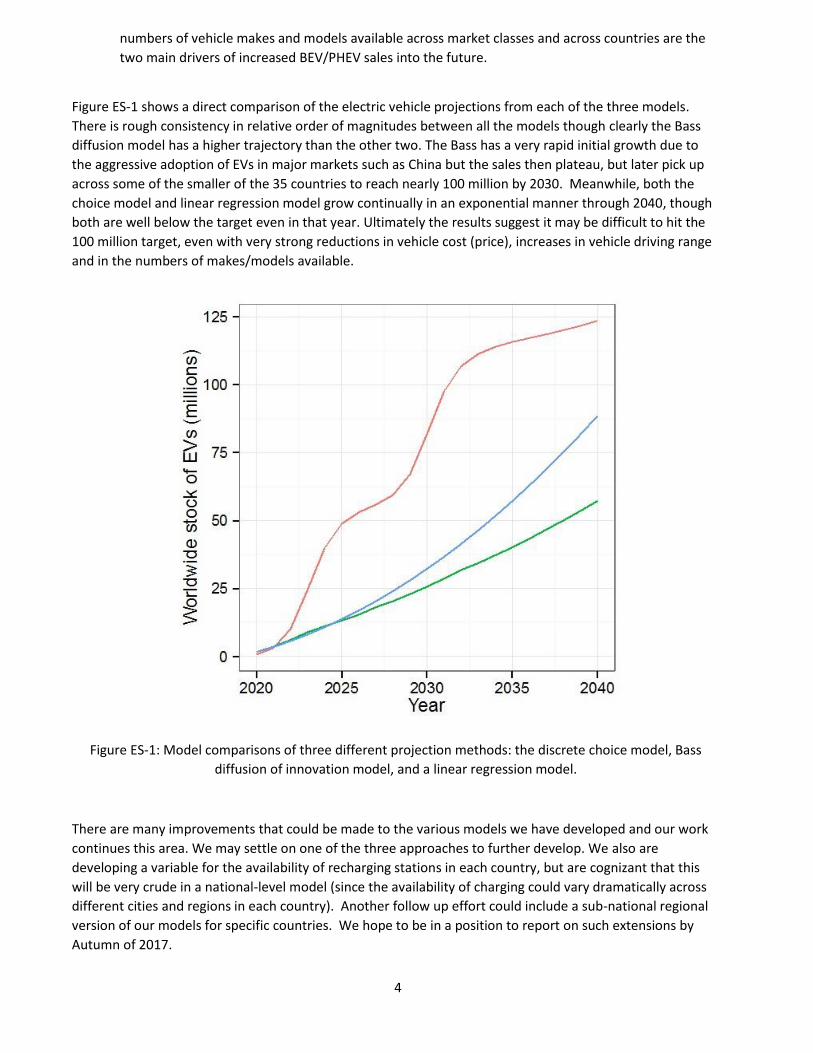
numbers of vehicle makes and models available across market classes and across countries are the two main drivers of increased BEV/PHEV sales into the future.
Figure ES-1 shows a direct comparison of the electric vehicle projections from each of the three models. There is rough consistency in relative order of magnitudes between all the models though clearly the Bass diffusion model has a higher trajectory than the other two. The Bass has a very rapid initial growth due to the aggressive adoption of EVs in major markets such as China but the sales then plateau, but later pick up across some of the smaller of the 35 countries to reach nearly 100 million by 2030. Meanwhile, both the choice model and linear regression model grow continually in an exponential manner through 2040, though both are well below the target even in that year. Ultimately the results suggest it may be difficult to hit the 100 million target, even with very strong reductions in vehicle cost (price), increases in vehicle driving range and in the numbers of makes/models available.
Figure ES-1: Model comparisons of three different projection methods: the discrete choice model, Bass diffusion of innovation model, and a linear regression model.
There are many improvements that could be made to the various models we have developed and our work continues this area. We may settle on one of the three approaches to further develop. We also are developing a variable for the availability of recharging stations in each country, but are cognizant that this will be very crude in a national-level model (since the availability of charging could vary dramatically across different cities and regions in each country). Another follow up effort could include a sub-national regional version of our models for specific countries. We hope to be in a position to report on such extensions by Autumn of 2017.

5
Ultimately there is one very important thing that any model such as these cannot capture. That is the awareness and perception of consumers around electric vehicles, and how this might change. Models estimated with data from 2015 and earlier are inherently based on the awareness and attitudes which prevailed during this time, and it is very early days for electric vehicles. For example, if only 10% of the population is even aware of the possibility of purchasing an EV, this will heaving restrict the vehicle market and sales levels. If by 2025, for example, the vast majority of people in a country are aware of this option and willing to consider it in their purchase decisions. Even with no other changes to the vehicles themselves and the external market conditions, the market shares of EVs could be far higher than today. We may attempt to explicitly capture such effects in the future, but it is difficult apart from making some simple assumptions.

6
Introduction The challenges of climate change have provided tremendous motivation to mitigate carbon emissions around the world. The transportation sector represents not only a massive contributor to carbon emissions but it is also a rapidly growing sector as developing countries begin to catch up to modern transportation technologies. Fortunately, automakers have been introducing electric vehicles in the light-duty passenger vehicle sector as a possible mitigation solution. The electric vehicle (EV) market across the world has grown by a remarkable amount over the last decade. From essentially no commercial vehicles on the market in 2007, there are a cumulative 2 million electric vehicles on the road globally in 2016 with over 770,000 vehicles sold in that year alone3. However, this success story is mitigated by how far electric vehicles have to go: the new technology only represents 0.86% of global vehicle sales. The goal of this work is to understand the factors driving these sales such as policy mechanisms, infrastructure requirements, and the vehicle attributes themselves to see how scenarios of these variables can be leveraged to understand how electric vehicles may develop far into the future.
In May 2016, UC Davis prepared a report for GFEI that summarized the status of electric vehicles at that time, and provided an initial data analysis and some projections of what it “looks like” to reach 100 million EVs worldwide by 2030. This analysis found:
x To reach a global stock of 100 million PEVs by 2030, sales in that year will need to be on the order of 30 million, and sales growth will need to average over 30% per year for 15 years. This could mean, for example, reaching the point where 100 models of PEV sell 300,000 units each around the world in that year, or 300 models selling 100,000 units each; either way a daunting challenge.
x Although the 30 million target is not that large compared to the projected global PLDV sales in 2030 (about 22%), it becomes a more daunting task when considered from the point of view of the required growth rates in PEV markets around the world.
x Between 2011 and 2015, PEV sales in the top 8 world markets (US, Japan, China, and 5 European countries) showed an overall steady increase with growth rates over 50% in all years. The number of PEV models available across these countries also increased steadily, with by 2015 a reasonable overall balance of PHEV v BEV models, and across different light-duty vehicle market classes (i.e. small, medium and large/luxury cars as well as SUV models). By far the weakest PLDV segments for models and sales were vans and pickup trucks.
x A deeper look at the US, France and Japan showed that, across all passenger light-duty vehicle sales, there are very different distributions by market class, and that the models of PEVs were not well aligned with the various dominance of vehicle types in these countries. It also showed that average sales per model for PEVs were quite low relative to non-PEVs.
x We estimated that the benefit of price incentives, in terms of making PEVs more price competitive, rises rapidly for PEVs that are competing in these lower price categories, especially once it puts their sales price into a zone where large numbers of conventional vehicles are sold. Current US national incentives do not appear to help current compact and mid-size PEV models reach these price points.
In the second (current) phase of this study, a deeper modeling analysis has been undertaken, attempting to more formally account for a range of factors that affect EV sales, and what this may mean for EV sales in the future (as EVs and certain policies may change). We are looking at a number of key factors such as vehicle price, operating cost, driving range and recharging availability, and how these relate to vehicle sales across a wide range of countries.
3 The Electric Vehicle World Sales Database http://www.ev-volumes.com/country/total-world-plug-in-vehicle-volumes/

7
Our research can be distinctly divided into two stages: first, developing and estimating econometric models of the current EV sales in the context of 35 country-level markets and second, using these model structures to project EV sales into the future using a scenario approach. In the first stage, we have used a large database with observations of current and historical sales and a range of vehicle attributes to build several models of different types to attempt to understand various aspects of the growth of the technology. By using three separate modelling approaches we can compare and hopefully minimize the modeling error intrinsic to each process such that we can identify robust trends that arise consistently across the three models. In the second stage we project EV sales worldwide to 2050 across a number of scenarios using each of the three models. This second stage relies on the first stage to properly calibrate the parameters responsible for the growth of the technology. However, our projections also rely on assumptions regarding changes in future parameters in order to make projections for the adoption of EVs into the future. In order to demonstrate robustness, we apply these assumptions across a variety of models to establish consistency in the results.
The following sections of this report are structured as follows: Section 2 covers our database development efforts, Section 3 outlines our 3-model methodology, Section 4 presents results and Section 5 provides a discussion of these results.

8
Data and recent trends In cooperation with the IEA, UC Davis acquired a large international vehicle registrations database (from IHS Automotive) to conduct our study. In this section we provide a summary overview of the data both in totality and as a subset of electric vehicles. The IHS data were first supplemented by staff at the International Energy Agency with additional information on vehicle attributes including the axle configuration, vehicle drive type, engine size, number of cylinders, power of the engine, fuel type, transmission type, turbo capabilities, price, segment, curb-weight, footprint, fuel efficiency/emissions rates, and vehicle range. This UC Davis team continued with some data cleaning efforts and added more detailed information on electric vehicles. The final cleaned dataset consists of over 900,000 vehicle models accounting for a total of 500 million new vehicle sales over the span of 8 years and 39 countries.
The total registrations across the full dataset can be seen in Figure 1 separated by country and divided by vehicle fuel type. By far the two largest vehicle markets are the United States and China, both of whom have vehicle sales reaching nearly 120 million vehicles over the span of 8 years. The next closest country in terms of market size is Japan, which sold about 40 million vehicles over the same period of time. The majority of country vehicle sales are dominated by petrol (or gasoline) vehicles. Exceptions include the United Kingdom, France, Italy, Thailand, Turkey, and Spain, which sell more diesel vehicles than petrol vehicles as well as Brazil whose vehicles primarily consist of flex fuel vehicles. Against the full market of vehicles, electric vehicles representing substantially less than 1% of sales are unobservable in Figure 1.
Figure 1: Total registrations in IHS/IEA data separated by country and fuel type vehicle technology spanning 2005, 2008, and 2010 through 2015. Of the over 500 million vehicles registered, nearly half are from USA
and China. Petrol (gasoline) vehicles represent the majority of cars sold in nearly every country except for a handful of countries whose diesel vehicle sales are higher and Brazil where the majority of vehicles sold are
flex fuel vehicles.
0
30
60
90
120
USA
Chi
naJa
pan
Braz
ilG
erm
any
Rus
sia
Indi
aU
nite
d Ki
ngdo
mFr
ance
Can
ada
Indo
nesi
aIta
lyM
exic
oSo
uth
Kore
aAu
stra
liaAr
gent
ina
Mal
aysi
aPh
ilippi
nes
Sout
h Af
rica
Thai
land
Turk
eyPe
ruEg
ypt
Chi
leSp
ain
Ukr
aine
Belg
ium
Net
herla
nds
Swed
enSw
itzer
land
Aust
riaD
enm
ark
Portu
gal
Nor
way
Irela
ndFi
nlan
dG
reec
eLu
xem
bour
gM
aced
onia
Country
Tota
l Reg
istra
tions
(milli
ons)
Fuel TypeBEVCNGDieselFlexfuelHEVHybridHydrogenLPGPetrolPHEV

9
In terms of the type and size of vehicles being sold worldwide, a breakdown of the sales by segment is shown in Figure 2. The segments are classified according to the European classification system and we observe that the majority of vehicles sold over the coverage of the data are medium sized or larger vehicles. Additionally, we are also able to observe the preference for fuel efficiency (and equivalently the emission rate) of the vehicles within our dataset. In Figure 3, the global distribution of vehicles by emissions rate (in g CO2/km) is shown. Most vehicles fall between 100 and 300 g CO2/km or equivalently 4 to 13 L/100 km (18 to 55 MPG). However, a small subset of electric vehicles and hybrid electric vehicles are cleaner than 100 g CO2/km while there is a substantial tail of vehicles that are dirtier than 300 g CO2/km reaching as high as 1 kg CO2/km (these are not shown as Figure 3 has a cutoff beyond 500 g CO2/km).
Figure 2: The breakdown of vehicles by segment in the data. The classification is by European segmentation as follows: A – mini cars, B – small cars, C – medium cars, D – large cars, E – executive cars, F – luxury cars, J –
sport utility cars, and S – sports cars.
Figure 3: The distribution of vehicle emission rates in the data. The majority of cars have an emissions rate of between 100 and 300 g CO2/mi.
0
50
100
150SU
V/Pi
ck−u
p/Va
n/LC
V C D E
SUV/
Pick−u
p B
Uns
pec.
Larg
e SU
V/Pi
ck−u
p
Van/
LCV A F J S 7
Vehicle Segment
Tota
l Reg
istra
tions
(milli
ons)
0
20
40
60
0 100 200 300 400 500Vehicle Emissions Rate (g CO2/km)
Tota
l Reg
istra
tions
(milli
ons)

10
Our data do not represent a perfect panel since the data for countries are not uniformly available across all the years in the data (2005, 2008, 2010-2015). The number of years of data available by country can be seen in Figure 4. Fortunately, the size of the market is correlated with the size of the panel and most of the largest vehicle markets have more years of data available. As a result, the largest vehicle markets all have their full associated vehicle registration data across all available years of analysis.
Figure 4: Number of years available in the data by country, the majority of countries have the full 8 years spanning 2005, 2008, and 2010 through 2015. Several countries have only 2 years of available data (2014
and 2015).
The dataset captures a total of 1.1 million new electric vehicle registrations across both BEVs and PHEVs technologies. Approximately 170 unique vehicle models represent the full set of technologies over 34 of the 39 countries included in the data. The distribution of electric vehicle models is not uniform at the international scale, while certain vehicle models can be found in several countries it is not uncommon for many vehicle models to be exclusive to a single country or a small subset of countries.
0
2
4
6
8
Arge
ntin
aAu
stra
liaBr
azil
Can
ada
Chi
leC
hina
Fran
ceG
erm
any
Indi
aIn
done
sia
Italy
Japa
nM
alay
sia
Mex
ico
Rus
sia
Sout
h Af
rica
Sout
h Ko
rea
Thai
land
Turk
eyU
krai
neU
nite
d Ki
ngdo
mU
SAEg
ypt
Peru
Philip
pine
sAu
stria
Belg
ium
Den
mar
kFi
nlan
dG
reec
eIre
land
Luxe
mbo
urg
Mac
edon
iaN
ethe
rland
sN
orwa
yPo
rtuga
lSp
ain
Swed
enSw
itzer
land
Country
Num
ber o
f yea
rsav
aila
ble
in d
ata

11
Figure 5: Spatial distribution of electric vehicle sales (both BEVs and PHEVs combined) in 2015 worldwide based on density of registrations (number of registrations per 10,000 conventional vehicles sold). All shaded
countries contain sales data for EV registrations in 2015. Norway is a special case with 6,000 EVs sold per 10,000 conventional vehicles and is not included in this figure.
One important aspect of electric vehicle adoption is the diversity in vehicle options for the technology. We observe a strong correlation between the number of EV models and their total adoption. In Figure 6 we show that the number of electric vehicle models in the market across the world has been growing over time with nearly 90 BEV models and 40 PHEV models available at the end of 2015. Similarly, the two technologies are compared to traditional hybrids that have been available over a decade longer than the new electric vehicle technologies. The rate of growth in terms of model availability has been significantly higher for both BEVs and PHEVs than hybrids.
Figure 6: Growth in the number of unique vehicle models available for hybrid, plug-in hybrid, and battery electric vehicle technologies over time across 39 countries.
Worldwide sales of electric vehicles(EVs per 10000 conventional vehicles sold)
0 10 30 50 100 250
0
50
100
2010 2011 2012 2013 2014 2015Year
Num
ber o
f uni
que
mod
els
avai
labl
e
Vehicle TechnologyBEVHybridPHEV

12
While model diversity has been growing steadily, its growth is not uniform across the world. At the end of 2015, Figure 7 indicates that some countries have as low as only 3 available models while other countries may have as high as 80 models.
Figure 7: Spatial distribution of electric vehicle model availability (both BEVs and PHEVs combined) in 2015 worldwide.
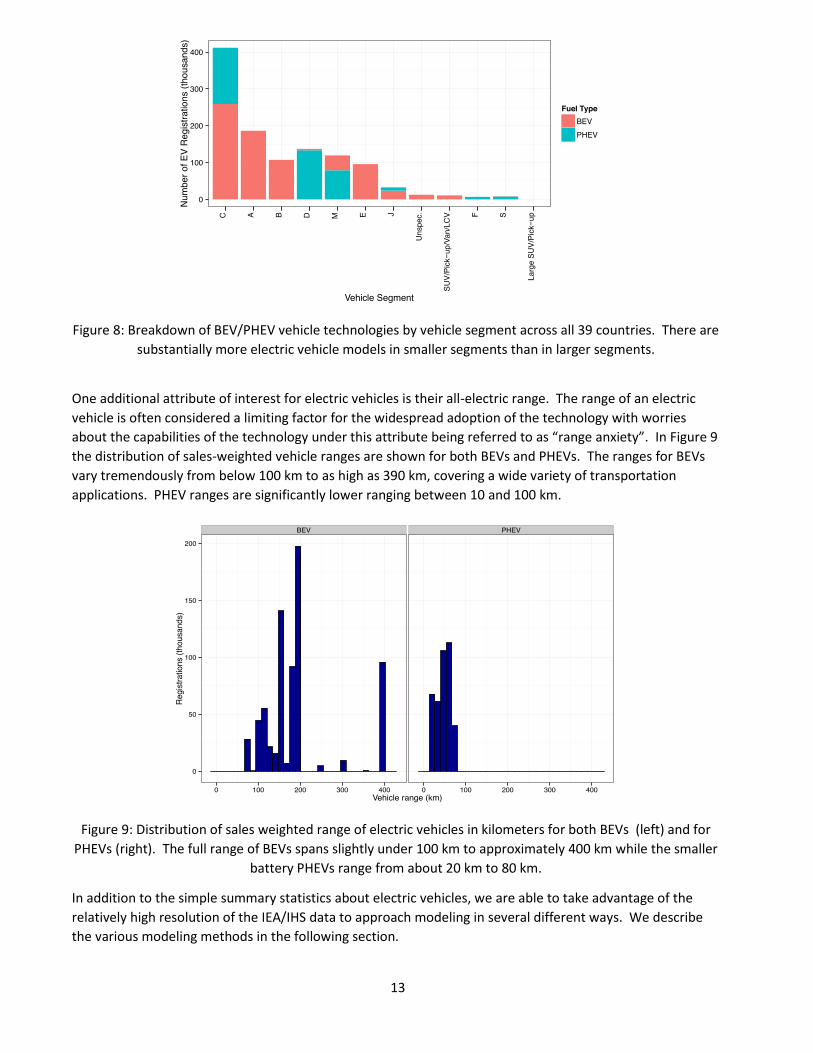
In addition to the number of vehicle models available for sale on the market, the coverage of electric vehicle models across vehicle segments is imperative to penetrate across different market groups for wider adoption. Figure 8 demonstrates that while a large number of registrations have occurred, the adoption has mainly occurred in smaller segment sizes, especially when comparing the distribution of sales to the full population distribution as seen in Figure 2. The growth of electric vehicles in larger segments will likely improve as more models are made available in their respective vehicle size classes.
Number of electric vehicle models available
0 3 10 25 40 80
13
Figure 8: Breakdown of BEV/PHEV vehicle technologies by vehicle segment across all 39 countries. There are substantially more electric vehicle models in smaller segments than in larger segments.
One additional attribute of interest for electric vehicles is their all-electric range. The range of an electric vehicle is often considered a limiting factor for the widespread adoption of the technology with worries about the capabilities of the technology under this attribute being referred to as “range anxiety”. In Figure 9 the distribution of sales-weighted vehicle ranges are shown for both BEVs and PHEVs. The ranges for BEVs vary tremendously from below 100 km to as high as 390 km, covering a wide variety of transportation applications. PHEV ranges are significantly lower ranging between 10 and 100 km.
Figure 9: Distribution of sales weighted range of electric vehicles in kilometers for both BEVs (left) and for PHEVs (right). The full range of BEVs spans slightly under 100 km to approximately 400 km while the smaller
battery PHEVs range from about 20 km to 80 km.
In addition to the simple summary statistics about electric vehicles, we are able to take advantage of the relatively high resolution of the IEA/IHS data to approach modeling in several different ways. We describe the various modeling methods in the following section.
0
100
200
300
400
C A B D M E J
Uns
pec.
SUV/
Pick−u
p/Va
n/LC
V F S
Larg
e SU
V/Pi
ck−u
p
Vehicle Segment
Num
ber o
f EV
Reg
istra
tions
(tho
usan
ds)
Fuel TypeBEVPHEV
BEV PHEV
0
50
100
150
200
0 100 200 300 400 0 100 200 300 400Vehicle range (km)
Regi
stra
tions
(tho
usan
ds)

14
Model descriptions and scenarios In order to estimate the potential to reach total (cumulative) sales of 100 million electric vehicles worldwide by 2030, we have developed a projection tool that takes into account a range of factors, and a projection approach to forecast independent variables out to 2030 to estimate the resulting demand (sales) of EVs and PHEVs in specific countries. Our approach (and data) do not cover the entire world but do cover a high enough share of vehicle sales (and countries where EV sales have begun and are likely to be important in the near-medium term), that it appears to be a reasonable proxy.
There are a number of forecasting methods that are used to estimate future scenarios of technology adoption and each has corresponding strengths and weaknesses due to the assumptions associated with their respective modeling techniques. In order to reduce this specific modeling error, we approach our development of projections by using three distinct models: a choice model, diffusion of innovation model, and regression of trends model. The fundamental characterization of each respective model can be described as follows: a belief that consumers will rationally choose from a set of products based on their attributes, a belief that a specific technology will be adopted in a particular manner, and a belief that the success of a technology is associated with a number of factors (both intrinsic to the product and external to the product). The primary goal of our work is to attempt to find consistency across different models to demonstrate robustness in our findings and projections. In the following sections, we describe each of the approaches in detail.
Our approach has been, with each modeling approach, to generate several projection scenarios based on assumptions of electric vehicle price reductions, vehicle model availability, and driving range as seen in Figure 10. While the underlying assumptions are rather simplistic, they allow us to provide a direct comparison between the three models by providing a consistent basis of future EV attributes necessary to generate the projections. The scenarios of price reduction are a generic change in price that can result from cheaper production costs (due to decreases in battery costs or more efficient manufacturing) or direct policy incentives. The price reductions range from $5,000 up to $15,000 on average for an electric vehicle (either BEV or PHEV). For each of the respective scenarios, vehicle prices decrease linearly by $5000, $10000, and $15000 by 2040 with 10%, 20%, and 50% model saturation of the market by 2040 as well. The vehicle range increases linearly to a 50 km, 100 km, and 150 km for each respective scenario.

15
Figure 10: Projection assumptions for low, medium, and high favorability scenarios for electric vehicles.
4000
8000
12000
2020 2025 2030 2035 2040Year
Aver
age
Pric
e R
educ
tion
($)
0.0
0.1
0.2
0.3
0.4
0.5
2020 2025 2030 2035 2040Year
Prop
ortio
n of
mod
els
as E
Vs
40
80
120
2020 2025 2030 2035 2040Year
Ran
ge In
crea
se (k
m)

16
Results Here we display several vehicle adoption projection scenarios based on the three models of this project: a discrete choice consumer based model, a technology diffusion model, and a regression based on observed trends in the vehicle market and other country-level factors. The six countries represent a range of results across three scenarios (low, medium, and high) of price, EV model availability, and vehicle range. As these attributes improve for electric vehicles (lower prices, greater model availability, and higher range), we observe increasingly higher adoption across the new vehicle market. In Figure 11 we observe that the European countries have relatively high proportions of diesel vehicles whereas Chile and Japan consist initially of primarily gasoline vehicles. In the subset of results, the highest adoption of electric vehicles occurs in Portugal with a majority of BEVs and in Switzerland with a majority of PHEVs. In the “Low” adoption scenario, in Belgium total adoption is as low as 10% market share in certain countries by 2050 up to about 25% in the more aggressive “High” adoption scenario. Meanwhile, Switzerland has relatively high adoption at 75% market share even in the “Low” scenario and nearly a complete domination of the market in the “High” adoption scenario.
Figure 11: Scenario projection of vehicle sales by year broken down by fuel technology. The projections are based on the vehicle choice model results as described in Section 4.1.1. The Low, Medium, and High categories refer to
scenarios of electric vehicle prices, model availability, and vehicle range as described in Section 3.4.
The Bass model projections of future electric vehicle adoption are shown for BEVs in Figure 12 and for PHEVs in Figure 13. As can be seen, the adoption curves can vary tremendously from country to country. Due to the uncertainty in the potential final market size of each of the technologies, we leave the results in terms of percentage of saturation. In the Bass projections, there is a stark difference in adoption potential between BEV and PHEV technologies. For example, BEVs in Canada saturate their market potential by around 2035 but PHEVs in Canada only reach 70% saturation by 2050. By far the fastest saturation occurs in China with extremely rapid growth in the market starting in 2018 and full saturation of new vehicle sales by 2025. However, many countries do not reach their market potential by 2050 including Australia, Chile, Japan, and Russia.
Belgium Chile Germany Japan Portugal Switzerland
0.00
0.25
0.50
0.75
1.00
0.00
0.25
0.50
0.75
1.00
0.00
0.25
0.50
0.75
1.00
LowM
ediumH
igh20
20
2025
2030
2035
2040
2020
2025
2030
2035
2040
2020
2025
2030
2035
2040
2020
2025
2030
2035
2040
2020
2025
2030
2035
2040
2020
2025
2030
2035
2040
Year
Mar
ket S
hare
Fuel TypeBEV CNG Diesel Hybrid PHEV Petrol Flexfuel LPG HEV

17
Figure 12: Bass model projections for battery electric vehicles, the projection scenario shows saturation of the market potential in different countries depending on their initial sales as seen in the data.
Figure 13: Bass model projections for plug-in hybrid electric vehicles, the projection scenario shows saturation of the market potential in different countries depending on their initial sales as seen in the data.
Australia Canada Chile China
France Germany Italy Japan
Russia USA Ukraine United Kingdom
0.0
0.1
0.2
0.3
0.00
0.25
0.50
0.75
1.00
0e+00
5e−04
1e−03
0.00
0.25
0.50
0.75
1.00
0.00
0.25
0.50
0.75
1.00
0.00
0.25
0.50
0.75
1.00
0.00
0.25
0.50
0.75
1.00
0.0
0.1
0.2
0.3
0.00000
0.00025
0.00050
0.00075
0.00
0.25
0.50
0.75
1.00
0.00
0.25
0.50
0.75
1.00
0.00
0.25
0.50
0.75
1.00
2010 2020 2030 2040 2050 2010 2020 2030 2040 2050 2010 2020 2030 2040 2050 2010 2020 2030 2040 2050Year
Satu
ratio
n of
Mar
ket P
oten
tial (
BEV)
Australia Canada China France
Germany Italy Japan Russia
USA Ukraine United Kingdom
0.00
0.25
0.50
0.75
1.00
0.0
0.2
0.4
0.6
0.00
0.25
0.50
0.75
1.00
0.00
0.25
0.50
0.75
1.00
0.00
0.25
0.50
0.75
1.00
0.00
0.25
0.50
0.75
1.00
0.00025
0.00050
0.00075
0.00100
0.00
0.25
0.50
0.75
1.00
0.0
0.2
0.4
0.6
0.8
0.00
0.02
0.04
0.06
0.00
0.25
0.50
0.75
1.00
2010 2020 2030 2040 2050 2010 2020 2030 2040 2050 2010 2020 2030 2040 2050Year
Satu
ratio
n of
Mar
ket P
oten
tial (
PHEV
)

18
The projection generated from the regression model is relatively straightforward. The results are generated directly from the input assumptions and the corresponding vehicle attribute coefficients obtained from the estimation of the regression models. Under the most optimistic assumptions, annual sales of electric vehicles reach over 16 million by 2040 while the “Low” favorability scenario for EV adoption leads to a mere 4 million annual sales by 2040.
Figure 14: Regression model projections of annual EV sales across scenarios of “Low”, “Medium”, and “High” favorability for electric vehicle adoption (vehicle price, vehicle range, and model availability).
Lastly, we show a direct comparison of the electric vehicle projections from each of the three models in Figure 15. There is rough consistency in relative order of magnitudes between all the models though clearly the Bass diffusion model has a higher trajectory than the other two. The Bass has a very rapid initial growth due to the aggressive adoption of EVs in major markets such as China but the sales then plateau, but later pick up across some of the smaller of the 35 countries to reach nearly 100 million by 2030. Meanwhile, both the choice model and linear regression model grow continually in an exponential manner through 2040, though both are well below the target even in that year. Ultimately the results suggest it may be difficult to hit the 100 million target, even with very strong reductions in vehicle cost (price), increases in vehicle driving range and in the numbers of makes/models available.
4
8
12
16
2020 2025 2030 2035 2040Year
Annu
al s
ales
of E
Vs (m
illion
s)
ScenarioHighLowMedium

19
Figure 15: Model comparisons of three different projection methods: the discrete choice model, Bass diffusion of innovation model, and a linear regression model.
0
25
50
75
100
125
2020 2025 2030 2035 2040Year
Wor
ldw
ide
stoc
k of
EVs
(milli
ons)
MethodBass DiffusionChoice ModelLinear Regression

20
Discussion
Policy instruments
One of the critical implications of the multiple model projection conducted in this study is to investigate if these different approaches provide a consistent, robust basis on which to base policy decisions. The question of whether improving attributes and other aspects of favorability of electric vehicles leads to higher adoption of the technology is immediately apparent and consistent across all approaches. While the extent to which government agencies may wish to promote adoption of the technology may vary our research demonstrates that there is sufficient correlation between certain conditions and electric vehicle sales to point toward increased sales in the future if certain policy levers are implemented. From a vehicle price perspective, many government institutions already provide incentives based subsidies though their size and longevity can have a definite impact on adoption in the future. Vehicle driving range is an important attribute that has had a natural progression in the technology of increasing though certain policies such as the California Zero Emission Mandate’s recent update of the credit system has proven to directly target this attribute as well.
These models do not align completely; the Bass diffusion curves achieve much faster, steeper initial penetration of EVs than the other two approaches and may reflect an inherent tendency in this method to define a market penetration pathway, with the steepness and saturation point the main variables. The decision choice and regression approaches, when used to project, do not necessarily achieve any increased future market shares. These both show relatively slow initial increases given the trajectories we set for explanatory variables, though eventually catch up to the Bass curve. However, even with the large price reductions and major increases in numbers of vehicle models available, the sales share of EVs by 2040 is not more than 30% in any approach.
The overall takeaway is that it may be quite challenging to achieve targets such as 100 million electric vehicles worldwide by 2030 (the IEA and UN targets), though there could be changes in markets as well as consumer behavior that are poorly captured in these models. As always with projecting into the future with past data, the conditions prevailing (such as awareness and attitudes about EVs) are implicitly assumed to continue into the future. Tesla has shown that such perceptions can change rapidly, and the entry into the market of additional higher range battery-electric vehicles during the next two years will provide a fresh perspective on how consumers react to higher range.
Future work with the current data sets and models
There are several notable issues in our modeling efforts that need to be improved upon, and our work in this area, and with this data, will continue. In general, there are issues with the data including some possible errors that may influence the model calibration and results. Due to the large size of the dataset, identifying edge case errors is inherently difficult and will require additional time and effort by team members to clean. There are also additional explanatory variables that we would like to introduce such as the presence of recharging infrastructure in different countries. The issue there is that at a national level, recharging infrastructure is averaged over many areas with dense infrastructure and many without, and this may provide a poor correlation with the sales of vehicles within a country. But we hope to test its significance upon completion of data development in this area.
In the choice modeling, the erroneous coefficients among approximately 20% of the modeled countries need to be re-run. There are several approaches we intend to take including a multi-year model (rather than calibrating the choice model only to 2015 sales). Additionally, we are taking a different approach to the

21
alternative-specific constant estimation that may prove to have more reliable estimation and convergence when solving the model.
In the diffusion model, we intend to expand our modeling efforts from the Bass model in order to incorporate other exogenous variables such as price, knowledge/awareness, and infrastructure. The Generalized Bass Model is a step towards increasing modeling complexity but there are a number of other diffusion models in the literature, which can be leveraged to further investigate the adoption of electric vehicle technology.
For the regression model, some nuance can be given by providing uncertainty through bootstrapping results based on the standard errors of the results. In addition to possible changes from simply cleaning the data, additional model specifications can be investigated as well as different structural assumptions including non-linear additive models.

22
Appendix 1: methods and data analysis
Methods
There are a number of forecasting methods that are used to estimate future scenarios of technology adoption and each have corresponding strengths and weaknesses due to the assumptions associated with their respective modeling techniques. In order to reduce this specific modeling error, we approach our development of projections by using three distinct models: a choice model, diffusion of innovation model, and regression of trends model. The fundamental characterization of each respective model can be described as follows: a belief that consumers will rationally choose from a set of products based on their attributes, a belief that a specific technology will be adopted in a particular manner, and a belief that the success of a technology is associated with a number of factors (both intrinsic to the product and external to the product). The primary goal of our work is to attempt to find consistency across different models to demonstrate robustness in our findings and projections. In the following sections, we describe each of the approaches in detail.
Consumer choice model approach
In our consumer choice model approach, we have used a standard discrete choice process. In this model, we attempted to simulate consumers’ decision-making process about selecting a single product among a set of discrete choices, in this choice the decision to purchase a vehicle among a population of available vehicle models. The consumer chooses based on attributes of the product in comparison to other products. The desirability of attributes is standardized to units of utility, specifically the utility for a vehicle model i which is represented as:
i j ij i ij
u XE ] H � �¦ (1)
Where j is the index of vehicle attributes being considered by the consumer and Xij represents the values of each of the respective vehicle attributes. In our model, we included the vehicle attributes in set j={price, emissions rate, vehicle make, fuel type, vehicle segment, vehicle range, drive type, engine power, and engine size}. The parameter ζ represents the alternative specific constant. This term is a constant that represents the utility specific to the vehicle model not captured by the other attributes. Our model was run separately for each of the 39 countries. We assumed that the social and cultural aspects of each country lead to different responses to the value in the various vehicle attributes.
In order to estimate the values of βj which translate the attributes into utility space, we employed a typical logit procedure where the market share of vehicle i is determined as follows:
i
k
u
i u
k
eSe
¦
(2)
The βj parameter was then estimated via a maximum-likelihood estimation procedure that attempts to match the predicted market share to the actual market share by varying the βj parameters. We were then

23
able to estimate the respective market share resulting from variation in the input attributes. Xij can be adjusted to predict market shares of specific vehicle models as the price, range, and other attributes of electric vehicles changes over time.
Diffusion of innovation approach
The diffusion of innovation is widely studied field. The basis of this field is the assumption that the adoption of any technology follows a general growth trend that is sigmoidal in shape. While the specific parameters of the adoption curve can differ from one technology to another, the general shape remains the same. As a result, we were able to take advantage of this assumption and calibrate the curve against the available data. One of the earliest diffusion models is the Bass model as shown in Equation (3).
S t( ) = m p+q( )2
pexp - p+q( )t( )
1+ qp
exp - p+q( )t( )æèç
öø÷
2 (3)
In the Bass diffusion curve model, the sales S in a year t is determined by a number of parameters including the market potential m, the coefficient of innovation p, and the coefficient of imitation q. The model assumes that adopters are classified as innovators and imitators and the level and timing of adoption is dependent on the degree to which each of the adopters uptakes the technology. Our general approach was to separately estimate p and q for each country based on their respective sales of electric vehicle technology in their vehicle markets. Once the parameters were estimated, projections based on the year of adoption were made to generate scenarios of adoption in the future.
In order to align assumptions across models, we also investigated diffusion models that use exogenous explanatory variables. One such model is the Generalized Bass Model (GBM), which incorporates marketing variables in new product diffusion:
h t( ) = p+qF t( )( )x t( ) (4)
where
x t( ) =1+b1¶P t( )¶t
+b2¶A t( )¶t
(5)
The GBM allows for the incorporation of a price variable x(t), which can help to calibrate the model based on uptake across various nations across the globe. In addition, the price can be adjusted in projections based on policy scenarios and expectations of price changes in the technology. The additional variable can significantly increase the computational complexity of the estimation procedure (which is highly non-linear). We estimated the parameters using Maximum Likelihood Estimation (MLE), simulating a large number of starting points until a feasible solution is converged on.

24
Regression of trends approach
The regression model examines trends at several levels of aggregation. Unlike the discrete choice model, the regression model does not operate at the vehicle model level but we aggregated the data up to the segment and vehicle technology level for analysis. For the vehicle fuel technology division, summary statistics for numeric variables can be found in Table 1. The average vehicle price by fuel type and country varies by a substantial amount, as high as $700,000 for certain vehicle aggregations. Meanwhile, the number of models can vary in certain countries that only have a single vehicle model for a particular vehicle technology (often PHEVs or flex fuel vehicles) up to 587 vehicle models for typical gasoline vehicles.
Table 1: Summary statistics for regression model separated by vehicle fuel technology
Variable Variable Abbreviation Min Max Mean SD Vehicle Price ($) price 3,900 768,700 57,800 86,950 Emission Rate (gCO2/km) emrate 0 467 148 85.5 Number of Models numModels 1 587 76 118 Population Ci (pop) 5.6e5 1.4e9 1.9e8 3.7e8 Gas Price ($/gal) Ci (gasPrice) 0.5 2.5 1.53 0.46 GDP ($) Ci (gdp) 5.8e10 1.8e13 2.8e12 3.8e12 Unemployment (%) Ci (unemp) 0.7 26.3 7.7 4.9
The model at the fuel type level f includes petroleum (gasoline), hybrids, flex fuel vehicles, LPG, diesel, CNG, hydrogen, BEVs, and PHEVs and is represented as:
log s fct( ) = b1price fct +b2emrate fct+b3numModels fct+
b4countryc +b5fuel f +b6 countryc *fuel f( ) + a iCictiå +efct
(6)
Where other indexes include country c and year t. Additionally there are a number of country specific variables i captured in the regression including the country’s population, gas price, GDP, and unemployment. The remainder of the vehicle attribute variables were averaged over their respective indexes. We also included a more finely segregated model broken down by both vehicle segment and fuel type:
log s fsct( ) = b1price fsct +b2emrate fsct+b3numModels fsct+b4segment s
b5countryc +b6fuel f +b7 countryc *fuel f( ) + a iCictiå +e fct
(7)
The models are identical with the exception of the addition of the vehicle segment variable and the distinction of vehicle attributes across the segment variable. The summary statistics across the division and aggregation of data across both vehicle segments and vehicle fuel technology can be found in Table 2. The

25
maximum vehicle price is substantially higher than in Table 1 due to the smaller bins that the vehicles are being aggregated into. The macroeconomic variables of population, gas price, GDP, and unemployment remain the same as their values are only dependent on the country of origin and not on the aggregation of vehicle data.
Table 2: Summary statistics for regression model separated by vehicle fuel technology and vehicle segment
Variable Variable Abbreviation Min Max Mean SD Vehicle Price ($) Price 3,900 2.6e6 63,800 114,000 Emission Rate (gCO2/km) Emrate 0 490 150 73 Number of Models numModels 1 197 17 23 Population Ci (pop) 5.6e5 1.4e9 1.9e8 3.7e8 Gas Price ($/gal) Ci (gasPrice) 0.5 2.5 1.53 0.46 GDP ($) Ci (gdp) 5.8e10 1.8e13 2.8e12 3.8e12 Unemployment (%) Ci (unemp) 0.7 26.3 7.7 4.9

26
Appendix ii: results in detail
Model fitting
In the series of discrete choice models developed as in Equation (1), we are able to obtain results for 31 countries, four of which are shown in Table 3. While the full dataset contains 39 countries, only 34 contain electric vehicles and three of which were computationally intractable. There is a tremendous amount of variation in the valuation of different vehicle attributes from country to country that can be attributed to a number of factors including differences in vehicle market, social and cultural differences, government policy, and fuel availability to name a few.
While the odds-ratios in Table 3 are not immediately decipherable, we note that the signs and magnitudes for the majority of the countries are sensible. For example, in the United States the coefficients on both price and emissions rate are both negative indicating that all else equal purchasers of vehicles desire cheaper and cleaner/more fuel efficient vehicles. When looking at the relative coefficient sizes under fuel types, it may seem counterintuitive that relative to a battery electric vehicle baseline, petrol vehicles are actually negatively favored. However, once the range of the vehicle is taken into account, traditional gasoline vehicles come out much farther ahead in terms of consumer utility. On the flipside, this also means that a comparably ranged battery vehicle would actually be favored over traditional gasoline vehicles (in the United States). Other vehicle attributes we control for but whose coefficients are not displayed include the vehicle manufacturer, vehicle segment, engine power, engine size, and alternative specific constants for each individual vehicle model.
One significant issue that manifested in several countries was multicollinearity between price, vehicle emissions rate, and range of the vehicles. In about a sixth of the countries, the signs and magnitudes of coefficients were illogical. For example, in China the coefficients on price and emissions rate are both positive while the coefficient on range is negative. As a result, the model would predict consumers to favor more expensive, dirtier/less fuel efficient, and shorter ranges.

27
Table 3: Discrete choice logit model representative results for 4 of 31 countries. Coefficients represent odds-ratio of probability of choice corresponding to a vehicle model.
Variable United
States
China United
Kingdom
Norway Price ($100,000) -1.17***
(0.00507)
1.55***
(0.00454)
-1.05**
(0.0116)
-0.839**
(0.0358) Emissions Rate (mg CO2/km) -4.61***
(0.0163)
0.273***
(0.0196)
-24.8***
(0.0584)
-1.6***
(0.186) Range (m) 24.1***
(0.223)
-2.15***
(0.0916)
67.6***
(0.596)
19.7***
(0.363) Fuel Type
BEV (baseline) 0
(0)
0
(0)
0
(0)
0
(0)
CNG NA 10.1***
(0.0285)
NA -10.8***
(0.373)
Diesel -9.91***
(0.267)
12.6***
(0.0436)
-19.9***
(0.176)
-7.39***
(0.11)
Flexfuel -4.22***
(0.0754)
0.338***
(NA)
0.84***
(2.5e-10)
NA
Hybrid -5.35***
(0.0755)
11.2***
(0.0256)
-21.4***
(0.177)
-6.44***
(0.113)
Petrol -3.28***
(0.0754)
13***
(0.0252)
-19.5***
(0.176)
-8.25***
(0.110)
PHEV 4.03***
(0.0295)
11.6***
(NA)
8.48***
(0.0839)
2.22***
(0.0614)
Manufacturer x x x x
Segment x x x x
Engine Power x x x x
Engine Size x x x x
ASC (by model) x x x x
The relative coefficients on price between countries are displayed in Figure 1. The countries are ordered in terms of decreasing price sensitivity going from left to right. In our model, the relative utility gain from a decrease in price of $100,000 ranges from -10 to 0. The price coefficient provides a baseline level of utility for comparison for the other attributes. For example, for the United States an emissions rate coefficient of -4.6 translates roughly to a willingness to pay to decrease vehicle emissions (or increasing fuel economy) of approximately $394 per g CO2/km. Unfortunately, the collinearity issue mentioned before also reveals itself here. Twelve countries have a price coefficient greater than 0 (hence positive value coefficients) and are likely the result of a misspecified model.

28
Similarly, we display the relative coefficients on vehicle range between countries in Figure 17. A positive value on the coefficient is expected for vehicle range as all else equal a consumer would seek to purchase a vehicle with greater range. The variation in range preference is still quite substantial, ranging from -200 to over 100 in equivalent utility. However, the majority of countries have a smaller span with only a handful of countries greater than +/-20 from 0. We note that there is a distinct overlap in problematic countries in the price and range coefficients (China, France, Spain, Mexico, etc.).
Figure 16: Relative price ($100,000s) odds-ratio coefficients from discrete choice logit models run independently for 31 countries. Price sensitivity decreases from left to right.
Figure 17: Relative vehicle range (m) odds-ratio coefficients from discrete choice logit models run independently for 31 countries. Preference for vehicle range increases from left to right.
●
●●●●●●
●●●●●●●●●●
●●●●●●
●●
●
●
●●
●
●−10
−5
0
Braz
ilAr
gent
ina
Indo
nesi
aIn
dia
Turk
eyN
ethe
rland
sSo
uth
Afric
aAu
stra
liaR
ussi
aC
hile
USA
Uni
ted
King
dom
Portu
gal
Nor
way
Swed
enFi
nlan
dLu
xem
bour
gD
enm
ark
Gre
ece
Sout
h Ko
rea
Irela
ndIta
lySw
itzer
land
Mex
ico
Ger
man
yFr
ance
Spai
nC
hina
Japa
nBe
lgiu
mAu
stria
Country
Coe
ffici
ent o
n Pr
ice
●
●●●
●
●●●●●●●●●●●●●●●●●●●●●●
●
●●
●−200
−100
0
100
Mex
ico
Aust
ralia
Rus
sia
Sout
h Ko
rea
Gre
ece
Fran
ceLu
xem
bour
gTu
rkey
Spai
nC
hina
Indi
aAr
gent
ina
Indo
nesi
aC
hile
Italy
Belg
ium
Portu
gal
Ger
man
yJa
pan
Aust
riaSw
itzer
land
Nor
way
USA
Sout
h Af
rica
Den
mar
kSw
eden
Net
herla
nds
Uni
ted
King
dom
Finl
and
Irela
ndBr
azil
Country
Coe
ffici
ent o
n Ve
hicl
e R
ange
29
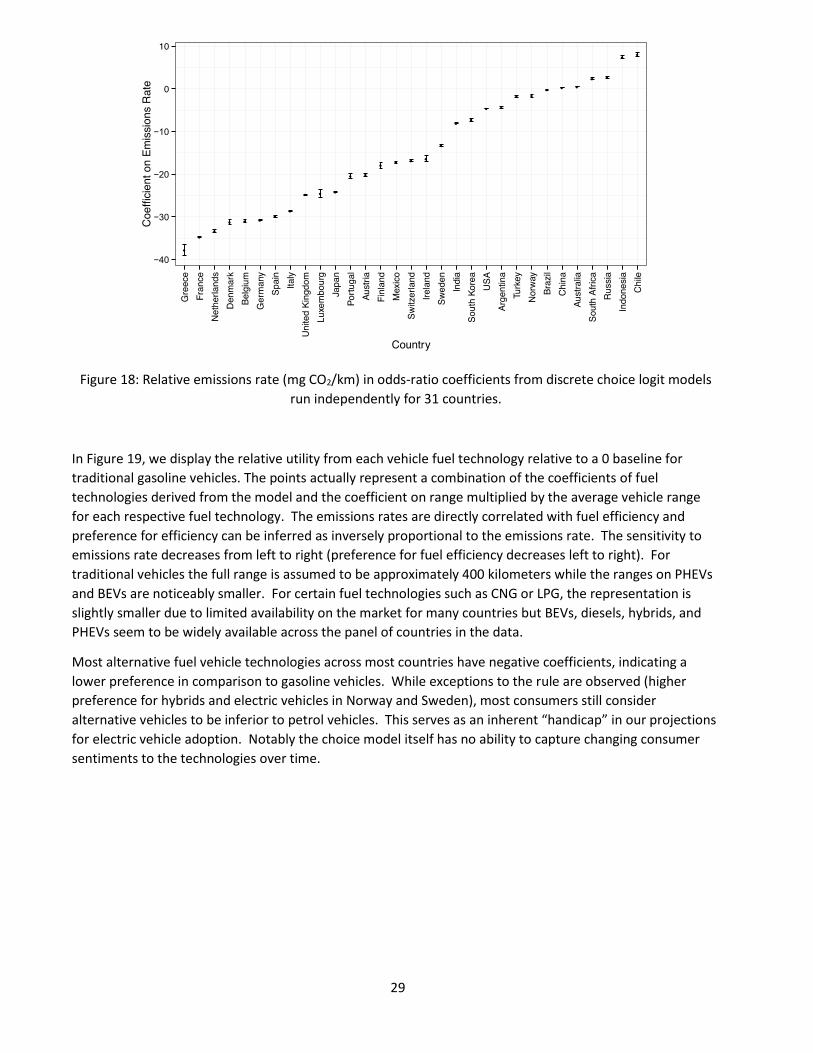
Figure 18: Relative emissions rate (mg CO2/km) in odds-ratio coefficients from discrete choice logit models run independently for 31 countries.
In Figure 19, we display the relative utility from each vehicle fuel technology relative to a 0 baseline for traditional gasoline vehicles. The points actually represent a combination of the coefficients of fuel technologies derived from the model and the coefficient on range multiplied by the average vehicle range for each respective fuel technology. The emissions rates are directly correlated with fuel efficiency and preference for efficiency can be inferred as inversely proportional to the emissions rate. The sensitivity to emissions rate decreases from left to right (preference for fuel efficiency decreases left to right). For traditional vehicles the full range is assumed to be approximately 400 kilometers while the ranges on PHEVs and BEVs are noticeably smaller. For certain fuel technologies such as CNG or LPG, the representation is slightly smaller due to limited availability on the market for many countries but BEVs, diesels, hybrids, and PHEVs seem to be widely available across the panel of countries in the data.
Most alternative fuel vehicle technologies across most countries have negative coefficients, indicating a lower preference in comparison to gasoline vehicles. While exceptions to the rule are observed (higher preference for hybrids and electric vehicles in Norway and Sweden), most consumers still consider alternative vehicles to be inferior to petrol vehicles. This serves as an inherent “handicap” in our projections for electric vehicle adoption. Notably the choice model itself has no ability to capture changing consumer sentiments to the technologies over time.
●●
●●●●●
●●
●●
●●
●
●●●●
●●
●●●
●●
●●●●
●
●
−40
−30
−20
−10
0
10
Gre
ece
Fran
ceN
ethe
rland
sD
enm
ark
Belg
ium
Ger
man
ySp
ain
Italy
Uni
ted
King
dom
Luxe
mbo
urg
Japa
nPo
rtuga
lAu
stria
Finl
and
Mex
ico
Switz
erla
ndIre
land
Swed
enIn
dia
Sout
h Ko
rea
USA
Arge
ntin
aTu
rkey
Nor
way
Braz
ilC
hina
Aust
ralia
Sout
h Af
rica
Rus
sia
Indo
nesi
aC
hile
Country
Coe
ffici
ent o
n Em
issi
ons
Rat
e

30
Figure 19: Coefficients representing relative utility of combined fuel technology and vehicle range relative to traditional petrol (gasoline) vehicles (baseline at 0). The points combine the results of the choice model for fuel type with the coefficients on range scaled to the average vehicle range in each respective vehicle fuel
technology.
The discrete choice approach provides a simple method to simulate the growth of a technology through a model of car buyers selecting a product amongst its competitors in the market. While there are a number of inconsistencies in results from certain countries, we find that a large portion of countries provide coefficient results in line with our expectations. It is not surprising to find a large amount of variation in valuation of vehicle attributes between countries and in fact helps to explain intrinsic differences between markets in different countries. There are a number of potential modeling issues specific to a logit based discrete choice approach but these results will be tempered by comparison across the diffusion and regression models to follow in sections 0 and 0 respectively.
● ●●
●
●
●
● ●●●● ● ●●●
●
●●●
●
●
●
●●●●●
●
●●● ● ●●
●●
●
●
●●
●●●
●
● ●● ●●●
●● ● ●●●● ●● ● ●●●
●●●●
●●●● ●●●
●
●
●
●
●
●
●●● ●
●● ●
●
●●
●●
●
●● ●●● ●● ● ●●
●●
● ● ● ●●● ●●●●
●●●● ●●●● ●
●●●
●
●●
● ●●●●
● ●●●●
●●
● ●●●
●
●●●●●
●●●●
●
●●
●
●●
●
●●
●
BEV CNG Diesel
Flexfuel Hybrid PHEV
LPG
−20
0
20
40
60
−10
−5
0
5
10
−30
−20
−10
0
10
20
−10
0
10
20
−30
−20
−10
0
10
20
−30
−20
−10
0
10
20
−10
0
10
Braz
ilC
hina
USA
Gre
ece
Sout
h Af
rica
Ger
man
yAu
stra
liaTu
rkey
Den
mar
kSp
ain
Fran
ceBe
lgiu
mLu
xem
bour
gSw
itzer
land
Irela
ndFi
nlan
dJa
pan
Italy
Chi
lePo
rtuga
lSo
uth
Kore
aAu
stria
Swed
enN
orwa
yR
ussi
aN
ethe
rland
sU
nite
d Ki
ngdo
mM
exic
o
Chi
naG
reec
eG
erm
any
Indi
aD
enm
ark
Spai
nFr
ance
Belg
ium
Luxe
mbo
urg
Switz
erla
ndFi
nlan
dIta
lyPo
rtuga
lAu
stria
Swed
enN
orwa
yN
ethe
rland
s
Braz
ilC
hina
USA
Gre
ece
Sout
h Af
rica
Ger
man
yIn
dia
Aust
ralia
Turk
eyD
enm
ark
Spai
nFr
ance
Arge
ntin
aBe
lgiu
mLu
xem
bour
gSw
itzer
land
Indo
nesi
aIre
land
Finl
and
Japa
nIta
lyC
hile
Portu
gal
Sout
h Ko
rea
Aust
riaSw
eden
Nor
way
Rus
sia
Net
herla
nds
Uni
ted
King
dom
Mex
ico
Braz
ilC
hina
USA
Ger
man
yIn
dia
Spai
nFr
ance
Arge
ntin
aSw
itzer
land
Finl
and
Japa
nIta
lyAu
stria
Swed
enN
ethe
rland
sU
nite
d Ki
ngdo
mM
exic
o
Braz
ilC
hina
USA
Gre
ece
Sout
h Af
rica
Ger
man
yIn
dia
Aust
ralia
Turk
eyD
enm
ark
Spai
nFr
ance
Arge
ntin
aBe
lgiu
mLu
xem
bour
gSw
itzer
land
Indo
nesi
aIre
land
Finl
and
Japa
nIta
lyC
hile
Portu
gal
Sout
h Ko
rea
Aust
riaSw
eden
Nor
way
Rus
sia
Net
herla
nds
Uni
ted
King
dom
Mex
ico
Braz
ilC
hina
USA
Gre
ece
Sout
h Af
rica
Ger
man
yIn
dia
Aust
ralia
Turk
eyD
enm
ark
Spai
nFr
ance
Belg
ium
Luxe
mbo
urg
Switz
erla
ndIre
land
Finl
and
Japa
nIta
lyC
hile
Portu
gal
Sout
h Ko
rea
Aust
riaSw
eden
Nor
way
Rus
sia
Net
herla
nds
Uni
ted
King
dom
Ger
man
yIn
dia
Aust
ralia
Turk
eySp
ain
Fran
ceBe
lgiu
mSw
itzer
land
Irela
ndJa
pan
Italy
Portu
gal
Sout
h Ko
rea
Net
herla
nds
Country
Coe
ffici
ent o
n Fu
el T
ype
and
Rang
e C
ombi
ned

31
Diffusion of innovation model
We chose to use a basic Bass diffusion model to project the adoption of electric vehicles in the future. Our models are calibrated separately for BEVs and PHEVs as well as independently for every country with over 3 years of sales for each of the respective technologies. The results of the calibration are shown in Figure 20 for BEVs and Figure 21 for PHEVs. The figures display the relative size of coefficients p and q among different countries. The coefficient of innovation p describes the initial uptake of the technology with the highest values appearing for Japan, USA, and France for BEVs and Japan, USA, and Canada for PHEVs. However, we do note that the coefficient is quite small compared to other technologies whose value is usually around 0.03. This indicates that the initial uptake of electric vehicles is significantly smaller than other technologies in the literature. Interestingly enough, the reference point for the coefficient of imitation q is 0.38 and is lower than quite a few of the estimated coefficient values in both BEV and PHEV technologies. Once the technology begins to pass the initial adoption phase, the Bass model estimates that a relatively rapid uptake of EVs will occur relative to other technologies. China has very high q values in both the Bass models for BEVs and PHEVs, likely due to their rapid adoption of both technologies in the recent years.
Figure 20: Coefficients from Bass model calibrated to historical sales of full battery electric vehicles. The p coefficient describes the coefficient of innovation, the higher this value the greater the initial uptake of the
technology when initially offered. The q coefficient describes the coefficient of imitation, the higher this value the greater the growth of the technology after the “first-takers” have been saturated.
●●●● ● ●●●● ● ●● ● ●
●●
●
●
●
●
●
● ●●● ●
● ●●●● ●
●●
●
●
● ●
p q
0.00000
0.00005
0.00010
0.00015
−0.5
0.0
0.5
1.0
1.5
Chi
naJa
pan
Mex
ico
USA
Can
ada
Aust
ralia
Rus
sia
Sout
h Af
rica
Braz
ilSo
uth
Kore
aC
hile
Mal
aysi
aFr
ance
Ger
man
yTh
aila
ndTu
rkey
Italy
Uni
ted
King
dom
Ukr
aine
Chi
naJa
pan
Mex
ico
USA
Can
ada
Aust
ralia
Rus
sia
Sout
h Af
rica
Braz
ilSo
uth
Kore
aC
hile
Mal
aysi
aFr
ance
Ger
man
yTh
aila
ndTu
rkey
Italy
Uni
ted
King
dom
Ukr
aine
Country
Coe
ffici
ent V
alue

32
Figure 21: Coefficients from Bass model calibrated to historical sales of plug-in hybrid electric vehicles. The p coefficient describes the coefficient of innovation, the higher this value the greater the initial uptake of the
technology when initially offered. The q coefficient describes the coefficient of imitation, the higher this value the greater the growth of the technology after the “first-takers” have been saturated.
Using the coefficients p and q and applying them to Equation (3), we are able to make basic projections of technology saturation. These estimates can be found in section 4.2.
Regression model
A set of basic linear regression models is run on two separate data aggregations from the main database. The first set of data is aggregated to the vehicle fuel technology and country level where all attributes in the model are grouped (sales-weighted averages for numeric variables) for analysis. Table 4 shows the set of regression results based on Equation (6). The coefficients are all logical with negative coefficients on undesirable traits such as price and emissions rate, and positive coefficients for vehicle range and number of available models for a given technology. The price coefficient ranges describe an effect of 0.4-0.8% decrease in the sale of a vehicle group corresponding to a $1,000 increase in price on average. Similarly, the emission rate describes a 1.4-1.6% increase resulting from a decrease in emissions rate of 1 g CO2/km on average. There are a number of other factors that can assist in the growth of EV technologies, particularly the increase in ranges of the vehicles (a 1.6-2.1% increase per km) and the number of available vehicle models (0.3-0.8% increase per model). The regression model includes dummy variables for the country as well as interactions between both fuel type and country as well as fuel type and gas prices but these effects are controls whose explicit coefficients are excluded from Table 4.
● ●● ● ●● ●● ●●
●
●
●
●●
● ●●
●●●
●● ●
●
●
p q
0e+00
1e−04
2e−04
3e−04
0.0
0.5
1.0
1.5
Chi
naJa
pan
USA
Can
ada
Aust
ralia
Rus
sia
Braz
ilFr
ance
Ger
man
yTu
rkey
Italy
Uni
ted
King
dom
Ukr
aine
Chi
naJa
pan
USA
Can
ada
Aust
ralia
Rus
sia
Braz
ilFr
ance
Ger
man
yTu
rkey
Italy
Uni
ted
King
dom
Ukr
aine
Country
Coe
ffici
ent V
alue

33
Table 4: Regression results on log(registrations) with data divided by vehicle fuel technology
Variable (1) (2) (3) Price ($) -7.65e-6***
(1.14e-6)
-2.89e-6**
(1.42e-6)
-4.29e-6**
(1.78e-6) Emissions Rate (g CO2/km) -0.016***
(0.002)
-0.014***
(0.002)
-0.014***
(0.002) Range (km) 0.019***
(0.005)
0.021***
(0.005)
0.016*
(0.008) Number of Models 0.008***
(0.001)
0.003*
(0.001)
0.005**
(0.002) Population - - 4.43e-10
(1.12e-8) GDP - - 2.47e-13
(1.46e-13) Unemployment - - -0.063
(0.075) Fuel Type BEV (baseline) 0
(0)
0
(0)
0
(0) CNG -4.459**
(1.644)
-11.352***
(2.189)
-10.032*
(5.886) Diesel 0.533
(1.669)
-2.362
(2.508)
2.373
(3.901) Flexfuel -0.638
(1.722)
0.402
(2.521)
-4.223
(3.875) Hybrid -10.642***
(2.589)
-11.833***
(1.952)
-3.599
(3.834) LPG -2.364
(1.691)
-10.621***
(2.479)
2.398
(4.77) PHEV 3.83***
(0.844)
4.084***
(1.065)
5.889
(4.497) Petrol 1.392
(1.703)
1.135
(1.899)
3.959
(3.927) Country x x x Country*Fuel Type x x Fuel Type*Gas Price x
Adjusted R2 0.749 0.904 0.887 n 749 565 339
The regression results from Table 5 are similar to those from Table 4 but the models are calibrated to data at higher level of detail as the data are additionally separated at the vehicle segment level in addition to the vehicle fuel technology and country. The models are the same with the exception of the inclusion of a dummy variable capturing the vehicle segment. One effect of this is a decrease in the impact of vehicle price on adoption down to 0.1% due to a $1,000 increase in price and is even insignificant in the full model (3). However, the effect of vehicle emissions and vehicle range is relatively close with the earlier results. The number of unique available models does increase substantially in importance: up to 3.3-4.8% increase per vehicle model on average.

34
Table 5: Regression results on log(registrations) with data divided by vehicle fuel technology and vehicle segment
Variable (1) (2) (3) Price ($) -1.48e-6***
(3.73e-7)
-1.00e-6**
(3.25e-7)
-5.64e-7
(1.78e-6) Emissions Rate (g CO2/km) -0.013***
(0.001)
-0.009***
(0.001)
-0.012***
(0.001) Range (km) 0.007***
(0.001)
0.006***
(0.001)
0.004**
(0.002) Number of Models 0.048***
(0.002)
0.035***
(0.002)
0.033***
(0.002) Population - - 4.43e-10
(1.12e-8) GDP - - 2.47e-13
(1.46e-13) Unemployment - - -0.063
(0.075) Fuel Type BEV (baseline) 0
(0)
0
(0)
0
(0) CNG -0.903***
(0.469)
-6.101***
(1.688)
2.118
(4.644) Diesel 3.188***
(0.462)
1.383
(0.992)
10.719***
(2.622) Flexfuel 2.15***
(0.505)
4.389***
(1.068)
9.201***
(2.769) Hybrid -5.856**
(2.016)
-5.7***
(1.688)
6.767**
(2.663) LPG 0.579
(0.497)
-0.351
(1.431)
9.3***
(3.358) PHEV 1.881*** (0.286)
1.86**
(0.598)
8.353**
(3.576) Petrol 3.734***
(0.479)
3.697***
(0.626)
13.197***
(2.62) Segment x x x Country x x x Country*Fuel Type x x Fuel Type*Gas Price x Adjusted R2 0.7 0.804 0.801 n 3,619 3,435 2,159

What is the Global Fuel Economy Initiative?The Global Fuel Economy Initiative believes that large gains could be made in fuel economy which would help every country to address the pressing issues of climate change, energy security and sustainable mobility. We will continue to raise awareness, present evidence, and off er support to enable countries to adopt eff ective fuel economy standards and policies that work in their circumstances and with their vehicle fl eet.
With the support of
SecretariatGlobal Fuel Economy Initiative60 Trafalgar SquareLondon WC2N 5DSUnited Kingdom+44 (0)207 930 3882 (t) +44 (0)207 930 3883 (f)
@GlobalFuelEcon | #GFEINetwork
www.youtube.com/GlobalFuelEcon
www.fl ickr.com/50by50campaign
Contact usEmail: [email protected]: www.globalfueleconomy.org