can real-time ultrasound elastography using the color score and strain ratio differentiate between...
TRANSCRIPT

The Egyptian Journal of Radiology and Nuclear Medicine (2014) 45, 75–87
Egyptian Society of Radiology and Nuclear Medicine
The Egyptian Journal of Radiology andNuclearMedicine
www.elsevier.com/locate/ejrnmwww.sciencedirect.com
ORIGINAL ARTICLE
Can real-time ultrasound elastography using
the color score and strain ratio differentiate between
benign and malignant solitary thyroid nodules?
* Corresponding author. Mobile: +2 01005285089.E-mail address: [email protected] (R. Refaat).
Peer review under responsibility of Egyptian Society of Radiology and
Nuclear Medicine.
Production and hosting by Elsevier
0378-603X � 2014 Production and hosting by Elsevier B.V. on behalf of Egyptian Society of Radiology and Nuclear Medicine.
http://dx.doi.org/10.1016/j.ejrnm.2013.12.005
Rania Refaata,*, Amr Kamel
b, Mahmoud Elganzory
b, Nahla M. Awad
c
a Department of Radiodiagnosis, Ain Shams University, Cairo, Egyptb Department of Surgery, Ain Shams University, Cairo, Egyptc Early Cancer Detection Unit of Cytology and Pathology, Ain Shams University Hospitals, Cairo, Egypt
Received 15 September 2013; accepted 8 December 2013Available online 22 January 2014
KEYWORDS
Real-time ultrasound
elastography (USE);
Benign solitary thyroid
nodules;
Malignant solitary thyroid
nodules;
Rago criteria;
Histopathological
examination
Abstract Background: Solitary thyroid nodule may represent a multitude of thyroid disorders;
therefore, detection of whether these nodules are benign or malignant is crucial for patient’s triage.
Objective: To evaluate the diagnostic performance of the latest generation of real-time ultrasound
elastography (USE) in differentiation between benign and malignant solitary thyroid nodules.
Materials and methods: Thirty consecutive patients who were referred for surgical treatment were
prospectively examined by real-timeUSE. Tissue stiffness on real-timeUSEwas determinedwith light
compression using the standard elastography color scoring system according to Rago criteria ranging
from 1 (low stiffness over the entire nodule) to 5 (high stiffness over the entire nodule and surrounding
tissue). The strain ratio (normal tissue to lesion strain ratio) was calculated. The histopathological
examination of these resected nodules was used as the diagnostic standard of reference.
Results: Scores of 1 and 2 with Rago criteria were highly significant seen in benign nodules, whereas,
scores of 4 and 5 with Rago criteria were highly significant seen in malignant nodules (p< 0.001) with
a sensitivity, specificity and diagnostic accuracy of 78.6%, 78.9% and 78.8% respectively. Additionally,
thebeststrainratiocut-offvalue fordiscriminationbetweenbenignandmalignantnodulesbyusingrecei-
ver operating characteristic analysiswas 2.20 (area under the curve of 0.861; p value<0.001)with a con-
sequential sensitivity, specificity and diagnostic accuracy of 85.7%, 90.5% and 88.6% respectively.
Conclusion: Both the color score and the strain ratio are higher in malignant solitary thyroid nodules
than those in benign ones. Consequently, real-time USE can be used for the differentiation of benign
andmalignant solitary thyroid nodules.Eventually, this reduces the numberof superfluous surgical pro-
cedures on benign thyroid nodules.� 2014 Production and hosting by Elsevier B.V. on behalf of Egyptian Society of Radiology and Nuclear
Medicine.
1. Introduction
Thyroid nodules are a common finding in the general popula-
tion (1). The number of thyroid nodules is increasing as theyare incidentally detected during imaging studies indicated fornon thyroid reasons. Additionally, most incidentally detected

76 R. Refaat et al.
thyroid nodules are asymptomatic and benign; however, it isclinically important to diagnose malignant nodules (2) whichaccount to 5% of thyroid nodules (3). Understanding the eti-
ology of nodular thyroid disease is a fundamental prerequisitefor its subsequent eradication (4).
Guidelines generally recommend the use of functional and
morphological characterization using a combination of clinicalexamination, diagnostic imaging and fine-needle aspirationbiopsy (FNAB) for the latter (5). FNAB is the best method
to differentiate between benign and malignant thyroid nodules,yet, it suffers the limitations of being invasive and sampling er-rors are inevitable (6). FNAB is also a time-intensive proce-dure as it requires sending to and evaluation of the sample
by the pathologist (7). On the other hand, ultrasound (US) isa non invasive and easily available imaging technique for theevaluation of thyroid nodules (8).
It is generally believed that US criteria such as hypoechog-enicity, the lack of a complete halo surrounding the nodule(irregular margins), microcalcifications, more tall than wide
shape and marked intranodular and absent or slight perinodu-lar vascularization using Doppler-flow (type III flow) are help-ful in targeting nodules at the highest risk of harboring thyroid
malignancy (3,5). Moreover, each characteristic increases thesensitivity in a number of combinations; nevertheless, thislacks adequate specificity for reliably diagnosing thyroidmalignancy (9).
Conversely, palpation is a basic and important methodin the assessment of thyroid nodules (10) as a firm andhard thyroid nodule on palpation is associated with an
increased risk of malignancy (5). Nevertheless, palpation issubjective and highly dependent on the examiner (11).Gray-scale US does not provide direct information corre-
sponding to the hardness of a nodule (10). During the lastfew years, a novel promising imaging technology based onthe elastic property of the tissue, USE has been added to
the diagnostic armamentarium (9). This is done by measur-ing the tissue strain induced non invasively by compression(10,12).
Accordingly, the objective of our study was to evaluate the
diagnostic performance of the latest generation of real-timeUSE as an individual variable in differentiation between be-nign and malignant solitary thyroid nodules using the histopa-
thological diagnosis of the resected thyroid nodules as thereference standard. Therefore, other ultrasound criteria, suchas the echogenicity and perfusion pattern of individual nod-
ules, are purposely not taken into account.
2. Patients
This is a prospective study conducted from December 2012 toJuly 2013 in which 30 consecutive patients with solitary thy-roid nodules who were referred for surgical treatment were in-cluded. Patients with multiple thyroid nodules (more than two
nodules), previous surgery or radioiodine therapy and patientswith thyroid nodules who refused or had any contraindicationfor thyroid surgery were excluded from our study. Patients
with purely cystic (anechoic nodules without solid compo-nents) and egg shell-calcified nodules were also on our exclu-sion list because of posterior enhancement or posterior
shadow artifacts of ultrasound imaging that could cause
color-coding problems. Additionally, patients with nodulesof greatest diameter larger than 40 mm were excluded becauseinsufficient normal thyroid tissue around the targeted nodule
ensues difficulties in measuring thyroid nodule elasticitywhether by the elastography color scoring system or by calcu-lation of the strain ratio. As practically, a large size can be a
limitation in the nodule-to-gland strain. Our study protocolwas approved by the Committee of Ethics. All patients gavetheir informed written consents. Complete history taking was
performed including age, sex and symptoms. Full dedicatedgeneral and local clinical examination was done. The patientswere operated upon within 7 days of the real-time ultrasoundelastographic evaluation.
3. Methods
3.1. Real-time ultrasound elastography
Real-time ultrasound elastography was performed preopera-
tively for all patients by the same radiologist having more than7 years of experience in thyroid imaging with EUB 7500 (Hit-achi Medical Corporation, Tokyo, Japan) ultrasound system
using a 6–14 MHz linear transducer (EUB-L65). The patientwas positioned on his or her back with the neck slightly ex-tended over a pillow to prevent over stretching of the neck
muscles. The probe was placed on the patient’s neck withUS gel creating a stand-off pad. Transverse and longitudinalgray-scale US images followed by real-time USE for each
nodule were obtained. During gray-scale US examination,the following features were evaluated: the greatest diameterof the nodule as well as the cystic component and the rim cal-cification if present to ensure the absence of the previously
mentioned exclusion criteria.During elastography, the probe was positioned on the neck
while applying compression (light pressure) by hand (the so-
called a freehand technique) and avoiding the use of high levelsof compression because strong pressure may lead to a misdiag-nosis. In addition, the patient was asked to avoid swallowing
and hold their breathing during the examination to minimizemotion of thyroid gland. Then, images were obtained byapplying light repetitive compression at the skin above the tar-geted thyroid nodule and were followed by decompression.
The compressive force optimal to achieve good examinationquality for ultrasound elastography was monitored using agraded numeric scale which was displayed on the screen. A va-
lue of 3 was required throughout the examination to enable agood evaluation through good examination quality. Moreover,we maintained constant level of compression throughout the
examination to obtain consistent results.A region of interest (ROI) was set by the radiologist for
elastography acquisition to position the target nodule at the
center of the ROI with adjacent normal tissue to be evaluatedoptimally provided by color homogeneity within the region ofinterest. As USE is based on acquiring two US images, one im-age before tissue compression by the probe and the other one
after tissue compression by the probe were obtained. Therein,tissue displacement was tracked by assessing the ultrasoundbeam propagation using a dedicated software [Extended Com-
bined Autocorrelation Method (Extended CAM); HitachiMedical Corporation]. Images were displayed in a split-screen
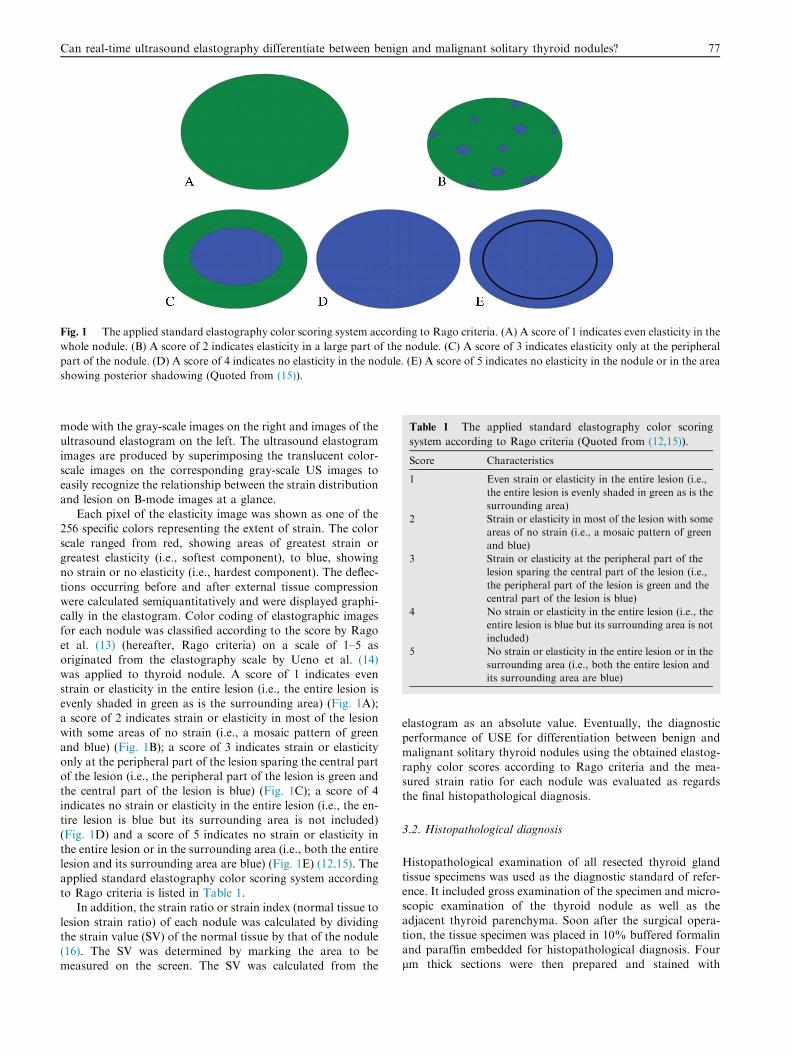
Fig. 1 The applied standard elastography color scoring system according to Rago criteria. (A) A score of 1 indicates even elasticity in the
whole nodule. (B) A score of 2 indicates elasticity in a large part of the nodule. (C) A score of 3 indicates elasticity only at the peripheral
part of the nodule. (D) A score of 4 indicates no elasticity in the nodule. (E) A score of 5 indicates no elasticity in the nodule or in the area
showing posterior shadowing (Quoted from (15)).
Table 1 The applied standard elastography color scoring
system according to Rago criteria (Quoted from (12,15)).
Score Characteristics
1 Even strain or elasticity in the entire lesion (i.e.,
the entire lesion is evenly shaded in green as is the
surrounding area)
2 Strain or elasticity in most of the lesion with some
areas of no strain (i.e., a mosaic pattern of green
and blue)
3 Strain or elasticity at the peripheral part of the
lesion sparing the central part of the lesion (i.e.,
the peripheral part of the lesion is green and the
central part of the lesion is blue)
4 No strain or elasticity in the entire lesion (i.e., the
entire lesion is blue but its surrounding area is not
included)
5 No strain or elasticity in the entire lesion or in the
surrounding area (i.e., both the entire lesion and
its surrounding area are blue)
Can real-time ultrasound elastography differentiate between benign and malignant solitary thyroid nodules? 77
mode with the gray-scale images on the right and images of theultrasound elastogram on the left. The ultrasound elastogram
images are produced by superimposing the translucent color-scale images on the corresponding gray-scale US images toeasily recognize the relationship between the strain distribution
and lesion on B-mode images at a glance.Each pixel of the elasticity image was shown as one of the
256 specific colors representing the extent of strain. The color
scale ranged from red, showing areas of greatest strain orgreatest elasticity (i.e., softest component), to blue, showingno strain or no elasticity (i.e., hardest component). The deflec-
tions occurring before and after external tissue compressionwere calculated semiquantitatively and were displayed graphi-cally in the elastogram. Color coding of elastographic imagesfor each nodule was classified according to the score by Rago
et al. (13) (hereafter, Rago criteria) on a scale of 1–5 asoriginated from the elastography scale by Ueno et al. (14)was applied to thyroid nodule. A score of 1 indicates even
strain or elasticity in the entire lesion (i.e., the entire lesion isevenly shaded in green as is the surrounding area) (Fig. 1A);a score of 2 indicates strain or elasticity in most of the lesion
with some areas of no strain (i.e., a mosaic pattern of greenand blue) (Fig. 1B); a score of 3 indicates strain or elasticityonly at the peripheral part of the lesion sparing the central partof the lesion (i.e., the peripheral part of the lesion is green and
the central part of the lesion is blue) (Fig. 1C); a score of 4indicates no strain or elasticity in the entire lesion (i.e., the en-tire lesion is blue but its surrounding area is not included)
(Fig. 1D) and a score of 5 indicates no strain or elasticity inthe entire lesion or in the surrounding area (i.e., both the entirelesion and its surrounding area are blue) (Fig. 1E) (12,15). The
applied standard elastography color scoring system accordingto Rago criteria is listed in Table 1.
In addition, the strain ratio or strain index (normal tissue to
lesion strain ratio) of each nodule was calculated by dividingthe strain value (SV) of the normal tissue by that of the nodule(16). The SV was determined by marking the area to bemeasured on the screen. The SV was calculated from the
elastogram as an absolute value. Eventually, the diagnosticperformance of USE for differentiation between benign and
malignant solitary thyroid nodules using the obtained elastog-raphy color scores according to Rago criteria and the mea-sured strain ratio for each nodule was evaluated as regards
the final histopathological diagnosis.
3.2. Histopathological diagnosis
Histopathological examination of all resected thyroid glandtissue specimens was used as the diagnostic standard of refer-ence. It included gross examination of the specimen and micro-scopic examination of the thyroid nodule as well as the
adjacent thyroid parenchyma. Soon after the surgical opera-tion, the tissue specimen was placed in 10% buffered formalinand paraffin embedded for histopathological diagnosis. Four
lm thick sections were then prepared and stained with

Table 2 The final histopathological diagnosis of the examined
thyroid nodules.
Neoplasm type Number of thyroid nodules
Hyperplastic nodules 15
Follicular adenomas 2
Hashimoto thyroiditis 1
Subacute thyroiditis 3
Papillary carcinomas 9
Medullary carcinomas 2
Follicular carcinomas 3
78 R. Refaat et al.
hematoxylin and eosin. All histopathological diagnoses weremade by an expert pathologist who was blinded for the USEparameters. Histopathological diagnoses were defined accord-
ing to widely recognized guidelines (17).
4. Data analysis
4.1. Statistical analysis
IBM SPSS statistics (V. 21.0, IBM Corp., USA, 2012) wasused for data analysis. Data were expressed as mean ± stan-dard deviation (SD) for quantitative parametric measures, in
addition to median percentiles for quantitative non-parametricmeasures and both number and percentage for categorizeddata. For comparison between two independent mean groups
(A)
(B)
Fig. 2 (A) Split-screen US elastogram (left) and B-mode ultrasound
green as is the surrounding thyroid tissue (a score of 1). The elastogram
(red/yellow) with SV of 0.55% and 0.62% respectively. The strain ra
Photomicrograph of the histopathological section of the resected thyr
stain; original magnification, ·100).
for parametric data, Students’s test was used. While,Chi-square test was applied to study the association between
each two variables or comparison between two independent
image (right) show the entire hypoechoic nodule is evenly shaded
(left) shows the nodule and normal thyroid tissue of good elasticity
tio of the nodule is 1.13 and the grade of compression is 3. (B)
oid gland tissue reveals a hyperplastic nodule (Hematoxylin-eosin
Can real-time ultrasound elastography differentiate between benign and malignant solitary thyroid nodules? 79
groups as regards the categorized data. The final histopathol-ogical diagnosis was used as the reference standard. The prob-ability of error (p value) at 0.05 was considered significant,
while, at 0.01 and 0.001 was considered highly significant. Inaddition, the diagnostic validity test was used to calculatethe sensitivity, specificity, positive predictive value, negative
predictive value and diagnostic accuracy or efficacy. Alterna-tively, receiver operating characteristic (ROC) analysis wasconstructed to obtain the best cut-off value for the strain ratio.
5. Results
5.1. Demographic and histopathological characteristics
35 thyroid nodules were examined in this prospective study. 25
patients with 1 thyroid nodule for each underwent lobectomyand isthmectomy and 5 patients with 2 nodules for each (onein each lobe) underwent total thyroidectomy. The mean ageof patients with malignant nodules was 37.8 ±5.1 years, while,
that of patients with benign nodules was 42.6 ± 7.2 years.Consequently, there was a significant difference (p < 0.05)between the mean age of patients with malignant nodules
(A)
(B)
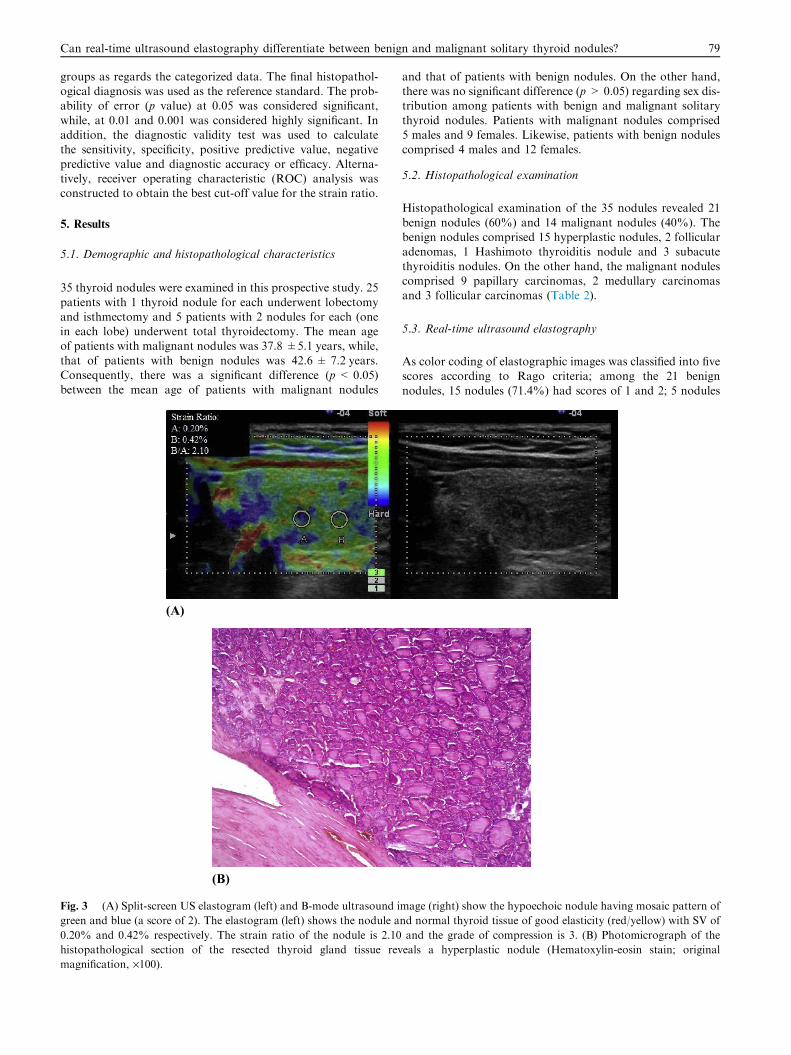
Fig. 3 (A) Split-screen US elastogram (left) and B-mode ultrasound i
green and blue (a score of 2). The elastogram (left) shows the nodule a
0.20% and 0.42% respectively. The strain ratio of the nodule is 2.10
histopathological section of the resected thyroid gland tissue rev
magnification, ·100).
and that of patients with benign nodules. On the other hand,there was no significant difference (p > 0.05) regarding sex dis-tribution among patients with benign and malignant solitary
thyroid nodules. Patients with malignant nodules comprised5 males and 9 females. Likewise, patients with benign nodulescomprised 4 males and 12 females.
5.2. Histopathological examination
Histopathological examination of the 35 nodules revealed 21
benign nodules (60%) and 14 malignant nodules (40%). Thebenign nodules comprised 15 hyperplastic nodules, 2 follicularadenomas, 1 Hashimoto thyroiditis nodule and 3 subacute
thyroiditis nodules. On the other hand, the malignant nodulescomprised 9 papillary carcinomas, 2 medullary carcinomasand 3 follicular carcinomas (Table 2).
5.3. Real-time ultrasound elastography
As color coding of elastographic images was classified into fivescores according to Rago criteria; among the 21 benign
nodules, 15 nodules (71.4%) had scores of 1 and 2; 5 nodules
mage (right) show the hypoechoic nodule having mosaic pattern of
nd normal thyroid tissue of good elasticity (red/yellow) with SV of
and the grade of compression is 3. (B) Photomicrograph of the
eals a hyperplastic nodule (Hematoxylin-eosin stain; original
(A)
(B)
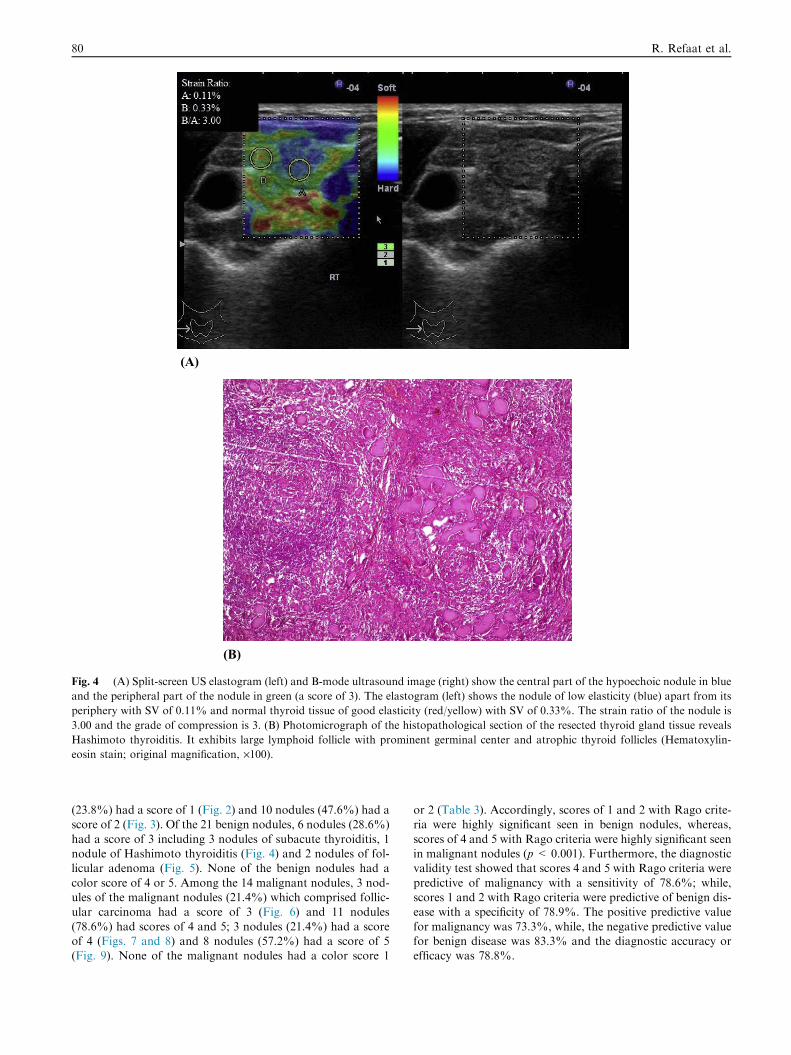
Fig. 4 (A) Split-screen US elastogram (left) and B-mode ultrasound image (right) show the central part of the hypoechoic nodule in blue
and the peripheral part of the nodule in green (a score of 3). The elastogram (left) shows the nodule of low elasticity (blue) apart from its
periphery with SV of 0.11% and normal thyroid tissue of good elasticity (red/yellow) with SV of 0.33%. The strain ratio of the nodule is
3.00 and the grade of compression is 3. (B) Photomicrograph of the histopathological section of the resected thyroid gland tissue reveals
Hashimoto thyroiditis. It exhibits large lymphoid follicle with prominent germinal center and atrophic thyroid follicles (Hematoxylin-
eosin stain; original magnification, ·100).
80 R. Refaat et al.
(23.8%) had a score of 1 (Fig. 2) and 10 nodules (47.6%) had ascore of 2 (Fig. 3). Of the 21 benign nodules, 6 nodules (28.6%)
had a score of 3 including 3 nodules of subacute thyroiditis, 1nodule of Hashimoto thyroiditis (Fig. 4) and 2 nodules of fol-licular adenoma (Fig. 5). None of the benign nodules had a
color score of 4 or 5. Among the 14 malignant nodules, 3 nod-ules of the malignant nodules (21.4%) which comprised follic-ular carcinoma had a score of 3 (Fig. 6) and 11 nodules
(78.6%) had scores of 4 and 5; 3 nodules (21.4%) had a scoreof 4 (Figs. 7 and 8) and 8 nodules (57.2%) had a score of 5(Fig. 9). None of the malignant nodules had a color score 1
or 2 (Table 3). Accordingly, scores of 1 and 2 with Rago crite-ria were highly significant seen in benign nodules, whereas,
scores of 4 and 5 with Rago criteria were highly significant seenin malignant nodules (p< 0.001). Furthermore, the diagnosticvalidity test showed that scores 4 and 5 with Rago criteria were
predictive of malignancy with a sensitivity of 78.6%; while,scores 1 and 2 with Rago criteria were predictive of benign dis-ease with a specificity of 78.9%. The positive predictive value
for malignancy was 73.3%, while, the negative predictive valuefor benign disease was 83.3% and the diagnostic accuracy orefficacy was 78.8%.

Can real-time ultrasound elastography differentiate between benign and malignant solitary thyroid nodules? 81
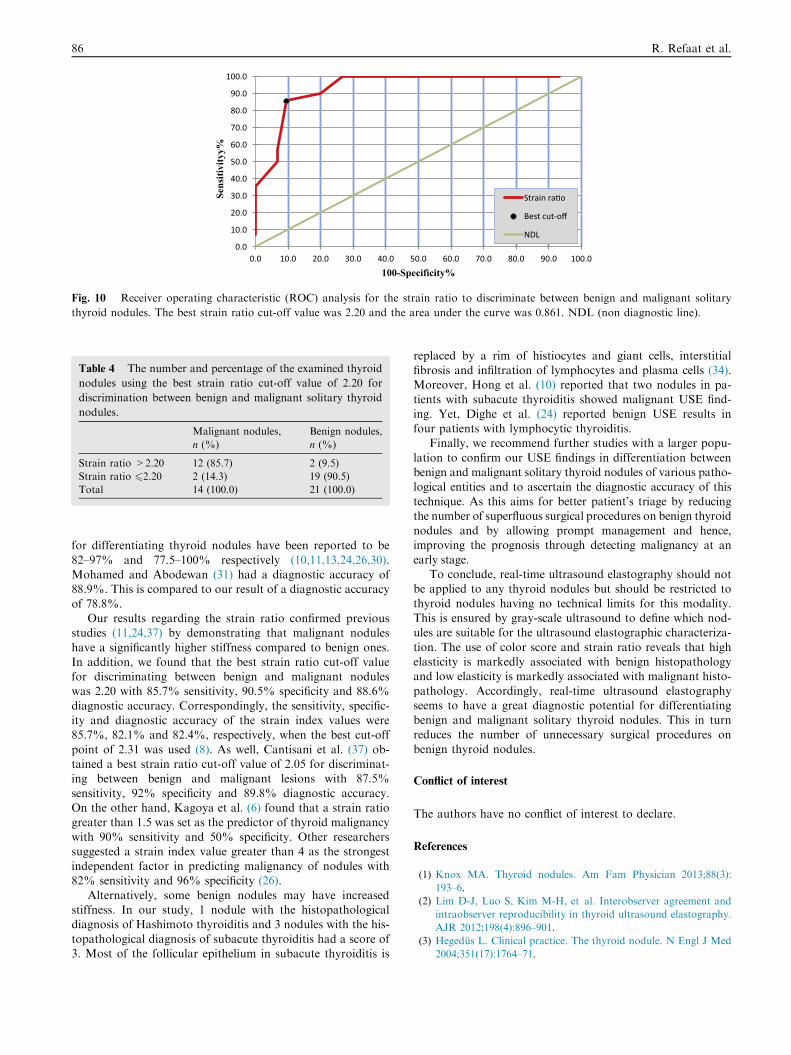
By using ROC analysis for the strain ratio to discriminatebetween benign and malignant solitary thyroid nodules(Fig. 10), the best strain ratio cut-off value was 2.20. The
area under the curve was 0.861, Odd’s ratio (95% confidenceinterval) was 57.0 (7.06–460.4) and p was <0.001. Thismeans in other words that a strain ratio >2.20 identified
malignant nodules and a strain ratio 62.20 identified benignnodules having a consequential sensitivity of 85.7%, specific-ity of 90.5%, positive predictive value of 85.7%, negative pre-
dictive value of 90.5% and diagnostic accuracy or efficacy of88.6%. Among malignant thyroid nodules (n= 14); 2 nod-ules (14.3%) had a strain ratio 62.20 and 12 nodules(85.7%) had a strain ratio >2.20. Alternatively, among those
benign nodules (n = 21); 19 nodules (90.5%) had a strain ra-tio 62.20 and 2 nodules (9.5%) had a strain ratio >2.20(Table 4).
(A)
(B)
Fig. 5 (A) Split-screen US elastogram (left) and B-mode ultrasound im
and the peripheral part of the nodule in green (a score of 3). The elasto
periphery with SV of 0.15% and normal thyroid tissue of good elastici
3.53 and the grade of compression is 3. (B) Photomicrograph of the hi
follicular adenoma of microglandular pattern (Hematoxylin-eosin stai
6. Discussion
A number of different diagnostic approaches have been pro-posed including radionuclide scanning with technetium-99m
methylisobutylnitrile (Tc-99m MIBI) and Fluorodeoxyglucosepositron-emission tomography (FDG-PET); however, theyturned out to be poor predictors of malignancy and of limited
clinical efficacy (18,19). In addition, recent guidelines havementioned that FNAB should not to be performed for all thy-roid nodules (5) and US examination represents the main tool
in risk stratification of palpable and non palpable lesions andtheir selection for fine needle aspiration (20,21). Currently,elastography has been introduced to augment the diagnosticaccuracy of gray-scale ultrasound (22). Furthermore, it has
been established that the thyroid gland is well-positioned forelastographic examination being easily assessed and efficiently
age (right) show the central part of the hypoechoic nodule in blue
gram (left) shows the nodule of low elasticity (blue) apart from its
ty (red/yellow) with SV of 0.53%. The strain ratio of the nodule is
stopathological section of the resected thyroid gland tissue reveals
n; original magnification, ·400).
82 R. Refaat et al.
compressed against underlying anatomic structures with anultrasound probe (10).
In this study, we used real-time USE which has proven to
be far more advantageous in clinical application (7) as it issimple requiring little time during routine US examinations(23). Real-time USE also gives available immediate results
and facilitates the dynamic visualization of lesions duringcompression with the calculation of the degree of the softtissue deformation which is combined with a gray-scale US
image as an elastography map (8). As well, we performedreal-time USE using external compression like most studiesin which the elastographic image is created by a slight rais-ing and lowering movement with the transducer and the
elastogram is generated in real-time. In other studies, thepulsation of carotid artery was used as the compression
(A)
(B)
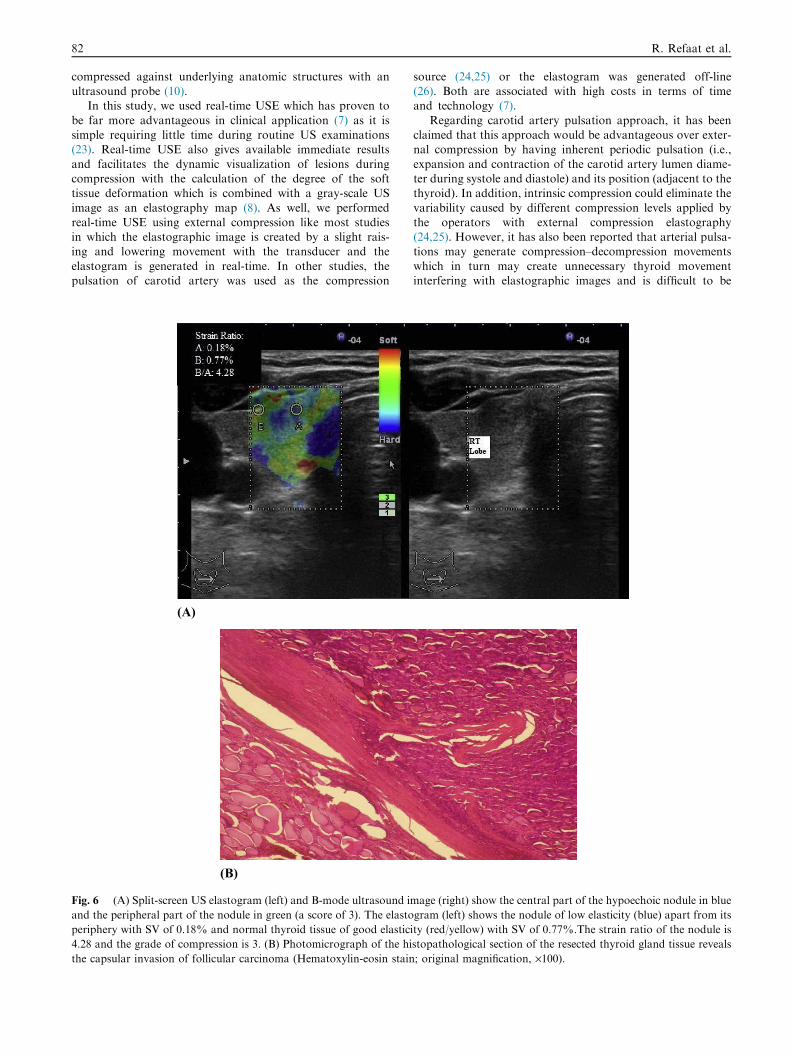
Fig. 6 (A) Split-screen US elastogram (left) and B-mode ultrasound i
and the peripheral part of the nodule in green (a score of 3). The elasto
periphery with SV of 0.18% and normal thyroid tissue of good elastic
4.28 and the grade of compression is 3. (B) Photomicrograph of the hi
the capsular invasion of follicular carcinoma (Hematoxylin-eosin stain
source (24,25) or the elastogram was generated off-line(26). Both are associated with high costs in terms of timeand technology (7).
Regarding carotid artery pulsation approach, it has beenclaimed that this approach would be advantageous over exter-nal compression by having inherent periodic pulsation (i.e.,
expansion and contraction of the carotid artery lumen diame-ter during systole and diastole) and its position (adjacent to thethyroid). In addition, intrinsic compression could eliminate the
variability caused by different compression levels applied bythe operators with external compression elastography(24,25). However, it has also been reported that arterial pulsa-tions may generate compression–decompression movements
which in turn may create unnecessary thyroid movementinterfering with elastographic images and is difficult to be
mage (right) show the central part of the hypoechoic nodule in blue
gram (left) shows the nodule of low elasticity (blue) apart from its
ity (red/yellow) with SV of 0.77%.The strain ratio of the nodule is
stopathological section of the resected thyroid gland tissue reveals
; original magnification, ·100).

Can real-time ultrasound elastography differentiate between benign and malignant solitary thyroid nodules? 83
restricted (23). Therefore, in our study, we did not use carotidartery pulsation as a compression source.
We applied compression (light pressure) and avoided using
high levels of compression as it is well known that the associ-ation between compression and strain in high levels of com-pression is no longer proportional (23). Thus, the freehand
compression applied on the neck region in our study wasstandardized by real-time measurement to be maintainedthroughout the examination constant at an intermediate level
optimal for US elastographic evaluation. In addition, thishas the benefit of minimizing the variability whether interob-server (to prevent differences among operators) and intraob-server (to standardize the degree of nodule compression) and
hence, the benefit of obtaining reliable results (13).
(A)
(B)
Fig. 7 (A) Split-screen US elastogram (left) and B-mode ultrasound i
4). The elastogram (left) shows the nodule of low elasticity (blue)
(red/yellow) with SV of 0.92%. The strain ratio of the nodule is 7.08
histopathological section of the resected thyroid gland tissue reveals m
stain; original magnification, ·400).
To our knowledge, although several studies have evaluatedthis technique, surgical intervention was performed only in alimited number of studies (10,13,23,25,26). As a result,
deficiency of surgical confirmation in the majority hampersto some extent a wider range of conclusions. Conversely, weadequately defined the selection; in addition, the final histopa-
thological diagnosis was supplemented to all included patients.Furthermore, recent advances in elastography allow quantifi-cation using the strain ratio calculated as the ratio of stiffness
between nodular tissue versus surrounding normal thyroid tis-sue (27). Consequently, we utilized this latest generation ofreal-time USE to differentiate between benign and malignantsolitary thyroid nodules using the color scale and by measuring
the stain ratio using SV, the absolute value, which quantifies
mage (right) show the entire hypoechoic nodule in blue (a score of
with SV of 0.13% and normal thyroid tissue of good elasticity
and the grade of compression is 3. (B) Photomicrograph of the
edullary carcinoma with amyloid deposition (Hematoxylin-eosin

84 R. Refaat et al.
nodule stiffness as an advantage of clear reproducibility andassignment (7).
We purposely evaluated the diagnostic performance of the
latest generation of real-time USE as an individual variable.Herein, the use of gray-scale US maintained a substantialimportance to ensure the absence of exclusion criteria which
represent the technical limits of real-time USE technique asfollows. The main determinant of nodule stiffness is the fluidcontent and not the solid wall (13). Additionally, the
classic elastogram for a cyst consists of three color layers(blue–green–red) from top to bottom (28). On the otherhand, macrocalcifications (either coarse or shell calcifica-tions) have a hard blue appearance at real-time USE (29),
as the US beam does not cross the calcification (13)and the compression does not result in tissue strain deforma-tion (30).
The final diagnosis which was proved by histopathologyshowed that 40% of the included thyroid nodules had
(A)
(B)
Fig. 8 (A) Split-screen US elastogram (left) and B-mode ultrasound im
The elastogram (left) shows the nodule of low elasticity (blue) with SV
with SV of 0.91%. The strain ratio of the nodule is 8.27 and the grade
section of the resected thyroid gland tissue reveals follicular varian
(Hematoxylin-eosin stain; original magnification, ·400).
malignancy. This is in agreement with the obtained result of21–54% in previous studies (10,13,26,30). The high prevalenceof malignant nodules in the present study is due to the enroll-
ment of patients referred by primary oncology centers forundergoing surgery and to the exclusion criteria of purely cys-tic and the peripherally calcified nodules. Even a higher prev-
alence of malignancy of 62.2% was found in the study done byMohamed and Abodewan (31).
We used the elastography color scoring system according
to Rago criteria ranging from 1 to 5. Scores of 4 and 5 inour study were highly significant seen in malignant nodules(11 out of 14 nodules) (78.6%). This was consistent withother studies (11,13,15,24,26,30). On the other hand, Hong
et al. (10) adopted a scoring system for tissue stiffness onUSE ranging from 1 (low stiffness over the entire nodule)to 6 (high stiffness over the entire nodule and surrounding
tissue). They found that 86 of 96 benign nodules (90%)had a score of 1–3, whereas, 43 of 49 malignant nodules
age (right) show the entire hypoechoic nodule in blue (a score of 4).
of 0.11% and normal thyroid tissue of good elasticity (red/yellow)
of compression is 3. (B) Photomicrograph of the histopathological
t of papillary carcinoma with its characteristic nuclear features

(A)
(B)
Fig. 9 (A) Split-screen US elastogram (left) and B-mode ultrasound image (right) show both the entire hypoechoic lesion and its
surrounding area in blue (a score of 5). The elastogram (left) shows the nodule of low elasticity (blue) with SV of 0.06% and normal
thyroid tissue of good elasticity (red/yellow) with SV of 0.67%. The strain ratio of the nodule is 11.17 and the grade of compression is 3.
(B) Photomicrograph of the histopathological section of the resected thyroid gland tissue reveals papillary carcinoma (Hematoxylin-eosin
stain; original magnification, ·400).
Table 3 The examined thyroid nodules with the obtained
elastography color scores according to Rago criteria.
Malignant nodules, n (%) Benign nodules, n (%)
Scores 1 and 2 0 (0.0) 15 (71.4)
Score 3 3 (21.4) 6 (28.6)
Scores 4 and 5 11 (78.6) 0 (0.0)
Total 14 (100.0) 21 (100.0)
Can real-time ultrasound elastography differentiate between benign and malignant solitary thyroid nodules? 85
(88%) had a score of 4–6. Likewise, in the study done byMohamed and Abodewan (31) scores 4–6 were found in 25of 28 patients (89.3%) having a final diagnosis of malignancy.
Whereas, scores of 1–3 were found in 15 out of 17 patients(88.2%) with an ultimate histopathological diagnosis of abenign lesion.
In this study, 9 papillary thyroid carcinomas (100%) hadscores of 4 and 5. Similarly, in the study done by Hong et al.(10), 41 of 44 papillary thyroid carcinomas (93%) had a scoreof 4–6. It is clarified that papillary thyroid carcinoma has
complex papillae with a central fibrovascular stalk, in addition
to psammoma bodies and fibrosis which are often found inthem (32,33). On the other hand, the study performed byMohamed and Abodewan (31) revealed 1 papillary carcinoma
having an elastography score of 3.It has been reported that USE has an important limitation
of probably lacking sensitivity for follicular thyroid carcinoma(30) with the inability to sufficiently differentiate between
thyroid follicular carcinoma and follicular adenoma (7). Aswell, we detected 3 follicular thyroid carcinomas having a scoreof 3. This result corresponds to the result of the study done by
Hong et al. (10) and Mohamed and Abodewan (31). Likewise,Bojunga et al. (11) overlooked 16 of the 153 final thyroid malig-nancies including four of the nine follicular carcinomas (44%).
The gross anatomy and cellular patterns of follicular carci-noma overlap with those of benign follicular adenoma. Never-theless, this kind of thyroid malignancy can be differentiated
from benign follicular adenoma only when capsular or vascularinvasion are discovered at histologic examination (34–36).
USE in this study showed a sensitivity of 78.6% and aspecificity of 78.9%. The sensitivity and specificity of USE
0.0
10.0
20.0
30.0
40.0
50.0
60.0
70.0
80.0
90.0
100.0
0.0 10.0 20.0 30.0 40.0 50.0 60.0 70.0 80.0 90.0 100.0
Sens
itivi
tyy%
100-Specificity%
Strain ra�o
Best cut-off
NDL
Fig. 10 Receiver operating characteristic (ROC) analysis for the strain ratio to discriminate between benign and malignant solitary
thyroid nodules. The best strain ratio cut-off value was 2.20 and the area under the curve was 0.861. NDL (non diagnostic line).
Table 4 The number and percentage of the examined thyroid
nodules using the best strain ratio cut-off value of 2.20 for
discrimination between benign and malignant solitary thyroid
nodules.
Malignant nodules,
n (%)
Benign nodules,
n (%)
Strain ratio >2.20 12 (85.7) 2 (9.5)
Strain ratio 62.20 2 (14.3) 19 (90.5)
Total 14 (100.0) 21 (100.0)
86 R. Refaat et al.
for differentiating thyroid nodules have been reported to be
82–97% and 77.5–100% respectively (10,11,13,24,26,30).Mohamed and Abodewan (31) had a diagnostic accuracy of88.9%. This is compared to our result of a diagnostic accuracy
of 78.8%.Our results regarding the strain ratio confirmed previous
studies (11,24,37) by demonstrating that malignant nodules
have a significantly higher stiffness compared to benign ones.In addition, we found that the best strain ratio cut-off valuefor discriminating between benign and malignant noduleswas 2.20 with 85.7% sensitivity, 90.5% specificity and 88.6%
diagnostic accuracy. Correspondingly, the sensitivity, specific-ity and diagnostic accuracy of the strain index values were85.7%, 82.1% and 82.4%, respectively, when the best cut-off
point of 2.31 was used (8). As well, Cantisani et al. (37) ob-tained a best strain ratio cut-off value of 2.05 for discriminat-ing between benign and malignant lesions with 87.5%
sensitivity, 92% specificity and 89.8% diagnostic accuracy.On the other hand, Kagoya et al. (6) found that a strain ratiogreater than 1.5 was set as the predictor of thyroid malignancy
with 90% sensitivity and 50% specificity. Other researcherssuggested a strain index value greater than 4 as the strongestindependent factor in predicting malignancy of nodules with82% sensitivity and 96% specificity (26).
Alternatively, some benign nodules may have increasedstiffness. In our study, 1 nodule with the histopathologicaldiagnosis of Hashimoto thyroiditis and 3 nodules with the his-
topathological diagnosis of subacute thyroiditis had a score of3. Most of the follicular epithelium in subacute thyroiditis is
replaced by a rim of histiocytes and giant cells, interstitialfibrosis and infiltration of lymphocytes and plasma cells (34).Moreover, Hong et al. (10) reported that two nodules in pa-tients with subacute thyroiditis showed malignant USE find-
ing. Yet, Dighe et al. (24) reported benign USE results infour patients with lymphocytic thyroiditis.
Finally, we recommend further studies with a larger popu-
lation to confirm our USE findings in differentiation betweenbenign and malignant solitary thyroid nodules of various patho-logical entities and to ascertain the diagnostic accuracy of this
technique. As this aims for better patient’s triage by reducingthe number of superfluous surgical procedures on benign thyroidnodules and by allowing prompt management and hence,improving the prognosis through detecting malignancy at an
early stage.To conclude, real-time ultrasound elastography should not
be applied to any thyroid nodules but should be restricted to
thyroid nodules having no technical limits for this modality.This is ensured by gray-scale ultrasound to define which nod-ules are suitable for the ultrasound elastographic characteriza-
tion. The use of color score and strain ratio reveals that highelasticity is markedly associated with benign histopathologyand low elasticity is markedly associated with malignant histo-
pathology. Accordingly, real-time ultrasound elastographyseems to have a great diagnostic potential for differentiatingbenign and malignant solitary thyroid nodules. This in turnreduces the number of unnecessary surgical procedures on
benign thyroid nodules.
Conflict of interest
The authors have no conflict of interest to declare.
References
(1) Knox MA. Thyroid nodules. Am Fam Physician 2013;88(3):
193–6.
(2) Lim D-J, Luo S, Kim M-H, et al. Interobserver agreement and
intraobserver reproducibility in thyroid ultrasound elastography.
AJR 2012;198(4):896–901.
(3) Hegedus L. Clinical practice. The thyroid nodule. N Engl J Med
2004;351(17):1764–71.

Can real-time ultrasound elastography differentiate between benign and malignant solitary thyroid nodules? 87
(4) Hegedus L, Bonnema SJ, Bennedbaek FN. Management of
simple nodular goiter: current status and future perspectives.
Endocr Rev 2003;24(1):102–32.
(5) Gharib H, Papini E, Paschke R, et al. AACE/AME/ETA task
force on thyroid nodules. American Association of Clinical
Endocrinologists, Associazione Medici Endocrinologi, and Euro-
pean Thyroid Association medical guidelines for clinical practice
for the diagnosis and management of thyroid nodules. Endocr
Pract 2010;16(Suppl. 1):1–43.
(6) Kagoya R, Monobe H, Tojima H. Utility of elastography for
differential diagnosis of benign and malignant thyroid nodules.
Otolaryngol Head Neck Surg 2010;143(2):230–4.
(7) Vorlander C, Wolff J, Saalabian S, et al. Real-time ultrasound
elastography––a noninvasive diagnostic procedure for evaluating
dominant thyroid nodules. Langenbecks Arch Surg 2010;
395(7):865–71.
(8) Ciledag N, Arda K, Aribas BK, et al. The utility of ultrasound
elastography and MicroPure imaging in the differentiation
of benign and malignant thyroid nodules. AJR 2012;198(3):
W244–9.
(9) Hegedus L. Can elastography stretch our understanding of
thyroid histomorphology? J Clin Endocrinol Metab 2010;95(12):
5213–5.
(10) Hong Y, Liu X, Li Z, et al. Real-time ultrasound elastography in
the differential diagnosis of benign and malignant thyroid
nodules. J Ultrasound Med 2009;28(7):861–7.
(11) Bojunga J, Herrmann E, Meyer G, et al. Real-time elastography
for the differentiation of benign and malignant thyroid nodules: a
meta-analysis. Thyroid 2010;20(10):1145–50.
(12) Itoh A, Ueno E, Tohno E, et al. Breast disease: clinical
application of US elastography for diagnosis. Radiology 2006;
239(2):341–50.
(13) Rago T, Santini F, Scutari M, et al. Elastography: new develop-
ments in ultrasound for predicting malignancy in thyroid nodules.
J Clin Endocrinol Metab 2007;92(8):2917–22.
(14) Ueno E, Itoh A. Diagnosis of breast cancer by elasticity imaging.
Eizo Joho Med 2004;36(12):2–6.
(15) Moon HJ, Sung JM, Kim E-K, et al. Diagnostic performance of
gray-scale US and elastography in solid thyroid nodules. Radi-
ology 2012;262(3):1002–13.
(16) Cantisani V, D’Andrea V, Biancari F, et al. Prospective evalu-
ation of multiparametric ultrasound and quantitative elastoso-
nography in the differential diagnosis of benign and malignant
thyroid nodules: preliminary experience. Eur J Radiol
2012;81(10):2678–83.
(17) Nikiforov YE, Biddinger PW, Thompson LDR. Diagnostic
pathology and molecular genetics of the thyroid. A comprehen-
sive guide for practicing thyroid pathology. 2nd ed. Philadelphia,
PA: Wolters Kluwer Health, Lippincott Williams & Wilkins;
2012.
(18) Leidig-Bruckner G, Cichorowski G, Sattler P, et al. Evaluation
of thyroid nodules – combined use of 99mTc-methylisobutylnit-
rile scintigraphy and aspiration cytology to assess risk of
malignancy and stratify patients for surgical or nonsurgical
therapy – a retrospective cohort study. Clin Endocrinol (Oxf)
2012;76(5):749–58.
(19) Deandreis D, Al Ghuzlan A, Auperin A, et al. Is 18F-fluorode-
oxyglucose–PET/CT useful for the presurgical characterization of
thyroid nodules with indeterminate fine needle aspiration cytol-
ogy? Thyroid 2012;22(2):165–72.
(20) Gharib H, Papini E, Paschke R, et al. AACE/AME/ETA Task
Force on thyroid nodules. American Association of Clinical
Endocrinologists, Associazione Medici Endocrinologi, and
European Thyroid Association medical guidelines for clinical
practice for the diagnosis and management of thyroid nodules.
J Endocrinol Invest 2010;33(5 Suppl.):1–50.
(21) Cooper DS, Doherty GM, Haugen BR, et al. American Thyroid
Association Guidelines Taskforce. Management guidelines for
patients with thyroid nodules and differentiated thyroid cancer.
Thyroid 2006;16(2):109–42.
(22) Gao L, Parker KJ, Lerner RM, et al. Imaging of the elastic
properties of tissue–a review. Ultrasound Med Biol 1996;22(8):
959–77.
(23) Park SH, Kim SJ, Kim E-K, et al. Interobserver agreement in
assessing the sonographic and elastographic features of malignant
thyroid nodules. AJR 2009;193(5):W416–23.
(24) Dighe M, Bae U, Richardson ML, et al. Differential diagnosis of
thyroid nodules with US elastography using carotid artery
pulsation. Radiology 2008;248(2):662–9.
(25) Bae U, Dighe M, Dubinsky T, et al. Ultrasound thyroid
elastography using carotid artery pulsation: preliminary study. J
Ultrasound Med 2007;26(6):797–805.
(26) Lyshchik A, Higashi T, Asato R, et al. Thyroid gland tumor
diagnosis at US elastography. Radiology 2005;237(1):202–11.
(27) Ning C-P, Jiang S-Q, Zhang T, et al. The value of strain ratio in
differential diagnosis of thyroid solid nodules. Eur J Radiol
2012;81(2):286–91.
(28) Carlsen JF, Ewertsen C, Lonn L, et al. Strain elastography
ultrasound: an overview with emphasis on breast cancer diagno-
sis. Diagnostics 2013;3(1):117–25.
(29) Trimboli P, Guglielmi R, Monti S, et al. Ultrasound sensitivity
for thyroid malignancy is increased by real-time elastography: a
prospective multicenter study. J Clin Endocrinol Metab 2012;
97(12):4524–30.
(30) Asteria C, Giovanardi A, Pizzocaro A, et al. US-elastography in
the differential diagnosis of benign and malignant thyroid
nodules. Thyroid 2008;18(5):523–31.
(31) Mohamed RE, Abodewan KA. Diagnostic utility of real-time
ultrasound elastography for prediction of malignancy in solid
thyroid nodules. Egypt J Radiol Nucl Med 2013;44(1):33–43.
(32) Reading CC, Charboneau JW, Hay ID, et al. Sonography of
thyroid nodules: a ‘‘classic pattern’’ diagnostic approach.
Ultrasound Q 2005;21(3):157–65.
(33) Carcangiu ML, Zampi G, Rosai J. Papillary thyroid carcinoma: a
study of its many morphologic expressions and clinical correlates.
Pathol Annu 1985;20(Pt 1):1–44.
(34) McNicol AM. Pathology of thyroid tumours. Surgery (Oxf)
2007;25(11):458–62.
(35) Rago T, Di Coscio G, Basolo F, et al. Combined clinical, thyroid
ultrasound and cytological features help to predict thyroid
malignancy in follicular and Hurthle cell thyroid lesions: results
from a series of 505 consecutive patients. Clin Endocrinol (Oxf)
2007;66(1):13–20.
(36) Maizlin ZV, Wiseman SM, Vora P, et al. Hurthle cell neoplasms
of the thyroid: sonographic appearance and histologic character-
istics. J Ultrasound Med 2008;27(5):751–7.
(37) Cantisani V, Ulisse S, Guaitoli E, et al. Q-elastography in the
presurgical diagnosis of thyroid nodules with indeterminate
cytology. PLoS One 2012;7(11):e50725.