can people afford to pay for health care?
TRANSCRIPT

Can people afford to pay for health care?
New evidence on financial protection in Europe
Reg
ion
al r
epo
rt

WHO Barcelona Office for Health Systems Strengthening
© F
oto
: R
ob
ert
Ram
os/
FPH
SP
The WHO Barcelona Office is a centre of excellence in health financing for universal health coverage (UHC). It works with Member States across WHO’s European Region to promote evidence-informed policy making.
A key part of the work of the Office is to assess country and regional progress towards UHC by monitoring financial protection – the impact of out-of-pocket payments for health on living standards and poverty. Financial protection is a core dimension of health system performance and an indicator for the Sustainable Development Goals.
The Office supports countries to develop policy, monitor progress and design reforms through a combination of health system problem diagnosis, analysis of country-specific policy options, high-level policy dialogue and the sharing of international experience. It is also the home for WHO training courses on health financing and health systems strengthening for better health outcomes.
Established in 1999, the Office is supported by the Government of the Autonomous Community of Catalonia, Spain. It is part of the Division of Health Systems and Public Health of the WHO Regional Office for Europe.
2

Can people afford to pay for health care?
Sarah ThomsonJonathan CylusTamás Evetovits
New evidence on financial protection in Europe

Can people afford to pay for health care? New evidence on financial protection in Europe
ISBN 978 92 890 5405 8
© World Health Organization 2019
Some rights reserved. This work is available under the Creative Commons Attribution-NonCommercial-ShareAlike 3.0 IGO licence (CC BY-NC-SA 3.0 IGO; https://creativecommons.org/licenses/by-nc-sa/3.0/igo).
Under the terms of this licence, you may copy, redistribute and adapt the work for non-commercial purposes, provided the work is appropriately cited, as indicated below. In any use of this work, there should be no suggestion that WHO endorses any specific organization, products or services. The use of the WHO logo is not permitted. If you adapt the work, then you must license your work under the same or equivalent Creative Commons licence. If you create a translation of this work, you should add the following disclaimer along with the suggested citation: “This translation was not created by the World Health Organization (WHO). WHO is not responsible for the content or accuracy of this translation. The original English edition shall be the binding and authentic edition”.
Any mediation relating to disputes arising under the licence shall be conducted in accordance with the mediation rules of the World Intellectual Property Organization.
Suggested citation. Can people afford to pay for health care? New evidence on financial protection in Europe. Copenhagen: WHO Regional Office for Europe; 2019. Licence: CC BY-NC-SA 3.0 IGO.
Cataloguing-in-Publication (CIP) data. CIP data are available at http://apps.who.int/iris.
Sales, rights and licensing. To purchase WHO publications, see http://apps.who.int/bookorders. To submit requests for commercial use and queries on rights and licensing, see http://www.who.int/about/licensing.
Third-party materials. If you wish to reuse material from this work that is attributed to a third party, such as tables, figures or images, it is your responsibility to determine whether permission is needed for that reuse and to obtain permission from the copyright holder. The risk of claims resulting from infringement of any third-party-owned component in the work rests solely with the user.
General disclaimers. The designations employed and the presentation of the material in this publication do not imply the expression of any opinion whatsoever on the part of WHO concerning the legal status of any country, territory, city or area or of its authorities, or concerning the delimitation of its frontiers or boundaries. Dotted and dashed lines on maps represent approximate border lines for which there may not yet be full agreement.
The mention of specific companies or of certain manufacturers’ products does not imply that they are endorsed or recommended by WHO in preference to others of a similar nature that are not mentioned. Errors and omissions excepted, the names of proprietary products are distinguished by initial capital letters.
All reasonable precautions have been taken by WHO to verify the information contained in this publication. However, the published material is being distributed without warranty of any kind, either expressed or implied. The responsibility for the interpretation and use of the material lies with the reader. In no event shall WHO be liable for damages arising from its use.
Address requests about publications of the WHO Regional Office for Europe to: Publications, WHO Regional Office for Europe, UN City, Marmorvej 51, DK-2100 Copenhagen Ø, Denmark. Alternatively, complete an online request form for documentation, health information, or for permission to quote or translate, on the Regional Office website (http://www.euro.who.int/pubrequest).
Out-of-pocket payments for health can create a financial barrier to access, resulting in unmet need, or lead to financial hardship for people using health services. This report brings together for the first time data on unmet need and financial hardship to assess whether people living in Europe can afford to pay for health care. Drawing on contributions from national experts in 24 countries, the report shows that financial hardship varies widely in Europe, and that there is room for improvement even in high-income countries that provide the whole population with access to publicly financed health services. Catastrophic health spending is heavily concentrated among the poorest households in all of the countries in the study. Where financial protection is relatively weak, catastrophic spending is mainly driven by out-of-pocket payments for outpatient medicines.
Health systems with strong financial protection and low levels of unmet need share the following features: there are no large gaps in health coverage; coverage policy – the way in which coverage is designed, implemented and governed – is carefully designed to minimize access barriers and out-of-pocket payments, particularly for poor people and regular users of health services; public spending on health is high enough to ensure relatively timely access to a broad range of health services without informal payments; and as a result, out-of-pocket payments are low, accounting for less than or close to 15% of current spending on health.
Gaps in coverage arise from weaknesses in the design of three policy areas: population entitlement, the benefits package and user charges (co-payments). The report summarizes actions that can reduce unmet need and financial hardship by strengthening coverage policy. It also highlights actions that should be avoided.
EUROPEHEALTHCARE FINANCINGHEALTH EXPENDITURESHEALTH SERVICES ACCESSIBILITYFINANCING, PERSONALPOVERTYUNIVERSAL COVERAGE
Abstract & keywords


Contents
Figures, tables & boxes viAcknowledgements ixAbbreviations xiForeword xiiiExecutive summary xv Why monitor financial protection in Europe? 1Financial protection: central to universal health coverage and health system performance 2Unmet need must be part of the analysis 7The added value of this report 8 Policy-relevant measurement with a focus on equity 11Methods, data and limitations 12 New numbers for Europe 29Comparing financial hardship across countries 30Comparing financial hardship and unmet need across countries 42 The story behind the numbers 49Factors that influence financial protection 50Linking financial hardship and unmet need to spending on health 51Linking financial hardship and unmet need to coverage policy 61Population entitlement 65The benefits package 74User charges (co-payments) 83The role of VHI 97Gaps in coverage in European health systems 100 Acting on the evidence 101Implications for policy 102 References 106Glossary of terms 116
v

Figures
Fig. 1. Goals for the health system and universal health coverage 3 Fig. 2. Measurement of impoverishing health spending used in this report 21 Fig. 3. Measurement of catastrophic health spending used in this report 22 Fig. 4. Share of households with impoverishing health spending, latest year available 30 Fig. 5. Share of households with catastrophic health spending, latest year available 31 Fig. 6. Share of households with catastrophic health spending by consumption quintile, latest year available 32 Fig. 7. Share of households with catastrophic health spending on average and in the poorest consumption quintile, latest year available 33 Fig. 8. Breakdown of households with catastrophic health spending by risk of impoverishment, latest year available 34
Fig. 9. Share of the population at risk of poverty or social exclusion in total and among older people, 2016 35 Fig. 10. Average share of the household budget spent out of pocket among all households with catastrophic health spending and households in the poorest consumption quintile, latest year available 37 Fig. 11. Average share of the household budget spent out of pocket among further impoverished households, latest year available 38 Fig. 12. Breakdown of out-of-pocket payments by health service among households with catastrophic health spending (all households) 40 Fig. 13. Breakdown of out-of-pocket payments by health service among households with catastrophic health spending (poorest consumption quintile) 41 Fig. 14. Overall incidence of catastrophic health spending and unmet need for health and dental care due to cost, distance or waiting time 43
Fig. 15. Breakdown of out-of-pocket payments by health service among households with catastrophic health spending by consumption quintile and unmet need for dental care by income quintile in Lithuania 45 Fig. 16. Self-reported use of medicines in EU countries, 2014 46 Fig. 17. Overall incidence of catastrophic health spending and unmet need for prescribed medicines due to cost by educational attainment and age 47 Fig. 18. Incidence of catastrophic health spending and out-of-pocket payments as a share of current spending on health, latest year available 51 Fig. 19. Out-of-pocket payments as a share of current spending on health, WHO European Region, 2016 53 Fig. 20. Relationship between public spending on health as a share of GDP and out-of-pocket payments, WHO European Region, 2016 54 Fig. 21. Relationship between VHI and out-of-pocket payments, WHO European Region, 2016 55
vi

Fig. 22. Breakdown of current spending on health by health service and financing scheme, EU28, 2016 56 Fig. 23. Spending on outpatient medicines by financing scheme (2016), unmet need for prescribed medicines (2014) and catastrophic incidence (latest available year) 57 Fig. 24. Spending on dental care by financing scheme (2016), unmet need for dental care and catastrophic incidence (latest available year) 57 Fig. 25. The incidence of catastrophic health spending varies across countries with the same out-of-pocket payment share of current spending on health 59 Fig. 26. The three dimensions of health coverage 61 Fig. 27. Gaps in coverage lead to out-of-pocket payments and unmet need 62 Fig. 28. Explicit versus implicit rationing in response to a budget constraint 63
Fig. 29. Share of the population entitled to publicly financed health services and share of households with catastrophic health spending 65 Fig 30. Change in catastrophic health spending and unmet need due to cost, distance and waiting time in Greece, 2009–2016 69 Fig. 31. Change in breakdown of out-of-pocket payments by type of health service in Greece, 2009–2016 70 Fig. 32. Change in the average amount spent by health service among households with catastrophic health spending in Georgia, 2011–2015 71 Fig. 33. Over-the-counter share of current spending on outpatient medicines, 2016 75 Fig. 34. Share of out-of-pocket payments spent on dental care among households with catastrophic health spending and unmet need for dental care 77 Fig. 35. Catastrophic incidence and the design of co-payments for outpatient medicines in high-income countries 86
Fig. 36. Share of households with catastrophic health spending by consumption quintile in Germany 88 Fig. 37. Breakdown of out-of-pocket payments by health service among households with catastrophic health spending in the poorest consumption quintile in Germany 88 Fig. 38. Share of households with catastrophic health spending by consumption quintile in Latvia 89 Fig. 39. Breakdown of out-of-pocket payments by health service among households with catastrophic health spending in the poorest consumption quintile in Austria 92 Fig. 40. VHI premiums as a share of total household spending 99
vii

Tables Boxes
Table 1. Comparison of metrics used to calculate catastrophic spending on health 16 Table 2. Financial protection metrics used in the European Region 18 Table 3. The financial protection metrics used in this report 20 Table 4. Most recent year of household budget survey data used in this report 24 Table 5. Entitlement to health services for undocumented migrants, EU28, 2014 72
Table 6. User charges design in the study countries in the latest year of the study 85 Table 7. Caps on user charges in the study countries in the latest year of the study 90 Table 8. Policy measures to enable high take up of VHI covering co-payments 97 Table 9. Gaps in coverage in European health systems 100
Table 10. Actions that strengthen or weaken coverage policy 104
Box 1. How France broke the link between employment and entitlement to health insurance by changing the basis for entitlement to residence 67 Box 2. Informal payments indicate failures in health system governance and are difficult to address when they are paid to health workers 81
Box 3. How Austria implements an income-related cap on co-payments for outpatient medicines 91 Box 4. Why do countries use percentage co-payments? 94
viii

Acknowledgements
This report was produced by the WHO Barcelona Office for Health Systems Strengthening, which is part of the Division of Health Systems and Public Health, directed by Hans Kluge, in the WHO Regional Office for Europe. It was written by Sarah Thomson, Jonathan Cylus and Tamás Evetovits.
The report draws on a series of 24 country reviews prepared by national experts in collaboration with the WHO Barcelona Office, as follows:
The series editors are Sarah Thomson, Jonathan Cylus and Tamás Evetovits. Individual country reviews have been edited by Marina Karanikolos, Mary MacLennan, Anna Maresso, Ilaria Mosca, Erica Richardson and Pooja Yerramilli.
AlbaniaAustriaCroatiaCyprusCzechiaEstoniaFranceGeorgiaGermanyGreece
HungaryIrelandKyrgyzstanLatviaLithuaniaPolandPortugalRepublic of Moldova
SlovakiaSloveniaSwedenTurkeyUkraineUnited Kingdom
Sonila Tomini, Florian TominiThomas Czypionka, Gerald Röhrling, Eva SixLuka Vončina, Ivica RubilAntonis Kontemeniotis, Mamas TheodorouDaniela KandilakiAndres Võrk, Triin HabichtDamien BricardKetevan Goginashvili, Mamuka NadareishviliMartin Siegel, Reinhard BusseMichalis Chletsos, Charalampos Economou, Owen O’DonnellPéter Gaál, Ferenc LindeiszSara Burke, Bridget Johnston, Steve ThomasMelitta Jakab, Baktygul Akkazieva, Jarno HabichtMaris Taube, Edmunds Vaskis, Oksana NesterenkoLiuba Murauskienė, Sarah ThomsonMarzena Tambor, Milena PavlovaPedro Pita Barros, Ana Rita BorgesIuliana Garam, Mariana Zadnipru, Valeriu Doronin, Denis Valac, Ala Negruta, Andrei Matei, Ilaria MoscaMária PourováEva Zver, Dušan Jošar, Andrej SrakarAnna Glenngård, Sixten BorgAli Riza DemirbasAlona Goroshko, Natalia Shapoval, Taavi LaiNora Cooke O’Dowd, Stephanie Kumpunen, Holly Holder
ix

The authors of this report are indebted to Charles Normand (Trinity College Dublin) and Peter Smith (Imperial College Business School) for reviewing an earlier version of the report. The authors would also like to thank the following people for their valuable comments: Agnès Couffinhal (Organisation for Economic Co-operation and Development), Katie Gallagher (European Patients’ Forum), Kenneth Grech (Ministry for Health, Malta), Susanna Ulinski (European Commission, Directorate-General for Employment, Social Affairs and Inclusion), Baktygul Akkazieva, José Cerezo Cerezo, Triin Habicht, Melitta Jakab and Ilaria Mosca (WHO Barcelona Office for Health Systems Strengthening), Hanne Bak Pedersen and Hans Kluge (WHO Regional Office for Europe), Gabriela Flores and Joe Kutzin (WHO headquarters) and Thomas Foubister. Thanks are also due to Baktygul Akkazieva and José Cerezo Cerezo for their help in preparing data for tables and figures, José Cerezo Cerezo for research assistance and Teresa Capel Tatjer, Pep Casanovas, Maribel Gené Cases, Juan García Domínguez and Ruth Oberhauser for project support. The authors alone are responsible for any mistakes.
WHO thanks national statistical offices for making household budget survey microdata available to the national experts. Data on financial protection were shared with nominated officials from individual Member States as part of a WHO consultation on universal health coverage indicators in 2017 and 2018.
WHO gratefully acknowledges funding from the Department for International Development of the United Kingdom of Great Britain and Northern Ireland, under the Making Country Health Systems Stronger programme, and from the Government of the Autonomous Community of Catalonia, Spain.
The production of this report was coordinated by Juan García Domínguez. Additional support came from Nancy Gravesen (copyediting), Aleix Artigal and Alex Prieto (design and typesetting) and Juan García Domínguez (checking proofs).
x

Abbreviations
COICOP
ECOICOP
EHISEUEU13EU28EU-SILCGDPOECDSDGVHI
Classification of Individual Consumption According to PurposeEuropean Classification of Individual Consumption According to PurposeEuropean Health Interview SurveyEuropean UnionEuropean Union Member States joining after 30 April 2004European Union Member States as of 1 July 2013European Union Statistics on Income and Living Conditionsgross domestic productOrganisation for Economic Co-operation and DevelopmentSustainable Development Goalvoluntary health insurance
xi

ALB AlbaniaAND AndorraARM ArmeniaAUT AustriaAZE AzerbaijanBEL BelgiumBIH Bosnia and HerzegovinaBLR BelarusBUL BulgariaCRO CroatiaCYP CyprusCZH CzechiaDEN DenmarkDEU GermanyEST EstoniaFIN FinlandFRA FranceGEO GeorgiaGRE GreeceHUN HungaryICE IcelandIRE IrelandISR IsraelITA ItalyKAZ KazakhstanKGZ KyrgyzstanLTU Lithuania
LUX LuxembourgLVA LatviaMAT MaltaMDA Republic of MoldovaMKD North MacedoniaMNE MontenegroMON MonacoNET NetherlandsNOR NorwayPOL PolandPOR PortugalROM RomaniaRUS Russian FederationSMR San MarinoSPA SpainSRB SerbiaSVK SlovakiaSVN SloveniaSWE SwedenSWI SwitzerlandTJK TajikistanTKM TurkmenistanTUR TurkeyUKR UkraineUNK United KingdomUZB Uzbekistan
xii

Foreword
I am delighted to present the results of the first comprehensive analysis of financial protection in the WHO European Region. When we initiated this study, we had three aims: to monitor financial protection in a way that is relevant for all of the countries in the Region; to offer countries tailored advice on how to make progress towards universal health coverage; and to enable countries to reduce out-of-pocket payments for the people most in need of protection. The content of this report closely reflects these aims.
Using the new metrics we have developed to measure financial hardship produces actionable evidence for policy in high-income countries as well as middle-income countries. The report finds substantial variation in the incidence of financial hardship in Europe, but some consistent patterns across countries: financial hardship is heavily concentrated among the poorest households and, for these households, it is largely driven by spending on outpatient medicines.
Through country-level policy analysis, the study identifies important gaps in health coverage that need to be addressed to reduce financial hardship.
Countries with strong financial protection offer a wealth of good practice relevant for policy-makers across the Region, including: using exemptions and caps to secure protection from co-payments, particularly for poor people and regular users of health services; ensuring the benefits package covers a wide range of essential medicines in outpatient and inpatient settings; and basing entitlement to publicly financed health services on residence rather than employment or payment of contributions.
Countries with relatively weak financial protection should carefully redesign co-payment policy to improve protection for poor people. An essential first step is to introduce exemptions from co-payments for people receiving social benefits – a group that is vulnerable and administratively easy to identify. This serves a wider economic purpose too, ensuring that support to households through the social protection system is not undermined by the health system. In most of these countries, significant progress is unlikely to be achieved without additional public investment to increase the number of essential medicines in the benefits package. Greater investment can also be used to extend co-payment exemptions to vulnerable people who do not qualify for social benefits, so that no one is left behind, in keeping with my commitment to support more equitable health in Europe.
Zsuzsanna JakabWHO Regional Director for Europe
xiii

Foreword
The Tallinn Charter: Health Systems for Health and Wealth, signed by all Member States in the WHO European Region in 2008, states that it is unacceptable that people become poor as a result of ill health. In accord with the Charter, the resolution on Priorities for health systems strengthening in the WHO European Region 2015–2020: walking the talk on people centredness, adopted by the WHO Regional Committee for Europe in 2015, commits WHO to support countries in working towards a Europe free of impoverishing out-of-pocket payments for health. Also in 2015, the United Nations General Assembly adopted the Sustainable Development Goals (SDGs). At global level, WHO and the World Bank Group are jointly responsible for monitoring progress on SDG target 3.8 on universal health coverage.
This report provides the evidence countries need to meet global targets and regional commitments.
• It complements global monitoring efforts, using a policy-relevant measure of financial protection with a focus on equity to set a baseline for monitoring the impact of national policies to improve financial protection between 2015 and 2020.
• It goes beyond producing indicator values to explore the story behind the numbers through in-depth analysis in 24 Member States, drawing on a series of country reports on financial protection, which are available online. Our aim is to produce country reports for all Member States, to monitor progress in the context of the SDGs up to 2030.
• It facilitates international comparison in a way that enables countries to learn from good practice across the Region and allows WHO to provide tailored policy recommendations.
One of the report’s key findings is that even in Europe’s richest countries people are pushed into poverty – and many already poor households experience financial hardship – as a result of having to pay out of pocket for health services. This indicates that all Member States can take steps to improve financial protection.
I am proud of the report’s focus on how to make progress in an important dimension of health system performance.
Hans KlugeDirector of the Division of Health Systems and Public HealthWHO Regional Office for Europe
xiv

Executive summary
This report summarizes the main findings from a new study of financial protection in Europe. It is the first to systematically monitor both financial hardship and unmet need for health services in Europe, filling a significant gap in health system performance assessment.
Why monitor financial protection in Europe?
The goals of universal health coverage are to ensure that everyone can use the quality health services they need without experiencing financial hardship. Out-of-pocket payments can create a financial barrier to access, resulting in unmet need, and lead to financial hardship among people using health services. Because all health systems involve some out-of-pocket payment, financial hardship linked to the use of health services can be a problem in any country. Lack of financial protection may lead to or deepen poverty, undermine health and exacerbate health and socioeconomic inequalities.
Policy-relevant measurement with a focus on equity
Financial protection is measured using two well-established indicators: impoverishing health spending and catastrophic health spending. Both indicators assess a household’s out-of-pocket payments in relation to a pre-defined threshold, but each indicator can be calculated in different ways.
The WHO Regional Office for Europe has developed an advanced method of measuring financial protection in response to concerns that the method used to measure financial protection in the SDGs (SDG target 3.8.2), and other global approaches, pose a challenge for equity and have limited relevance for Europe.
Building on established methods, the metrics used in this report are less likely to underestimate financial hardship among poorer people than the SDG metrics because they account for differences in household capacity to pay for health care. The aim is to measure financial protection in a way that is relevant to all countries in Europe, produces actionable evidence for policy and promotes policies to break the link between ill health and poverty.
xv

New numbers for Europe
Drawing on publicly available national household budget survey data, the report provides up-to-date numbers on financial protection for 24 high- and middle-income countries in Europe.
• The incidence of impoverishing health spending in the study countries ranges from 0.3% to 9.0% of households. There is wide variation among European Union (EU) countries (from 0.3% to 5.9%) and among non-EU countries also (from 3.6% to 9.0%).
• The incidence of catastrophic health spending ranges from 1% to 17% of households in the study countries. It varies widely among the 18 EU countries in the study, including wide variation among countries that joined the EU after 30 April 2004.
• Catastrophic health spending is consistently heavily concentrated among the poorest fifth of the population.
• Out-of-pocket payments incurred by households with catastrophic health spending are mainly due to outpatient medicines, followed by inpatient care and dental care.
Unmet need must be part of the analysis
Financial protection indicators capture financial hardship arising from the use of health services, but do not indicate whether out-of-pocket payments create a barrier to access, resulting in unmet need. Bringing together for the first time data on financial hardship and unmet need across Europe reveals the following findings.
• In countries where the incidence of catastrophic health spending is very low, unmet need also tends to be low and without significant income inequality.
• In a few countries, the incidence of catastrophic health spending is relatively low, but there is a high level of unmet need, particularly among poor households, which suggests that health care is not as affordable as the financial protection indicators alone imply.
• In many countries, the incidence of catastrophic health spending and levels of unmet need are both relatively high, and income inequality in unmet need is also significant, indicating that health services are not at all affordable, and that if everyone were able to use the services they needed, financial hardship would be even greater, particularly among poorer households.
• Some health services – notably dental care – are a much greater source of financial hardship for richer households than poorer households. This reflects higher levels of unmet need for dental care among poorer households than richer households in most countries.
xvi

• Outpatient medicines are an important source of financial hardship in many countries and among the poorest quintile in most countries. Unmet need for prescribed medicines is also generally higher in countries with a higher incidence of catastrophic health spending, which indicates that out-of-pocket payments for medicines lead to both financial hardship and unmet need for poorer people.
Factors that strengthen financial protection
Health systems with strong financial protection and low levels of unmet need share the following features:
• there are no large gaps in coverage;
• coverage policy is carefully designed to minimize access barriers and out-of-pocket payments, particularly for poor people and regular users of health services;
• public spending on health is high enough to ensure relatively timely access to a broad range of health services without informal payments; and as a result
• out-of-pocket payments are low, accounting for less than or close to 15% of current spending on health.
There is a strong association between the incidence of catastrophic health spending and the out-of-pocket payment share of current spending on health, suggesting that the out-of-pocket payment share can be used as a proxy indicator for financial protection when data on financial protection are lacking.
Across countries, public spending on health is shown to be much more effective in reducing out-of-pocket payments than voluntary health insurance. However, increases in public spending on health or reductions in out-of-pocket payments are not enough to improve financial protection in all contexts. Coverage policies play a key role in determining financial hardship, not just patterns of spending on health.
Gaps in coverage
People are exposed to out-of-pocket payments and unmet need when there are gaps in coverage. Gaps in coverage arise from weaknesses in the design of three policy areas: the basis for population entitlement leaves some people without access to publicly financed health services; the range of services that is publicly financed – the benefits package – is narrow, or there are issues relating to the availability, quality and timeliness of these services; and there are user charges (co-payments) in place for services in the benefits package.
xvii

Weaknesses in coverage policy undermine equity and efficiency by creating financial barriers to access; shifting the financial burden of paying for health care on to those who can least afford it – poor people and regular users of health services; and encouraging inefficient patterns of use.
Population entitlement
Most gaps in population coverage occur because entitlement is based on employment or payment of contributions. This automatically excludes people, particularly in countries that lack effective mechanisms to enforce collection, and is more likely to affect relatively vulnerable groups of people.
Where gaps in population coverage are significant, they lead to high levels of unmet need and financial hardship. Population coverage is not a useful instrument for rationing because it is likely to exacerbate inefficiencies in service use and inequalities in use and health. Excluded people will have to rely on emergency services and may experience an avoidable deterioration in health status.
Offering a split benefits package – a situation in which publicly financed entitlements vary based on whether people have paid contributions – is likely to have a disproportionately negative impact on people with lower socioeconomic status, entrenching inequalities.
Even where the whole population is covered, some groups may be systematically underserved, particularly undocumented migrants, Roma and people with mental health problems.
The share of the population entitled to publicly financed health services should not be used as an indicator of financial protection. This study shows how the incidence of catastrophic health spending varies hugely across countries that cover the whole population.
The benefits package
Out-of-pocket spending on medicines is the main driver of financial hardship in most countries. In some countries, the number of outpatient medicines covered by the publicly financed benefits package is low and requires urgent policy attention. The over-the-counter share of spending on medicines is relatively high in some of the high-income countries in the study, which may reflect a narrow benefits package or barriers to obtaining prescriptions from outpatient physicians.
Coverage of dental care for adults is very limited in some countries, including high-income countries. Lack of dental care coverage leads to financial hardship for richer households, who can afford to pay out of pocket, and unmet need for poorer households. This pattern is also likely to apply to preventive services, underlining the importance of ensuring that such services are adequately covered and free at the point of use, at least for poor people.
xviii

Problems with service availability, timeliness and quality may increase out-of-pocket payments. If levels of public spending on health are inadequate and lead to implicit rationing – for example, as a result of unfunded mandates – informal payments are likely to be a problem. Informal payments are not the most important source of financial hardship, even in countries where they are significant, but their informal nature makes it impossible to protect people through exemptions.
The design of the benefits package offers valuable opportunities for explicit rationing through priority-setting processes. These processes can be used to ensure publicly financed health services are cost-effective and match population health needs as closely as possible. They can also help tackle out-of-pocket payments and other inefficiencies arising from inappropriate use of health services.
User charges (co-payments)
Co-payment design is a key factor influencing financial protection. It is the most important factor in countries where financial hardship is driven by outpatient medicines and the scope of the benefits package is adequate.
Exemptions for poor people are the single most effective co-payment design feature in terms of access and financial protection. All countries can and should exempt poor people, beginning with people receiving social benefits, a group that is administratively relatively easy for the health system to identify.
Caps also protect people if they are applied to all co-payments over time rather than narrowly focused on specific items or types of service – and if they are low enough. Ideally, they should be set as a very low share of household income. Caps alone are unlikely to be sufficient to protect poor people, however.
If co-payments are used, they should be low and clearly defined so people know what they are expected to pay. In contrast to low fixed co-payments, percentage co-payments shift financial risk from purchasing agency to households and expose people to health system inefficiencies. This is particularly problematic in contexts where pricing, prescribing and dispensing are not adequately controlled.
Co-payment policy should pay attention to all three design features (exemptions, caps and type of co-payment); be designed around people rather than around items, services or diseases; and be as simple as possible to minimize confusion and enhance transparency.
User charges are not an effective rationing instrument due to strong and consistent evidence that they reduce necessary and unnecessary use in equal measure. Most decisions about health-care use and costs are made by health-care providers.
xix

Acting on the evidence
The first step to strengthening financial protection is to identify gaps in coverage in a given context. The next is to find ways of addressing them through a careful redesign of coverage policy. The design of user charges plays an important role because it explicitly allows the health system to target the people most in need of protection.
Taking steps to benefit the most disadvantaged people first – an approach known as progressive universalism – is vital in contexts where public resources are severely limited. It also offers advantages in countries that do not face a severe budget constraint, enabling them to meet the challenge of leaving no one behind by ensuring that poor people gain at least as much as those who are better off at every step on the path to universal health coverage.
Progressive universalism rests on the ability to identify the health services most likely to lead to financial hardship, the people most likely to be affected and the root causes of gaps in coverage. This in turn requires indicators and metrics amenable to equity analysis, like the ones used in this report.
To be effective, changes to coverage policy should be supported by an adequate level of public spending on health. Countries in which the out-of-pocket payment share of current spending on health is relatively high will need to invest more publicly in the health system to reduce out-of-pocket payments. Simply increasing public spending might not be enough to improve outcomes for those most in need, however. The sequencing of policy is therefore important. Some countries will need to redesign coverage policy at the same time as seeking additional public investment in the health system.
There is a wealth of good practice in Europe. Lessons can be learned from countries with strong financial protection and countries where financial protection is weak overall but steps have been taken to protect poor people.
xx

Why monitor financial protection in Europe?

Financial protection: central to universal health coverage and health system performance
The question posed in this report is whether people living in Europe can afford to pay for health care.
When people cannot afford to pay for health care, two outcomes are possible.
• They are not able to access health services and experience unmet need.
• They use health services and experience financial hardship.
Some people may experience both outcomes – for example, if they opt to pay for some services and forego the use of others.
These outcomes occur because of the presence of out-of-pocket payments in the health system.
Out-of-pocket payments can:
• create a financial barrier to access
• lead to financial hardship for people using health services.
Non-financial barriers to access – for example, problems with the availability, quality and timeliness of publicly financed health services – also lead to unmet need and may lead to financial hardship if they push people to seek treatment from private or non-contracted providers (EXPH, 2016).
Reducing unmet need and financial hardship is central to the concept of universal health coverage, as shown in Fig. 1. The goals of universal health coverage are to ensure that everyone can use the health services they need without experiencing financial hardship.
This report summarizes the main findings from a new study of financial protection in Europe. The study’s aim is to monitor financial protection in a way that is relevant to all countries in the WHO European Region, produces actionable evidence for policy and promotes policies to break the link between ill health and poverty.
Can people afford to pay for health care in Europe? 2

What is financial protection and why does it matter?
Financial hardship is caused by out-of-pocket payments, although not all out-of-pocket payments lead to financial hardship. People experience financial hardship when out-of-pocket payments are large in relation to their ability to pay. Small out-of-pocket payments can cause financial hardship for poor households or those who have to pay for long-term treatment such as medicines for chronic illness. Large out-of-pocket payments can lead to financial hardship for rich households as well as poor households.
Because all health systems involve some out-of-pocket payment, financial hardship linked to the use of health services can be a problem in any country.
Lack of financial protection may lead to or deepen poverty, undermine health and exacerbate health and socioeconomic inequalities. Where health systems fail to provide adequate financial protection, some people may be forced to choose between using health services and meeting other basic needs such as food, housing and heating, leading to a range of negative health and economic consequences. Some people are also likely to experience unmet need.
Recognizing this, financial protection has long been an explicit part of health system frameworks used by WHO, the European Observatory on Health Systems and Policies and the World Bank (WHO, 2000; Smith et al., 2009; WHO, 2010; Papanicolas & Smith, 2013).
Fig. 1. Goals for the health system and universal health coverage Note: UHC: universal health coverage.
Source: adapted from Kutzin et al. (2017).
Intermediate goals
Equity
Efficiency
Transparency
Accountability
Health financing
Resource generation
Health system functions
Service delivery
Revenue raising
Pooling
Purchasing
Go
vern
ance
Co
vera
ge
po
licy
UHC goals
No unmet need
No financial hardship
Use relative to need
Quality
Financial protection
3Why monitor financial protection in Europe?

These frameworks give financial protection prominence as a health system goal in its own right, distinct from the concept of access to health services, and on a par with the goal of improving health. Financial protection is therefore clearly and widely acknowledged as a core dimension of health system performance.
Why monitor financial protection in Europe?
“It is unacceptable that people become poor as a result of ill health,” states the Tallinn Charter: Health Systems for Health and Wealth, signed by all Member States in the WHO European Region in 2008 (WHO Regional Office for Europe, 2008).
The Charter promotes equity, solidarity, financial protection and better health through health system performance monitoring, assessment and improvement. The financial and economic crisis that began in 2008 was an immediate test of the ability of governments in Europe to meet the commitments they made in Tallinn, Estonia. In collaboration with the Government of Norway, WHO organized two high-level meetings in Oslo in 2009 and 2013 to identify ways of overcoming the health system challenges posed by the crisis. With the European Observatory on Health Systems and Policies, WHO also carried out a major study on health system responses to the crisis (Maresso et al., 2015; Thomson et al., 2015). This provided ample evidence of the importance of strengthening equity, solidarity and financial protection in an economic crisis. It also highlighted the need for timely performance monitoring to support policy responses.
At its 65th session, in 2015, the WHO Regional Committee for Europe adopted resolution EUR/RC65/R5 on priorities for health systems strengthening in the WHO European Region 2015–2020, in which it:
• called on Member States to work towards a Europe free of impoverishing out-of-pocket payments for health;
• requested the Regional Director to provide tools and support to Member States for the monitoring of financial protection and to pursue the commitments agreed in the Tallinn Charter; and
• requested the Regional Director to report on implementation, focusing mainly on financial protection, in 2018.
The Sustainable Development Goals (SDGs) adopted by the United Nations in 2015 also call for the monitoring of, and reporting on, financial protection as one of two indicators for universal health coverage under SDG target 3.8 “Achieve universal health coverage, including financial risk protection, access to quality essential health-care services and access to safe, effective, quality and affordable essential medicines and vaccines for all” (United Nations, 2015). Resolution EUR/RC67/R3 on the roadmap to implement the 2030 Agenda for Sustainable Development, building on Health 2020, calls on WHO to support Member States in moving towards universal health coverage – a call to which WHO responds in its General Programme of Work 2019–2023 (WHO, 2019c).
Can people afford to pay for health care in Europe? 4

A vital aspect of the SDG agenda is the pledge to leave no one behind (United Nations, 2016a, 2016b). To meet this challenge requires data and indicators that are able to identify and address specific groups within a population, including the poorest, the most marginalized and the most vulnerable.
How is financial protection measured?
Financial protection is measured using two indicators.
Impoverishing health spending provides information on the impact of out-of-pocket payments on poverty. A household is considered to be impoverished if its consumption or income is above the poverty line before spending out of pocket and below it after spending out of pocket. A household can also experience impoverishing health spending if its consumption or income before spending out of pocket was already below the poverty line; it is further impoverished after spending out of pocket.
Catastrophic health spending occurs when the amount a household pays out of pocket exceeds a predefined share of its ability to pay. This may mean the household can no longer afford to meet other basic needs like food, housing and heating or cannot afford to meet basic needs without drawing on savings, selling assets or borrowing.
Health spending that is catastrophic is not necessarily impoverishing; some households may experience financial hardship even though they remain above the poverty line after out-of-pocket payments.
Financial protection indicators can be calculated in different ways. For example, metrics vary in the type of poverty line used to estimate impoverishing health spending and in how a household’s ability to pay for health care is defined when estimating catastrophic health spending.
At global level, catastrophic health spending is monitored using the metrics defined under SDG 3.8.2: the proportion of the population with large household expenditure on health as a share of total household consumption or income (greater than 10% or 25% of total household consumption or income) (Wagstaff & van Doorslaer, 2003). The SDGs do not include a measure of impoverishing health spending, but WHO and the World Bank monitor impoverishing health spending globally using metrics developed by Foster et al. (1984) and applied to health in the early 2000s by O’Donnell et al. (2008).
The global metrics currently used to monitor financial protection allow countries in Europe to be compared to countries in the rest of the world. This advantage has to be weighed against a number of disadvantages, however.
• Global metrics for impoverishing health spending are not appropriate for the high- and middle-income countries in the European Region because they are based on very low absolute poverty lines, resulting in zero incidences in many countries.
5Why monitor financial protection in Europe?
• Global metrics for catastrophic health spending do not account for differences in household capacity to pay for health care. SDG 3.8.2 holds the poorest and the richest households to the same standard, which underestimates financial hardship among the poor and overestimates financial hardship among the rich.
To address these limitations – which are discussed in more detail in the section on methods – the WHO Regional Office for Europe has developed new metrics to monitor financial protection in the European Region (Thomson et al., 2016; Cylus et al., 2018). Building on established methods (Wagstaff & van Doorslaer, 2003; Xu et al., 2003; O’Donnell et al., 2008; Wagstaff & Eozenou, 2014), the new metrics aim to monitor financial protection in a way that is relevant to all countries in the European Region, produces actionable evidence for policy and promotes policies to break the link between ill health and poverty.
Regardless of the metrics used, most studies of financial protection draw on the same type of data – typically household budget surveys – and all define out-of-pocket payments in the same internationally standard way as:
• formal and informal payments made at the time of using any health care good or service provided by any type of provider;
• including user charges (co-payments) for covered services and direct payments for non-covered services; and
• excluding any pre-payment in the form of taxes, contributions or insurance premiums and any reimbursement by a third party such as the government, a health insurance fund or a private insurance company.
Financial protection should be measured at the level of the health system rather than at the level of different types of health care, different diseases or different patient groups.
Can people afford to pay for health care in Europe? 6

Unmet need must be part of the analysis
The main focus of this report is on financial protection, which has not been systematically monitored in Europe before.
Financial protection indicators capture financial hardship arising from the use of health services. They do not, however, indicate whether out-of-pocket payments create a barrier to access, resulting in unmet need – defined here as instances in which people need health care but do not receive it because of financial or non-financial barriers to access.
The household budget surveys used to assess financial protection do not usually collect information on health service use or unmet need. They indicate which households do not report out-of-pocket payments, but not why. Households with no out-of-pocket payments may have no need for health care, be exempt from user charges (co-payments) or experience unmet need.
Financial protection analysis that does not account for unmet need could be misinterpreted. For example, a country may have a relatively low incidence of catastrophic spending on health because many people simply cannot afford to use health services. Conversely, a country may extend entitlement to publicly financed health services to people who were previously uncovered, but have high user charges in place. As a result, health services are now more affordable for these people, because part of the cost is covered by the government, leading to an increase in use and a reduction in unmet need. However, exposure to user charges means lower unmet need is likely to be accompanied by higher out-of-pocket payments. In this case, improved access to health care may lead to an increase in financial hardship.
These examples illustrate the importance of looking at unmet need alongside indicators of financial protection. Data on unmet need are available across many countries in the European Region, particularly in European Union (EU) countries through annual surveys such as the European Statistics on Income and Living Conditions (EU-SILC) and the European Health Interview Survey (EHIS), which is carried out every five years.
7Why monitor financial protection in Europe?

The added value of this report
The report fills a gap in health system performance assessment in Europe in the following ways.
Policy-relevant measurement with a focus on equity
The WHO Regional Office for Europe has developed new metrics to measure financial protection in response to concerns that the SDG metrics and other metrics used globally are of limited relevance to health system performance assessment and policy development in Europe.
Global metrics are not always sufficiently sensitive to allow differentiation between high-income countries and may not be appropriate for equity analysis – for example, when looking at how catastrophic or impoverishing health spending is distributed across households.
The new metrics in this report aim to monitor financial protection in a way that is able to identify specific groups of people – those most likely to be left behind – in line with WHO’s normative role and the overarching principle of the SDGs.
Detailed information on the financial protection and unmet need indicators used in this report is provided in the section on methods. The methods section highlights key differences in the way in which impoverishing health spending and catastrophic health spending can be measured and compares the metrics used in this report to the metrics used for global monitoring. It also discusses sources of data and limitations.
New numbers for Europe
In 2017, WHO and the World Bank published a global analysis of financial protection, drawing on data ranging from 1993 to 2014 for countries in the European Region (WHO & World Bank, 2017). Before this, the only analysis of financial protection covering multiple European countries and including countries from across the EU came from an earlier global study drawing on data from 1993 to 2002 (Xu et al., 2003, 2007).
Other studies of financial protection involving countries in Europe focus on a limited selection of mainly middle-income countries or on selected groups such as older people; none of these studies includes data beyond 2011 (Arsenijevic et al., 2016; Baird, 2016; Bredenkamp et al., 2011; Palladino et al., 2016; Saksena et al., 2014; Scheil-Adlung & Bonan, 2013; Smith & Nguyen, 2013; WHO & World Bank, 2015).
As a result, the literature on financial protection in Europe is characterized by major gaps in geographical scope; is not up to date; and does not permit international comparison for more than a few countries due to substantial variation in methods and data sources (Yerramilli et al., 2018). In addition, very few studies have assessed both financial protection and unmet need.
Can people afford to pay for health care in Europe? 8

This report adds value by providing up-to-date numbers using consistent methods and data sources for a wide range of high- and middle-income countries in Europe. For almost all countries, it draws on the most recent year of data available, mainly data from 2016, 2015 and 2014. Importantly, it considers financial protection alongside unmet need, bringing together for the first time these two indicators for a wide range of countries in Europe.
The countries included in the study were selected to reflect a mix of stronger and weaker performance in terms of financial protection. The study also gives priority to countries in which: it is possible to monitor trends over time; the financial and economic crisis is likely to have had a profound effect; reforms to move towards universal health coverage have been introduced or are soon to be implemented; and there is active policy dialogue.
Selected countries span the geographical breadth of the European Region, from Ireland in western Europe to Kyrgyzstan in central Asia. They cover:
• 18 out of 33 high-income countries in the European Region and 18 out of 28 EU countries: Austria, Croatia, Cyprus, Czechia, Estonia, France, Germany, Greece, Hungary, Ireland, Latvia, Lithuania, Poland, Portugal, Slovakia, Slovenia, Sweden and the United Kingdom;
• two out of 14 upper-middle-income countries: Albania and Turkey; and
• four out of five lower middle-income countries: Georgia, Kyrgyzstan, the Republic of Moldova and Ukraine.
The section on new numbers for Europe summarizes the results of the financial protection analysis, drawing on microdata from national household budget surveys. National experts in each country analysed the data in collaboration with WHO. WHO carried out the comparative analysis. The section also presents statistics on unmet need for health care using data from EU-SILC and EHIS. The data on unmet need were downloaded from the Eurostat database.
The story behind the numbers
The approach of the WHO Regional Office for Europe to monitoring financial protection is rooted in context-specific, country-level analysis. The numbers presented in this report come from detailed country reports prepared by national experts in collaboration with WHO. The country reports discuss and interpret the results of statistical analysis in the context of national policy developments in the health system and beyond the health system. They follow a standard template, draw on similar sources of data, use the same methods and are subject to independent external peer review. Member States are consulted on the numbers and invited to comment on the country report.
This in-depth, context-specific and consistent approach not only enables WHO to provide policy recommendations that are tailored to a particular country, but also facilitates international comparison and learning through the observation of patterns across countries. It is an
9Why monitor financial protection in Europe?

important complement to global monitoring, which gives priority to producing numbers for as many countries as possible, but does not offer interpretation of these numbers at regional or national level (WHO & World Bank, 2017).
The section on the story behind the numbers considers financial protection and unmet need indicators in the context of national health systems, linking the numbers to levels and patterns of spending on health and to coverage policy to identify factors that strengthen and undermine financial protection at the national and regional levels.
Acting on the evidence
A final section concludes the report by highlighting implications for policy. It summarizes actions that have the potential to improve financial protection by strengthening coverage policy. It also highlights actions that should be avoided.
Can people afford to pay for health care in Europe? 10

Policy-relevant measurement with a focus on equity
Methods, data and limitations
Financial protection is measured using two well-established indicators: impoverishing health spending and catastrophic health spending. Both indicators assess a household’s out-of-pocket payments in relation to a pre-defined threshold, but each indicator can be calculated in different ways. This section begins with a definition of out-of-pocket payments; highlights key differences in the ways in which impoverishing health spending and catastrophic health spending can be measured; sets out the metrics used by WHO to monitor financial protection at the global and regional levels; and explains why the WHO Regional Office for Europe has developed and is using new metrics. It then provides more detailed information on the new metrics used in this report; sources of data for indicators of financial protection and unmet need; and limitations.
Defining out-of-pocket payments
The mechanisms used to finance health systems fall into two groups: pre-payment, which includes taxes, contributions, voluntary health insurance (VHI) premiums and medical savings accounts; and out-of-pocket payments, which are also referred to as household spending on health.
All financial protection indicators define out-of-pocket payments in the same internationally standard way (OECD et al., 2017) as:
• formal and informal payments
• made by people at the time of using any health good or service
• delivered by any type of provider.
Out-of-pocket payments typically include consultation fees; payment for medicines and other medical supplies, diagnostic and laboratory tests and ambulance services; payments occurring during hospitalization; and spending on complementary or alternative medicine. They do not include spending on special nutrition or health-related transportation other than for emergency purposes, or any reimbursement from a third-party payer such as the government, health insurance funds or private insurance companies.
In keeping with this international definition, financial protection analysis encompasses the vast majority of health-related out-of-pocket payments. It does not distinguish between out-of-pocket payments that are formal or informal, spent on covered or non-covered goods and services, in public or private settings, or on goods or services that are more or less effective or more or less necessary. While it would be useful to have a more detailed understanding of how, where and on what out-of-pocket payments are spent, data sources do not typically permit such distinctions. Even if they did, it would still be important to include most, if not all, out-of-pocket payments in the analysis because financial hardship can arise from the purchase of any health good or service, including those that are not needed, not effective or not cost-effective, and health systems should take responsibility for inappropriate use of health care.
Can people afford to pay for health care in Europe? 12

Analysis of financial protection should not include any form of pre-payment for health (taxes, contributions or VHI premiums) given that the purpose of pre-payment is to limit people’s exposure to out-of-pocket payments. In some contexts, it may be useful to look at how much households are spending on VHI as a way of assessing the financial burden associated with VHI (see below). However, VHI premiums are not included in the calculation of impoverishing or catastrophic health spending (financial hardship) because it would be difficult to justify including VHI premiums in financial protection analysis without also including taxes and contributions.
How much should households spend on health?
Health financing mechanisms can exhibit a progressive, proportional or regressive distribution across households.
• Progressive payments account for an increasing portion of household income or consumption – a household’s ability to pay: richer households pay a higher share than poorer households.
• Proportional payments account for a constant portion of ability to pay: all households pay the same share.
• Regressive payments account for a decreasing portion of ability to pay: poorer households pay a higher share than richer households.
When measuring equity in financing the health system, the focus is on the extent to which payment mechanisms reflect differences in people’s ability to pay (Wagstaff et al., 1999). Equity is assessed by looking at the distribution of different types of health payment across households, including out-of-pocket payments. The distribution of health payments across households is referred to as financial burden (WHO, 2000).
Measurement of financial protection focuses exclusively on out-of-pocket payments. It does not stop at assessing the distribution of out-of-pocket payments across households, but goes on to assess a household’s out-of-pocket payments in relation to a pre-defined threshold. Out-of-pocket payments that exceed the threshold are deemed to cause financial hardship.
Both types of measurement can be underpinned by normative propositions about how much households should spend on health – that is, judgements about what is fair or desirable.
From the outset, WHO’s approach to assessing health system performance has been informed by the normative proposition that poor households should pay less towards the health system than rich households, not only because poor households have lower incomes, but also because a larger share of their budget is spent on basic needs such as food and housing (Murray & Frenk, 2000).
In addition to favouring a progressive distribution, WHO’s approach acknowledges differences in discretionary consumption between rich and poor, not just differences in total consumption. In keeping with the SDG commitment to leave no one behind, WHO’s approach also reflects the
13Policy-relevant measurement with a focus on equity

notion that if every household is to pay a fair share towards the costs of the health system, “in the case of very poor households, ‘fair share’ might mean no payment at all” (Murray & Frenk, 2000: 720).
As the following sections show, different ways of measuring the two established indicators of financial protection reflect different judgements about fairness.
Variation in the measurement of impoverishing health spending
Impoverishing health spending assesses out-of-pocket payments in relation to a poverty line. Metrics used to calculate the incidence of impoverishing spending on health vary with the poverty line used. Some studies apply the same absolute poverty line across countries (adjusting for purchasing power parities) or use national poverty lines; others use a relative poverty line that reflects actual patterns of household spending on one or more basic needs (as in this study); and a few use relative poverty lines set as a share of median consumption or income (Yerramilli et al., 2018). The incidence of impoverishing health spending is highly sensitive to the choice of poverty line.
The conventional approach to measuring the incidence of impoverishing health spending is to count households whose total consumption is above the poverty line and whose consumption net of out-of-pocket payments is below the poverty line (impoverished households). This is often referred to as the poverty headcount. However, excluding households who are already poor and incur out-of-pocket payments from the headcount (further impoverished households) implies that out-of-pocket payments are only problematic if they lead to poverty, not if they make people who are already poor even worse off.
One approach to counteracting this perverse implication is to assess the depth or severity of poverty linked to out-of-pocket payments based on the total or average amount spent out of pocket among impoverished and further impoverished households (WHO & World Bank, 2017). This can be done by comparing the so-called poverty gap – how far households are below the poverty line – gross and net of out-of-pocket payments. The calculation of a monetary amount is not necessarily informative for policy purposes, however, since to eliminate this source of financial hardship for households would require the ability to identify and target these particular households for exemptions from out-of-pocket payments. Nor does it capture the incidence of further impoverished households in a country.
Another approach is to broaden the incidence of impoverishing health spending to include not only impoverished households but also any households who are further impoverished (Wagstaff & Eozenou, 2014; WHO & World Bank, 2015). This is the approach this report takes because it gives visibility to a highly vulnerable group of people. It is also in line with the normative proposition that very poor households should not have to pay for health.
Can people afford to pay for health care in Europe? 14

Variation in the measurement of catastrophic health spending
Catastrophic health spending assesses out-of-pocket payments in relation to the resources available to each household – a household’s ability to pay. Households whose out-of-pocket payments cross a pre-defined threshold in comparison to their ability to pay are considered to have incurred catastrophic health spending.
Table 1 compares the metrics most commonly used to calculate the incidence of catastrophic spending on health. All of them employ the same numerator – out-of-pocket payments – but define the denominator differently.
• The budget share approach assumes that all of a household’s resources are available to pay for health care; the denominator is total household consumption.
• The capacity-to-pay approach assumes that households need to spend some minimum amount on basic needs such as food and housing; the denominator is total household consumption minus an amount intended to represent spending on basic needs; the amount to be deducted is determined in different ways.
A key distinction between these two approaches is in the effective threshold each household needs to cross – that is, the out-of-pocket budget share they need to spend – to be counted as having incurred catastrophic health spending.
• In the budget share approach, the pre-defined threshold is applied to total household consumption; as a result, the effective threshold is identical for all households.
• In the capacity-to-pay approach, the pre-defined threshold is not applied to total household consumption but to total household consumption minus an amount representing spending on basic needs; as a result, the effective threshold varies across households.
Both approaches are underpinned by different judgements about what is fair. When the effective threshold is identical for all households, as in the budget share approach, the normative proposition is that households should spend the same proportion of their budget on health in order to be considered as having experienced financial hardship. In contrast, the capacity-to-pay approach reflects the judgement that differences in discretionary consumption matter, not just differences in total consumption. Its normative proposition is that poor households should spend a lower proportion of their budget on health than rich households. It therefore aims to establish lower effective thresholds for poorer households and higher effective thresholds for richer households.
The choice of overall approach – budget share or capacity to pay – as well as the choice of metric within the capacity-to-pay approach has important implications for equity and policy, as summarized in Table 1. Empirical analysis finds the capacity-to-pay approach to be more sensitive to financial hardship among poorer households than the budget share
15Policy-relevant measurement with a focus on equity
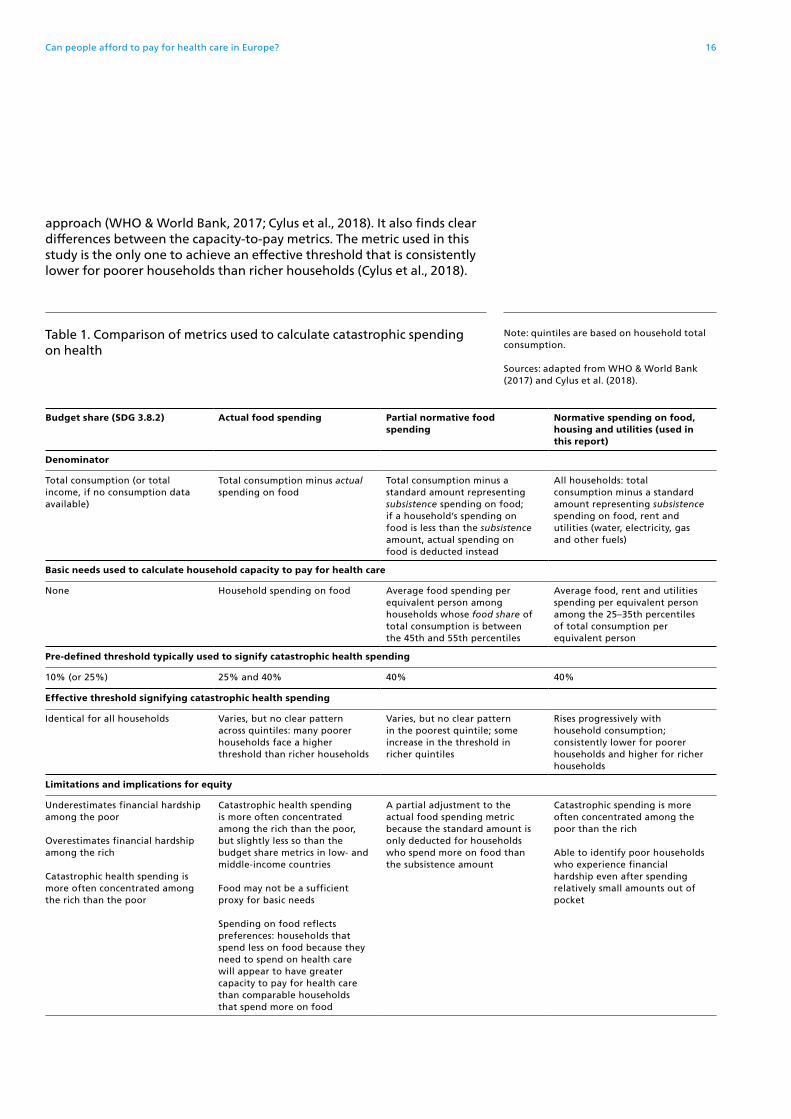
approach (WHO & World Bank, 2017; Cylus et al., 2018). It also finds clear differences between the capacity-to-pay metrics. The metric used in this study is the only one to achieve an effective threshold that is consistently lower for poorer households than richer households (Cylus et al., 2018).
Table 1. Comparison of metrics used to calculate catastrophic spending on health
Note: quintiles are based on household total consumption.
Sources: adapted from WHO & World Bank (2017) and Cylus et al. (2018).
Budget share (SDG 3.8.2) Actual food spending Partial normative food spending
Normative spending on food, housing and utilities (used in this report)
Denominator
Total consumption (or total income, if no consumption data available)
Total consumption minus actual spending on food
Total consumption minus a standard amount representing subsistence spending on food; if a household’s spending on food is less than the subsistence amount, actual spending on food is deducted instead
All households: total consumption minus a standard amount representing subsistence spending on food, rent and utilities (water, electricity, gas and other fuels)
Basic needs used to calculate household capacity to pay for health care
None Household spending on food Average food spending per equivalent person among households whose food share of total consumption is between the 45th and 55th percentiles
Average food, rent and utilities spending per equivalent person among the 25–35th percentiles of total consumption per equivalent person
Pre-defined threshold typically used to signify catastrophic health spending
10% (or 25%) 25% and 40% 40% 40%
Effective threshold signifying catastrophic health spending
Identical for all households Varies, but no clear pattern across quintiles: many poorer households face a higher threshold than richer households
Varies, but no clear pattern in the poorest quintile; some increase in the threshold in richer quintiles
Rises progressively with household consumption; consistently lower for poorer households and higher for richer households
Limitations and implications for equity
Underestimates financial hardship among the poor
Overestimates financial hardship among the rich
Catastrophic health spending is more often concentrated among the rich than the poor
Catastrophic health spending is more often concentrated among the rich than the poor, but slightly less so than the budget share metrics in low- and middle-income countries
Food may not be a sufficient proxy for basic needs
Spending on food reflects preferences: households that spend less on food because they need to spend on health care will appear to have greater capacity to pay for health care than comparable households that spend more on food
A partial adjustment to the actual food spending metric because the standard amount is only deducted for households who spend more on food than the subsistence amount
Catastrophic spending is more often concentrated among the poor than the rich
Able to identify poor households who experience financial hardship even after spending relatively small amounts out of pocket
Can people afford to pay for health care in Europe? 16

How does WHO monitor financial protection?
WHO has monitored financial protection since the publication of The world health report on health system performance (WHO, 2000). In doing so, it has been guided by the normative proposition that payments for health should reflect differences in capacity to pay for health care between rich and poor and acknowledging that, for very poor households, this might imply no payment at all (Murray & Frenk, 2000).
In keeping with its normative role, WHO has always used a capacity-to-pay approach to monitor catastrophic health spending (the partial normative food spending metric), applying the same relative poverty line used to determine capacity to pay for health care to also identify impoverishing health spending (Xu et al., 2003). The poverty line is based on country-specific patterns of household spending on food as a proxy for basic needs.
In 2015, WHO adopted the budget share approach for global monitoring of catastrophic health spending (SDG indicator 3.8.2), to accommodate global variation in data availability, and a service coverage index for global monitoring of access to and use of health services (SDG indicator 3.8.1). Impoverishing health spending is not part of the SDG framework but, because it links to SDG 1 (no poverty), WHO monitors it globally using absolute poverty lines set at US$ 1.90 and US$ 3.10 per day (adjusted for 2011 purchasing power parity) and a relative poverty line of 60% of median consumption or income per person per day.
WHO regional offices continue to use a range of metrics to monitor financial protection and access to health services, alongside the metrics used in the SDGs (Wang et al., 2018; Dmytraczenko & Almeida, 2015; WPRO 2017; Thomson et al., 2018).
The global and regional metrics the WHO Regional Office for Europe uses are summarized in Table 2. Note that this report presents results for regional metrics only. Results for global metrics can be found through WHO’s Global Health Observatory (WHO, 2019b).
17Policy-relevant measurement with a focus on equity
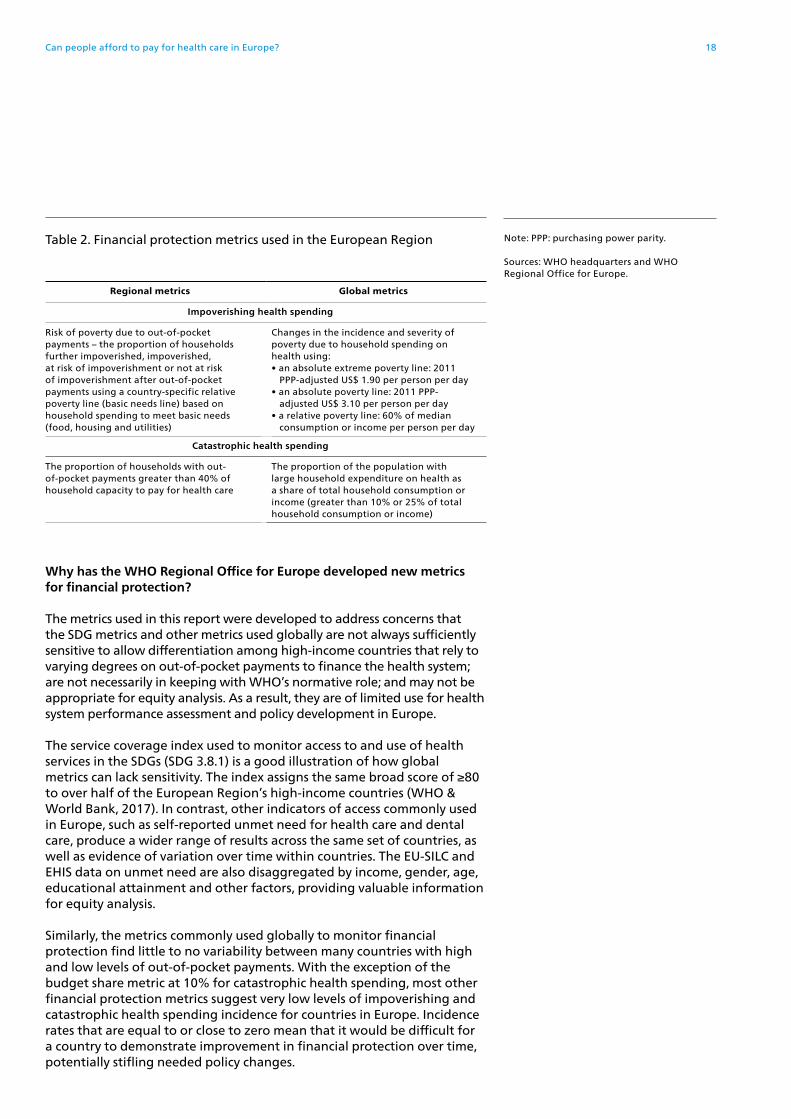
Why has the WHO Regional Office for Europe developed new metrics for financial protection?
The metrics used in this report were developed to address concerns that the SDG metrics and other metrics used globally are not always sufficiently sensitive to allow differentiation among high-income countries that rely to varying degrees on out-of-pocket payments to finance the health system; are not necessarily in keeping with WHO’s normative role; and may not be appropriate for equity analysis. As a result, they are of limited use for health system performance assessment and policy development in Europe.
The service coverage index used to monitor access to and use of health services in the SDGs (SDG 3.8.1) is a good illustration of how global metrics can lack sensitivity. The index assigns the same broad score of ≥80 to over half of the European Region’s high-income countries (WHO & World Bank, 2017). In contrast, other indicators of access commonly used in Europe, such as self-reported unmet need for health care and dental care, produce a wider range of results across the same set of countries, as well as evidence of variation over time within countries. The EU-SILC and EHIS data on unmet need are also disaggregated by income, gender, age, educational attainment and other factors, providing valuable information for equity analysis.
Similarly, the metrics commonly used globally to monitor financial protection find little to no variability between many countries with high and low levels of out-of-pocket payments. With the exception of the budget share metric at 10% for catastrophic health spending, most other financial protection metrics suggest very low levels of impoverishing and catastrophic health spending incidence for countries in Europe. Incidence rates that are equal to or close to zero mean that it would be difficult for a country to demonstrate improvement in financial protection over time, potentially stifling needed policy changes.
Table 2. Financial protection metrics used in the European Region
Regional metrics Global metrics
Impoverishing health spending
Risk of poverty due to out-of-pocket payments – the proportion of households further impoverished, impoverished, at risk of impoverishment or not at risk of impoverishment after out-of-pocket payments using a country-specific relative poverty line (basic needs line) based on household spending to meet basic needs (food, housing and utilities)
Changes in the incidence and severity of poverty due to household spending on health using:• an absolute extreme poverty line: 2011
PPP-adjusted US$ 1.90 per person per day• an absolute poverty line: 2011 PPP-
adjusted US$ 3.10 per person per day• a relative poverty line: 60% of median
consumption or income per person per day
Catastrophic health spending
The proportion of households with out-of-pocket payments greater than 40% of household capacity to pay for health care
The proportion of the population with large household expenditure on health as a share of total household consumption or income (greater than 10% or 25% of total household consumption or income)
Note: PPP: purchasing power parity.
Sources: WHO headquarters and WHO Regional Office for Europe.
Can people afford to pay for health care in Europe? 18

For example, global analysis of impoverishing health spending uses absolute poverty lines set at US$ 1.90 and US$ 3.10 per person per day (adjusted for 2011 purchasing power parity). Based on these low, absolute poverty lines, the average share of the population impoverished after out-of-pocket payments across countries in the European Region in 2010 was 0.1% at the US$ 1.90 line indicating extreme poverty and 0.2% at the US$ 3.10 line; many high-income and upper-middle-income countries – and even some lower-middle-income countries like the Republic of Moldova and Ukraine – were found to have no impoverishing health spending at all using the US$ 1.90 line (WHO & World Bank, 2017). These results indicate that the poverty lines used globally are too low to be sufficiently sensitive for use in high- and middle-income countries.
The SDG metrics used for global analysis of catastrophic health spending pose a challenge for equity because they do not account for household capacity to pay for health care. Applying the same effective threshold to rich and poor households is problematic for the following reasons.
• It requires poor households – even those living in extreme poverty, who are already unable to meet their basic needs – to spend at least 10% (or 25%) of their budget on health in order to be counted as having experienced financial hardship.
• It holds the poorest and richest households to the same standard; underestimates financial hardship among the poor; and overestimates financial hardship among the rich.
• It produces results indicating that catastrophic health spending is concentrated among richer households (WHO & World Bank, 2015, 2017; Cylus et al., 2018).
• The implication for policy is that financial hardship is mainly a problem for richer people and can be addressed by reducing out-of-pocket payments for richer people, which could make it difficult to justify the introduction of policies to improve financial protection for the poor.
These requirements and results are not in keeping with the normative proposition that very poor households should not have to pay for health or with the SDG commitment to data and indicators capable of identifying and addressing the groups of people most likely to be left behind (United Nations, 2016b).
The metrics used in this report are a response to the limitations of the financial protection metrics used at global level. Building on established methods (Wagstaff & van Doorslaer, 2003; Xu et al., 2003; O’Donnell et al., 2008; Wagstaff & Eozenou, 2014), they aim to measure financial protection in a way that is relevant to all countries in the European Region (and beyond), produces actionable evidence for policy and promotes policies to break the link between ill health and poverty. The following section explains in more detail how the new metrics differ from global metrics.
19Policy-relevant measurement with a focus on equity

The financial protection metrics used in this report
Table 3 summarizes the key dimensions of the financial protection metrics used in this report.
Fig. 2 illustrates the WHO Regional Office for Europe’s approach to measuring impoverishing health spending.
Table 3. The financial protection metrics used in this report
Impoverishing health spending
Definition The share of households impoverished or further impoverished after out-of-pocket payments
Poverty line A basic needs line, calculated as the average amount spent on food, housing (rent) and utilities (water, electricity and fuel used for cooking and heating) by households between the 25th and 35th percentiles of the household consumption distribution who report any spending on each item, respectively, adjusted for household size and composition using OECD equivalence scales; these households are selected based on the assumption that they are able to meet, but not necessarily exceed, basic needs for food, housing and utilities; this standard amount is also used to define a household’s capacity to pay for health care (see below)
Poverty dimensions captured
The share of households further impoverished, impoverished and at risk of impoverishment after out-of-pocket payments and the share of households not at risk of impoverishment after out-of-pocket payments; a household is impoverished if its total consumption falls below the basic needs line after out-of-pocket payments; further impoverished if its total consumption is below the basic needs line before out-of-pocket payments; and at risk of impoverishment if its total consumption after out-of-pocket payments comes within 120% of the basic needs line
Disaggregation Results can be disaggregated into household quintiles by consumption and by other factors where relevant, as described below
Data source Microdata from national household budget surveys
Catastrophic health spending
Definition The share of households with out-of-pocket payments that are greater than 40% of household capacity to pay for health care
Numerator Out-of-pocket payments
Denominator A household’s capacity to pay for health care is defined as total household consumption minus a standard amount to cover basic needs; the standard amount is calculated as the average amount spent on food, housing and utilities by households between the 25th and 35th percentiles of the household consumption distribution, as described above; this standard amount is also used as a poverty line (basic needs line) to measure impoverishing health spending
Disaggregation Results are disaggregated into household quintiles by consumption per person using OECD equivalence scales; disaggregation by place of residence (urban–rural), age of the head of the household, household composition and other factors is included where relevant
Data source Microdata from national household budget surveys
Notes: OECD: Organisation for Economic Co-operation and Development. See the glossary of terms for definitions of words in italics.
Source: Thomson et al. (2018).
Can people afford to pay for health care in Europe? 20

Households are divided into five categories based on their level of out-of-pocket spending on health in relation to the poverty line (the basic needs line described in Table 3):
1 no out-of-pocket payments: households that report no out-of-pocket payments;
2 not at risk of impoverishment after out-of-pocket payments: non-poor households (those whose equivalent person total consumption exceeds the poverty line) with out-of-pocket payments that do not push them below 120% of the poverty line (i.e. households whose per equivalent person consumption net of out-of-pocket payments is at or above 120% of the poverty line);
3 at risk of impoverishment after out-of-pocket payments: non-poor households with out-of-pocket payments that push them below 120% of the poverty line;
4 impoverished after out-of-pocket payments: households who were non-poor before out-of-pocket payments, but are pushed below the poverty line after out-of-pocket payments; and
5 further impoverished after out-of-pocket payments: poor households (those whose equivalent person total consumption is below the poverty line) who incur out-of-pocket payments.
Fig. 2. Measurement of impoverishing health spending used in this report
Source: WHO Regional Office for Europe.
Within 120% of basic needs line
Basic needs line
5
4
3
2
1
Further impoverished
Impoverished
At risk of impoverishment
Not at risk of impoverishment
No out-of-pocket payments
Ho
use
ho
ld c
on
sum
pti
on
Cumulative distribution of the population
Before out-of-pocket payments
After out-of-pocket payments
21Policy-relevant measurement with a focus on equity

This measure of impoverishing health spending differs from other metrics in the following ways.
• It uses a relative poverty line (basic needs line) rather than the absolute poverty lines used at global level; although the line is conservative – typically much lower than the relative poverty line (60% of median income) used across EU countries, for example – it is better able to reflect national poverty levels than global metrics (even if the latter are adjusted for purchasing power parities) because it is derived from consumption patterns observed in each country.
• The basic needs line reflects country-specific patterns of spending on housing and utilities in addition to food.
• Conventional measures of the incidence of impoverishing health spending only count people who cross the poverty line after incurring out-of-pocket payments; this report uses a metric that also counts people who are already poor and whose poverty is made worse by having to pay out of pocket for health services (further impoverished households).
Fig. 3 illustrates the WHO Regional Office for Europe’s approach to measuring catastrophic health spending, which it defines as out-of-pocket payments greater than 40% of household capacity to pay for health care.
Fig. 3. Measurement of catastrophic health spending used in this report
Source: WHO Regional Office for Europe.
Before out-of-pocket payments
Capacity to pay for health care
Basic needs line
After out-of-pocket payments
Catastrophic health spendingC
C
C
C
C
Further impoverished
Impoverished
Ho
use
ho
ld c
on
sum
pti
on
Cumulative distribution of the population
Can people afford to pay for health care in Europe? 22
This measure of catastrophic health spending differs from other capacity-to-pay metrics in deducting a standard amount across all households. As a result of this feature:
• further impoverished households are consistently deemed to experience catastrophic health spending because they do not have any capacity to pay for health care;
• impoverished households are consistently deemed to have catastrophic health spending because their out-of-pocket payments are greater than their capacity to pay for health care; and
• the effective threshold rises progressively with household consumption; it is consistently lower for poorer households and higher for richer households.
Data for indicators of financial protection: household budget surveys
All financial protection indicators, regardless of the metrics used, require microdata from national household budget surveys. These surveys collect detailed information on household spending on goods and services over a given period of time and include information about household characteristics. They provide valuable information on how societies and people use goods and services to meet their needs and preferences. Almost every country in Europe conducts a household budget survey at regular intervals – at least once every five years in EU countries (Eurostat, 2015) – and sometimes on an annual basis (Yerramilli et al., 2018).
For this study, national experts obtained access to survey microdata from national statistical offices. In many cases, the study uses the most recent data available. Due to differences in the frequency with which surveys are carried out, however, it was not possible to identify surveys in the same year for all countries, so the data range from 2011 to 2016, with data from 2014 to 2016 in 18 out of 24 countries (see Table 4). Microdata from household budget surveys are usually only available one to two years after the survey is carried out.
With the exception of France, the country reports on which this study is based include more than one year of comparable household budget survey data, allowing analysis of trends over time within a country. This report, however, does not include any time trend analysis due to the different years for which data are available across countries.
23Policy-relevant measurement with a focus on equity
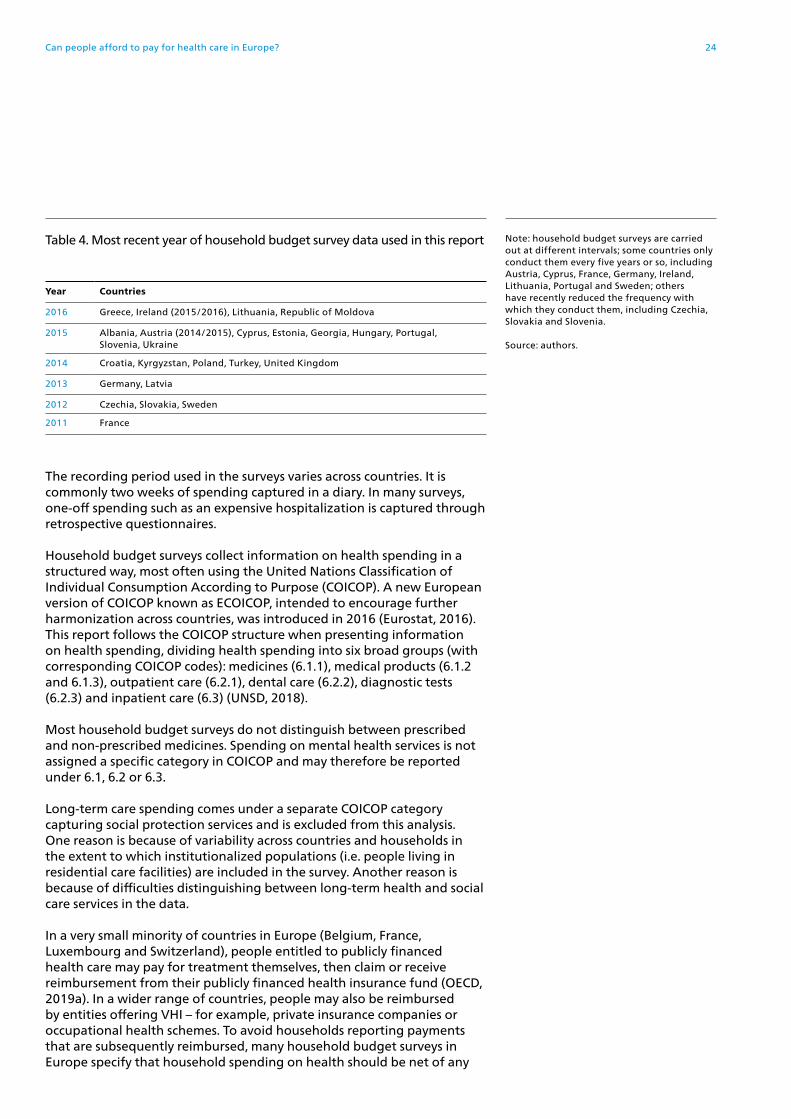
The recording period used in the surveys varies across countries. It is commonly two weeks of spending captured in a diary. In many surveys, one-off spending such as an expensive hospitalization is captured through retrospective questionnaires.
Household budget surveys collect information on health spending in a structured way, most often using the United Nations Classification of Individual Consumption According to Purpose (COICOP). A new European version of COICOP known as ECOICOP, intended to encourage further harmonization across countries, was introduced in 2016 (Eurostat, 2016). This report follows the COICOP structure when presenting information on health spending, dividing health spending into six broad groups (with corresponding COICOP codes): medicines (6.1.1), medical products (6.1.2 and 6.1.3), outpatient care (6.2.1), dental care (6.2.2), diagnostic tests (6.2.3) and inpatient care (6.3) (UNSD, 2018).
Most household budget surveys do not distinguish between prescribed and non-prescribed medicines. Spending on mental health services is not assigned a specific category in COICOP and may therefore be reported under 6.1, 6.2 or 6.3.
Long-term care spending comes under a separate COICOP category capturing social protection services and is excluded from this analysis. One reason is because of variability across countries and households in the extent to which institutionalized populations (i.e. people living in residential care facilities) are included in the survey. Another reason is because of difficulties distinguishing between long-term health and social care services in the data.
In a very small minority of countries in Europe (Belgium, France, Luxembourg and Switzerland), people entitled to publicly financed health care may pay for treatment themselves, then claim or receive reimbursement from their publicly financed health insurance fund (OECD, 2019a). In a wider range of countries, people may also be reimbursed by entities offering VHI – for example, private insurance companies or occupational health schemes. To avoid households reporting payments that are subsequently reimbursed, many household budget surveys in Europe specify that household spending on health should be net of any
Table 4. Most recent year of household budget survey data used in this report
Year Countries
2016 Greece, Ireland (2015/2016), Lithuania, Republic of Moldova
2015 Albania, Austria (2014/2015), Cyprus, Estonia, Georgia, Hungary, Portugal, Slovenia, Ukraine
2014 Croatia, Kyrgyzstan, Poland, Turkey, United Kingdom
2013 Germany, Latvia
2012 Czechia, Slovakia, Sweden
2011 France
Note: household budget surveys are carried out at different intervals; some countries only conduct them every five years or so, including Austria, Cyprus, France, Germany, Ireland, Lithuania, Portugal and Sweden; others have recently reduced the frequency with which they conduct them, including Czechia, Slovakia and Slovenia.
Source: authors.
Can people afford to pay for health care in Europe? 24

reimbursement from a third party such as the government, a health insurance fund or a private insurance company (Heijink et al., 2011).
Some household budget surveys also ask households about spending on VHI. This is reported under a different COICOP code (12.5.3 Insurance connected with health, which covers “Service charges for private sickness and accident insurance”) (UNSD, 2018). VHI is not included in the analysis of financial protection.
Data for indicators of unmet need: EU-SILC and EHIS
The data on unmet need for health care presented in this report are downloaded from the Eurostat database and come from two surveys (Eurostat, 2018a, 2018b).
Every year, EU countries and a few non-EU countries collect data on unmet need for health and dental care through EU-SILC. EU-SILC asks people aged 16 years and over whether there was a time during the last 12 months when they really needed a medical examination or treatment (health care) or a dental examination or treatment (dental care) but did not receive it, and if so, for what reason. The health system-related reasons include cost, distance to services and waiting time.
EU countries also collect data on unmet need through EHIS carried out approximately every five years. The second wave of this survey was conducted in 2014; the third wave is due in 2019. EHIS asks people aged over 15 years about unmet need for health care due to cost, distance to services and waiting time. It also asks people about unmet need due to cost for medical care, dental care, mental health care and prescribed medicines.
EHIS provides information on unmet need as a share of people reporting a need for care, whereas EU-SILC provides information on unmet need as a share of the population. This means that the results of the two surveys are not directly comparable. In 2016, the EU-SILC question on unmet need was split into two questions to match the format used in EHIS. This may have the effect of making EU-SILC results more comparable to EHIS results in the future. In practice, however, countries may not have adapted their national EU-SILC questionnaires, so caution is still needed in comparing EU-SILC and EHIS results.
While both surveys provide important information across a wide range of countries, and are particularly useful for identifying trends over time within a country, comparative data on unmet need must be interpreted with caution due to variation in national questionnaires and differences in the way the questions asked may be understood in different contexts (Allin et al., 2009; Allin & Masseria, 2009; Arora et al., 2015; EXPH, 2016, 2017). Ideally, data on unmet need should be linked to data on patterns of use and waiting times within and across countries, but these data are not consistently available across countries in Europe.
25Policy-relevant measurement with a focus on equity

Limitations
A number of limitations apply to analysis of financial protection, regardless of the metrics used. Many of the limitations arise from the use of data from household budget surveys.
The surveys differ across countries. Classification tools such as COICOP (and ECOICOP in Europe) support standardization, but they do not address variation in the instruments used to capture data (e.g. diaries, questionnaires, interviews, registers), response rates and unobservable differences such as whether the survey sample is truly nationally representative. Cross-national variation in survey instruments can affect levels of spending and the distribution of spending across households. It is important to note, however, that its effect on spending on health in relation to total consumption – which is what financial protection indicators measure – may not be so great.
The surveys are almost always cross-sectional, meaning households cannot be observed over time. As a result, it is not possible to determine whether out-of-pocket payments are one-off or ongoing in nature or to observe how changes in out-of-pocket spending over time influence changes in household spending on other things.
The surveys usually report data at household level, making it impossible to identify who in a household has actually incurred out-of-pocket payments. This may not be a problem since the household unit typically functions as a risk pool. However, it means that differences in household size and composition can lead to variations in the incidence of catastrophic health spending and the types of household that incur catastrophic health spending. For example, multigenerational households could be less likely to experience catastrophic health spending if they include multiple sources of income. To address this limitation, the metrics in this report use equivalence scales to account for differences in household size and composition.
The surveys do not usually include questions on unmet need for health care. Consequently, it is not possible to determine whether households reporting no out-of-pocket payments do so because they have no need for health care, are exempt from user charges (co-payments) or face barriers to access. Nor is it possible to determine whether households reporting out-of-pocket payments also experience unmet need for health care. To address this limitation, data on self-reported unmet need, utilization rates and waiting times can be used, where available, to ascertain at an aggregate level whether low levels of catastrophic health spending are likely to be due to underuse of health services. This report presents data on self-reported unmet need.
The surveys do not usually provide information on how households finance consumption. Research generally finds consumption to be a more reliable measure of welfare than income, especially where data are self-reported (Deaton, 1997; Deaton & Zaidi, 2002). However, because household budget surveys do not generally ask households how they finance their consumption, it is not possible to tell whether households finance out-of-pocket payments (or other things) by reducing consumption in other areas, drawing on savings, selling assets or borrowing.
Can people afford to pay for health care in Europe? 26

This has led some analysts to suggest that using total household consumption as the ranking variable to divide households into quintiles may overestimate welfare among households with high out-of-pocket payments; these households could be drawing on savings, selling assets or borrowing to finance out-of-pocket payments, which makes them seem richer than they would be if they had not had to spend on health (Flores et al., 2008). One way of addressing this potential problem is to change the ranking variable from total consumption to consumption net of out-of-pocket payments. This automatically shifts all households with out-of-pocket payments further to the left of the distribution, making them seem poorer. However, doing so assumes that all out-of-pocket payments are financed from savings, sale of assets or borrowing and that no households reduce their consumption of other things to pay for health, which is unlikely to be the case. Another objection to changing the ranking variable is that households able to use savings or assets to pay for health are in fact better off than those without savings or assets to sell.
The issue of the ranking variable is most likely to be problematic when using catastrophic health spending metrics that do not account for household capacity to pay for health care and, as a result, have effective thresholds that do not vary across households – for example, SDG 3.8.2 (see Table 1). Sensitivity analysis has shown that with the metric employed in this report, the distribution of households with catastrophic health spending is comparable when using total consumption and total consumption net of out-of-pocket payments to rank households. This is because the report’s metric has effective thresholds that are consistently lower for poorer households than richer households (Cylus et al., 2018). As a result, households counted as having incurred catastrophic health spending are already concentrated among the poor, and many of them spend relatively small amounts out of pocket; changing the ranking variable therefore only leads to marginal changes for many households.
In spite of these limitations, the use of household budget survey data to monitor financial protection is widely accepted in the literature on health system performance assessment. Results based on this source of data are used by all of the main international institutions involved in health – the European Commission, the Organisation for Economic Co-operation and Development (OECD), WHO and the World Bank – and, of course, in the SDGs. There is no doubt that financial protection analysis can provide valuable evidence for policy; it should be a routine component of health system performance assessment at the national, regional and global levels.
27Policy-relevant measurement with a focus on equity


New numbers for Europe

Comparing financial hardship across countries
This section presents the results of analysis of microdata from national household budget surveys.
How many households experience financial hardship?
Impoverishing health spending provides information on the impact of out-of-pocket payments on poverty. It is measured by looking at a household’s position in relation to a poverty line before and after incurring out-of-pocket payments. The poverty line used here reflects the average amount spent on meeting basic needs (food, housing and utilities) by households between the 25th and 35th percentiles of the household consumption distribution. These households are selected to determine the poverty line on the assumption that they are able to meet, but not necessarily exceed, basic needs.
The incidence of impoverishing health spending in the countries in the study ranges from 0.3% to 9.0% of households (Fig. 4). There is wide variation among EU countries (from 0.3% to 5.9%) and among non-EU countries (from 3.6% to 9.0%). The share of households impoverished after out-of-pocket payments (shown in orange in Fig. 4) ranges from less than 0.1% in the United Kingdom to 3.5% in the Republic of Moldova, while the share of further impoverished households (shown in red) ranges from 0.3% in Slovenia to 6.8% in Ukraine.
Ho
use
ho
lds
(%)
5
4
7
9
8
6
2
3
1
0
Fig. 4. Share of households with impoverishing health spending, latest year available
Notes: a household is impoverished if its total consumption is below the poverty line after out-of-pocket payments – that is, it is no longer able to afford to meet basic needs. A household is further impoverished if its total consumption is below the poverty line – it is already unable to meet basic needs – and it incurs out-of-pocket payments.
Source: WHO Regional Office for Europe.
Further impoverished
Impoverished
SVN
20
15
CZ
H 2
01
2
UN
K 2
01
4
IRE
20
16
DE
U 2
01
3
AU
T 2
01
5
SWE
20
12
FRA
20
11
SVK
20
12
CY
P 2
01
5
CR
O 2
01
4
GR
E 2
01
6
EST
20
15
PO
R 2
01
5
TUR
20
14
KG
Z 2
01
4
PO
L 2
01
4
LVA
20
13
GE
O 2
01
5
LTU
20
16
HU
N 2
01
5
MD
A 2
01
6
ALB
20
15
UK
R 2
01
5
Can people afford to pay for health care in Europe? 30

Catastrophic health spending is defined here as out-of-pocket payments that exceed 40% of a household’s capacity to pay for health care. Capacity to pay is what is left of a household’s budget after deducting a standard amount to represent the cost of meeting basic needs (food, housing and utilities). Households experiencing catastrophic health spending may not be able to afford to meet basic needs, particularly households who are impoverished and further impoverished after out-of-pocket payments.
The incidence of catastrophic health spending ranges from 1% to 17% of households in the countries in the study (Fig. 5). It varies widely among the 18 EU countries in the study, including wide variation among countries that joined the EU after 30 April 2004 (EU13). Among non-EU countries, however, the incidence is generally consistently high (over 12%), with the exception of Turkey (5%).
Ho
use
ho
lds
(%)
10
8
14
18
16
12
4
6
2
0
Fig. 5. Share of households with catastrophic health spending, latest year available
Notes: the results for Kyrgyzstan are not directly comparable to the other countries in the study. Due to evidence of borrowing to finance out-of-pocket payments in Kyrgyzstan, households were ranked based on consumption net of out-of-pocket payments to calculate the basic needs line and to identify quintiles. Using the method applied to the other countries, the catastrophic incidence in Kyrgyzstan would be 2–3 percentage points higher than shown in this figure.
Source: WHO Regional Office for Europe.
SVN
20
15
CZ
H 2
01
2
IRE
20
16
UN
K 2
01
4
SWE
20
12
FRA
20
11
DE
U 2
01
3
AU
T 2
01
5
SVK
20
12
CR
O 2
01
4
CY
P 2
01
5
TUR
20
14
EST
20
15
PO
R 2
01
5
PO
L 2
01
4
GR
E 2
01
6
HU
N 2
01
5
ALB
20
15
KG
Z 2
01
4
LVA
20
13
UK
R 2
01
5
GE
O 2
01
5
LTU
20
16
MD
A 2
01
6
31New numbers for Europe: financial hardship

Who experiences financial hardship?
The information in this section focuses on households with catastrophic health spending.
The incidence of catastrophic health spending varies across consumption quintiles, but is consistently heavily concentrated among the poorest consumption quintile (Fig. 6). Households with catastrophic spending are slightly more heavily concentrated among the poorest quintile in countries where the overall incidence of catastrophic health spending is low.
Ho
use
ho
lds
(%)
10
8
14
18
16
12
4
6
2
0
Fig. 6. Share of households with catastrophic health spending by consumption quintile, latest year available
SVN
20
15
CZ
H 2
01
2
IRE
20
16
UN
K 2
01
4
SWE
20
12
FRA
20
11
DE
U 2
01
3
AU
T 2
01
5
SVK
20
12
CR
O 2
01
4
CY
P 2
01
5
TUR
20
14
EST
20
15
PO
R 2
01
5
PO
L 2
01
4
GR
E 2
01
6
HU
N 2
01
5
ALB
20
15
KG
Z 2
01
4
LVA
20
13
UK
R 2
01
5
GE
O 2
01
5
LTU
20
16
MD
A 2
01
6
Richest
2nd
3rd
4th
Poorest
Notes: consumption quintiles are based on per person consumption using OECD equivalence scales. The first quintile is labelled “poorest” and the fifth quintile “richest”. Some households may appear to be richer than they actually are because they have borrowed money to finance spending on health (or other items). One can safely assume, however, that households in the poorest quintile are genuinely poor.
Source: WHO Regional Office for Europe.
Can people afford to pay for health care in Europe? 32

The incidence of catastrophic health spending in the poorest quintile is consistently well above the average incidence, as shown in Fig. 7. It is also consistently lower in countries where the overall incidence of catastrophic spending is low. In countries like Slovenia, Czechia, Ireland, the United Kingdom, Sweden, France and Germany, less than 10% of households in the poorest quintile experience catastrophic health spending. This is in contrast to countries like Ukraine, the Republic of Moldova, Hungary, Albania, Kyrgyzstan and Georgia, where at least 40% of households in the poorest quintile experience catastrophic health spending. The share is also high (around 30%) in Greece, Poland and Portugal.
Fig. 7. Share of households with catastrophic health spending on average and in the poorest consumption quintile, latest year available
Note: countries ranked by the incidence of catastrophic health spending from lowest to highest.
Source: WHO Regional Office for Europe.
All households
Poorest consumption quintile
Ho
use
ho
lds
(%)
50
40
20
30
10
0
SVN
20
15
CZ
H 2
01
2
IRE
20
16
UN
K 2
01
4
SWE
20
12
FRA
20
11
DE
U 2
01
3
AU
T 2
01
5
SVK
20
12
CR
O 2
01
4
CY
P 2
01
5
TUR
20
14
EST
20
15
PO
R 2
01
5
PO
L 2
01
4
GR
E 2
01
6
HU
N 2
01
5
ALB
20
15
KG
Z 2
01
4
LVA
20
13
UK
R 2
01
5
GE
O 2
01
5
LTU
20
16
MD
A 2
01
6
60
33New numbers for Europe: financial hardship
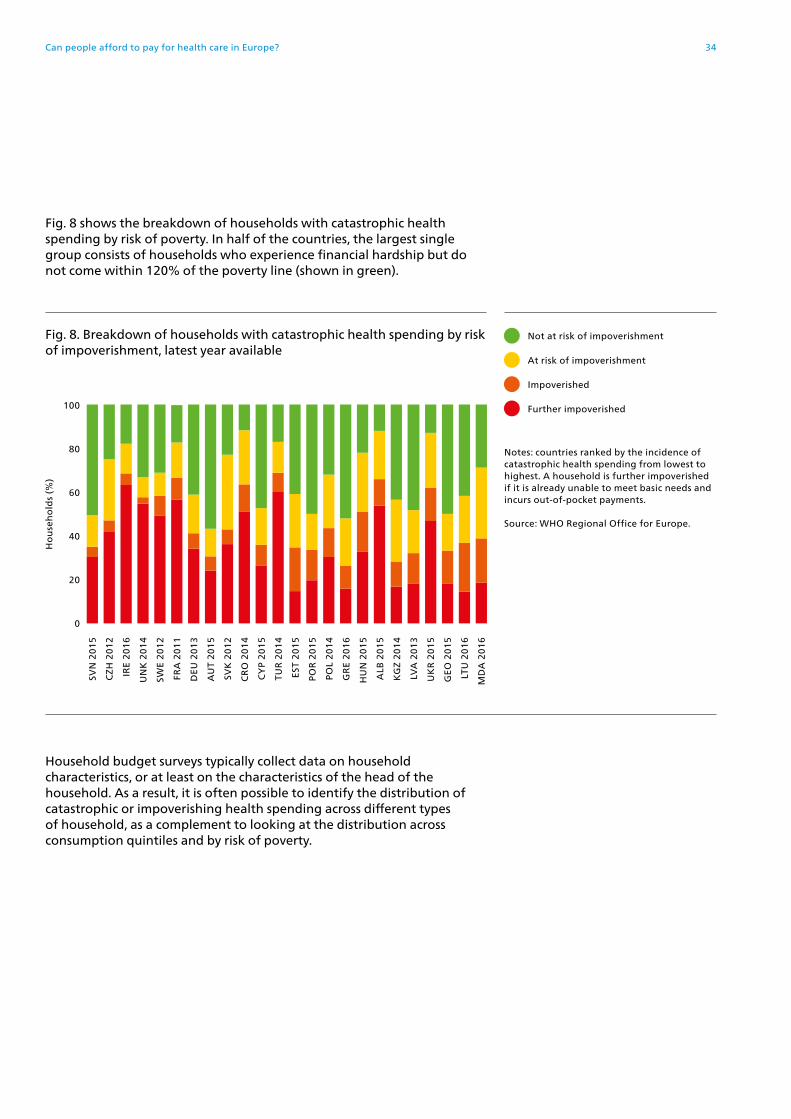
Fig. 8 shows the breakdown of households with catastrophic health spending by risk of poverty. In half of the countries, the largest single group consists of households who experience financial hardship but do not come within 120% of the poverty line (shown in green).
Household budget surveys typically collect data on household characteristics, or at least on the characteristics of the head of the household. As a result, it is often possible to identify the distribution of catastrophic or impoverishing health spending across different types of household, as a complement to looking at the distribution across consumption quintiles and by risk of poverty.
Ho
use
ho
lds
(%)
100
80
60
0
20
40
Fig. 8. Breakdown of households with catastrophic health spending by risk of impoverishment, latest year available
SVN
20
15
CZ
H 2
01
2
IRE
20
16
UN
K 2
01
4
SWE
20
12
FRA
20
11
DE
U 2
01
3
AU
T 2
01
5
SVK
20
12
CR
O 2
01
4
CY
P 2
01
5
TUR
20
14
EST
20
15
PO
R 2
01
5
PO
L 2
01
4
GR
E 2
01
6
HU
N 2
01
5
ALB
20
15
KG
Z 2
01
4
LVA
20
13
UK
R 2
01
5
GE
O 2
01
5
LTU
20
16
MD
A 2
01
6
At risk of impoverishment
Not at risk of impoverishment
Impoverished
Further impoverished
Notes: countries ranked by the incidence of catastrophic health spending from lowest to highest. A household is further impoverished if it is already unable to meet basic needs and incurs out-of-pocket payments.
Source: WHO Regional Office for Europe.
Can people afford to pay for health care in Europe? 34

For example, it may be possible to identify households made up of retired people, people receiving social benefits, single parents, large families or people living in rural areas. This information can be important for understanding who is most likely to be experiencing financial hardship in a given context and how best to ensure that health and social policy responses are effective in reducing financial hardship. It is particularly important in contexts where means testing is a challenge.
Because the potential for disaggregation varies across countries, it is difficult to paint an accurate picture at regional level. However, country examples illustrate how useful such disaggregated information can be.
Pensioners in Estonia, Latvia and Lithuania are by far the single group with the highest incidence of catastrophic health spending, reflecting some of the highest levels of pensioner poverty in the EU, as shown in Fig. 9 (Võrk & Habicht, 2018; Taube et al., 2018; Murauskienė & Thomson, 2018).
Fig. 9. Share of the population at risk of poverty or social exclusion in total and among older people, 2016
Notes: EU28: European Union Member States as of 1 July 2013. In the countries on the left, poverty is lower among older people than the general population; in the countries on the right, poverty is higher among older people.
Source: Eurostat (2019).
All ages
65 years and over
Pop
ula
tio
n (
%)
40
20
30
10
0
ICE
CZ
H
NO
R
FIN
NE
T
DE
N
AU
T
FRA
SVK
SWE
DE
U
LUX
BE
L
PO
L
UN
K
EU
28
IRE
PO
R
HU
N
CY
P
SPA
ITA
GR
E
SRB
RO
M
MK
D
TUR
SWI
SVN
MA
T
EST
CR
O
LVA
LTU
BU
L50
35New numbers for Europe: financial hardship

Although catastrophic health spending is heavily concentrated among older people in Germany and Poland, the incidence of catastrophic spending is much higher among people receiving social benefits than among pensioners in both countries – more than twice as high in Germany (7% vs 3%) and half as high in Poland (18% vs 13%) – reflecting much lower levels of pensioner poverty in these countries than in the Baltic countries (Fig. 9) (Siegel & Busse, 2018; Tambor & Pavlova, in press). In Poland, the rate of extreme poverty is also much higher among people receiving social benefits (28%) than among retirees (6%) or people aged over 65 (4%) (Tambor & Pavlova, in press).
In Croatia, the two groups with the highest incidence of catastrophic health spending are single parents and couples without children (both over 6%) (Vončina & Rubil, 2018). In contrast, couples with children have the lowest incidence (1%).
The incidence of catastrophic spending in Kyrgyzstan is highest among the youngest and the oldest households – those with an average age of under 40 years and over 60 years, respectively (Jakab et al., 2018). The youngest households require policy attention because they account for nearly 90% of all households with catastrophic spending. Younger households generally have a higher number of dependents, and children in Kyrgyzstan are more likely than adults to live in poverty (World Bank, 2007).
In the United Kingdom, younger people and households with children are more likely than older people to experience catastrophic health spending, even though children under 18 years and people aged over 60 years are exempt from most user charges (co-payments) (Cooke O’Dowd et al., 2018). This indicates that even though children are protected against user charges, they may still live in households at high risk of catastrophic health spending.
Across Europe, people in the poorest quintile are consistently most at risk of catastrophic health spending. However, the cross-country differences in the distribution of catastrophic incidence highlighted here demonstrate the importance of identifying people who are particularly vulnerable within broader groups.
Can people afford to pay for health care in Europe? 36

How much financial hardship?
The degree of financial hardship experienced by households can be assessed, to some extent, by understanding how much households with impoverishing or catastrophic health spending are actually spending out of pocket as a share of their budget.
Among households with catastrophic health spending, the average out-of-pocket payment share ranges from around 12% in France and Albania to over 30% in Georgia and the United Kingdom (Fig. 10). It is also relatively high in Kyrgyzstan, Estonia, Germany, Latvia, Austria and Slovenia. There is no relationship between the average out of-pocket share and the overall incidence of catastrophic health spending.
The average out-of-pocket share is consistently much lower in the poorest quintile than among all households with catastrophic spending (Fig. 10). For the poorest quintile, it ranges from under 5% in Ireland and the United Kingdom to over 10% in Hungary, Lithuania, Latvia, Estonia, Greece, Austria, Kyrgyzstan and Georgia. Across all the countries in the study, the average out-of-pocket share rises relatively smoothly with household consumption: it is always higher in the richest quintile than in the poorest quintile.
Ho
use
ho
ld b
ud
get
(%
)
20
15
30
40
35
25
5
10
0
Fig. 10. Average share of the household budget spent out of pocket among all households with catastrophic health spending and households in the poorest consumption quintile, latest year available
Note: countries ranked by the incidence of catastrophic health spending from lowest to highest.
Source: WHO Regional Office for Europe.
All households
Poorest consumption quintile
SVN
20
15
CZ
H 2
01
2
IRE
20
16
UN
K 2
01
4
SWE
20
12
FRA
20
11
DE
U 2
01
3
AU
T 2
01
5
SVK
20
12
CR
O 2
01
4
CY
P 2
01
5
TUR
20
14
EST
20
15
PO
R 2
01
5
PO
L 2
01
4
GR
E 2
01
6
HU
N 2
01
5
ALB
20
15
KG
Z 2
01
4
LVA
20
13
UK
R 2
01
5
GE
O 2
01
5
LTU
20
16
MD
A 2
01
6
37New numbers for Europe: financial hardship

Among the poorest households with catastrophic spending, the average out-of-pocket share tends to be higher in countries where the overall incidence of catastrophic spending is higher, but there are major exceptions. For example, the average out-of-pocket share is much higher than expected in countries like Austria, Estonia, Georgia, Greece and Kyrgyzstan, and much lower than expected in countries like Albania, Ireland, the Republic of Moldova, Ukraine and the United Kingdom. These exceptions could reflect differences in unmet need for health care and differences in protection from user charges (co-payments) for poor people (see the section on the story behind the numbers).
Fig. 11 shows the average amount spent out of pocket, as a share of total household spending, among further impoverished households – those who are already unable to meet basic needs and incur out-of-pocket payments. The average out-of-pocket payment share ranges from under 3% in Czechia, France, Germany, Ireland, Slovakia, Slovenia and the United Kingdom to over 7% in Estonia and Latvia and over 10% in Georgia, Lithuania and Portugal.
The SDG metrics described in the methods section only count households who spend at least 10% (or 25%) of their budget on health as having catastrophic health spending. They would therefore miss many of the households shown in Fig. 11, which is not in keeping with the normative proposition that very poor households should not have to pay for health or the SDG commitment to data and indicators capable of identifying and addressing the groups of people most likely to be left behind (United Nations, 2016b).
Ho
use
ho
ld b
ud
get
(%
) 10
8
12
4
6
2
0
Fig. 11. Average share of the household budget spent out of pocket among further impoverished households, latest year available
Notes: a household is further impoverished if it is already unable to meet basic needs and incurs out-of-pocket payments. Countries ranked by the incidence of catastrophic health spending from lowest to highest.
Source: WHO Regional Office for Europe.
SVN
20
15
CZ
H 2
01
2
IRE
20
16
UN
K 2
01
4
SWE
20
12
FRA
20
11
DE
U 2
01
3
AU
T 2
01
5
SVK
20
12
CR
O 2
01
4
CY
P 2
01
5
TUR
20
14
EST
20
15
PO
R 2
01
5
PO
L 2
01
4
GR
E 2
01
6
HU
N 2
01
5
ALB
20
15
KG
Z 2
01
4
LVA
20
13
UK
R 2
01
5
GE
O 2
01
5
LTU
20
16
MD
A 2
01
6
Can people afford to pay for health care in Europe? 38

Which health services are responsible for financial hardship?
Fig. 12 shows out-of-pocket payments among all households with catastrophic health spending broken down by type of health service. The six types of health service shown reflect the COICOP categories typically used in household budget surveys:
• medicines purchased by individuals or households, with or without a prescription, intended for outpatient use; only a few surveys distinguish between prescribed and non-prescribed (over-the-counter) medicines (COICOP 6.1.1);
• medical products purchased by individuals or households, with or without a prescription, intended for outpatient use; this includes things like corrective lenses, hearing aids, crutches and wheelchairs (COICOP 6.1.2 and 6.1.3);
• outpatient care: services and medicines and medical products supplied directly to outpatients by medical practitioners (COICOP 6.2.1);
• dental care: services and medicines and medical products supplied directly to outpatients by dental practitioners (COICOP 6.2.2);
• diagnostic tests: services and medical products supplied directly to outpatients by paramedical practitioners such as phlebotomists, podiatrists and physiotherapists (sometimes referred to as allied health professionals) (COICOP 6.2.3); and
• inpatient care: hospital day care, home-based hospital treatment and hospices for terminally ill people, including the provision of medicines and medical products; it excludes retirement homes for older people, institutions for disabled people and rehabilitation centres providing long-term support (COICOP 6.3).
Spending on mental health services is not assigned a specific category in COICOP and may therefore be reported under 6.1, 6.2 or 6.3.
39New numbers for Europe: financial hardship

Among all households with catastrophic health spending, out-of-pocket payments are mainly due to medicines, followed by inpatient care and dental care.
There is a clear divide across the countries in the study, however, as shown in Fig. 12.
• Where financial protection is generally weaker (those on the right of Fig. 12), catastrophic spending is mainly due to outpatient medicines, followed by inpatient care, with a much smaller share due to dental care.
• Where financial protection is generally stronger (those on the left of Fig. 12), catastrophic spending is mainly due to dental care, followed by inpatient care and medicines.
Ou
t-o
f-p
okc
et p
aym
ents
(%
)
Fig. 12. Breakdown of out-of-pocket payments by health service among households with catastrophic health spending (all households)
Note: countries ranked by incidence of catastrophic health spending from lowest to highest.
Source: WHO Regional Office for Europe.
Inpatient care
Dental care
Medical products
Medicines
Diagnostic tests
Outpatient care
SVN
20
15
CZ
H 2
01
2
IRE
20
16
UN
K 2
01
4
SWE
20
12
FRA
20
11
DE
U 2
01
3
AU
T 2
01
5
SVK
20
12
CR
O 2
01
4
CY
P 2
01
5
TUR
20
14
EST
20
15
PO
R 2
01
5
PO
L 2
01
4
GR
E 2
01
6
HU
N 2
01
5
ALB
20
15
KG
Z 2
01
4
LVA
20
13
UK
R 2
01
5
GE
O 2
01
5
LTU
20
16
MD
A 2
01
6
100
80
60
0
20
40
Can people afford to pay for health care in Europe? 40
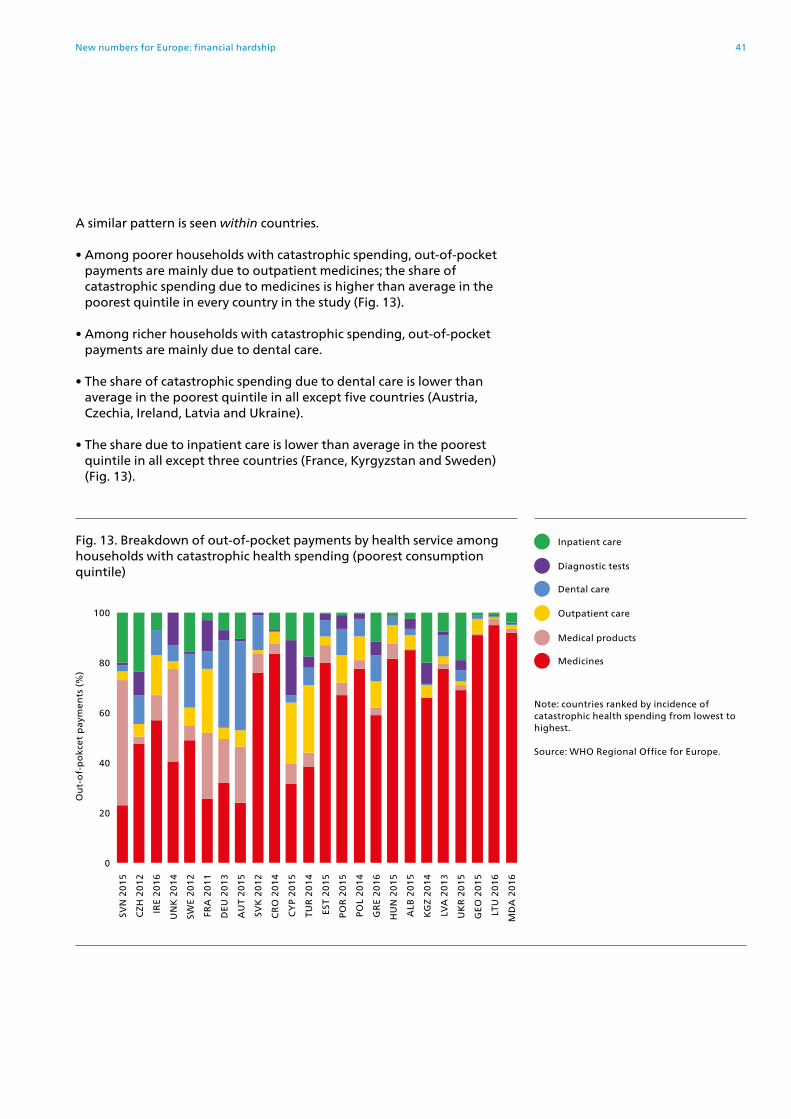
A similar pattern is seen within countries.
• Among poorer households with catastrophic spending, out-of-pocket payments are mainly due to outpatient medicines; the share of catastrophic spending due to medicines is higher than average in the poorest quintile in every country in the study (Fig. 13).
• Among richer households with catastrophic spending, out-of-pocket payments are mainly due to dental care.
• The share of catastrophic spending due to dental care is lower than average in the poorest quintile in all except five countries (Austria, Czechia, Ireland, Latvia and Ukraine).
• The share due to inpatient care is lower than average in the poorest quintile in all except three countries (France, Kyrgyzstan and Sweden) (Fig. 13).
Ou
t-o
f-p
okc
et p
aym
ents
(%
)
Fig. 13. Breakdown of out-of-pocket payments by health service among households with catastrophic health spending (poorest consumption quintile)
Note: countries ranked by incidence of catastrophic health spending from lowest to highest.
Source: WHO Regional Office for Europe.
Inpatient care
Dental care
Medical products
Medicines
Diagnostic tests
Outpatient care
SVN
20
15
CZ
H 2
01
2
IRE
20
16
UN
K 2
01
4
SWE
20
12
FRA
20
11
DE
U 2
01
3
AU
T 2
01
5
SVK
20
12
CR
O 2
01
4
CY
P 2
01
5
TUR
20
14
EST
20
15
PO
R 2
01
5
PO
L 2
01
4
GR
E 2
01
6
HU
N 2
01
5
ALB
20
15
KG
Z 2
01
4
LVA
20
13
UK
R 2
01
5
GE
O 2
01
5
LTU
20
16
MD
A 2
01
6
100
80
60
0
20
40
41New numbers for Europe: financial hardship
Comparing financial hardship and unmet need across countries
Financial protection indicators capture financial hardship arising from the use of health services, but do not indicate whether out-of-pocket payments create a barrier to access, resulting in unmet need. This section identifies variation in access to health services across countries, looking at data on unmet need – defined here as instances in which people need health care but do not receive it because of financial or non-financial access barriers – alongside data on catastrophic health spending.
Two contrasting examples illustrate the potential for misinterpretation of financial indicators if they are not complemented by data on unmet need.
• In some countries, the incidence of financial hardship may be low because many people simply cannot afford to use health services. People may also face non-financial barriers to access.
• A country may extend entitlement to publicly financed health services to people who were previously uncovered, but have high user charges (co-payments) in place. As a result, health services are now more affordable for these people, because at least part of the cost is covered by the government, leading to an increase in use and a reduction in unmet need. However, exposure to user charges means that the increase in use is accompanied by an increase in out-of-pocket payments. In this case, improved access to health care may result in greater financial hardship.
Across the countries in the study, data on unmet need collected in the same way are available from the Eurostat database, for EU countries and Turkey. Relying solely on self-reported data to assess access and unmet need has limitations. It would be useful to analyse data on health service use by socioeconomic status to corroborate and explain data on unmet need, but unfortunately these data are not widely available across countries.
Fig. 14 shows the overall incidence of catastrophic health spending and income inequality in self-reported unmet need for health care (top panel) and dental care (bottom panel) in 19 countries, with countries ranked by catastrophic incidence. It indicates that:
• unmet need and inequalities in unmet need tend to be lower in countries with a lower incidence of catastrophic health spending;
• Greece, Latvia and Turkey have relatively high levels of unmet need and income inequality in unmet need, which suggests that in the absence of access barriers, the incidence of catastrophic spending would be even higher;
• people generally have better – and more equitable – access to health care than dental care; and
• income inequality in unmet need is greater for dental care than for health care in Estonia, France, Hungary, Latvia, Portugal and Sweden.
Can people afford to pay for health care in Europe? 42

Dental care
Pop
ula
tio
n (
%)
Pop
ula
tio
n (
%)
Fig. 14. Overall incidence of catastrophic health spending and unmet need for health and dental care due to cost, distance or waiting time
Health care
Notes: population refers to people aged 16 years and over. Quintiles are based on income. Data on catastrophic incidence and unmet need are for the same year.
Source: EU-SILC data from Eurostat (2018a).
Poorest quintile
Richest quintile
Average
Catastrophic incidence
SVN
20
15
CZ
H 2
01
2
IRE
20
16
UN
K 2
01
4
SWE
20
12
FRA
20
11
DE
U 2
01
3
AU
T 2
01
5
SVK
20
12
CR
O 2
01
4
CY
P 2
01
5
TUR
20
14
EST
20
15
PO
R 2
01
5
PO
L 2
01
4
GR
E 2
01
6
HU
N 2
01
5
LVA
20
13
LTU
20
16
35
40
40
35
20
20
25
25
30
30
15
15
0
0
5
5
10
10
SVN
20
15
CZ
H 2
01
2
IRE
20
16
UN
K 2
01
4
SWE
20
12
FRA
20
11
DE
U 2
01
3
AU
T 2
01
5
SVK
20
12
CR
O 2
01
4
CY
P 2
01
5
TUR
20
14
EST
20
15
PO
R 2
01
5
PO
L 2
01
4
GR
E 2
01
6
HU
N 2
01
5
LVA
20
13
LTU
20
16
43New numbers for Europe: unmet need

Data on unmet need help to explain the differences in sources of financial hardship shown in the previous section. The earlier figures indicate that dental care is a greater source of financial hardship than outpatient medicines in countries where financial protection is relatively strong (Fig. 12), and does not seem to be a major source of financial hardship for the poorest households in most countries (Fig. 13).
Fig. 14 suggests that this is because poorer households are more likely to experience unmet need for dental care than richer households, and therefore less likely to use dental care, and because income inequality in unmet need for dental care is particularly high in countries where financial protection is relatively weak.
There are several possible reasons why catastrophic health spending is mainly due to outpatient medicines among poorer households and mainly due to dental care among richer households.
First, in countries where older people are on average poorer than younger people, the rate of chronic illness requiring ongoing treatment with medicines may be particularly high in the poorest quintile. In the Baltic countries, for example, catastrophic health spending is dominated by outpatient medicines (Fig. 12); it is heavily concentrated among older people and poverty rates among older people are very high (Fig. 9).
Second, most countries in Europe make people pay out of pocket for outpatient medicines and dental care, even when other types of health service are free at the point of use. As a result, medicines and dental care are often the only health services people are required to pay for (MISSOC, 2019). In the face of financial barriers to access, poor people may forego the use of health services they do not consider to be essential, such as dental care, and prioritize the use of outpatient medicines.
Data from Lithuania illustrate this behavioural pattern at country level. Fig. 15 shows that poorer households with catastrophic health spending are spending almost exclusively on outpatient medicines, while the richest households spend a roughly equal share on outpatient medicines and dental care. However, 8% of the poorest households report unmet need for dental care, compared to only 1% of the richest households.
Can people afford to pay for health care in Europe? 44

In some countries, self-treatment through medicines purchased over the counter may be a response to financial barriers to accessing prescribed medicines. Again, the Baltic countries provide a useful illustration. The self-reported use of prescribed medicines is among the lowest in the EU in these three countries, while the self-reported use of over-the-counter medicines is among the highest (Fig. 16).
Households that prioritise out-of-pocket spending on outpatient medicines can still experience unmet need for outpatient medicines. Fig. 17 shows that unmet need for prescribed medicines is generally higher in countries with a higher incidence of catastrophic health spending, with some notable exceptions.
The data in Fig. 17 have a different source and denominator from the data in Fig. 14. They show a greater degree of inequality in unmet need by socioeconomic status (educational attainment) than age.
Fig. 15. Breakdown of out-of-pocket payments by health service among households with catastrophic health spending by consumption quintile and unmet need for dental care by income quintile in Lithuania
Ou
t-o
f-p
ock
et p
aym
ents
(%
)
100
80
60
0
20
40 Pop
ula
tio
n (
%)
10
8
6
0
2
4
Medical products
Dental care
Unmet need for dental care
Outpatient care
Medicines
Diagnostic tests
Inpatient care
Notes: data are for 2012. Population refers to people aged 16 years and over.
Sources: Murauskienė & Thomson (2018); EU-SILC data from Eurostat (2018a).
Average Poorest 2nd 3rd 4th Richest
45New numbers for Europe: unmet need

RO
M
CY
P
ITA
BU
L
LTU
LVA
EST IR
E
SVK
NE
T
SVN
DE
N
MA
T
SWE
GR
E
CR
O
PO
L
EU
28
AU
T
HU
N
FRA
UN
K
SPA
DE
U
FIN
CZ
H
LUX
PO
R
BE
L
50
Fig. 16. Self-reported use of medicines in EU countries, 2014 Notes: share of the population who used medicines prescribed by a doctor, or medicines, herbal medicines or vitamins not prescribed by a doctor, in the past two weeks. No data for France.
Source: EHIS data from Eurostat (2018b).
Pop
ula
tio
n (
%)
Pop
ula
tio
n (
%)
30
30
20
20
60
60
80
80
70
70
40
40
50
10
10
0
0
Prescribed medicines
Non-prescribed medicines
RO
M
BE
L
ITA
CY
P
SPA
PO
R
FRA
GR
E
CR
O
IRE
SVN
MA
T
AU
T
EU
28
LUX
BU
L
NE
T
SWE
DE
U
UN
K
SVK
CZ
H
EST
HU
N
PO
L
LVA
DE
N
LTU
FIN
Can people afford to pay for health care in Europe? 46

Fig. 17. Overall incidence of catastrophic health spending and unmet need for prescribed medicines due to cost by educational attainment and age
Notes: people refer to those aged 15 years and over. Least educated: lower secondary or below. Most educated: tertiary. Data on unmet need for 2014. Data on catastrophic incidence for the latest year available.
Source: EHIS data from Eurostat (2018b).
Least educated
Most educated
Average
Catastrophic incidence
SVN
CZ
H
IRE
UN
K
SWE
DE
U
AU
T
SVK
CR
O
CY
P
TUR
EST
PO
R
PO
L
GR
E
HU
N
LVA
LTU
Peo
ple
nee
din
g c
are
(%
)Pe
op
le n
eed
ing
ca
re (
%)
35
20
20
30
35
25
25
30
15
15
0
0
5
5
10
10
Education
Age
SVN
CZ
H
IRE
UN
K
SWE
DE
U
AU
T
SVK
CR
O
CY
P
TUR
EST
PO
R
PO
L
GR
E
HU
N
LVA
LTU
47New numbers for Europe: unmet need

Bringing together for the first time data on financial hardship and unmet need across 19 countries in Europe reveals the following findings.
• Unmet need tends to be low – and without significant income inequality – in countries where the overall incidence of catastrophic health spending is very low, suggesting that health services are affordable for most people in these countries. However, there is a concentration of financial hardship among poor households, which requires policy attention.
• In some countries, the incidence of catastrophic health spending is relatively low, but there is a high level of unmet need, particularly among poor households – for example, in Turkey. This suggests that health care is not as affordable as the financial protection indicators alone imply. Access barriers require policy attention and efforts to improve access should prioritise poorer households.
• In many countries, the incidence of catastrophic health spending and levels of unmet need are both relatively high – for example, in Estonia, Greece, Latvia and Poland for health and dental care, and in Portugal for dental care. With the exception of Poland, income inequality in unmet need is also significant. These results indicate that health services are not at all affordable, and that if everyone were able to use the services they needed, the incidence of catastrophic health spending would be even higher, particularly among poorer households.
• Some health services – notably dental care – are a much greater source of financial hardship for richer households than poorer households. This reflects higher levels of unmet need for dental care among poorer households than richer households in most countries.
• Outpatient medicines are an important source of financial hardship in many countries and among the poorest quintile in most countries. Unmet need for prescribed medicines is also generally higher in countries with a higher incidence of catastrophic health spending.
Can people afford to pay for health care in Europe? 48

The story behind the numbers

Factors that influence financial protection
This part of the report links the incidence of catastrophic health spending and unmet need in the study countries to coverage policy and patterns of spending on health. It finds that health systems with strong financial protection and low levels of unmet need share the following features:
• there are no large gaps in coverage;
• coverage policy is carefully designed to minimize access barriers and out-of-pocket payments, particularly for poor people and regular users of health services;
• public spending on health is high enough to ensure relatively timely access to a broad range of health services without informal payments; and as a result
• out-of-pocket payments are low, accounting for less than or close to 15% of current spending on health.
The first step to strengthening financial protection is to identify gaps in coverage. This requires analysis of data on unmet need and financial hardship alongside the details of coverage policy in a given context.
Once gaps have been identified, the next step is to find ways of addressing them through a careful redesign of coverage policy. The design of user charges (co-payments) plays an important role because it allows the health system explicitly to target the people most in need of financial protection.
To be effective, changes to coverage policy should be supported by an adequate level of public spending on health. They may also need to be accompanied by other policy instruments.
Can people afford to pay for health care in Europe? 50

Linking financial hardship and unmet need to spending on health
This section links financial hardship and unmet need to data on health spending from national health accounts.
Fig. 18. Incidence of catastrophic health spending and out-of-pocket payments as a share of current spending on health, latest year available
Notes: R2: coefficient of determination. Data on out-of-pocket payments are for the same year as data on catastrophic incidence. The association between catastrophic incidence and the out-of-pocket payment share excluding out-of-pocket payments for long-term care is almost identical (R2 = 0.70).
Sources: WHO Regional Office for Europe; WHO (2019a).
Slovenia (2015)
Germany (2013)
Croatia (2014)
Portugal (2015)
Greece (2016)
Republic of Moldova (2016)
Slovakia (2012)
Sweden (2012)
United Kingdom (2014)
Czechia (2012)
Austria (2015)
Turkey (2014)
Estonia (2015)
Poland (2014)
Hungary (2015)
Latvia (2013)
Cyprus (2015)
Lithuania (2016)
Ukraine (2015)
Ca
tast
roh
pic
inci
den
ce (
%)
Out-of-pocket payments as a share of current spending on health (%)
0
0 15 30 45 60
4
6
8
10
12
14
16
18
2
R² = 0.71Ireland (2016)
France (2011)
Kyrgyzstan (2014)
Georgia (2015)
Albania (2015)
51The story behind the numbers: spending on health

Fig. 18 shows a strong relationship between the incidence of catastrophic health spending and the out-of-pocket payment share of current spending on health: catastrophic incidence rises as the out-of-pocket payment share rises. It suggests that the out-of-pocket payment share of current spending on health is a good proxy indicator for financial protection and can be used as a broad guideline when data on financial protection are lacking.
The incidence of catastrophic health spending is generally very low in countries where the out-of-pocket share of total spending on health is less than or close to 15%. Fig. 19 shows that in 2016, the out-of-pocket payment share was over 15% in 39 out of 52 countries in the WHO European Region (including in 17 EU countries). Many countries in Europe will need to reduce the out-of-pocket payment share of current spending on health in order to improve financial protection.
Can people afford to pay for health care in Europe? 52

Fig. 19. Out-of-pocket payments as a share of current spending on health, WHO European Region, 2016
MONFRALUXNETSVNDEUIREDENNORCZHUNKSWECROBELTURICESVKSMRAUTFINROMESTPOLISRITASPAPORBIHSWIHUNLTUGREMATMKDKAZBLRRUSSRBANDLVACYPMDABULUZBUKRGEOKGZALBTJKTKMAZEARM
710
111212
1314
15151515
1515161617
181919
20
2123232323
2428
293030
323435353636
4041
424545
4648
52
54
565858
66
7679
81
Out-of-pocket payments as a share of current spending on health (%)
Notes: the green and red coloured bars represent the countries in the study. Green: countries where out-of-pocket payments account for 15% or less of total spending on health. Red: countries where out-of-pocket payments are above 15%. The figure excludes Montenegro.
Source: WHO (2019a).
53The story behind the numbers: spending on health

Out-of-pocket payments can be reduced by increasing public spending on health. Fig. 20 indicates a strong relationship between the out-of-pocket payment share of current spending on health and public spending on health as a share of gross domestic product (GDP) across the European Region.
Fig. 20. Relationship between public spending on health as a share of GDP and out-of-pocket payments, WHO European Region, 2016
Notes: R2: coefficient of determination. Public: compulsory health financing schemes. Public spending on health as a share of GDP is a product of the size of the government budget relative to GDP and the priority given to the health sector when allocating the government budget. The figure excludes Monaco and Montenegro.
Source: WHO (2019a).
ARMAZE
TKM
TJK
KGZ
ALB
GEOUKR
SPA
ICEUNK
CYP
RUS
BLR
MKDLTU
HUNESTPOL
ROM
TURSMR
CRO
LUXIRE SVN
LVA
KAZ
UZB BUL
MDA
AND
SRB
GREMAT
POR BIH
CZH
SVK
4 8 10
Ou
t-o
f-p
ock
et p
aym
ents
(%
)
0 2 6 12
40
60
80
100
20
0
R² = 0.63
SWI
ITALFIN AUT
BEL
NETDEN
NOR SWE
DEU
FRA
Public spending on health as a share of GDP (%)
Can people afford to pay for health care in Europe? 54

Some countries expect VHI to protect people against out-of-pocket payments. Across countries, however, there is no relationship between spending on VHI and the out-of-pocket share of current spending on health, either in the European Region, as shown in Fig. 21, or globally (Wagstaff et al., 2017). This indicates that VHI is not an effective mechanism for lowering out-of-pocket payments at health system level, in contrast to increasing public investment in health, as shown in Fig. 20.
Fig. 21. Relationship between VHI and out-of-pocket payments, WHO European Region, 2016
Notes: R2: coefficient of determination. The figure excludes Monaco and Montenegro.
Source: WHO (2019a).
ARM
AZETKM
MDA
GEO
AND
AND
ALBKGZ
UKRUZB
UZB
LVA
SRB KAZ
MAT
SVI
FRANET
CRO
LUX
AUT
BEL
POL
POR
SPA
KAZ
BKRMKD
HUN
ITABIH
LTU
MAT
FIN
UNKDENDEU
SMR
SWE
ROMEST
SVKICE
NORTUR SVNIRE
ISR
CYP
4 8 10 14
Ou
t-o
f-p
ock
et p
aym
ents
(%
)
VHI (%)
0
0 2 6 12 16
40
60
80
100
20
R² = 0.08
55The story behind the numbers: spending on health

A breakdown of current spending on health by type of health service and financing scheme shows that on average the three types of care most heavily financed through out-of-pocket payments are dental care, outpatient medicines and medical products (items like corrective lenses, hearing aids, crutches and wheelchairs) (Fig. 22). These are also the types of care most likely to cause financial hardship across countries (see Fig. 12 and Fig. 13, which are based on the analysis of household budget survey data).
National health accounts, like household budget surveys, use categories that do not allow the identification of patterns of spending on mental health services. Mental health services may not be adequately covered in many countries.
Fig. 23 shows current spending on outpatient medicines broken down by financing scheme for the countries in the study for which data are available, alongside data on the overall incidence of catastrophic health spending and self-reported unmet need for prescribed medicines due to cost. With the exception of Sweden, the overall incidence of catastrophic health spending rises as the out-of-pocket payment share of spending on outpatient medicines increases, and the association between the two is strong (R2 = 0.67).
Cu
rren
t sp
end
ing
on
hea
lth
(%
)
Fig. 22. Breakdown of current spending on health by health service and financing scheme, EU28, 2016
OOPs
Public
VHI
100
80
60
0
20
40
Inpatient care
Diagnostic tests
Outpatient care
Medical products
Outpatientmedicines
Dental care
Notes: OOPs: out-of-pocket payments. Public: all compulsory financing schemes. Data not available for all countries in the WHO European Region.
Sources: Eurostat (2019) and OECD (2019b).
Can people afford to pay for health care in Europe? 56

Fig. 24 shows current spending on dental care broken down by financing scheme for the countries in the study for which such data are available, alongside data on the overall incidence of catastrophic health spending and self-reported unmet need for dental care. The overall incidence of catastrophic health spending rises as the out-of-pocket payment share of spending on dental care increases, and the association between the two is strong (R2 = 0.66).
Fig. 23. Spending on outpatient medicines by financing scheme (2016), unmet need for prescribed medicines (2014) and catastrophic incidence (latest available year)
Spen
din
g o
n o
utp
ati
ent
med
icin
es (
%)
100
80
60
0
20
40
DE
U
FRA
SVN
IRE
SVK
UN
K
AU
T
CZ
E
PO
R
EST
HU
N
SWE
GR
E
LVA
PO
L
LTU
Notes: OOPs: out-of-pocket payments. Public: all compulsory financing schemes. Spending data are not available for all of the countries in the study. Countries ranked from highest to lowest by compulsory financing scheme share of current spending. Unmet need is for prescribed medicines due to cost among people aged 15 years and over and reporting a need for care (EHIS); no data available for France.
Sources: WHO Regional Office for Europe; EHIS data from Eurostat (2018b); OECD (2019b).
25
20
15
0
5
10
Ho
use
ho
lds
or
peo
ple
nee
din
g c
are
(%
)
OOPs
Public
VHI
Catastrophic incidence
Unmet need for prescribed medicines
Fig. 24. Spending on dental care by financing scheme (2016), unmet need for dental care and catastrophic incidence (latest available year)
Spen
din
g o
n d
enta
l ca
re (
%)
100
80
60
0
20
40
SVN
DE
U
SVK
AU
T
CZ
E
SWE
PO
L
EST
HU
N
LTU
LVA
GR
E
25
20
15
0
5
10
Ho
use
ho
lds
or
po
pu
lati
on
(%
)
OOPs
Public
VHI
Catastrophic incidence
Unmet need for dental care
Notes: OOPs: out-of-pocket payments. Public: all compulsory financing schemes. Countries ranked by compulsory financing scheme share of current spending from highest to lowest. Spending data are not available for all of the countries in the study. Unmet need is for dental care due to cost, distance and waiting time among people aged 16 years and over (EU-SILC).
Sources: WHO Regional Office for Europe; EU-SILC data from Eurostat (2018a); OECD (2019b).
57The story behind the numbers: spending on health

Linking financial hardship and unmet need to data on health spending from national health accounts reveals that across countries a higher share of out-of-pocket payments in current spending on health is strongly associated with a higher overall incidence of catastrophic health spending. This association is also strong when linking the overall incidence of catastrophic health spending to the out-of-pocket payment share of current spending on outpatient medicines and dental care – the two types of health service most likely to be heavily financed through out-of-pocket payments.
Data from national health accounts indicate that public spending on health is much more likely to reduce out-of-pocket payments than VHI. Public spending on health as a share of GDP is relatively strongly associated with a lower out-of-pocket payment share of current spending on health. In contrast, there is no relationship between VHI and out-of-pocket payments across countries, even though VHI plays a significant role in reducing out-of-pocket payments in a few countries (see the section on the role of VHI).
However, data on health spending are not able to explain fully differences in out-of-pocket payments and catastrophic incidence across countries. There are large differences in the out-of-pocket payment share of current spending on health among countries that spend the same share of GDP on health publicly. There are also large differences in catastrophic incidence in countries that have the same out-of-pocket payment share.
Fig. 25 shows that the out-of-pocket payment share of current spending on health is 23% in Poland and Slovakia, but catastrophic incidence ranges from 3.5% in Slovakia to 8.6% in Poland. The variation cannot be explained by differences in GDP, poverty or patterns of health spending (see the section on user charges).
These findings reveal that changes in health spending alone – whether increases in public spending or reductions in out-of-pocket payments – are unlikely to be sufficient to improve financial protection in all contexts. Coverage policy plays a key role in determining financial hardship, not just patterns of spending on health. The next sections link financial hardship and unmet need to coverage policy.
Can people afford to pay for health care in Europe? 58
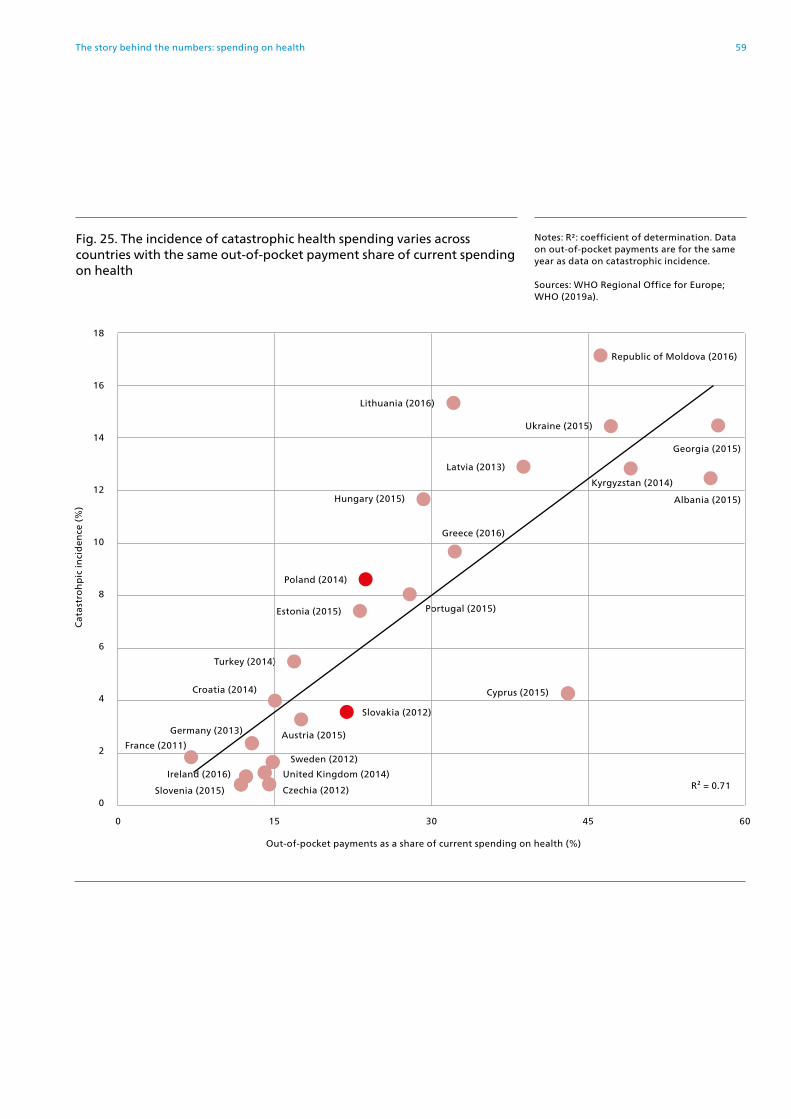
Fig. 25. The incidence of catastrophic health spending varies across countries with the same out-of-pocket payment share of current spending on health
Notes: R2: coefficient of determination. Data on out-of-pocket payments are for the same year as data on catastrophic incidence.
Sources: WHO Regional Office for Europe; WHO (2019a).
Slovenia (2015)
Germany (2013)
Croatia (2014)
Portugal (2015)
Greece (2016)
Republic of Moldova (2016)
Slovakia (2012)
Sweden (2012)
United Kingdom (2014)
Czechia (2012)
Austria (2015)
Turkey (2014)
Estonia (2015)
Poland (2014)
Hungary (2015)
Latvia (2013)
Kyrgyzstan (2014)
Georgia (2015)
Albania (2015)
Cyprus (2015)
Lithuania (2016)
Ca
tast
roh
pic
inci
den
ce (
%)
Out-of-pocket payments as a share of current spending on health (%)
0
0 15 30 45 60
4
6
8
10
12
14
16
18
2
R² = 0.71Ireland (2016)
France (2011)
Ukraine (2015)
59The story behind the numbers: spending on health

Key messages on health spending
• There is a strong association between the incidence of catastrophic health spending and the out-of-pocket payment share of current spending on health, suggesting that the out-of-pocket payment share can be used as a proxy indicator for financial protection when data on financial protection are lacking.
• Across countries, public spending on health is shown to be much more effective in reducing out-of-pocket payments than VHI.
• Increases in public spending on health or reductions in out-of-pocket payments are not enough to improve financial protection in all contexts; coverage policies play a key role in determining financial hardship, not just patterns of spending on health.
Can people afford to pay for health care in Europe? 60
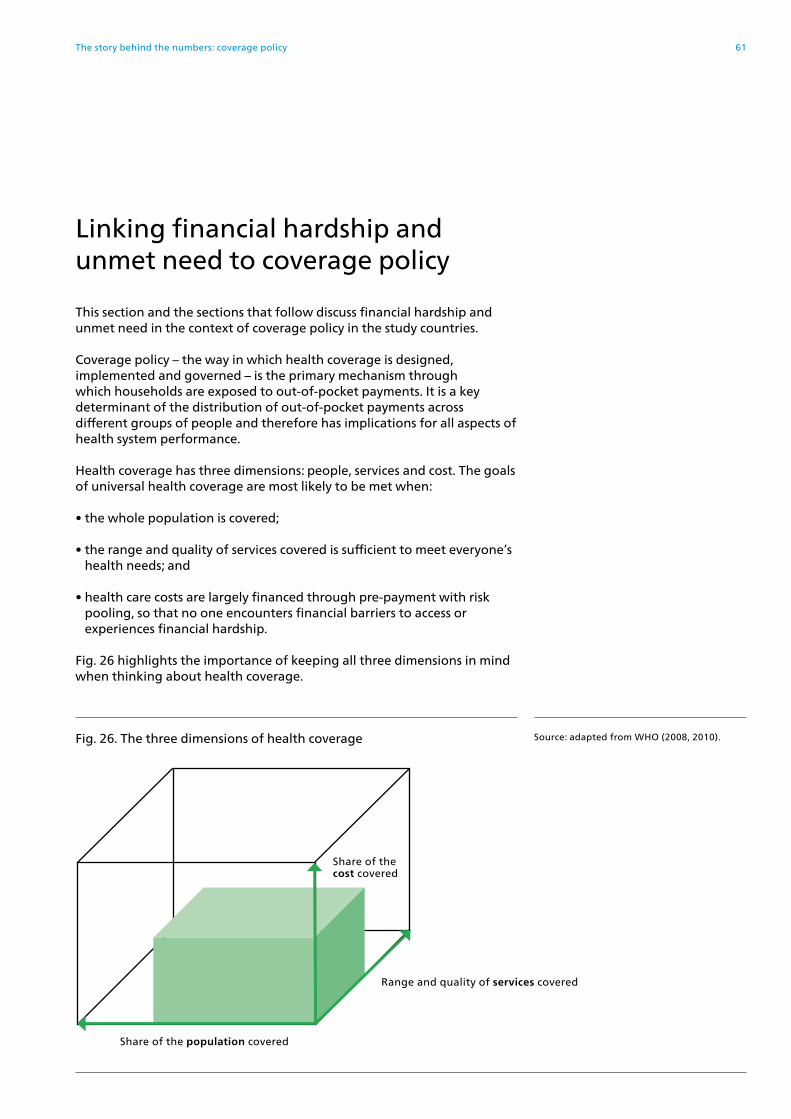
Linking financial hardship and unmet need to coverage policy
This section and the sections that follow discuss financial hardship and unmet need in the context of coverage policy in the study countries.
Coverage policy – the way in which health coverage is designed, implemented and governed – is the primary mechanism through which households are exposed to out-of-pocket payments. It is a key determinant of the distribution of out-of-pocket payments across different groups of people and therefore has implications for all aspects of health system performance.
Health coverage has three dimensions: people, services and cost. The goals of universal health coverage are most likely to be met when:
• the whole population is covered;
• the range and quality of services covered is sufficient to meet everyone’s health needs; and
• health care costs are largely financed through pre-payment with risk pooling, so that no one encounters financial barriers to access or experiences financial hardship.
Fig. 26 highlights the importance of keeping all three dimensions in mind when thinking about health coverage.
Fig. 26. The three dimensions of health coverage Source: adapted from WHO (2008, 2010).
Share of the cost covered
Range and quality of services covered
Share of the population covered
61The story behind the numbers: coverage policy

People are exposed to out-of-pocket payments and unmet need when there are gaps in coverage. Gaps in the cost dimension of coverage occur in the following ways, as illustrated in Fig. 27.
• People are not covered. Gaps in population coverage are determined by the basis for entitlement, which may be broad enough to encompass everyone in a country or be more narrowly specified to exclude some groups of people using criteria such as residence, citizenship, employment, age, income, health or payment of contributions. Excluded groups of people will need to buy VHI or pay out of pocket for health care.
• The range of services that is publicly financed – the benefits package – is narrow, or there are issues relating to the availability, quality and timeliness of these services. People will need to buy VHI or pay out of pocket for non-covered services or to access services that are privately provided.
• There are user charges (co-payments) in place for services in the benefits package. People will need to buy VHI to cover co-payments or pay out of pocket when using covered services. VHI may also involve co-payments.
Fig. 27. Gaps in coverage lead to out-of-pocket payments and unmet need Source: adapted from WHO (2008, 2010).
Out-of-pocket paymentsand unmet need
There are user charges for covered services
The benefits package is narrow and there are issues with service availability, quality and timeliness
People are not covered
Can people afford to pay for health care in Europe? 62

All health systems face budget constraints to a greater or lesser degree, making rationing a necessity. Rationing inevitably places limits on coverage, but its effects on access and financial protection will depend to a great extent on how it is carried out.
Rationing is more likely to have negative consequences for health system performance if it is implicit rather than explicit – for example, when people are promised benefits that are not supported by public funding (Fig. 28). These so-called unfunded mandates often give rise to informal payments (see the section on the benefits package).
Each area of coverage policy – population entitlement, the benefits package and user charges (co-payments) – offers opportunities for explicit rationing, with differing implications for the goals of universal health coverage and for intermediate goals such as equity, efficiency, transparency and accountability (see Fig. 1).
Explicit rationing can also have negative consequences, but it is usually easier to monitor and address any adverse effects, or to avoid them in the first place through careful policy design supported by the allocation of a level of public funding that is sufficient to meet stated policy goals.
Fig. 28. Explicit versus implicit rationing in response to a budget constraint Source: adapted from Kutzin & Evetovits (2007).
Budget constraint
Explicit rationing
PriceUser charges
Excluding servicesExcluding people
Unmet needFinancial hardship
Non-priceLong waiting times
Unmet needDissatisfaction
PriceInformal payments
Unmet needFinancial hardship
Lack of transparency
Non-priceService delay
Service dilutionService denial
Unmet needDissatisfaction
Lack of transparency
Implicit rationing
63The story behind the numbers: coverage policy

The following sections identify gaps in coverage in the study countries by analysing data on unmet need and financial hardship in the context of the three areas of coverage policy, with some caveats. It is not always easy to disentangle the three policy areas or to understand which ones are responsible for financial hardship at country or regional level. This challenge is compounded where coverage policies are complex, varying across people and services. It is particularly difficult to separate the effects of gaps in the benefits package from gaps caused by user charges.
A further section looks at the role of VHI in addressing gaps in coverage. A final section summarizes gaps in coverage in European health systems.
Can people afford to pay for health care in Europe? 64

Population entitlement
Population entitlement to publicly financed health care is a prerequisite for financial protection, but not a guarantee of it. Fig. 29 ranks countries by share of the population covered (the columns) and also shows the incidence of catastrophic health spending (the dots). The darker columns show countries in which the whole population is covered; the lighter columns show countries in which gaps exist in population coverage.
Linking financial hardship to population entitlement reveals the following findings.
First, the incidence of catastrophic health spending ranges from 1% to 14% across countries that cover the whole population. This wide range in incidence clearly demonstrates that the share of the population entitled to publicly financed health services should not be used as an indicator of financial protection. Global analysis leads to the same conclusion (Wagstaff et al., 2017).
Second, the incidence of catastrophic health spending ranges widely across countries that do not cover the whole population. This suggests that gaps in population coverage are not the main source of financial hardship in most European health systems. This may be because:
Fig. 29. Share of the population entitled to publicly financed health services and share of households with catastrophic health spending
Population coverage
Catastrophic incidence
Note: OECD data on coverage are used for all countries except Albania, Croatia, Cyprus, Georgia, Kyrgyzstan, Latvia, Republic of Moldova and Ukraine.
Sources: WHO Regional Office for Europe; OECD (2019b).
0
50
75
100
25
0
10
15
20
5
Pop
ula
tio
n (
%)
Ho
use
ho
lds
(%)
SVN
20
15
CZ
H 2
01
2
IRE
20
16
UN
K 2
01
4
SWE
20
12
FRA
20
11
DE
U 2
01
3
AU
T 2
01
5
CR
O 2
01
4
CY
P 2
01
5
PO
R 2
01
5
GR
E 2
01
6
KG
Z 2
01
4
LVA
20
13
UK
R 2
01
5
TUR
20
14
SVK
20
12
HU
N 2
01
5
GE
O 2
01
5
EST
20
15
LTU
20
16
PO
L 2
01
4
MD
A 2
01
6
ALB
20
15
65The story behind the numbers: population entitlement

• the share of the population that lacks coverage is usually relatively small; it is under 10% in the countries in the study, with the exception of Albania, Georgia before 2013, Greece between 2011 and 2016, the Republic of Moldova and Albania;
• most countries offer people constitutional rights to some form of care – typically emergency services and services for communicable diseases – regardless of formal coverage status;
• those who lack coverage are often of working age and may on average have less need for health care than older people; in Estonia, for example, those most likely to be uninsured are inactive young men and long-term unemployed people (Võrk & Habicht, 2018); and
• if people lacking coverage need health care, they may forego it or rely on the use of emergency services, which are often free at the point of use.
As a result, lack of population coverage in European health systems may be more likely to result in unmet need and inequality and inefficiency in service use than financial hardship.
Third, gaps in population coverage occur mainly in countries that base entitlement to publicly financed health services on employment status or payment of contributions and lack effective mechanisms to enforce the collection of contributions from those required to pay them, including Albania, Estonia, Hungary, Lithuania, Poland and the Republic of Moldova.
Basing entitlement on employment or payment of contributions is a form of rationing that systematically disadvantages relatively vulnerable groups of people as well as those who have the means to contribute, but decide to avoid payment (even when payment is mandatory). It will always result in some people being excluded from coverage unless measures to enforce collection or ensure universal access to health services are highly effective, and it tends to have a disproportionately negative effect on people in the informal economy and those in precarious employment. Precarious employment is a growing problem in Europe (Benach et al., 2013; Olsthoorn, 2014; European Parliament, 2016). Full-time permanent contracts accounted for 62% of employment in 2003, but had fallen to 59% by 2016 (European Parliament, 2016). The magnitude of this problem is likely to increase in the future, particularly as a result of demographic change.
Countries may regard basing entitlement on payment of contributions as a way of encouraging employers and employees in the informal sector to pay taxes. However, there is no evidence that this enhances tax compliance or reduces informality. In fact, the evidence seems to point in the opposite direction; it suggests that basing entitlement on payment of contributions encourages informality, especially among people who do not value being covered (Pagés et al., 2013).
Some of the countries that base entitlement on employment or payment of contributions have introduced a range of strategies to ensure that coverage is close to universal – for example, exempting pensioners from having to contribute. Others, like France, have found it more effective to change the basis for entitlement from employment to residence (see Box 1).
Can people afford to pay for health care in Europe? 66
Box 1. How France broke the link between employment and entitlement to health insurance by changing the basis for entitlement to residence
In 2000, France’s social insurance system changed the basis for entitlement to publicly financed health insurance from employment and payment of contributions to residence, under a new system known as Couverture Universelle Maladie (CMU).
The reform was driven by concerns about the growing number of young people who were not entitled to health insurance due to rising unemployment and other factors.
A decade earlier, the social insurance system began to broaden its funding base in response to fears – subsequently justified – that social security financed exclusively through employment would not be sustainable in the future.
In 1991, the government introduced a new tax on income – the contribution sociale generalisée (CSG) – to finance family allowances. The CSG was extended to old age pensions in 1993, sickness benefits in 1997 and health insurance in 1998. It is levied on all sources of income, including income from wages, benefits, investments, property and gambling, with lower rates for income from benefits and higher rates for income from property and gambling.
The CSG has largely replaced employee contributions for health insurance, which fell from 32% of the health insurance scheme’s revenue in 1999 to 3% in 2000. Close to 40% of the health insurance scheme’s revenue now comes from this income tax.
Revenues from the CSG, from employer and employee contributions and from other taxes are all pooled by the health insurance scheme and used to purchase a single benefits package for anyone resident in France for more than three months.
In 2016, CMU was replaced by Protection Universelle Maladie (PUMA), which grants all residents an individual, automatic and continuous right to health care, without the need for administrative formalities when a person’s circumstances change.
Sources: Chevreul et al. (2015) and Karine Chevreul, URC Eco (Paris Health Services and Health Economics Research Unit), personal communication, October 2018.
67The story behind the numbers: population entitlement
Two examples of large gaps in population coverage in Europe illustrate the major risks inherent in using population entitlement as a means of rationing. These examples also shed light on the relationship between financial hardship and unmet need.
The experience of Greece shows that basing population entitlement on employment and payment of contributions can significantly increase financial hardship and unmet need in the context of an economic shock.
Greek residents who are unemployed for more than two years and self-employed people who do not pay their contributions lose their entitlement to health care financed through the social insurance system known as EOPYY. EOPYY is jointly financed through contributions and direct allocations from the state budget.
The basis for entitlement was not unduly problematic under normal circumstances, but became a major issue during the crisis: unemployment more than tripled, rising from 7.8% in 2008 to 27.5% in 2013; long-term unemployment grew, as a share of total unemployment, from 44.6% in 2010 to 73.5% in 2014 (Eurostat, 2019); and many self-employed people found it hard to keep up with payment of contributions (Economou et al., 2017).
Before 2011, the social insurance system had covered more or less the whole population. By the beginning of 2016, however, it was estimated that 25% of the population was uninsured – that is, not entitled to use EOPYY-financed health services (Economou, 2015; Economou et al., 2017).
Measures introduced in 2013 and 2014 attempted to address this gap in population coverage, but the gap was not successfully filled until 2016, when a new law was introduced to ensure access to publicly financed health services for all residents not covered by EOPYY; self-employed people who have not been able to pay contributions; and other vulnerable groups of people, including refugees, children, pregnant women and those with chronic conditions or disabilities.
Although the 2016 law was an important step forward, improving access for a significant share of the population, it has not addressed all inequalities in access. People covered under the new law do not enjoy the same entitlements as those covered by EOPYY: they are entitled to treatment in public facilities only, whereas people covered by EOPYY can use contracted private providers, including private diagnostic centres, in addition to public facilities. Consequently, people reliant on public facilities continue to face financial and non-financial barriers to access due to long waiting times and lack of staff, diagnostic equipment and supplies in public facilities (Economou et al., 2017).
The huge increase in the number of people lacking coverage coincided with a sharp drop in the share of households with out-of-pocket payments, which fell from 93% in 2009 to a low of 82% in 2012, rising slightly to 84% by 2015 (Chletsos et al., in press). The average amount spent out of pocket fell from €611 in 2009 to €477 in 2012, rising slightly to €506 by 2015 and falling again in 2016. The fall was concentrated in the poorer quintiles.
Can people afford to pay for health care in Europe? 68

Fig. 30 shows that the reduction in out-of-pocket payments was accompanied by a sharp and sustained rise in unmet need for health care (the yellow dots) and dental care (the blue dots). The incidence of catastrophic health spending (the columns) fell in 2010, but was still high compared to many other EU countries. It increased steadily between 2010 and 2015. The increase in catastrophic spending was concentrated among the second, third, fourth and richest quintiles, while the increase in unmet need for health and dental care was concentrated among the poorest quintile (data not shown). For the poorest quintile, unmet need for health and dental care nearly doubled between 2009 and 2015, rising from around 10% to around 20% (Eurostat, 2018a).
As the crisis progressed, the composition of out-of-pocket payments shifted away from dental care, outpatient care and diagnostic tests towards outpatient medicines and inpatient care (Fig. 31), with the richest quintile allocating much more of its spending to inpatient care and the poorer quintiles allocating much more of their spending to outpatient medicines (data not shown).
In spite of the positive outcomes of the 2016 law, the law has not addressed the root cause of the gap in population coverage – basing entitlement on employment and payment of contributions rather than on residence. As a result, inequalities in financial hardship and unmet need are likely to persist, especially since those covered by the law and those covered by EOPYY do not enjoy the same entitlements. A degree of unfairness among taxpayers will also persist: EOPYY benefits are heavily subsidized by the state budget and yet many taxpayers are not able to be covered by EOPYY, among them people who may have paid contributions throughout their working life but were unfortunate enough to experience long-term unemployment and lost their entitlement to EOPYY benefits.
Fig 30. Change in catastrophic health spending and unmet need due to cost, distance and waiting time in Greece, 2009–2016
Catastrophic incidence
Unmet need for dental care
Unmet need for health care
Sources: Chletsos et al. (in press); EU-SILC data from Eurostat (2018a).
0
2
14
0
14
2
Ho
use
ho
lds
(%)
Pop
ula
tio
n (
%)
2009 2010 2011 2012 2013 2014 2015 2016
4
6
8
10
12
4
6
8
10
12
69The story behind the numbers: population entitlement
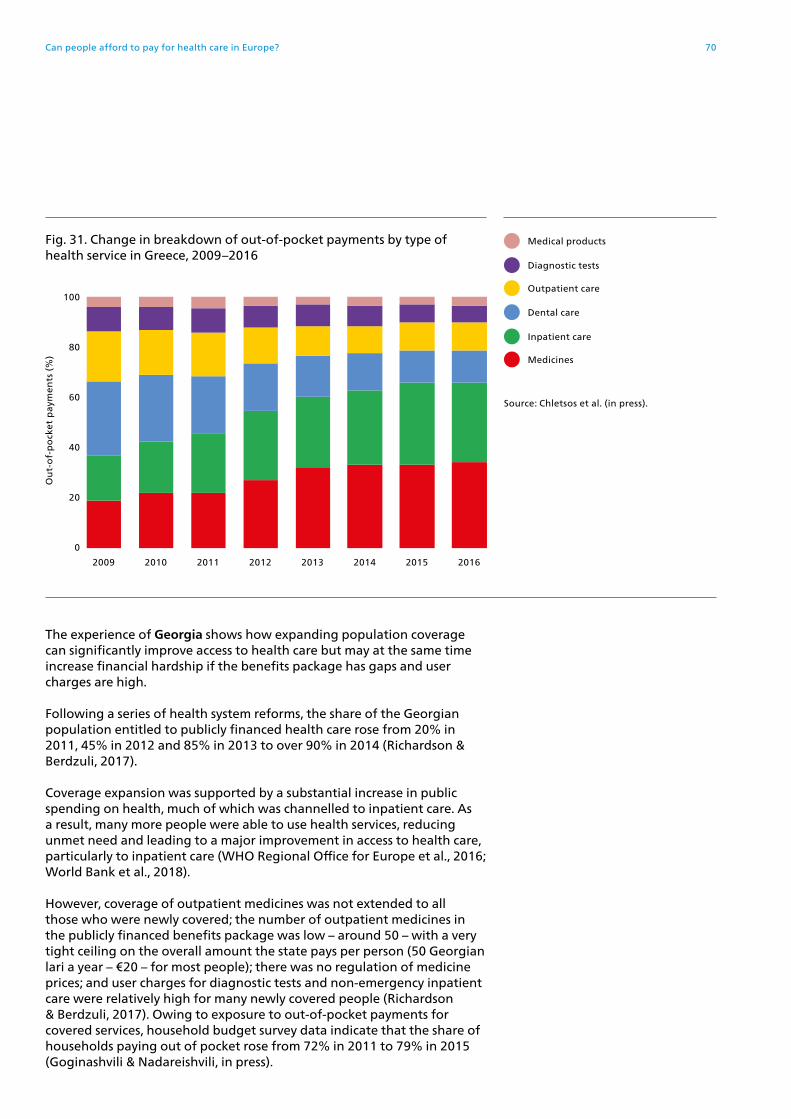
The experience of Georgia shows how expanding population coverage can significantly improve access to health care but may at the same time increase financial hardship if the benefits package has gaps and user charges are high.
Following a series of health system reforms, the share of the Georgian population entitled to publicly financed health care rose from 20% in 2011, 45% in 2012 and 85% in 2013 to over 90% in 2014 (Richardson & Berdzuli, 2017).
Coverage expansion was supported by a substantial increase in public spending on health, much of which was channelled to inpatient care. As a result, many more people were able to use health services, reducing unmet need and leading to a major improvement in access to health care, particularly to inpatient care (WHO Regional Office for Europe et al., 2016; World Bank et al., 2018).
However, coverage of outpatient medicines was not extended to all those who were newly covered; the number of outpatient medicines in the publicly financed benefits package was low – around 50 – with a very tight ceiling on the overall amount the state pays per person (50 Georgian lari a year – €20 – for most people); there was no regulation of medicine prices; and user charges for diagnostic tests and non-emergency inpatient care were relatively high for many newly covered people (Richardson & Berdzuli, 2017). Owing to exposure to out-of-pocket payments for covered services, household budget survey data indicate that the share of households paying out of pocket rose from 72% in 2011 to 79% in 2015 (Goginashvili & Nadareishvili, in press).
2009 2010 2011 2012 2013 2014 2015 2016
Ou
t-o
f-p
ock
et p
aym
ents
(%
)
Fig. 31. Change in breakdown of out-of-pocket payments by type of health service in Greece, 2009–2016
Medical products
Dental care
Outpatient care
Medicines
Diagnostic tests
Inpatient care
100
80
60
0
20
40
Source: Chletsos et al. (in press).
Can people afford to pay for health care in Europe? 70

The incidence of catastrophic health spending fell in 2012 and 2013 but rose in 2014 and 2015 (Goginashvili & Nadareishvili, in press). Among households with catastrophic health spending, the composition of out-of-pocket payments shifted away from inpatient care to medicines. The average amount spent on inpatient care also fell, while the amount spent on outpatient medicines increased (Fig. 32).
In 2017, the highest earners (around 1.2% of the population) were explicitly excluded from publicly financed coverage and expected (but not required) to purchase VHI (Richardson & Berdzuli, 2017). Savings generated by no longer covering this group are intended to be used to expand coverage of outpatient medicines for poor households, but the impact of these policy changes on financial protection has not yet been assessed.
Some countries in the study offer different groups of people access to a different range of publicly financed health services. This approach to rationing is relatively uncommon, for good reason: it can create or exacerbate inequalities in access and financial hardship and undermine efficiency in the use of health services. The negative effects of such a policy depend on several factors, including the criteria for differentiation (income versus other criteria); the level of the income threshold for entitlement; whether there is one income threshold or multiple thresholds; and the nature and extent of the benefits that are differentiated.
Cyprus, Georgia (from 2017) and Ireland use income as the main criterion for determining the level of entitlement, offering a higher level of entitlement to poorer people; age (Georgia, Ireland) and health status
Fig. 32. Change in the average amount spent by health service among households with catastrophic health spending in Georgia, 2011–2015
Geo
rgia
n la
ri p
er y
ear
0
1800
1600
1400
1200
1000
800
600
400
200
Total
Outpatient care
Medicines
Dental care
Inpatient care
Medical products
Diagnostic tests
Source: Goginashvili & Nadareishvili (in press).
2011 2012 2013 2014 2015
71The story behind the numbers: population entitlement

(Cyprus, Ireland) are also considered. This is a relatively long-standing approach in Cyprus and Ireland.
While far from ideal, the policy in these three countries does at least attempt to confer additional benefits on those with greater need for health care and limited ability to pay. In contrast, splitting the benefits package into basic and comprehensive baskets, with entitlement dependent on who has paid (more) contributions – an approach used in several countries – is highly likely to exacerbate inequalities in unmet need and financial hardship.
Finally, it is important to note that in many countries in Europe, even those that purport to cover the whole population, undocumented migrants are likely to lack adequate access to health services, as Table 5 shows. Undocumented migrants are entitled to emergency care in all EU countries, but payment at the point of use may be required in some (Spencer & Hughes, 2015).
Two other groups of people who are systematically underserved in Europe include Roma and people with mental health problems (EXPH, 2016). Along with undocumented migrants, these groups are also likely to be underrepresented in household budget surveys and surveys assessing unmet need.
Table 5. Entitlement to health services for undocumented migrants, EU28, 2014
Level of entitlement Countries
Emergency care only Bulgaria, Cyprus, Finland, Lithuania, Luxembourg, Slovakia
Entitlement to selected specialist services (e.g. for communicable diseases)
Austria, Croatia, Denmark, Estonia, Greece, Hungary, Latvia, Malta, Poland, Romania, Slovenia, Spain
Entitlement to some degree of primary and secondary care
Belgium, Czechia, Germany, Ireland, Italy, France, the Netherlands, Portugal, Sweden, the United Kingdom
Note: entitlements for undocumented migrants may have changed in some countries since 2014; in 2018, for example, Spain extended entitlement for undocumented migrants.
Source: Spencer & Hughes (2015).
Can people afford to pay for health care in Europe? 72

Key messages on population entitlement
• Most gaps in population coverage occur because entitlement is based on employment or payment of contributions. This automatically excludes people, particularly in countries that lack effective mechanisms to enforce collection, and is more likely to affect relatively vulnerable groups of people.
• In Europe, the association between gaps in population coverage and financial hardship is weak because people lacking coverage usually only account for a small share of the population, and countries generally provide all residents with access to emergency services (mostly without charge), regardless of coverage status.
• Where gaps in population coverage are significant, they lead to high levels of unmet need and financial hardship.
• Population coverage is not a useful instrument for rationing because it is likely to exacerbate inefficiencies in service use and inequalities in use and health. Excluded people will have to rely on emergency services and may experience an avoidable deterioration in health status.
• Offering a split benefits package – a situation in which publicly financed entitlements vary based on whether people have paid contributions – is likely to have a disproportionately negative impact on people with lower socioeconomic status, entrenching inequalities.
• Expanding population coverage will increase use and reduce unmet need. However, where financial protection is weak, increased use may increase financial hardship unless steps are taken to reduce out-of-pocket payments for poorer people.
• Even where the whole population is covered, some groups may be systematically underserved, particularly undocumented migrants, Roma and people with mental health problems.
• The share of the population entitled to publicly financed health services should not be used as an indicator of financial protection. This study shows how the incidence of catastrophic health spending varies hugely across countries that cover the whole population.
73The story behind the numbers: population entitlement
The benefits package
Financial protection is influenced by the range of services included in the publicly financed benefits package and the availability, quality and timeliness of these services.
Assessing the impact of the benefits package on financial protection is challenging for several reasons. First, very few countries in Europe define the whole of the benefits package in detail, so it is not always possible to know precisely what is and is not covered (Schreyögg et al., 2005). Second, services may be in the benefits package but subject to user charges, making it difficult to disentangle the effects of what is covered from how much of the cost is covered. Third, problems with service availability, quality or timeliness may also be difficult to disentangle from coverage policy, particularly where they result in informal payments.
This section focuses on the two service areas most likely to be heavily financed through out-of-pocket payments (see Fig. 22) and most likely to cause financial hardship (see Fig. 12 and Fig. 13): outpatient medicines and dental care. It then looks at issues relating to service availability, quality and timeliness; problems with implicit rationing; and the prevalence of informal payments.
Outpatient medicines
All of the countries in the study except Germany have a positive list of covered medicines; Germany has a negative list and the United Kingdom has a positive list and a negative list (WHO Regional Office for Europe, 2018b). However, no recent analysis of the scope of publicly financed outpatient medicines in Europe was identified.
The over-the-counter share of spending on outpatient medicines provides a rough indication of whether the benefits package is adequate, although people may also use over-the-counter medicines as a way of overcoming problems accessing outpatient physicians to obtain prescriptions, not just due to the narrowness of entitlements.
Unfortunately, comparable data on spending on over-the-counter medicines are only available for a few countries, all of them in the EU. In 2016, the over-the-counter share of spending on outpatient medicines ranged from 10% in Germany and 30% in Latvia to just over 50% in Poland (Fig. 33). Self-reported use of over-the-counter medicines in Latvia and Poland is also much higher than the EU28 average (Fig. 16).
Can people afford to pay for health care in Europe? 74

For some of the middle-income countries in the study, it is evident that the number of medicines included in the publicly financed benefits package is extremely low – well below the 433 medicines deemed by WHO to be essential for addressing the most important public health needs in 2017 (WHO, 2017).
• Georgia: only around 50 outpatient medicines are covered under the new programme introduced in 2013, but from 2017 essential medicines for important chronic conditions (cardiovascular disease, including hypertension; chronic obstructive pulmonary disease, diabetes, thyroid diseases, epilepsy and Parkinson’s disease) are available to poor people at low cost, and from 2018 at half price for pensioners and people with disabilities (Richardson & Berdzuli, 2017).
• Kyrgyzstan: the only outpatient medicines covered are for epilepsy, asthma, schizophrenia, affective disorders and cancer (available to all residents, regardless of coverage status) and asthma, hypertension, other cardiovascular conditions and pneumonia (available to 74% of the population who have paid contributions or are exempt from contributions) (Jakab et al., 2018).
• Republic of Moldova: in 2016, publicly financed coverage was extended from around 75 to 134 international non-proprietary names (Garam et al. in press).
• Ukraine: outpatient medicines are formally covered but in practice people have had to pay the full cost out of pocket; a new system introduced in 2018 includes publicly financed coverage of 23 international non-proprietary names (Goroshko et al., 2018; WHO Regional Office for Europe, 2019).
Fig. 33. Over-the-counter share of current spending on outpatient medicines, 2016
Note: data not available for all of the countries in the study.
Source: OECD (2019b).
0
20
40
60
10
30
50
Spen
din
g o
n o
up
tati
ent
med
icin
es (
%)
DE
U
FRA
SVK
EST
SVN
AU
T
CZ
E
SWE
LVA
PO
L
75The story behind the numbers: the benefits package
This brief discussion suggests that in the richer countries in the WHO European Region, gaps in the coverage of medicines are caused more by user charges than a narrow benefits package; in the Region’s poorer countries, the gap is likely to be caused by both factors: a narrow benefits package and the weak design of user charges policy (see the section on user charges).
Dental care
With the exception of Georgia, countries in the study include some dental care in the publicly financed benefits package. However, all of the countries in the study charge people for dental care at the point of use, and access to publicly financed benefits is often explicitly restricted in other ways – for example, by:
• limiting coverage to specific age groups: children in Albania, Latvia and the Republic of Moldova; people aged under 10 or over 70 years old in Kyrgyzstan;
• only covering treatment in public facilities: Ukraine and the United Kingdom; and
• providing cash benefits rather than benefits in kind: Estonia between 2002 and 2017.
Limited coverage of dental care affects different groups of people differently, frequently leading to financial hardship for richer households who are able to pay out of pocket, but resulting in unmet need for poorer households who forego or delay seeking care.
Fig. 34 shows the dental care share of out-of-pocket payments among households with catastrophic health spending in three countries, representing significant variation in coverage of dental care, both in terms of the benefits package and user charges (co-payments).
• Georgia: dental care is not included in the publicly financed benefits package (except for the military and their families) (Goginashvili & Nadareishvili, in press).
• Lithuania: some dental care is included, but coverage is limited for adults. Adults are entitled to free dental check-ups in contracted facilities, but must generally pay the full cost of any treatment (Murauskienė & Thomson, 2018). Pensioners and disabled people are entitled to free prostheses. There are no exemptions for poor people and no cap on out-of-pocket payments.
• Germany: dental care is included. Check-ups and medically necessary preventive and conservative treatment are free at the point of use (Siegel & Busse, 2018). Adults have to pay at least half of the cost of any other treatment, including crowns and dentures. People on low incomes or receiving social benefits are not exempt, but pay lower user charges. Out-of-pocket payments for covered services, including for dental care, are capped at 2% of gross income a year (1% for people with a chronic condition).
Can people afford to pay for health care in Europe? 76

Fig. 34. Share of out-of-pocket payments spent on dental care among households with catastrophic health spending and unmet need for dental care
Ou
t-o
f-p
ock
et p
aym
ents
(%
)
0
80
60
40
20
Poorest 2nd 3rd 4th Richest
Georgia: dental care is not covered; no data on unmet need for dental care
Ou
t-o
f-p
ock
et p
aym
ents
(%
)
Pop
ula
tio
n (
%)
0 0
80 8
60 6
40 4
20 2
Poorest 2nd 3rd 4th Richest
Germany: dental care is covered with a cap for all households and additional but still insufficient protection for poor people
Ou
t-o
f-p
ock
et p
aym
ents
(%
)
Pop
ula
tio
n (
%)
0 0
80 8
60 6
40 4
20 2
Poorest 2nd 3rd 4th Richest
Lithuania: some dental care is covered but there is no additional protection for poor adults
Dental care
Unmet need for dental care
Note: data are for 2012 (Lithuania), 2013 (Germany) and 2015 (Georgia).
Sources: Goginashvili & Nadareishvili (2018); Murauskienė & Thomson (2018); Siegel & Busse (2018); EU-SILC data from Eurostat (2018a).
77The story behind the numbers: the benefits package

Fig. 34 shows how out-of-pocket payments for dental care are more likely to lead to financial hardship for richer households than poorer households in all three countries. This reflects the greater ability of richer households to spend on dental care, as well as unmet need for dental care among poorer households in Germany and Lithuania; data on unmet need for dental care are not available for Georgia. There is a social gradient for unmet need and out-of-pocket payments for dental care in both countries, but the gradient is much steeper in Lithuania than in Germany. Even in Germany, however, reduced user charges for poor people and an annual income-related cap on out-of-pocket payments are not enough to prevent financial hardship due to use of dental care.
This pattern of gaps in the coverage of dental care leading to financial hardship for richer households and unmet need for poor households, both within and across countries, is likely to be found for other services too – especially preventive services, which may be deemed less essential by households with limited budgets (OECD, in press). It underlines the importance of ensuring that preventive services are available free of charge for the whole population, including people who are not covered.
High levels of unmet need for dental care among poorer households should be a source of concern given growing evidence of the links between oral health and systemic illnesses.
Service availability, quality and timeliness
Just because services are included in the benefits package does not mean they are available to people, available in a timely way or of sufficient quality to be effective. Shortcomings in the availability, quality and timeliness of publicly financed health services may result in unmet need but can also lead to an increase in out-of-pocket payments.
People may pay out of pocket to obtain:
• faster access to treatment where there are long waiting times for covered services;
• better quality, ranging from better quality amenities to more effective treatments; problems with quality can lead to informal payments to health workers; and
• services or supplies that should be publicly financed but are not available at the point of use, such as medicines or 24-hour nursing care in hospital.
Out-of-pocket payments spent in these ways are most likely to be categorized under outpatient care and inpatient care, which are not the most important sources of financial hardship in most countries (see Fig. 12), and even less so among the poorest consumption quintile (see Fig. 13), with some notable exceptions. This suggests that deficiencies in service delivery – particularly issues with quality and timeliness – may be more likely to result in unmet need than financial hardship for poor households.
Can people afford to pay for health care in Europe? 78

Implicit rationing, unfunded mandates and informal payments
Service-related problems sometimes arise because public spending on health is inadequate to meet population health needs or inappropriately allocated. The rationing that results is most likely to have negative consequences if it is implicit rather than explicit (see Fig. 28) – for example, when people are promised benefits that are not supported by funding. Unfunded mandates often give rise to informal payments.
Informal payments are a significant problem in several of the countries in this study, including Albania, Greece, Hungary, Kyrgyzstan, Latvia, Lithuania, Poland, the Republic of Moldova and Ukraine – all countries with a relatively high incidence of catastrophic health spending (see Fig. 5). Household budget survey data do not permit the identification of the magnitude of informal payments or out-of-pocket payments made to obtain faster access or better quality of care. However, the majority of out-of-pocket payments in these countries are spent on outpatient medicines, including among households with catastrophic spending (Fig. 12), and especially among poor households with catastrophic spending (Fig. 13). This indicates that informal payments are not the main source of financial hardship in the countries in the study.
Even if informal payments are not a major source of financial hardship in the study countries, they are an important problem because they undermine almost every aspect of health system performance, point to failures in health system governance and can be difficult to address (see Box 2). They are particularly problematic for poor people because they are regressive in terms of financing care, and their informal nature makes it impossible to protect people through exemptions.
Two examples of informal payments linked to unfunded mandates illustrate different ways in which addressing informal payments can improve financial protection for poor people. In Kyrgyzstan and Ukraine, informal payments are concentrated in hospitals, and inpatient care is the second-most important source of financial hardship for the poorest quintile, after outpatient medicines (Fig. 13). Both countries have a relatively high incidence of catastrophic health spending, which has increased over time (Goroshko et al., 2018; Jakab et al., 2018).
Kyrgyzstan carefully monitors informal payments over time (Jakab et al., 2016). Its analysis shows that informal payments for inpatient care rose from 2001 to 2003 (mainly those paid to health-care workers) and fell in 2004 and 2006 (mainly those paid for medicines and medical supplies, which are supposed to be free in hospital).
The reduction in informal payments followed the introduction of new purchasing mechanisms that enabled inpatient facilities to be reconfigured, leading to savings on fixed costs that were used to purchase inpatient medicines (Jakab et al., 2018). Between 2006 and 2013 these positive results were eroded, however, and informal payments rose again, particularly for staff, offsetting earlier gains. The increase in informal payments from 2006 is associated with underfunding of the publicly financed benefits package and inefficiencies in service delivery that draw resources away from the provision of care (Jakab et al., 2018). It indicates
79The story behind the numbers: the benefits package

that salary increases were not an effective strategy for reducing informal payments to staff.
Although the Kyrgyz health system attempts to ensure financial protection by exempting many groups of people from formal user charges for inpatient care, it is unable to exempt anyone from informal payments. Analysis confirms that informal payments in Kyrgyzstan impose a heavy financial burden on poor households (Jakab et al., 2016).
Ukraine offers its citizens entitlement to publicly financed health services, including medicines, without user charges (co-payments), but coverage policy has not been matched by appropriate levels of public spending on health (Lekhan et al., 2015). As a result, even though prescribed medicines in outpatient and inpatient settings are supposed to be free at the point of use, 99% of spending on outpatient medicines came from out-of-pocket payments in 2016, and survey data from the same year show that 83% of inpatients did not receive medicines from the facility but had to pay for them out of pocket (Goroshko et al., 2018). Between 2010 and 2015, self-reported unmet need for health care and the incidence of catastrophic health spending increased substantially.
From 2018, the Government of Ukraine has introduced a new system of coverage of outpatient medicines, with an explicitly defined benefits package and redesigned co-payment policy supported by international non-proprietary name prescribing and additional public spending. The Affordable Medicines Programme, as it is known, provides people with access to 23 international non-proprietary names for priority chronic conditions without co-payment, although the patient may have to pay if the retail price is above the reference price (Goroshko et al., 2018). A recent evaluation of the new programme finds that it has improved affordability and recommends that it be extended to include a wider range of essential medicines for priority diseases (WHO Regional Office for Europe, 2019).
These examples show it is possible to achieve some reduction in informal payments for medicines that are supposed to be free at the point of use by:
• reducing hospital fixed costs, in contexts where there is excess hospital capacity, through restructuring and ensuring that any savings gained are reinvested in providing medicines to patients; and
• carefully redesigning coverage policy for outpatient medicines so that it is more explicitly targeting the people most in need of financial protection – people with chronic conditions in Ukraine’s case – and supporting coverage through additional public spending on these medicines.
They also highlight some of the more intractable challenges associated with implicit rationing. Although rationing is an inevitable response to budget constraints, it can be done in ways that mitigate or even avoid negative consequences for health system performance and may also have positive effects.
The design of the benefits package offers countries an opportunity to engage in explicit priority-setting processes to ensure publicly financed
Can people afford to pay for health care in Europe? 80

health services are cost-effective and match population health needs as closely as possible.
If informed by evidence – for example, burden of disease studies, health technology assessments and the WHO Essential Medicines List (WHO, 2017) – priority-setting processes can also help tackle out-of-pocket payments and other inefficiencies arising from inappropriate use of health services – that is the use of goods or services that are not needed, not effective or not cost-effective.
Box 2. Informal payments indicate failures in health system governance and are difficult to address when they are paid to health workers
Informal payments occur when the supply of health services is limited in some way, and the classic mechanisms of exit (for example, using the private sector) and voice (applying political pressure for reform of the system) are unavailable or dysfunctional (Gaál & McKee, 2004).
They have many adverse effects on health system performance: exacerbating access barriers and inequalities in the use of health services, reducing transparency and undermining the health system’s ability to protect poorer people. Where payments are informal, it is impossible to protect poor people, regular users of health care and other vulnerable groups through exemptions or reduced rates. This matters because informal payments are known to be regressive – that is, they account for a higher share of the income of poorer people (Jakab et al., 2016). Their unpredictability can also be problematic for households.
Because of their covert nature, informal payments can be difficult toovercome, and there is little evidence of reductions being sustained in thelonger term (Kutzin et al., 2010; Jakab et al., 2016; WHO Regional Officefor Europe, 2018a). International experience suggests it is easier to reduceinformal payments that are made for supplies such as medicines or roundthe-clock nursing care in hospital than those that are made to health workers.
81The story behind the numbers: the benefits package

Key messages on the benefits package
• In Georgia, Kyrgyzstan, the Republic of Moldova and Ukraine, the number of outpatient medicines covered by the publicly financed benefits package is low and requires urgent policy attention.
• The over-the-counter share of spending on medicines is relatively high in some of the high-income countries in the study, which may reflect a narrow benefits package or barriers to obtaining prescriptions from outpatient physicians.
• Coverage of dental care for adults is very limited in some countries, including high-income countries. Lack of dental care coverage leads to financial hardship for richer households, who can afford to pay out of pocket, and unmet need for poorer households. This pattern is also likely to apply to preventive services, underlining the importance of ensuring that such services are adequately covered and free at the point of use, at least for poor people.
• Problems with service availability, timeliness and quality may increase out-of-pocket payments. If levels of public spending on health are inadequate and lead to implicit rationing – for example, as a result of unfunded mandates – informal payments are likely to be a problem.
• Although informal payments are not the most important source of financial hardship, even in countries where informal payments are significant, they are problematic because they undermine performance, indicate failures in health system governance and can be difficult to address, particularly where they are made to health-care workers.
• Informal payments are particularly problematic for poor people because they are regressive in terms of paying for health care and their informal nature makes it impossible to protect people through exemptions.
• Countries with significant informal payments have a relatively high incidence of catastrophic health spending. Examples from Kyrgyzstan and Ukraine show it is possible to reduce informal payments for prescribed medicines in inpatient and outpatient settings through explicit targeting supported by additional public spending.
• The design of the benefits package offers valuable opportunities for explicit rationing through priority-setting processes. These processes can be used to ensure publicly financed health services are cost-effective and match population health needs as closely as possible. They can also help tackle out-of-pocket payments and other inefficiencies arising from inappropriate use of health services.
• The benefits package should not be considered in isolation from user charges (co-payments).
Can people afford to pay for health care in Europe? 82

User charges (co-payments)
User charges can create barriers to accessing health care, resulting in unmet need. By shifting health-care costs on to households, they can also lead to financial hardship.
A large body of evidence on the impact of user charges (Swartz, 2010) is remarkably consistent in concluding that they:
• are not an effective instrument for directing people to use health services more efficiently; people are just as likely to reduce the use of essential and non-essential health services, including medicines;
• are not a good instrument for rationing because most decisions about health-care use and costs are made by health care providers; policy instruments targeting health-care providers are much more likely to be effective at achieving policy goals than user charges; and
• are likely to lead to adverse health outcomes among poor people, older people and people with chronic conditions, partly through reduced adherence to essential medicines, which undermines efficiency; this indicates that poor people and regular users of health services should be exempt from user charges.
The design of user charges policy plays a critical role in determining the extent and distribution of out-of-pocket payments for covered health services.
This study finds that the countries with the strongest financial protection apply user charges very sparingly (for example, the United Kingdom) or carefully design their user charges policy to protect against financial hardship through three mechanisms:
• exemptions for poor people and regular users of health services – for example, people with chronic conditions;
• annual caps on all co-payments per person (caps per visit or product are unlikely to be effective, particularly for regular users); and
• low fixed co-payments instead of percentage co-payments, especially where prices vary or are not well regulated.
To understand the impact of user charges policy on financial protection, it is important to consider the extent and type of co-payments and the combination and effectiveness of protection mechanisms.
83The story behind the numbers: user charges (co-payments)

Table 6 summarizes this information for the countries in the study during the study period.
• Half (12) of the countries do not charge people for primary care visits (excluding dental care) and nearly half (10) do not charge people for outpatient specialist visits or inpatient care. All countries charge people for dental care and outpatient prescribed medicines.
• Percentage co-payments are the most common type of user charge for outpatient medicines and dental care.
• All countries with formal user charges exempt some groups of people from having to pay, but fewer than half explicitly exempt poor people.
• Only two countries have an annual cap on all user charges (Czechia and Germany). Eight countries have an annual cap for some user charges, and 14 countries do not have any annual caps at all.
• Only three countries have a market for VHI that covers co-payments for most of the population, including those who most need protection (Croatia, France and Slovenia).
The experience of the three countries that rely heavily on VHI to protect people against co-payments is described in more detail in the next section. It is unlikely to be generalizable to other countries. The rest of this section focuses on exemptions, caps and type of co-payment.
Can people afford to pay for health care in Europe? 84

Table 6. User charges design in the study countries in the latest year of the study
Notes: FC: fixed co-payment. PC: percentage co-payment; RP: reference pricing; Rx: prescribed outpatient medicines; 1°: primary care; 2°: secondary care. Green shading: no user charges. Orange shading: limited coverage. Red shading: not covered at all.
Source: WHO Regional Office for Europe.
Outpatient visits
Outpatient prescribed medicines
Dental care Inpatient care Exemptions Cap VHI covers user
charges
ALB 2015 FC PC + RP Not covered for adults
No charges Yes, but not for poor No No
AUT 2015 Mix FC Mix FC Yes, including poor Varies No
CRO 2014 FC (1°) + PC (2°) FC + RP FC + PC FC + PC Yes, but not for poor Per episode (2°) Yes + free for poor
CYP 2015 FC FC FC No charges Yes, but not for poor Varies No
CZH 2012 FC FC FC FC Yes, including poor Yes No
DEU 2013 No charges PC + RP PC FC Yes, but not for poor for Rx
Yes Yes
EST 2015 FC (2°) FC + PC + RP PC FC + PC Yes, but not for poor No No
FRA 2011 FC + PC FC + PC + RP PC FC + PC Yes, but not for poor No Yes + free for poor
GEO 2015 PC (2°) PC Not covered FC + PC Yes, but not for poor No No
GRE 2016 No charges FC + PC + RP FC in public facilities
Rx in public facilities
Yes, including poor No No
HUN 2015 No charges FC + PC + RP PC FC + PC Yes, including poor No No
IRE 2016 FC FC for poor; PC for rest
FC FC Yes, but not for poor Rx + inpatient No
KGZ 2014 No charges PC Limited to emergencies
FC Yes, but not for poor No No
LTU 2016 No charges PC + RP PC No charges Yes, but not for poor No No
LVA 2013 FC FC + PC + RP Not covered for adults
FC Yes, including poor Outpatient visits + inpatient
Yes
MDA 2016 No charges PC Not covered for adults
No charges Yes, but not for poor No No
POL 2014 No charges FC + PC + RP No charges for basic care
No charges Yes, but not for poor No No
POR 2015 FC PC PC No charges Yes, but not for poor No No
SVK 2012 No charges FC + RP FC No charges No Rx No
SVN 2015 PC PC + RP PC PC Yes, including poor No Yes
SWE 2012 FC PC PC FC Yes, but not for poor Outpatient + Rx No
TUR 2014 FC FC + PC +RP FC + PC No charges No No No
UKR 2015 No charges No formal charges
but all pay
FC No charges No No No
UNK 2014 No charges FC Mix No charges Yes, including poor Rx No
85The story behind the numbers: user charges (co-payments)

The link between the incidence of catastrophic health spending and co-payment design for outpatient medicines is illustrated in Fig. 35.
• The countries on the left of the figure have a relatively low incidence of catastrophic spending, often use low fixed co-payments rather than percentage co-payments and employ a wide range of protection mechanisms.
• In contrast, the countries on the right have a relatively high incidence of catastrophic spending, rely heavily on percentage co-payments and lack effective protection mechanisms.
Annual cap
Fig. 35. Catastrophic incidence and the design of co-payments for outpatient medicines in high-income countries
Source: WHO Regional Office for Europe.
0
4
8
16
14
12
2
6
10
Ca
tast
rop
hic
inci
den
ce (
%)
FRA
CR
O
SVN
AU
T
CZ
H
UN
K
CY
P
IRE
SVK
DE
U
SWE
EST
PO
R
PO
L
GR
E
HU
N
LVA
LTU
VHI covers co-payments
Poor people exempt
Low fixed co-payments
Percentage co-payments
+ limited protectionmechanisms
Can people afford to pay for health care in Europe? 86

Exemptions for poor people and regular users of health services
All of the countries in the study exempt some groups of people from co-payments, indicating widespread acknowledgement of the potential for user charges to undermine access and financial protection.
However, in spite of consistent evidence showing that user charges have an unduly negative effect on poor households and regular users of health services (Swartz, 2010), very few countries explicitly exempt poor people and people with chronic conditions from user charges.
In the United Kingdom, where the incidence of catastrophic health spending is very low (1.4% in 2014), Scotland, Northern Ireland and Wales do not impose any user charges for outpatient prescribed medicines; in England (the only one of the four countries that does), children under 18, pregnant women and regular users of health services – people aged over 60 and people with selected chronic conditions – are also exempt. As a result, around 90% of all outpatient prescribed medicines in England are dispensed without co-payment (Cooke O’Dowd et al., 2018).
Policy changes within countries provide evidence of the importance of exempting poor people from co-payments.
In 2004, Germany introduced a new co-payment for outpatient visits (a fixed co-payment of €10 for the first visit in every quarter) and replaced exemptions for poor people with an annual income-related cap on co-payments. In 2012, the outpatient visit co-payment was abolished. Looking at catastrophic incidence over time (Fig. 36) and the breakdown of out-of-payments among households with catastrophic spending (Fig. 37) shows two things (Siegel & Busse, 2018).
• The introduction and abolition of the co-payment for outpatient visits coincided with a rise and then a fall in catastrophic incidence, and the rise was largely driven by an increase in out-of-pocket spending on outpatient care.
• Even a carefully designed cap on co-payments, such as the one in Germany, may not be as protective for poor households as an exemption from co-payments. The incidence of catastrophic spending fell after the abolition of the outpatient visit co-payment, but remained higher than it had been before the abolition of the exemption.
87The story behind the numbers: user charges (co-payments)

2003 2008 2013
Ou
t-o
f-p
ock
et p
aym
ents
(%
)
Fig. 37. Breakdown of out-of-pocket payments by health service among households with catastrophic health spending in the poorest consumption quintile in Germany
Medical products
Dental care
Outpatient care
Medicines
Diagnostic tests
Inpatient care
100
80
60
0
20
40
Source: Siegel & Busse (2018).
Fig. 36. Share of households with catastrophic health spending by consumption quintile in Germany
Ho
use
ho
lds
(%)
0
4
2
3
1
2003 2008 2013
Richest
4th
3rd
2nd
Poorest
Source: Siegel & Busse (2018).
Can people afford to pay for health care in Europe? 88

Evidence of the positive impact of exempting poor people from co-payments also comes from Latvia. In response to the economic crisis, Latvia introduced an exemption from co-payments for very poor people in 2009, extended exemptions to other poor people in 2010, and then abolished the exemptions for all except the very poorest households in 2012 (Taube et al., 2018). These policy changes coincide with a fall in the incidence of catastrophic out-of-pocket payments among the poorest consumption quintile in 2010, followed by an increase in 2013 (Fig. 38).
In the light of this evidence, exempting poor people from user charges appears to be a strategy all countries should adopt, starting with people receiving social benefits because these people (and their families) are likely to be highly vulnerable. They should also be relatively easy to identify, since all countries in the WHO European Region have some form of social protection system.
Fig. 38. Share of households with catastrophic health spending by consumption quintile in Latvia
Ho
use
ho
lds
(%)
0
10
14
12
8
4
6
2
2009 2010 2013
Richest
4th
3rd
2nd
Poorest
Source: Taube et al. (2018).
89The story behind the numbers: user charges (co-payments)

Annual caps on all co-payments per person
Exemptions ensure vulnerable groups of people do not have to pay anything out of pocket. Caps have a different protective effect: limiting the amount that must be paid out of pocket, which reduces financial uncertainty and may reduce financial hardship.
Caps can be applied per item or service provided or per person or household in a given period of time. Caps that apply to people over time offer stronger protection than caps applied to specific items or services. If caps are applied per person or household, they can be set as a fixed amount or as a share of income. The use of income-related caps, as in Austria and Germany, may enhance equity by ensuring that more of the financial burden of out-of-pocket payments is borne by richer households (Table 7).
Austria introduced an income-related cap on co-payments for prescriptions in 2008, set at 2% of net annual income (see Box 3). The cap, combined with a reduction in value-added tax for all medicines in 2009, is likely to be behind the decrease in out-of-pocket payments for outpatient medicines between 2004/2005 and 2009/2010. There was no change in the overall incidence of catastrophic health spending during this period, but the medicines share of catastrophic spending fell sharply for the poorest consumption quintile, while the medical products share, which was not capped, grew (Fig. 39) (Czypionka et al., 2018). The growth in the medical products share may also reflect a reduction in coverage of corrective lenses in 2005.
Table 7. Caps on user charges in the study countries in the latest year of the study
Details of cap
AUT 2015 Varies by social insurance scheme, except for outpatient prescription medicines, which applies to all households: 2% of net household income a year
CRO 2014 Only applies to secondary or tertiary care and only applies per episode of care: 2000 Croatian kuna (€262) per episode of care
CYP 2015 Only applies to people using public facilities and does not apply to outpatient prescription medicines: it ranges from 1.5% to 22.5% of annual household income
CZH 2012 Applies to all user charges: 5000 Czech koruna (€195) a year or 2500 Czech koruna (€97.50) a year for children under 18 years and people aged over 65
DEU 2013 Applies to all user charges: 2% of gross income per year (1% for people with a documented chronic condition)
IRE 2016 Only applies to outpatient prescription medicines (€300 or €1728 per household a year) and inpatient care (€800 per household a year)
LVA 2013 Only applies to outpatient and inpatient visits (€569 per person a year): each hospitalization capped at €356
SVK 2012 Only applies to outpatient prescription medicines, not to dental care or emergency care: €120 per person per year for disabled people or €180 per person per year for pensioners
SWE 2012 1100 Swedish kroner (€123) a year for outpatient visits and 2200 Swedish kroner (€246) a year for outpatient medicines
UNK 2014 Only applies to outpatient prescription medicines, not to dental care: £29.10 (€35) per person per quarter and £104 (€125) per person a year
Notes: some countries (Cyprus, France, Germany, Greece and the Republic of Moldova) have caps that apply to some (generally minor) part of the cost of outpatient prescription medicines – for example, a cap per prescription item – and these are not included here. Currency converted using www.oanda.com for the first day of the relevant year.
Source: WHO Regional Office for Europe.
Can people afford to pay for health care in Europe? 90

Box 3. How Austria implements an income-related cap on co-payments for outpatient medicines
In 2008, Austria’s social insurance system introduced an income-related cap on co-payments for outpatient prescriptions. Outpatient prescriptions are subject to a fixed co-payment of €6.10 per item in 2019. The cap, known as Rezeptgebührenobergrenze (REGO), is set per household and is equal to 2% of the net annual income of the person in the household who pays contributions to the social insurance system.
The social insurance system can access information about each person’s contribution base (the amount of income on which contributions are levied): gross salary paid up to the maximum contribution base for employees and income declared in the previous year for self-employed people. At the start of every year, social insurance uses the contribution base to calculate each contributor’s net income and the cap amount (2% of net income).
People covered by social insurance must show an e-card when visiting doctors or hospitals. The prescribing physician uses the administrative information stored on the card (name, insurance number, card number, gender and user group) to access a secure data network – the health information network – which holds information on the amount of prescription co-payments accrued that year and the cap. If the person has reached the cap, the prescribing physician ticks a box on the paper prescription form to indicate that the prescription is exempt from co-payment.
Prescribed medicines that cost less than the co-payment do not count towards the cap and are only exempt from co-payment once the cap has been reached. The cap can be adjusted over time. If a person pays too much because of earning less in the current year than the previous year, then the additional amount paid is used to lower the cap in the following year or repaid the year after that if the person has no prescriptions.
Since its introduction, the cap has been very popular. The main criticisms are that it does not apply to medicines that cost less than the co-payment; it benefits large households who may reach the cap more quickly than small households; it involves administrative costs for the social insurance system; and it does not apply to all co-payments.
Source: Thomas Czypionka, Institute for Advanced Studies, personal communication, January 2019.
91The story behind the numbers: user charges (co-payments)

The income-related cap in Cyprus operates on a sliding scale based on household income and number of children. There is a large variation in the share of income households are expected to pay, ranging from 1.5% to 22.5% (Kontemeniotis & Theodorou, in press). The cap only applies to services provided in public facilities and excludes outpatient prescription medicines, so its protective effect may be relatively limited.
Only two countries in the study – Czechia and Germany – cap all co-payments. The cap in Germany is set at 2% of gross income per person per year, lowered to 1% for people who can demonstrate that they have a chronic condition; it must be applied for on an annual basis, however (Siegel & Busse, 2018). In Czechia, the cap was originally set as a fixed amount for everyone, but very few people reached it; in 2009 a lower cap was therefore introduced for children aged under 18 years and people aged 65 years and over (Kandilaki, in press).
2004 / 2005 2009 / 2010
Ou
t-o
f-p
ock
et p
aym
ents
(%
)
Fig. 39. Breakdown of out-of-pocket payments by health service among households with catastrophic health spending in the poorest consumption quintile in Austria
Medical products
Catastrophic incidence
Dental care
Outpatient care
Medicines
Diagnostic tests
Inpatient care100
80
60
0
20
40
Ca
tast
rop
hic
inci
den
ce (
%)
10
8
6
0
2
4
Notes: diagnostic tests include other paramedical services. Medical products include non-medicine products and equipment including (in these two time periods) dental products.
Source: Czypionka et al. (2018).
2.12% 2.09%
Can people afford to pay for health care in Europe? 92

Low fixed co-payments rather than percentage co-payments
When user charges are in the form of percentage co-payments, people must pay a share of the service price out of pocket. Percentage co-payments have several disadvantages in comparison to fixed co-payments.
• People’s exposure to out-of-pocket payments will depend on the price of the services they require.
• Unless the price is clearly known in advance, people may face uncertainty about how much they have to pay out of pocket.
• People with illnesses that require more expensive treatment will have to pay more out of pocket than those with illnesses that can be treated more cheaply, which may be perceived as unfair.
The disadvantages of percentage co-payments are magnified when:
• prices vary, as is the case for medicines;
• medicine prices are relatively high (e.g. due to inadequate price regulation) or prone to fluctuation (e.g. when there is reliance on imports);
• inefficiencies in health service delivery lead to inappropriate use – for example, doctors and pharmacists are not required or do not have incentives to prescribe and dispense cheaper alternatives (e.g. generic and biosimilar medicines); and
• exemptions and caps are not in place (or any other effective protection mechanism, such as VHI covering co-payments for all those who incur co-payments).
In contexts where prices are not carefully regulated and steps to ensure appropriate prescribing and dispensing are inadequate, percentage co-payments will shift financial risk from the purchasing agency onto households, with a particularly punitive effect on poorer people and regular users of health services. With low fixed co-payments, financial risk is largely borne by the purchasing agency, so people are less directly exposed to health system inefficiencies.
Many countries use percentage co-payments, particularly for outpatient medicines (see Table 6). Box 4 discusses some of the reasons why countries apply percentage co-payments in spite of their disadvantages.
Several of the high-income countries in the study use low fixed co-payments for outpatient medicines, enhancing transparency and equity. In Austria, Croatia, Czechia, Slovakia and the United Kingdom, fixed co-payments for medicines apply to all households. In Cyprus and Ireland, they only apply to poorer people and selected groups of people based on age and health status.
93The story behind the numbers: user charges (co-payments)

Fig. 25 shows how the incidence of catastrophic health spending varies across two countries – Poland and Slovakia – with the same share of total spending on health out of pocket, similar levels of poverty (Fig. 9) and similarities in the extent of user charges, which are mainly applied to outpatient medicines in both countries (Table 6). Catastrophic incidence is relatively low in Slovakia (3.5%) and much higher in Poland (8.6%). There is only one obvious difference in health coverage: Slovakia uses very low fixed co-payments for outpatient medicines (€0.17 per prescription plus reference pricing), with an annual cap (Fig. 35), while Poland uses percentage co-payments instead, with no exemptions for poor people and without a cap (Pourová, in press; Tambor & Pavlova, in press).
Box 4. Why do countries use percentage co-payments?
Countries may use percentage co-payments for the following reasons.
First, they are a hangover from the days of retrospective reimbursement in social insurance systems, when patients would pay providers themselves, and purchasing agencies would reimburse both patients and providers based on an agreed percentage split between the two. The use of percentage co-payments is out of keeping with efforts to move towards strategic purchasing involving prospective payment of providers and the provision of benefits in kind to patients. Today, very few countries retrospectively reimburse patients (OECD, 2019a).
Second, purchasing agencies may believe that exposing people to the price of a good or service will encourage them to choose cheaper alternatives. This is questionable when applied to goods and services prescribed by health professionals, particularly given the extent of information asymmetry in health care markets. It shifts financial risk from the purchasing agency onto households, which is likely to be particularly damaging to patients in contexts where the supply of health services, including medicines and other goods, is not adequately monitored and regulated.
Third, linking reimbursement to a percentage of price gives purchasing agencies flexibility to reduce coverage when there is a budget constraint – in other words, to shift more of the cost onto households. The same can be done with fixed co-payments, but changes to percentage co-payments may be less visible to the public.
All three reasons put the financial perspective of purchasing agencies above the interests of patients.
Can people afford to pay for health care in Europe? 94

The importance of people-centred co-payment design
In many countries in Europe, co-payment design is complex and protection mechanisms may involve bureaucratic processes – for example, some countries:
• use a mix of fixed co-payments and percentage co-payments, with multiple rates of reimbursement;
• apply exemptions to particular types of medicine or medicines for specific conditions rather than to people;
• apply caps to specific items or services rather than to people over time; and
• require people to apply retrospectively to benefit from caps and enhanced coverage, and provide extensive supporting documentation.
Complex or bureaucratic design – especially a narrow focus on exempting specific items or services rather than exempting groups of people, or on capping spending on specific items or services rather than capping spending over time – may confuse people and undermine the effectiveness of protection mechanisms.
A better approach is to focus on people and design protection around people rather than around items and services. This will be particularly beneficial for people with one or more chronic illnesses, who are likely to be users of multiple services.
Some of the countries in the study are taking steps to simplify and strengthen co-payment policy. Estonia sets a threshold for out-of-pocket payments for selected prescription items; once this threshold has been reached, the percentage co-payment is reduced (Võrk & Habicht, 2018). Initially, people were required to apply for the benefit retrospectively, and could only do so four times a year. In 2018, the system was simplified so that the reduced co-payment is calculated and applied automatically in the pharmacy, through an information technology system. The threshold was also reduced from €500 to €300. Both measures are likely to improve financial protection.
95The story behind the numbers: user charges (co-payments)

Key messages on user charges (co-payments)
• Co-payment design is a key factor influencing financial protection. It is the most important factor in countries where financial hardship is driven by outpatient medicines and the scope of the benefits package is adequate.
• Co-payment design largely determines the extent and distribution of out-of-pocket payments for covered services. It can protect people from or expose them to health system inefficiencies and financial risk.
• Exemptions for poor people are the single most effective design feature in terms of access and financial protection. All countries can and should exempt poor people, beginning with people receiving social benefits, a group that is administratively relatively easy for the health system to identify.
• Caps also protect people if they are applied to all co-payments over time rather than narrowly focused on specific items or types of service – and if they are low enough. Ideally, they should be set as a very low share of household income. Caps alone are unlikely to be sufficient to protect poor people, however.
• In contrast to low fixed co-payments, percentage co-payments shift financial risk from purchasing agency to households and expose people to health system inefficiencies. This is particularly problematic in contexts where pricing, prescribing and dispensing are not adequately controlled.
• Co-payment policy should pay attention to all three design features (exemptions, caps and type of co-payment); be designed around people rather than around items, services or diseases; and be as simple as possible to minimize confusion and enhance transparency.
• User charges are not an effective rationing instrument due to strong and consistent evidence that they reduce necessary and unnecessary use in equal measure. Most decisions about health-care use and costs are made by health-care providers.
Can people afford to pay for health care in Europe? 96

The role of VHIIn most countries, VHI exacerbates inequalities in access to health care rather than reducing them, because VHI is consistently more likely to be taken up by richer households (Sagan & Thomson, 2016).
Private insurance is only shown to be protective at health system level where it explicitly covers user charges and also covers most of the population, including most poor people (Sagan & Thomson, 2016).
Only three countries in Europe (and indeed globally) meet these conditions: Croatia, France and Slovenia. Table 8 shows how VHI covering co-payments in these countries achieves very high rates of take up, covering over 80% of those who have to pay co-payments in Croatia, around 90% of the population in France and around 95% of those with compulsory health insurance in Slovenia.
Table 8. Policy measures to enable high take up of VHI covering co-payments
Take up of complementary VHI
VHI is accessible VHI is affordable
Croatia 64% of the population; a further 20% of the population is exempt from user charges (children under 18 years, severely disabled people, war veterans and their families)
Open enrolment in the Croatian Health Insurance Fund (HZZO), which covers nearly all those with VHI covering co-payments
Community-rated premiums in HZZO
Free VHI for 20% of the population in 2015: poor people, disabled people not exempt from co-payments, students aged over 18 years, and organ and blood donors
France 90% of the population VHI policies that limit cover of pre-existing conditions and consider risk of ill health are subject to a 7% premium tax
Free VHI for very poor people (around 7% of the population in 2011)
Vouchers subsidizing VHI for the near poor
Free VHI and vouchers are partly financed by a tax on the turnover of all insurers selling VHI
Slovenia 95% of those with compulsory health insurance; a further 2.5% of the population is exempt from co-payments (people receiving social assistance benefits)
Open enrolment in all insurers
Community-rated premiums in all insurers, supported by a risk equalization scheme
Sources: Sagan & Thomson (2016), Vončina & Rubil (2018), Zver et al. (in press), Bricard (in press).
97The story behind the numbers: the role of VHI

These high levels of take up can be attributed to the following factors.
• People need VHI covering co-payments because user charges are widely applied in all three countries and are in the form of percentage co-payments for secondary care, meaning that people have to pay 20% of the cost of inpatient care. Although there are caps in place for inpatient care (France) and secondary care (Croatia), these caps are set at a high level; many households would face financial hardship before reaching them.
• VHI covering co-payments is accessible to all those who want to purchase it due to regulation in Croatia and Slovenia (open enrolment plus community-rated premiums) and tax subsidies targeting poorer people in France.
• VHI covering co-payments is affordable for most people because it is free for very poor people in Croatia and France. In Slovenia, very poor people are exempt from co-payments and do not need VHI.
As a result of high take up of VHI covering co-payments, the incidence of catastrophic health spending is very low in Slovenia (1%) and France (2%), and low in Croatia (4%) given Croatia’s relatively low level of GDP.
Even so, VHI premiums can pose problems of affordability for households and undermine equity in financing. In both France and Slovenia, the distribution of VHI premiums across consumption quintiles is highly regressive, as shown in Fig. 40. In Croatia VHI premiums are more evenly distributed across quintiles, but households in the poorest quintile spend the same share of their budget on VHI as households in higher quintiles (Fig. 40).
One reason why VHI premiums do not account for a higher budget share among the poorest quintile in Croatia, in contrast to the other two countries, is that the government pays for VHI covering co-payments for 20% of the population (nearly 1 million people in 2015), with a further 20% of the population exempt from co-payments and not needing VHI (Vončina & Rubil, 2018). This compares to only around 7% of the population eligible for free VHI in France in 2011 (around 4.5 million people) (Bricard, in press), while only 2.5% of the population in Slovenia is exempt from co-payments and has no need for VHI (Zver et al., in press). In Croatia, the share of households paying for VHI is also much lower in the poorest quintile (37%) than in the richest quintile (76%).
The experience of these three countries suggests that VHI covering co-payments is not an equitable or efficient way of improving financial protection. Equity in financing is undermined by the high financial burden imposed on poor households compared to rich households, even where VHI is free for very poor people. Efficiency is undermined not only by the high administrative costs incurred by private insurers in all three countries compared to entities providing compulsory health insurance, but also by the high – and sometimes hidden – transaction costs involved in regulating a complex market (Sagan & Thomson, 2016).
Can people afford to pay for health care in Europe? 98
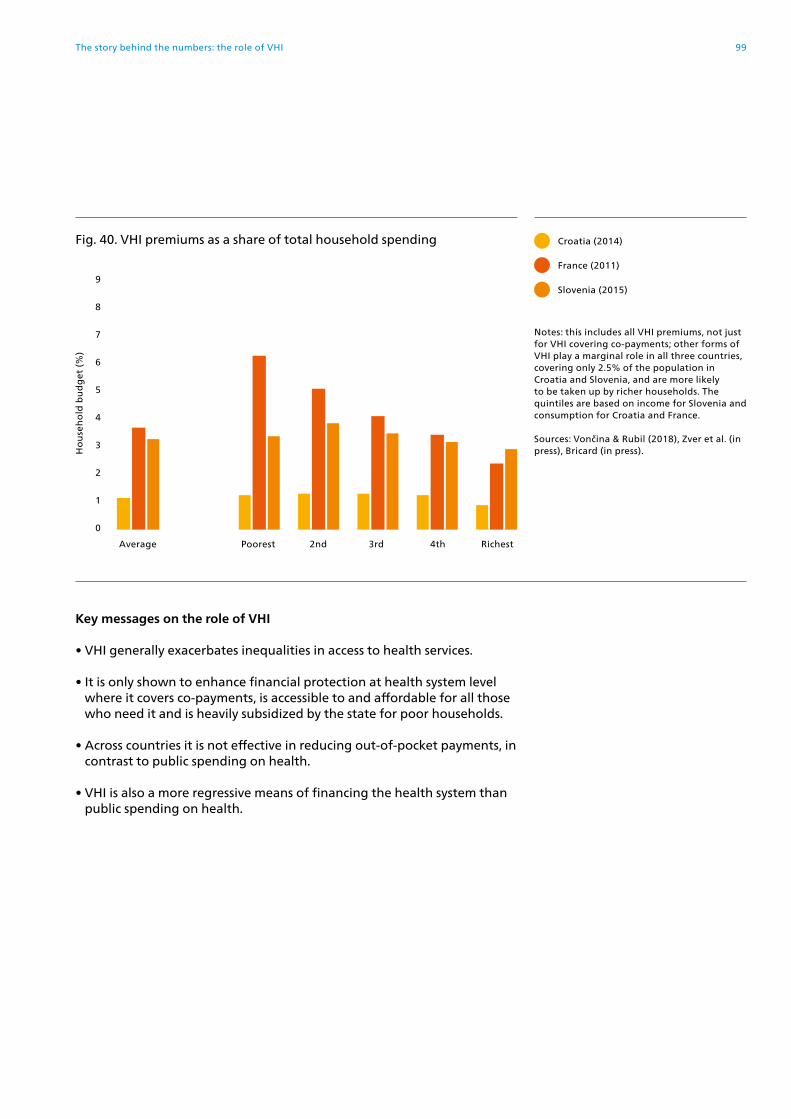
Key messages on the role of VHI
• VHI generally exacerbates inequalities in access to health services.
• It is only shown to enhance financial protection at health system level where it covers co-payments, is accessible to and affordable for all those who need it and is heavily subsidized by the state for poor households.
• Across countries it is not effective in reducing out-of-pocket payments, in contrast to public spending on health.
• VHI is also a more regressive means of financing the health system than public spending on health.
France (2011)
Croatia (2014)
Slovenia (2015)
Ho
use
ho
ld b
ud
get
(%
)
5
4
7
9
8
6
2
3
1
0
Fig. 40. VHI premiums as a share of total household spending
Notes: this includes all VHI premiums, not just for VHI covering co-payments; other forms of VHI play a marginal role in all three countries, covering only 2.5% of the population in Croatia and Slovenia, and are more likely to be taken up by richer households. The quintiles are based on income for Slovenia and consumption for Croatia and France.
Sources: Vončina & Rubil (2018), Zver et al. (in press), Bricard (in press).
Average Poorest 2nd 3rd 4th Richest
99The story behind the numbers: the role of VHI

Gaps in coverage in European health systems
Table 9 summarizes the main gaps in coverage in European health systems.
Table 9. Gaps in coverage in European health systems
Policy area Issues in the governance of publicly financed coverage
Main gaps in publicly financed coverage
Are these gaps covered by VHI?
Population entitlement
Entitlement based on employment or payment of contributions rather than residence
Entitlement may also vary based on income, age or health status Limited entitlement for migrants
People of working age, particularly unemployed people, self-employed people and those lacking stable employment
Migrants
No; VHI may be available but is unlikely to be affordable for these groups of people
The benefits package
Benefits package too narrow to meet population health needs
Benefits package not supported by adequate levels of public spending on health resulting in unfunded mandates, implicit rationing and informal payments
No or limited processes in place to set priorities, and no or limited use of health technology assessments and other tools to identify cost-effective services
Referral systems lacking or inadequately regulated; inadequate oversight of prescribing and dispensing of medicines; provider incentives not aligned across the system
Lack of waiting time guarantees
Dental care for adults
Medical products
Outpatient medicines, including recommended or prescribed over-the-counter medicines
Long waiting times for specialist consultations and inpatient care
Issues with supply and quality push people to use private providers
VHI covers dental care in some countries, but those unable to afford dental care are unlikely to buy VHI
Very few VHI products are designed to cover outpatient medicines
VHI provides faster access to treatment in many countries
However, VHI is mainly taken up by people in higher socioeconomic groups, which exacerbates inequalities in access to health services
User charges (co-payments)
Weak design of co-payment policy: no exemptions for poor people and regular users; no or inadequate caps; percentage co-payments rather than low fixed co-payments
Balance billing is permitted
Extra billing is not well regulated
Outpatient prescription medicines
Dental care
VHI covering co-payments exists in several countries but only covers most of those who need protection in Croatia, France and Slovenia; even in these countries there are gaps in VHI coverage
Sources: authors and Sagan & Thomson (2016).
Can people afford to pay for health care in Europe? 100

Acting on the evidence

Implications for policy
Monitoring financial protection provides valuable evidence
Out-of-pocket payments can create a financial barrier to access, resulting in unmet need, and lead to financial hardship among people using health services.
To assess progress towards universal health coverage requires more than monitoring access: it is equally important to monitor financial protection.
This report is the first to systematically monitor both unmet need and financial protection in Europe, filling a significant gap in health system performance assessment.
The report shows that financial hardship varies widely in Europe, and that there is room for improvement even in high-income countries that provide the whole population with access to publicly financed health services.
It has confirmed a strong association, across countries, between the incidence of catastrophic health spending by households and the out-of-pocket payment share of current spending on health at country level.
This suggests that the out-of-pocket payment share of current spending on health can be used as a proxy indicator for financial protection when data on financial hardship are not available.
However, aggregate data on out-of-pocket payments do not provide the detail needed to guide policy.
Producing actionable evidence on financial protection requires analysis of household-level data to be combined with context-specific policy analysis.
This report is based on country-level analysis that links indicators of financial protection and unmet need to national policies and policy changes over time.
To monitor catastrophic health spending, it uses a metric that is more sensitive than the SDG metric to track financial hardship experienced by poor households. The SDG metric applies the same effective threshold to all households. In contrast, the report’s metric acknowledges that poor households experience financial hardship after spending a smaller share of their resources on health than richer households.
Analysis of household-level data provides detailed evidence
The analysis of national household budget survey data presented in this report suggests that efforts to improve financial protection in Europe should be guided by the following findings.
• Catastrophic health spending is heavily concentrated among the poorest households in all of the countries in the study.
Can people afford to pay for health care in Europe? 102

• Where financial protection is relatively weak, catastrophic spending is mainly driven by out-of-pocket payments for outpatient medicines.
• Where financial protection is relatively strong, catastrophic spending tends to be driven by out-of-pocket payments for dental care.
• Out-of-pocket payments for dental care lead to financial hardship for richer people and unmet need for poorer people.
• Out-of-pocket payments for outpatient medicines result in financial hardship and unmet need for poorer households.
• In all of the study countries, financial hardship among the poorest households is driven by spending on outpatient medicines.
Country-level policy analysis provides actionable evidence
The policy analysis in this report finds that health systems with strong financial protection and low levels of unmet need share the following features:
• there are no large gaps in health coverage;
• coverage policy – the way in which coverage is designed, implemented and governed – is carefully designed to minimize access barriers and out-of-pocket payments, particularly for poor people and regular users of health services;
• public spending on health is high enough to ensure relatively timely access to a broad range of health services without informal payments; and as a result
• out-of-pocket payments are low, accounting for less than or close to 15% of current spending on health.
Gaps in coverage arise from weaknesses in the design of three policy areas: population entitlement, the benefits package and user charges (co-payments). Weaknesses in coverage policy undermine equity and efficiency by:
• creating financial barriers to access;
• shifting the financial burden of paying for health care on to those who can least afford it – poor people and regular users of health services; and
• encouraging inefficient patterns of use.
Table 10 summarizes actions that have the potential to improve financial protection by strengthening coverage policy. It also highlights actions that should be avoided. These actions are relevant to the whole WHO European Region.
103Acting on the evidence

Table 10. Actions that strengthen or weaken coverage policy
Actions that strengthen coverage policy Actions that weaken coverage policy
Population entitlement
Make every effort to cover the whole population; there is no economic case for excluding any groups of people, including rich people.
Make adequate provision for undocumented migrants.
Ensure people are aware of their entitlements.
Do not base entitlement on employment or payment of contributions because this:• disproportionately affects people in the informal economy and those
lacking stable employment;• is unlikely to enhance tax compliance; and• may encourage informality if people do not value being covered.
Do not split the benefits package into basic and comprehensive baskets with entitlement dependent on who has paid (more) contributions; splitting the benefits package exacerbates inequalities and encourages inefficient patterns of use.
The benefits package
Develop transparent processes for setting priorities to respond to population health needs; these should balance social values and economic factors.
Draw on evidence to inform priority-setting processes, including burden of disease studies, health technology assessments and the WHO Essential Medicines List.
Pay attention to non-covered services such as over-the-counter medicines; non-covered services can be a source of financial hardship.
Do not offer a benefits package that is not adequately supported by public funding; so-called unfunded mandates often lead to implicit rationing and informal payments, restricting the health system’s ability to protect poor people and regular users of care, and undermining trust.
Do not view outpatient medicines, medical products and dental care as luxuries:• they are a core component of treatment in primary care;• poor vision leads to falls; and• poor oral health is linked to systemic diseases.
User charges (co-payments)
Exempt poor people and regular users of health services; exemptions should focus on people rather than products or interventions.
Cap co-payments per person; ideally, the cap should be set as a share of household income.
Replace percentage co-payments with low fixed co-payments.
Ensure co-payment policy is as simple as possible.
Do not use co-payment policy to discourage inappropriate use of health care; strong and consistent evidence shows user charges are a blunt instrument, reducing inappropriate and appropriate use in equal measure, but with greater adverse effects on the poor and regular users of health care.
Do not use percentage co-payments because they:• shift the financial burden onto people with diseases that are more
expensive to treat;• make patients pay for inefficiencies in the health system; and• may be used as a means of balancing the health budget at the
expense of those who cannot afford to pay.
Do not allow providers to charge people more than the formal tariff (balance billing).
The role of VHI
Lower expectations about the potential for VHI to meet universal health coverage goals.
Do not rely on VHI to address gaps in coverage because it generally exacerbates inequalities in access and financial protection; in the rare instances where VHI meets universal health coverage goals, it requires public subsidies exclusively targeting poor people, regulation and capacity to oversee the market.
Do not offer tax incentives or subsidies for VHI unless subsidies exclusively target poor households.
Source: WHO Regional Office for Europe.
Can people afford to pay for health care in Europe? 104

How can countries ensure efforts to reduce unmet need and financial hardship are successful?
To be effective, changes to coverage policy must be supported by an adequate level of public spending on health. Extending coverage to more people or adding health services to the benefits package without additional financial support is likely to result in implicit rationing – informal payments or service delay, dilution or denial.
Enhancing efficiency allows countries to do more with available resources. Only in a very few instances, however, does it have a direct impact on financial protection. These include efforts to reduce prices where people pay percentage co-payments or there is reference pricing in place; and reducing hospital fixed costs where there is excess capacity, hospitals are underfunded and any savings gained are reinvested and reduce informal payments. Without efforts to strengthen coverage policy, efficiency gains may not reach those most in need of financial protection.
Three related factors should also guide policy changes: a country’s starting point, the sequencing of policy and the ability to be selective.
The actions countries take will reflect their starting point. Countries in which the out-of-pocket payment share of current spending on health is relatively high will need to invest more publicly in the health system to reduce out-of-pocket payments.
Increases in public spending or reductions in out-of-pocket payments do not, in themselves, guarantee better access and financial protection. In contexts where coverage policy is weak, simply increasing public spending might not be enough to improve outcomes for those most in need. The sequencing of policy is therefore important. Some countries will need to redesign coverage policy at the same time as seeking additional public investment in the health system.
Countries will need to be selective, giving priority to improving financial protection for those who need it most. Taking steps to benefit the most disadvantaged people first – an approach known as progressive universalism (Gwatkin & Ergo, 2011) – is vital in contexts where public resources are severely limited. It also offers advantages in countries that do not face a severe budget constraint, enabling them to meet the challenge of leaving no one behind by ensuring that poor people gain at least as much as those who are better off at every step on the path to universal health coverage.
Progressive universalism rests on the ability to identify the health services most likely to lead to financial hardship, the people most likely to be affected and the root causes of gaps in coverage. This in turn requires indicators and metrics amenable to equity analysis, like the ones used in this report.
There is a wealth of good practice in Europe. Lessons can be learned from countries with strong financial protection and from countries where financial protection is weak overall but steps have been taken to protect poor people.
105Acting on the evidence

References
Allin S, Grignon M, Le Grand J (2009). Subjective unmet need and utilization of health care services in Canada: what are the equity implications? Soc Si Med. 70:465–72 (https://www.ncbi.nlm.nih.gov/pubmed/19914759).1
Allin S, Masseria C (2009). Unmet need as an indicator of health care access. Eurohealth 15:7–9 (http://www.euro.who.int/en/about-us/partners/observatory/publications/eurohealth/previous-issues/back-issues-volumes-12-20-2006-2014/measuring-and-tackling-health-inequalities-across-europe).
Arora V, Karanikolos M, Clair A, Reeves A, Stuckler D, McKee M (2015). Data resource profile: the European Union Statistics on Income and Living Conditions (EU-SILC). Int J Epidemiol. 44:451–461. doi:10.1093/ije/dyv069.
Arsenijevic J, Pavlova M, Rechel B, Groot W (2016). Catastrophic Health Care Expenditure among Older People with Chronic Diseases in 15 European Countries. PLoS ONE [Internet].11(7) (http://journals.plos.org/plosone/article?id=10.1371/journal.pone.0157765).
Baird K (2016). High Out-of-Pocket Medical Spending among the Poor and Elderly in Nine Developed Countries. Health Serv Res. 51(4):1467–88.
Benach J, Vanroelen C, Vives A, De Witte H, Puig-Barrachina V, Belvis-Costes F, et al. (2013). Quality of employment conditions and employment relations in Europe. Dublin: Eurofound.
Bredenkamp C, Mendola M, Gragnolati M (2011). Catastrophic and impoverishing effects of health expenditure: new evidence from the Western Balkans. Health Policy Plan. 26(4):349–56.
Bricard D (in press). Can people afford to pay for health care? New evidence on financial protection in France. Copenhagen: WHO Regional Office for Europe.
Chevreul K, Berg Brigham K, Durand-Zaleski I, Hernández-Quevedo C (2015). France. Health system review. Health Systems in Transition. 17(3):1–218 (http://www.euro.who.int/en/about-us/partners/observatory/publications/health-system-reviews-hits/full-list-of-country-hits/france-hit-2015).
Chletsos M, Economou C, O’Donnell O (in press). Can people afford to pay for health care? New evidence on financial protection in Greece. Copenhagen: WHO Regional Office for Europe.
Cooke O’Dowd N, Kumpunen S, Holder H (2018). Can people afford to pay for health care? New evidence on financial protection in the United Kingdom. Copenhagen: WHO Regional Office for Europe (http://www.euro.who.int/en/health-topics/Health-systems/health-systems-financing/publications/2018/can-people-afford-to-pay-for-health-care-new-evidence-on-financial-protection-in-the-united-kingdom-2018).
1. All websites accessed on 13 March 2019.
Can people afford to pay for health care in Europe? 106
Cylus J, Thomson S, Evetovits T (2018). Catastrophic health spending in Europe: equity and policy implications of different calculation methods. Bull World Health Organ. 96:589–664 (http://www.euro.who.int/en/health-topics/Health-systems/health-systems-financing/publications/2018/catastrophic-health-spending-in-europe-equity-and-policy-implications-of-different-calculation-methods-2018).
Czypionka T, Röhrling G, Six E (2018). Can people afford to pay for health care? New evidence on financial protection in Austria. Copenhagen: WHO Regional Office for Europe (http://www.euro.who.int/en/health-topics/Health-systems/health-systems-financing/publications/2018/can-people-afford-to-pay-for-health-care-new-evidence-on-financial-protection-in-austria-2018).
Deaton A (1997). The analysis of household surveys: a microeconometric approach to development policy. Washington (DC): World Bank.
Deaton A, Zaidi S (2002). Guidelines for Constructing Consumption Aggregates for Welfare Analysis. Washington (DC): World Bank (Living Standards Measurement Study (LSMS) Working Paper No. 135).
Dmytraczenko T, Almeida G, editors (2015). Toward Universal Health Coverage and Equity in Latin America and the Caribbean. Evidence from Selected Countries. Washington (DC): World Bank (https://openknowledge.worldbank.org/handle/10986/22026).
Economou C (2015). Barriers and facilitating factors in access to health services in Greece. Copenhagen: WHO Regional Office for Europe (http://www.euro.who.int/en/countries/greece/publications/barriers-and-facilitating-factors-in-access-to-health-services-in-greece-2015).
Economou C, Kaitelidou D, Karanikolos M, Maresso A (2017). Greece: Health system review. Health Systems in Transition. 19(5):1–192 (http://www.euro.who.int/en/about-us/partners/observatory/publications/health-system-reviews-hits/full-list-of-country-hits/greece-hit-2017).
European Parliament (2016). Precarious employment in Europe. Brussels: European Union (http://www.europarl.europa.eu/RegData/etudes/STUD/2016/587285/IPOL_STU(2016)587285_EN.pdf).
Eurostat (2015). Household Budget Survey 2010 Wave EU Quality report. Brussels: Eurostat (http://ec.europa.eu/eurostat/documents/54431/1966394/LC142-15EN_HBS_2010_Quality_Report_ver2+July+2015.pdf/fc3c8aca-c456-49ed-85e4-757d4342015f).
Eurostat (2016). Regulation (EU) 2016/792 of the European Parliament and of the Council of 11 May 2016 on harmonised indices of consumer prices and the house price index, and repealing Council Regulation (EC) No 2494/95. O. J. E. U. L135/11:1–28 (https://eur-lex.europa.eu/legal-content/EN/TXT/PDF/?uri=CELEX:32016R0792&from=EN).
Eurostat (2018a). EU statistics on income and living conditions (EU-SILC) [online database]. Brussels: European Commission (http://ec.europa.eu/eurostat/web/income-and-living-conditions/data/main-tables).
107References

Eurostat (2018b). European Health Interview Survey [online database]. Brussels: European Commission (http://ec.europa.eu/eurostat/web/microdata/european-health-interview-survey).
Eurostat (2019). Data [online database]. Brussels: European Commission (https://ec.europa.eu/eurostat/data/database).
EXPH (2016). Access to health services in the European Union – final opinion. Brussels: European Commission (https://ec.europa.eu/health/expert_panel/sites/expertpanel/files/015_access_healthservices_en.pdf).
EXPH (2017). Opinion on benchmarking access to healthcare in the EU. Luxembourg: Publications Office of the European Union (https://ec.europa.eu/health/expert_panel/sites/expertpanel/files/docsdir/opinion_benchmarking_healthcareaccess_en.pdf).
Flores G, Krishnakumar J, O'Donnell O, van Doorslaer E (2008). Coping with health-care costs: implications for the measurement of catastrophic expenditures and poverty. Health Econ. 17:1393–412.
Foster J, Greer J, Thorbecke E (1984). A class of decomposable poverty measures. Econometrica 52(3):761–66.
Gaál P, McKee M (2004). Informal payment for health care and the theory of ‘inxit’. Int J Health Plann Manage. 19(2):163–78.
Garam I, Zadnipru M, Doronin V, Valac D, Negruta A, Matei A, Mosca I (in press). Can people afford to pay for health care? New evidence on financial protection in the Republic of Moldova. Copenhagen: WHO Regional Office for Europe.
Goginashvili K, Nadareishvili M (in press). Can people afford to pay for health care? New evidence on financial protection in Georgia. Copenhagen: WHO Regional Office for Europe.
Goroshko A, Shapoval N, Lai T (2018). Can people afford to pay for health care? New evidence on financial protection in Ukraine. Copenhagen: WHO Regional Office for Europe (http://www.euro.who.int/en/health-topics/Health-systems/health-systems-financing/publications/2018/can-people-afford-to-pay-for-health-care-new-evidence-on-financial-protection-in-ukraine-2018).
Gwatkin D, Ergo, A (2011). Universal health coverage: friend or foe of health equity. Lancet 377:P2160–1.
Heijink R, Xu K, Saksena P, Evans D (2011). Validity and Comparability of Out-of-pocket Health Expenditure from Household Surveys: A review of the literature and current survey instruments. Geneva: World Health Organization (HSS/HSF/DP.E.11.1; https://www.who.int/health_financing/documents/dp_e_11_01-oop_errors.pdf?ua=1).
Jakab M, Akkazieva B, Habicht J (2018). Can people afford to pay for health care? New evidence on financial protection in Kyrgyzstan. Copenhagen: WHO Regional Office for Europe (http://www.euro.
Can people afford to pay for health care in Europe? 108

who.int/en/health-topics/Health-systems/health-systems-financing/publications/2018/can-people-afford-to-pay-for-health-care-new-evidence-on-financial-protection-in-kyrgyzstan-2018).
Jakab M, Akkazieva B, Kutzin J (2016). Can reductions in informal payments be sustained? Evidence from Kyrgyzstan, 2001–2013. Copenhagen: WHO Regional Office for Europe (http://www.euro.who.int/en/health-topics/Health-systems/health-systems-financing/publications/2016/can-reductions-in-informal-payments-be-sustained-evidence-from-kyrgyzstan,-20012013-2016).
Kandilaki D (in press). Can people afford to pay for health care? New evidence on financial protection in Czechia. Copenhagen: WHO Regional Office for Europe.
Kontemeniotis A, Theodorou M (in press). Can people afford to pay for health care? New evidence on financial protection in Cyprus. Copenhagen: WHO Regional Office for Europe.
Kutzin J, Evetovits T (2007). Conceptual framework for analysing deficits, potential causes and sustainability trade-offs [presentation]. Policy Conference “Getting to the roots: linkages between health system performance and deficit spending”, 26–27 March 2007, Zagreb, Croatia.
Kutzin J, Cashin C, Jakab M, editors (2010). Implementing health financing reform: Lessons from countries in transition. Copenhagen: WHO Regional Office for Europe on behalf of the European Observatory on Health Systems and Policies (http://www.euro.who.int/en/health-topics/Health-systems/health-systems-financing/publications/2010/implementing-health-financing-reform-lessons-from-countries-in-transition-2010).
Kutzin J, Witter S, Jowett M, Bayarsaikhan D (2017). Developing a national health financing strategy: a reference guide. Geneva. World Health Organization (https://www.who.int/health_financing/tools/developing-health-financing-strategy/en/).
Lekhan VN, Rudiy VM, Shevchenko MV, Nitzan Kaluski D, Richardson E (2015). Ukraine: Health system review. Health Systems in Transition, 2015; 17(2):1–153 (http://www.euro.who.int/en/about-us/partners/observatory/publications/health-system-reviews-hits/full-list-of-country-hits/ukraine-hit-2015).
Maresso A, Mladovsky P, Thomson S, Sagan A, Karanikolos M, Richardson E et al., editors (2015). Economic crisis, health systems and health in Europe: country experience. Copenhagen: WHO Regional Office for Europe on behalf of the European Observatory on Health Systems and Policies (http://www.euro.who.int/en/about-us/partners/observatory/publications/studies/economic-crisis,-health-systems-and-health-in-europe-country-experience-2015).
MISSOC (2019). Mutual Information System on Social Protection Comparative Tables [online database]. Brussels, European Commission (https://www.missoc.org/missoc-database/comparative-tables/).
109References
Murauskienė L, Thomson S (2018). Can people afford to pay for health care? New evidence on financial protection in Lithuania. Copenhagen: WHO Regional Office for Europe. (http://www.euro.who.int/en/health-topics/Health-systems/health-systems-financing/publications/2018/can-people-afford-to-pay-for-health-care-new-evidence-on-financial-protection-in-lithuania-2018).
Murray C, Frenk J (2000). A framework for assessing the performance of health systems. Bull World Health Organ. 78:717–31 (https://apps.who.int/iris/handle/10665/57320).
O’Donnell O, van Doorslaer E, Wagstaff A, Lindelow M (2008). Analyzing health equity using household survey data: a guide to techniques and their implementation. Washington (DC): World Bank Publications (http://siteresources.worldbank.org/INTPAH/Resources/Publications/459843-1195594469249/HealthEquityFINAL.pdf).
OECD (2019a). Health systems characteristics survey 2016 [online database]. Paris: Organisation for Economic Co-operation and Development (https://qdd.oecd.org/subject.aspx?Subject=hsc).
OECD (2019b). OECD Health Statistics 2018 [online database]. Paris: Organisation for Economic Co-operation and Development (http://www.oecd.org/health/health-systems/health-data.htm).
OECD (in press). Health for everyone? Social inequalities in health and health systems. Paris: Organisation for Economic Co-operation and Development.
OECD, Eurostat, WHO (2017). A System of Health Accounts 2011: revised edition. Paris: Organisation for Economic Co-operation and Development.
Olsthoorn M. (2014). Measuring Precarious Employment: A Proposal for Two Indicators of Precarious Employment Based on Set-Theory and Tested with Dutch Labor Market-Data. Soc Indic Res. 119(1):421–41.
Pagés C, Rigolini J, Robalino D (2013). Social Insurance, Informality and Labor Markets: How to Protect Workers While Creating Good Jobs. Bonn: Institute for the Study of Labor (http://ftp.iza.org/dp7879.pdf).
Palladino R, Lee JT, Hone T, Filippidis FT, Millett C (2016). The Great Recession and Increased Cost Sharing in European Health Systems. Health Aff (Millwood). 35(7):1204–13.
Papanicolas I, Smith P, editors (2013). Health system performance comparison. An agenda for policy, information and research. Copenhagen: WHO Regional Office for Europe on behalf of the European Observatory on Health Systems and Policies (http://www.euro.who.int/en/about-us/partners/observatory/publications/studies/health-system-performance-comparison.-an-agenda-for-policy,-information-and-research-2013).
Pourová M (in press). Can people afford to pay for health care? New evidence on financial protection in Slovakia. Copenhagen: WHO Regional Office for Europe.
Can people afford to pay for health care in Europe? 110

Richardson E, Berdzuli N (2017). Georgia: Health system review. Health Systems in Transition, 2017; 19(4):1–90 (http://www.euro.who.int/en/about-us/partners/observatory/publications/health-system-reviews-hits/full-list-of-country-hits/georgia-hit-2017).
Sagan A, Thomson S (2016). Voluntary health insurance in Europe: role and regulation. Copenhagen: WHO Regional Office for Europe on behalf of the European Observatory on Health Systems and Policies (http://www.euro.who.int/en/health-topics/Health-systems/health-systems-financing/publications/2016/voluntary-health-insurance-in-europe-role-and-regulation-2016).
Saksena P, Hsu J, Evans DB (2014). Financial Risk Protection and Universal Health Coverage: Evidence and Measurement Challenges. PLoS Med [Internet]. 11(9) (http://journals.plos.org/plosmedicine/article?id=10.1371/journal.pmed.1001701).
Scheil-Adlung X, Bonan J (2013). Gaps in social protection for health care and long-term care in Europe: Are the elderly faced with financial ruin? Int Soc Secur Rev. 66(1):25–48.
Schreyogg J, Stargardt T, Velasco-Garrido M, Busse R (2005). Defining the “Health Benefit Basket” in nine European countries. Evidence from the European Union Health BASKET Project. Eur J Health Econ. 6(Suppl 1):2–10 (https://www.ncbi.nlm.nih.gov/pmc/articles/PMC1388078/).
Siegel M, Busse R (2018). Can people afford to pay for health care? New evidence on financial protection in Germany. Copenhagen: WHO Regional Office for Europe (http://www.euro.who.int/en/health-topics/Health-systems/health-systems-financing/publications/2018/can-people-afford-to-pay-for-health-care-new-evidence-on-financial-protection-in-germany-2018).
Smith O, Nguyen (2013). Getting better: improving health system outcomes in Europe and Central Asia. Europe and Central Asia Reports. Washington(DC): World Bank Group (http://documents.worldbank.org/curated/en/953751468250295078/Getting-better-improving-health-system-outcomes-in-Europe-and-Central-Asia).
Smith P, Mossialos E, Papanicolas I, Leatherman S, editors (2009). Performance Measurement for Health System Improvement: Experiences, Challenges and Prospects. Cambridge: Cambridge University Press (http://www.euro.who.int/en/about-us/partners/observatory/publications/studies/performance-measurement-for-health-system-improvement-experiences,-challenges-and-prospects-2009).
Spencer S, Hughes V (2015). Outside and In: Legal Entitlements to Health Care and Education for Migrants with Irregular Status in Europe. Oxford: University of Oxford's Centre on Migration, Policy and Society (COMPAS).
Swartz K (2010). Cost-sharing: Effects on spending and outcomes. Princeton: Robert Wood Johnson Foundation (Research Synthesis Report No. 20; https://pdfs.semanticscholar.org/ca7c/49c9b664c681ed836aa38b913a37a35e0004.pdf).
111References

Tambor M, Pavlova M (in press). Can people afford to pay for health care? New evidence on financial protection in Poland. Copenhagen: WHO Regional Office for Europe.
Taube M, Vaskis E, Nesterenko O (2018). Can people afford to pay for health care? New evidence on financial protection in Latvia. Copenhagen: WHO Regional Office for Europe. (http://www.euro.who.int/en/health-topics/Health-systems/health-systems-financing/publications/2018/can-people-afford-to-pay-for-health-care-new-evidence-on-financial-protection-in-latvia-2018).
Thomson S, Evetovits T, Cylus J (2018). Financial protection in high-income countries. A comparison of the Czech Republic, Estonia and Latvia. Copenhagen: WHO Regional Office for Europe (http://www.euro.who.int/en/health-topics/Health-systems/health-systems-financing/publications/2018/financial-protection-in-high-income-countries.-a-comparison-of-the-czech-republic,-estonia-and-latvia-2018).
Thomson S, Evetovits T, Cylus J, Jakab M (2016). Monitoring financial protection to assess progress towards universal health coverage in Europe. Public Health Panorama 2(3):357–66 (http://www.euro.who.int/en/publications/public-health-panorama/journal-issues/volume-2,-issue-3,-september-2016/original-research2).
Thomson S, Figueras J, Evetovits T, Jowett M, Mladovsky P, Maresso A, et al. (2015). Economic crisis, health systems and health in Europe: impact and implications for policy. Maidenhead: Open University Press (http://www.euro.who.int/en/health-topics/Health-systems/health-systems-financing/publications/2015/economic-crisis,-health-systems-and-health-in-europe.-impact-and-implications-for-policy-2015).
United Nations (2015). Transforming our World: the 2030 Agenda for Sustainable Development. New York (NY): United Nations (https://sustainabledevelopment.un.org/post2015/transformingourworld/publication).
United Nations (2016a). Leaving no one behind: the imperative of inclusive development. Report on the World Social Situation 2016. New York (NY): United Nations (https://www.un.org/esa/socdev/rwss/2016/full-report.pdf).
United Nations (2016b). The Sustainable Development Goals Report 2016. New York (NY): United Nations (https://unstats.un.org/sdgs/report/2016/The%20Sustainable%20Development%20Goals%20Report%202016.pdf).
UNSD (2018). Classification of Individual Consumption According to Purpose (COICOP). New York (NY): United Nations Statistics Division (https://unstats.un.org/unsd/iiss/Classification-of-Individual-Consumption-According-to-Purpose-COICOP.ashx).
Can people afford to pay for health care in Europe? 112

Vončina L, Rubil I (2018). Can people afford to pay for health care? New evidence on financial protection in Croatia. Copenhagen: WHO Regional Office for Europe (http://www.euro.who.int/en/health-topics/Health-systems/health-systems-financing/publications/2018/can-people-afford-to-pay-for-health-care-new-evidence-on-financial-protection-in-croatia-2018).
Võrk A, Habicht T (2018). Can people afford to pay for health care? New evidence on financial protection in Estonia. Copenhagen: WHO Regional Office for Europe (http://www.euro.who.int/en/health-topics/Health-systems/health-systems-financing/publications/2018/can-people-afford-to-pay-for-health-care-new-evidence-on-financial-protection-in-estonia-2018).
Wagstaff A, Eozenou P (2014). CATA meets IMPOV: a unified approach to measuring financial protection in health. Washington (DC): World Bank (Policy Research Working Paper No. 6861).
Wagstaff A, Flores G, Hsu J, Smitz M-F, Chepynoga K. Buisman L, et al. (2017). Progress on catastrophic health spending in 133 countries: a retrospective observational study. Lancet 6(2):PE169–79.
Wagstaff A, van Doorslaer E (2003). Catastrophe and impoverishment in paying in health care: with applications to Vietnam 1993-98. Health Econ. 2(11):921–34.
Wagstaff A, van Doorslaer E, van der Burg H, Calonge S, Christiansen T, Citoni G, et al. (1999). Equity in the finance of health care: some further international comparisons. J Health Econ. 18(3):263–90 (https://www.ncbi.nlm.nih.gov/pubmed/10537896).
Wang H, Torres LV, Travis P (2018). Financial protection analysis in eight countries in the WHO South-East Asia Region. Bull World Health Organ. 96:610–20E (https://www.who.int/bulletin/volumes/96/9/18-209858.pdf).
WHO (2000). The world health report. Health systems: improving performance. Geneva: World Health Organization (http://www.who.int/whr/2010/en/).
WHO (2008). The world health report. Primary health care: now more than ever. Geneva: World Health Organization (https://www.who.int/whr/2008/en/).
WHO (2010). The world health report. Health systems financing: the path to universal health coverage. Geneva: World Health Organization (http://www.who.int/whr/2010/en/).
WHO (2017). 20th Essential Medicines List. Geneva: World Health Organization (https://www.who.int/medicines/news/2017/20th_essential_med-list/en/).
WHO (2019a). Global Health Expenditure Database [online database]. Geneva: World Health Organization (http://apps.who.int/nha/database/Select/Indicators/en).
113References

WHO (2019b). Global Health Observatory (GHO) data [online database]. Geneva: World Health Organization (https://www.who.int/gho/en/).
WHO (2019c). Thirteenth general programme of work 2019−2023. Geneva: World Health Organization (http://apps.who.int/gb/ebwha/pdf_files/WHA71/A71_4-en.pdf?ua=1).
WHO, World Bank (2015). Tracking universal health coverage: first global monitoring report. Geneva: World Health Organization (https://www.who.int/healthinfo/universal_health_coverage/report/2015/en/).
WHO, World Bank (2017). Tracking universal health coverage: 2017 global monitoring report. Geneva: World Health Organization (http://www.who.int/healthinfo/universal_health_coverage/report/2017/en).
WHO Regional Office for Europe (2008). Tallinn Charter: Health Systems for Health and Wealth. Copenhagen: WHO Regional Office for Europe (http://www.euro.who.int/en/publications/policy-documents/tallinn-charter-health-systems-for-health-and-wealth).
WHO Regional Office for Europe (2018a). Addressing informal payments in the Greek health system. Copenhagen: WHO Regional Office for Europe (http://www.euro.who.int/en/countries/greece/publications/addressing-informal-payments-in-the-greek-health-system-2018).
WHO Regional Office for Europe (2018b). Medicines reimbursement policies in Europe. Copenhagen: WHO Regional Office for Europe (http://www.euro.who.int/en/health-topics/Health-systems/health-technologies-and-medicines/publications/2018/medicines-reimbursement-policies-in-europe).
WHO Regional Office for Europe (2019). Evaluation of the Affordable Medicines Programme in Ukraine. Copenhagen: WHO Regional Office for Europe (http://www.euro.who.int/en/countries/ukraine/publications/evaluation-of-the-affordable-medicines-programme-in-ukraine-2019).
WHO Regional Office for Europe, USAID, World Bank (2016). Summary of selected results from the Georgia Health Utilization and Expenditure Survey: 2010 and 2014. Unpublished data.
World Bank (2007). Kyrgyz Republic – Poverty assessment (Kyrgyz).Washington (DC): World Bank.
World Bank, WHO Regional Office for Europe, the Global Fund (2018). Georgia Health Utilization and Expenditure Survey 2017. Unpublished data.
WPRO (2017). Monitoring universal health coverage and health in the Sustainable Development Goals. Baseline Report for the Western Pacific Region. Manila: WHO Regional Office for the Western Pacific (https://iris.wpro.who.int/bitstream/handle/10665.1/13963/9789290618409-eng.pdf).
Xu K, Evans D, Carrin G, Aguilar-Rivera A, Musgrove P, Evans T (2007). Protecting households from catastrophic health spending. Health Aff (Millwood). 26(4):972–83.
Can people afford to pay for health care in Europe? 114

Xu K, Evans D, Kawabata K, Zeramdini R, Klavus J, Murray C (2003). Household catastrophic health expenditure: a multicountry analysis. Lancet 362:111–7.
Yerramilli P, Fernández O, Thomson S (2018). Financial protection in Europe: a systematic review of the literature and mapping of data availability. Health Policy 122(5):493–508. doi:https://doi.org/10.1016/j.healthpol.2018.02.006 (http://www.healthpolicyjrnl.com/article/S0168-8510(18)30049-6/fulltext).
Zver E, Josar D, Srakar A (in press). Can people afford to pay for health care? New evidence on financial protection in Slovenia. Copenhagen: WHO Regional Office for Europe.
115References

Glossary of terms
Ability to pay for health care: Ability to pay refers to all the financial resources at a household’s disposal. When monitoring financial protection, an ability to pay approach assumes that all of a household’s resources are available to pay for health care, in contrast to a capacity to pay approach (see below), which assumes that some of a household’s resources must go towards meeting basic needs. In practice, measures of ability to pay are often derived from household survey data on reported levels of consumption expenditure or income over a given time period. The available data rarely capture all of the financial resources available to a household – for example, resources in the form of savings and investments.
Basic needs: The minimum resources needed for sustenance, often understood as the consumption of goods such as food, clothing and shelter.
Basic needs line: A measure of the level of personal or household income or consumption required to meet basic needs such as food, housing and utilities. Basic needs lines, like poverty lines, can be defined in different ways. They are used to measure impoverishing out-of-pocket payments. In this study the basic needs line is defined as the average amount spent on food, housing and utilities by households between the 25th and 35th percentiles of the household consumption distribution, adjusted for household size and composition. Basic needs line and poverty line are used interchangeably. See poverty line.
Budget: See household budget.
Cap on benefits: A mechanism to protect third party payers such as the government, a health insurance fund or a private insurance company. A cap on benefits is a maximum amount a third party payer is required to cover per item or service or in a given period of time. It is usually defined as an absolute amount. After the amount is reached, the user must pay all remaining costs. Sometimes referred to as a benefit maximum or ceiling.
Cap on user charges (co-payments): A mechanism to protect people from out-of-pocket payments. A cap on user charges is a maximum amount a person or household is required to pay out of pocket through user charges per item or service or in a given period of time. It can be defined as an absolute amount or as a share of a person’s income. Sometimes referred to as an out of pocket maximum or ceiling.
Capacity to pay for health care: In this study capacity to pay is measured as a household’s consumption minus a normative (standard) amount to cover basic needs such as food, housing and utilities. This amount is deducted consistently for all households. It is referred to as a poverty line or basic needs line.
Can people afford to pay for health care in Europe? 116
Catastrophic out-of-pocket payments: Also referred to as catastrophic health spending. An indicator of financial protection. Catastrophic out-of-pocket payments can be measured in different ways. This study defines them as out-of-pocket payments that exceed 40% of a household’s capacity to pay for health care. The incidence of catastrophic health spending includes households who are impoverished and households who are further impoverished.
Consumption: Also referred to as consumption expenditure. Total household consumption is the monetary value of all items consumed by a household during a given period. It includes the imputed value of items that are not purchased but are procured for consumption in other ways (for example, home-grown produce).
Co-payments (user charges or user fees): Money people are required to pay at the point of using health services covered by a third party such as the government, a health insurance fund or a private insurance company. Fixed co-payments are a flat amount per good or service; percentage co-payments (also referred to as co-insurance) require the user to pay a share of the good or service price; deductibles require users to pay up to a fixed amount first, before the third party will cover any costs. Other types of user charges include balance billing (a system in which providers are allowed to charge patients more than the price or tariff determined by the third party payer), extra billing (billing for services that are not included in the benefits package) and reference pricing (a system in which people are required to pay any difference between the price or tariff determined by the third party payer – the reference price – and the retail price).
Equivalent person: To ensure comparisons of household spending account for differences in household size and composition, equivalence scales are used to calculate spending levels per equivalent adult in a household. This review uses the Oxford scale (also known as the Organisation for Economic Co-operation and Development equivalence scale), in which the first adult in a household counts as one equivalent adult, subsequent household members aged 13 years or over count as 0.7 equivalent adults and children under 13 count as 0.5 equivalent adults.
Exemption from user charges (co-payments): A mechanism to protect people from out-of-pocket payments. Exemptions can apply to groups of people, conditions, diseases, goods or services.
Financial hardship: People experience financial hardship when out-of-pocket payments are large in relation to their ability to pay for health care.
Financial protection: The absence of financial hardship when using health services. Where health systems fail to provide adequate financial protection, households may not have enough money to pay for health care or to meet other basic needs. Lack of financial protection can lead to a range of negative health and economic consequences, potentially reducing access to health care, undermining health status, deepening poverty and exacerbating health and socioeconomic inequalities.
117Glossary of terms

Further impoverished households: Poor households (those whose equivalent person total consumption is below the poverty line or basic needs line) who incur out-of-pocket payments.
Health services: Any good or service delivered in the health system, including medicines, medical products, diagnostic tests, dental care, outpatient care and inpatient care. Used interchangeably with health care.
Household budget: Also referred to as total household consumption. The sum of the monetary value of all items consumed by the household during a given period and the imputed value of items that are not purchased but are procured for consumption in other ways.
Household budget survey: Usually national sample surveys, often carried out by national statistical offices, to measure household consumption over a given period of time. Sometimes referred to as household consumption expenditure or household expenditure surveys. European Union countries are required to carry out a household budget survey at least once every five years.
Impoverished households: Households who were non-poor before out-of-pocket payments, but are pushed below the poverty line or basic needs line after out-of-pocket payments.
Impoverishing out-of-pocket payments: Also referred to as impoverishing health spending. An indicator of financial protection. Out-of-pocket payments that push people into poverty or deepen their poverty. A household is measured as being impoverished if its total consumption was above the national or international poverty line or basic needs line before out-of-pocket payments and falls below the line after out-of-pocket payments.
Informal payment: a direct contribution made in addition to any contribution determined by the terms of entitlement, in cash or in kind, by patients or others acting on their behalf, to health care providers for services to which patients are entitled.
Out-of-pocket payments: Also referred to as household expenditure (spending) on health. Any payment made by people at the time of using any health good or service provided by any type of provider. Out-of-pocket payments include: formal co-payments (user charges or user fees) for covered goods and services; formal payments for the private purchase of goods and services; and informal payments for covered or privately purchased goods and services. They exclude pre-payment (for example, taxes, contributions or premiums) and reimbursement of the household by a third party such as the government, a health insurance fund or a private insurance company.
Poverty line: A level of personal or household income or consumption below which a person or household is classified as poor. Poverty lines are defined in different ways. This study uses basic needs line and poverty line interchangeably. See basic needs line.
Can people afford to pay for health care in Europe? 118

Quintile: One of five equal groups (fifths) of a population. This study commonly divides households into quintiles based on per equivalent person household consumption. The first quintile is the fifth of households with the lowest consumption, referred to in the study as the poorest quintile; the fifth quintile has the highest consumption, referred to in the study as the richest quintile.
Risk of impoverishment after out-of-pocket payments: After paying out of pocket for health care, a household may be further impoverished, impoverished, at risk of impoverishment or not at risk of impoverishment. A household is at risk of impoverishment (or not at risk of impoverishment) if its total spending after out-of-pocket payments comes close to (or does not come close to) the poverty line or basic needs line.
Universal health coverage: Everyone can use the quality health services they need without experiencing financial hardship.
Unmet need for health care: An indicator of access to health care. Instances in which people need health care but do not receive it due to access barriers.
User charges: Also referred to as user fees. See co-payments.
Utilities: Water, electricity and fuels used for cooking and heating.
119Glossary of terms


The WHO Regional Office for Europe
The World Health Organization (WHO) is a specialized agency of the United Nations created in 1948 with the primary responsibility for international health matters and public health. The WHO Regional Office for Europe is one of six regional offices throughout the world, each with its own programme geared to the particular health conditions of the countries it serves.
Member States
AlbaniaAndorraArmeniaAustriaAzerbaijanBelarusBelgiumBosnia and HerzegovinaBulgariaCroatiaCyprusCzechiaDenmarkEstoniaFinlandFranceGeorgiaGermanyGreeceHungaryIcelandIrelandIsraelItalyKazakhstanKyrgyzstanLatviaLithuaniaLuxembourgMaltaMonacoMontenegroNetherlandsNorth MacedoniaNorwayPolandPortugalRepublic of MoldovaRomaniaRussian FederationSan MarinoSerbiaSlovakiaSloveniaSpainSwedenSwitzerlandTajikistanTurkeyTurkmenistanUkraineUnited KingdomUzbekistan
World Health Organization Regional Office for EuropeUN City, Marmorvej 51, DK-2100 Copenhagen Ø, Denmark
Tel.: +45 45 33 70 00 Fax: +45 45 33 70 01 Email: [email protected]: www.euro.who.int