can intangible investment explain the uk productivity puzzle?intangibles e.g. r&d aren’t...
TRANSCRIPT

Can Intangible Investment Explain the UK Productivity Puzzle?
Peter Goodridge Jonathan Haskel
Gavin Wallis
Imperial College Business School
Seminar IFS, April 24th 2013 Click for : short summary of paper: paper.
Papers referred to herein intangible spillovers, NESTA innovation index work
Disclaimer: personal views only. Prepared for NIESR review.

The double productivity dip puzzle (data = lnV/H, market sector)
2007-9: - MSGVA fell by 7.4% - MS Hours fell by 3.5% MS LPG fell by 4%
2011-12Q3: - MSGVA has grown by 0% - MS Hours grew by 3.4% Productivity fell by 3.4%
Note: Measured data includes software, min & cop for intangibles
85
90
95
100
105
110
115
2002 2003 2004 2005 2006 2007 2008 2009 2010 2011 2012
Output per hour
Continuation of pre-crisis trend
2

Quarterly TFP: 2005Q1-12Q4
-3.00%
-2.50%
-2.00%
-1.50%
-1.00%
-0.50%
0.00%
0.50%
1.00%
1.50%
2.00%
2.50%
TFP
LP
Notes: own calculations using ONS real MSGVA, ONS MS Hours, estimates of MS K stock (G. Wallis) based on ONS VICS dataset Labour and Capital shares assumed to be 0.67 and 0.33 respectively
3

UK TFP after recessions (indexed to 1 at start of recession)
0.9
0.95
1
1.05
1.1
1.15
1.2
1.25
1 2 3 4 5 6 7 8 9 10 11 12 13 14 15 16
1979+
1990+
2007+
1973+
Source: EUKLEMS, extended to 2010 using ONS estimates of TFP 4

Towards a partial explanation: intangible investment relatively strong in recession…
0
20
40
60
80
100
120
140
2001 2002 2003 2004 2005 2006 2007 2008 2009 2010 2011
Cu
rre
nt
Pri
ce I
nve
stm
en
t (I
nd
ex)
Nominal Investment, selected assets (2008=100)
Recession Buildings excl dwellings Total P&M Software R&D
Source: ONS GFCF release and BERD “Total Civil Intramural R&D”, Dec 2012
5

…but it fell from high levels before the recession (shares of intangible adjusted market sector GVA)
.08
.1.1
2.1
4.1
6.1
8
Sh
are
of A
dju
ste
d G
VA
1985 1990 1995 2000 2005 2010year
intan_GVA tan_GVA
Investment intensities
Notes: Tangible investment= plant/machinery, vehicles, commercial buildings Intangible investment = software, R&D, design, market research and branding, training, organisational change. Source: Goodridge, Haskel, Wallis, 2012
6

Two possible effects from intangibles
• Effect on current measured output looks like labour hoarding – Output of skilled/knowledge workers producing
intangibles e.g. R&D aren’t measured in GDP – But they are in hours – So measured output per hour looks low
• Post-2000 slowdown in intangible investment e.g. R&D, might have slowed TFP growth before the recession if – spillovers from intangibles to TFP growth and – Spillovers take time
7

Might be part of many effects accounting for productivity growth slowdown?
• Labour hoarding – See below
• GDP mismeasurement/revisions – Nominal GDP in line with tax take data – Average revisions are downwards in recent years
• Capital/labour substitution with falling real wages – See below: TFP growth has fallen
• Capital reallocation issues – Between industry-flows (Broadbent), bank crises, entry and exit
“zombie firms”
• Unmeasured utilisation affecting TFP – See below
• (Reviews of this other work in e.g. Barriel/Oulton, Grice, Pattinson, Hughes/Saleheen, Martin/Rowthorn, IFS Green Budget, Disney, Jin, Miller, 2013)) 8

Common explanation: labour hoarding
• Labour hoarding – firms maintaining low skilled/cheap labour for anticipated
recovery – firms have to retain overhead workers – Hoarding explains initial productivity dip – Recent productivity dip because firms are taking on low-paid
workers in sectors where they were not hoarded e.g. retail
• Issues with this view – Seems important for initial fall. But are workers really hoarding
labour 4 years on? – Paper sets out (we think new ) direct evidence: look at ONS data
on quality-adjusted labour input (QALI) • Have firms been particularly hoarding unskilled workers over the
recession? • Have low productivity sectors been hiring unskilled since initial
recession?
– Answer to both questions seems to be: no. 9

Labour composition by industry (Acheson and Franklin, 2010)
Source: http://www.ons.gov.uk/ons/rel/icp/quality-adjusted-labour-input--experimental-/estimates-to-2010/art-estimates-to-2010.html
Rowthorn &
Martin: Low (L)
/ High (H)
productivity
sectors
2001-7: Annual
Average Change in
labour composition
(Δln(L/H)
2008Q1 - 09Q2: Change in
labour composition (Δln(L/H)
2009Q3 - 10Q4: Change in
labour composition (Δln(L/H)
Whole economy 0.4 1.7 1.5
Market sector 0.3 1.1 0.6
Agriculture & Mining L 0.5 2.7 2.4
Manufacturing 0.7 1.1 1.0
Construction 0.0 2.4 -1.3
Distribution L 0.6 2.3 1.9
Transport 0.1 -0.1 1.1
Information & Communication 0.9 4.0 4.4
Financial Services 1.6 0.8 4.3
Professional & Administrative ServicesL 0.6 1.4 2.8
Public Services L 0.5 1.3 1.1
Arts & Recreation L 0.1 4.6 1.6
Average High 0.7 1.6 1.9
Average Low 0.4 2.5 2.0
Findings: upskilling is (a) faster than pre-recession (b) faster in low productivity sectors
10

Could Intangible Investment look like Labour Hoarding?
• As intangibles aren’t included in final output, the product of “knowledge workers” would not show up in GVA
• Would show up in hours though
• Knowledge production requires high-skilled labour so would also show up in growth in labour composition (which QALI data supports)
11

Potential for further effects from intangibles?
• Possible pre-recession effects
– After the intangibles boom in the late 90s, investment declined through much of the 2000s
– If
• intangible investments generate spillovers,
and
• Spillovers take time
– then may cause a slowdown in productivity anyway i.e. pre-recession
12

Investment
0
20
40
60
80
100
120
140
2001 2002 2003 2004 2005 2006 2007 2008 2009 2010 2011
Cu
rre
nt
Pri
ce I
nve
stm
en
t (I
nd
ex)
Nominal Investment, selected assets (2008=100)
Recession Buildings excl dwellings Total P&M Software R&D
13
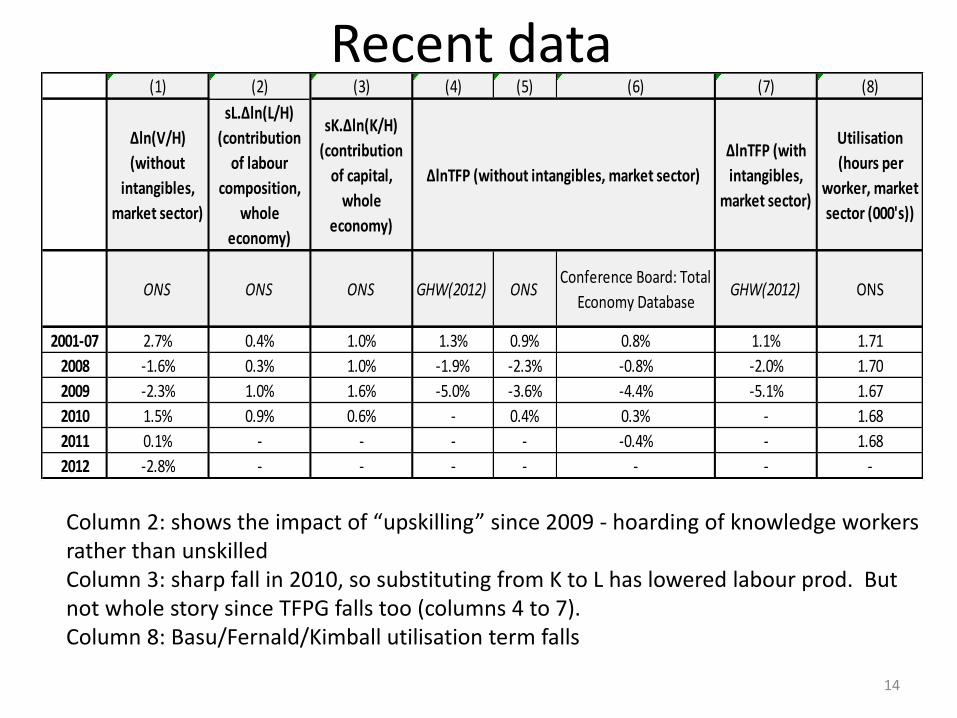
Recent data (1) (2) (3) (4) (5) (6) (7) (8)
Δln(V/H)
(without
intangibles,
market sector)
sL.Δln(L/H)
(contribution
of labour
composition,
whole
economy)
sK.Δln(K/H)
(contribution
of capital,
whole
economy)
ΔlnTFP (with
intangibles,
market sector)
Utilisation
(hours per
worker, market
sector (000's))
ONS ONS ONS GHW(2012) ONSConference Board: Total
Economy DatabaseGHW(2012) ONS
2001-07 2.7% 0.4% 1.0% 1.3% 0.9% 0.8% 1.1% 1.71
2008 -1.6% 0.3% 1.0% -1.9% -2.3% -0.8% -2.0% 1.70
2009 -2.3% 1.0% 1.6% -5.0% -3.6% -4.4% -5.1% 1.67
2010 1.5% 0.9% 0.6% - 0.4% 0.3% - 1.68
2011 0.1% - - - - -0.4% - 1.68
2012 -2.8% - - - - - - -
ΔlnTFP (without intangibles, market sector)
Column 2: shows the impact of “upskilling” since 2009 - hoarding of knowledge workers rather than unskilled Column 3: sharp fall in 2010, so substituting from K to L has lowered labour prod. But not whole story since TFPG falls too (columns 4 to 7). Column 8: Basu/Fernald/Kimball utilisation term falls
14

Bias to measured growth
R=real intangible capital stock; N=real intangible investment
Q= real value added including intangibles
If > measured growth is understated
Assuming can be proxied using the most recent data for R&D, can estimate this bias
( , , )t t t t tQ A F L K R
V C I
Q C I N
,ln ln ( ln ln )Q N
t t t t tQ V s N V
ln tN ln tV
ln tN
15

Measured MSGVA growth in 2012: -0.26% pa Bias ~0.5% in 2012 Correcting for bias: MSGVA growth ~0.31% pa
-0.30%
-0.20%
-0.10%
0.00%
0.10%
0.20%
0.30%
0.40%
0.50%
0.60%
0.70%
1995 1996 1997 1998 1999 2000 2001 2002 2003 2004 2005 2006 2007 2008 2009 2010 2011 2012
chan
ges
in lo
gs
Gap between growth in value-added including and excluding intangibles (positive numbers imply measured real output growth understated)
Recession bias_term
16
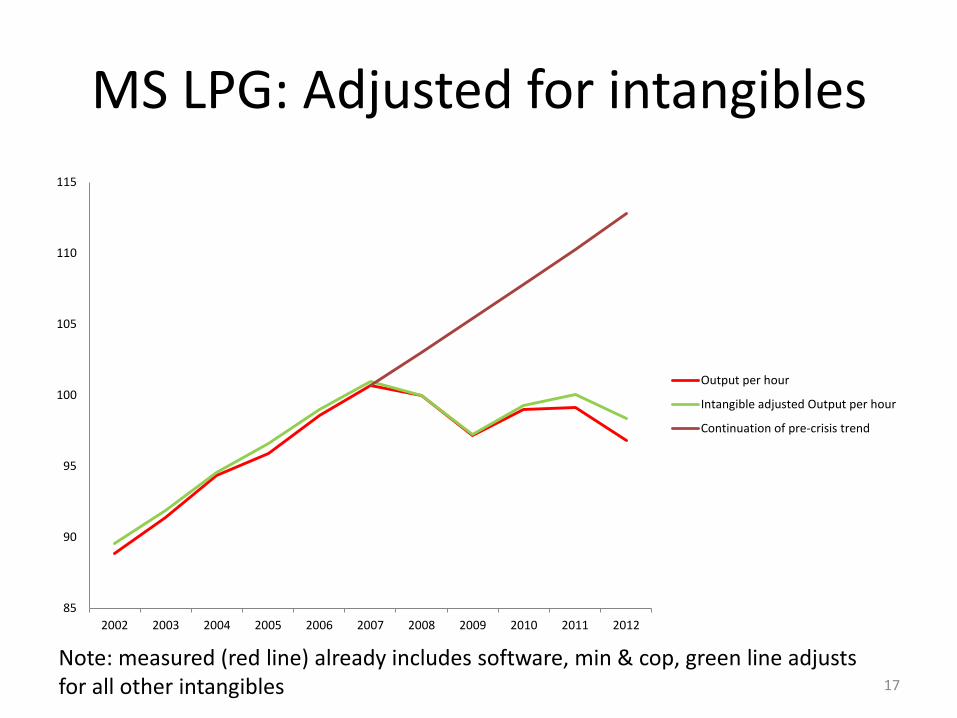
MS LPG: Adjusted for intangibles
Note: measured (red line) already includes software, min & cop, green line adjusts for all other intangibles
85
90
95
100
105
110
115
2002 2003 2004 2005 2006 2007 2008 2009 2010 2011 2012
Output per hour
Intangible adjusted Output per hour
Continuation of pre-crisis trend
17

Spillovers
.08
.1.1
2.1
4.1
6.1
8
Sh
are
of A
dju
ste
d G
VA
1985 1990 1995 2000 2005 2010year
intan_GVA tan_GVA
Investment intensities
Slowdown in intang/GVA in 2000s
Lots of evidence for spillovers from R&D GHW (2012) find evidence for inter- and intra-industry spillovers from R&D and some limited evidence for other intangibles
18

-0.04
-0.02
0
0.02
0.04
0.06
0.08
0.1
0.12
0.14ch
ange
in lo
gs
ΔlnK, selected assets
Recession dlnK(rd) dlnK(telecom) dlnK(intan)
Pattern of fast growth in ΔlnK in late 90s/early 00s Followed by slower growth in lead up to recession If there is a lagged effect on TFP, would show up as TFP slowdown in late 00s
19

Spillover contributions
Year Peak/TroughDlnTFP DlnK(rd)
DlnK(com
equip)
dlnTFP
slowdown
0.25*lagged
dlnK(rd)
slowdown
0.04*lagged
dlnK(com
equip)
slowdown
1991-98 T-P 1.83% 1.60% 1.86%
1998-02 P-T 1.26% 3.75% 8.77%
2002-07 T-P 1.39% 1.87% 2.28% 0.12% 0.54% 0.28%
2007-10 P-T -2.29% 1.20% -1.94% -3.68% -0.47% -0.26%
ΔlnK(rd) and ΔlnK(telecom) both speed up in late 90s. This is followed by a speed-up in TFP in early 2000s Slowdown in ΔlnK(rd) and ΔlnK(telecom) in early 2000s followed by a slowdown in TFP in late 2000s Final columns estimate the contributions of these changes, with coefficients taken from GHW(2012) and GHW(2013). The speed-up before the recession is over-predicted. The later slowdown is under-predicted, explaining -0.73 pp of the -3.68 (20%)
20

Utilisation
• One explanation for the extent of the TFP slowdown is unobserved factor utilisation
• Basu et al (2006) develop utilisation correction to DlnTFP using annual actual hours per worker (H/N) and run:
• Then:
• In UK: β=0.39 (compared to β>1 in US) so adjustment to TFP is small
ˆˆln ln( / )MEASTFP H N
ˆln ln . ln( / )ADJ MEASTFP TFP H N
21

-0.04
-0.03
-0.02
-0.01
0
0.01
0.02
0.03
2001 2002 2003 2004 2005 2006 2007 2008 2009 2010
chan
ges
in lo
gs
Utilisation adjusted ΔlnTFP
Recession ONS MS TFP Util adj TFP
Approx 0.6% added to TFP. Note: if β(UK)=β(US), would explain around half of –ve TFP in 2009
22

Conclusions
• Evidence that it is high-skilled labour being hoarded
• Investment in intangibles has risen, whilst tangibles have fallen, increasing the bias to measured output
• Growth in the stock of intangibles and telecoms fell prior to the recession, which may have contributed to the TFPG slowdown
• A small amount of the TFP slowdown can be explained by a decline in factor utilisation
23

The bottom line
• Current measured DlnV understated by about 0.5%pa, so weak positive output growth if intangibles included
• Pre-recession trends means that measured DlnTFP would have fallen anyway – 2002-07 UK measured DlnTFP +1.4% – 2007-10, UK measured DlnTFP -2.3%
• (2008-9= -5%, 0 since then)
– Intangible spillovers => post07 slowdown in DlnTFP by 0.73pppa =20% of slowdown (0.73/3.7)
• Policy – Is slow DlnTFP a given? No
• Additional knowledge investment boosts growth • DlnTFP depends on spillovers so maybe amenable to e.g. science or
IP policy
24

Spares
25

Intangible Assets
26
Asset
Intang included in Nat
Accounts?
Capitalization
Factor Depreciation rate
Computerised Information
Purchased Software Yes 1 0.315
Own-Account Software Yes 1 0.315
Databases See note 1 0.315
Innovative property
R&D Satellite for some 1 0.15
Design No 0.5 0.2
Mineral Exploration Yes 1 0.075
Financial Innovation No 1 0.2
Artistic originals
EU yes; JA/US no; see
note asset-specific asset-specific
Economic Competencies
Advertising No 0.6 0.55
Marketing research No 0.6 0.55
Own-Account Organisational Capital No 1 0.4
Purchased Organisational Capital No 0.8 0.4
Training No 1 0.4
Source: Corrado, Carol; Jonathan Haskel, Cecilia Jona-Lasinio and Massimiliano Iommi, (2012), "Intangible Capital and Growth in Advanced Economies: Measurement Methods and Comparative Results" Working Paper, June, available at http://www.intan-invest.net.

Utilisation, Basu et al theory
• (taken from GHW, 2013)
• Consider a firm employing N workers for H hours per worker, working with effort E per hour.
• Labour input = NG(E,H), where G transforms the bundle of E and H into per worker effort-hours.
• A firm wishing to raise E or H will face some costs of doing so. Assume they are optimising on all margins. Then the first order condition holds: (dG/dH)(H/G)=(dG/dE)(E/G).
• Log linearising, one can write the unobservable E/N in terms of the observable H/N as lnE/N=βln(H/N)
27

Spillovers and intangibles
• From Goodridge, Haskel, Wallis, 2012
28

Traditional Griliches-type approach to Intangible spillovers
29
, , ,
, _ , _
,
, ,
, , ,
Production function, industry i time t
ln ln ln ln ln
ln ln
Definition
ln ln ln
Assumption
, , ,
it it it
it it M i it K i it L i it
N i it N i it
it it X it it
X L K N
X it X it X it it it it
Y A M K L
N N
TFP Y s X
s d X M K L
_ ,_ , 1 _ ,
1 _ ,
, ,
,
ln ln
Estimating equation
ln ln ln
i t
PRIV
it
i t i t tN
it i t t i X it
X L K N
N
N M N
TFP M N a d X v

Interpretation of estim equation
• Industry and time effects as controls • Outside effects might be
– Non-pecuniary knowledge spillovers: e.g. learning from others – Pecuniary spillovers via mismeasurement e.g. more knowledgeable others are selling
unmeasured better quality goods
• Within-ind effects – Spillovers, non-constant returns, mismeasurement e.g. of factor stocks
• Two weighting matrices M – Interindustry intermediate flows from IO tables – Interindustry labour flows from Labour Force Survey
• What do we do that’s new? – Other industry level findings: Uses R&D/Y as DlnN (assumes (R&D)=0). Most don’t capitalise
R&D in Y . Uses manufacturing. Most find 1>0. Few UK studies. Griffiths et al interact M with R&D to test absorbtive capacity.
– We use all intangibles, construct stocks, from our micro-survey, capitalise Y and add intang inputs for consistent dlnTFP.
30
1 _ ,
, ,
ln ln ln
Outside industry effectsWithin-industry effects
PRIV
it i t t i X it
X L K N
TFP M N a d X v

Data
• Years, 2000-07
• 7 industries – Measurement: finance,
agriculture
• Output: Gross output adjusted for own account intang
• Inputs: Tangible, intangibles
31
SIC(2003) Industry Description
ABC Agriculture, Forestry and Fishing
D Manufacturing
E Electricity, Gas & Water Supply
F Construction
GHI Distribution; Hotels & Restaurants; Transport, Storage & Communications
J Financial Services
K Business Activities (excluding real estate)
Broad category of intangible asset Includes
Computerised information
Computer software, computer
databases
Intellectual property
Artsitic originals, Scientific R&D,
Non-scientific R&D, Mineral
exploration, Financial product
innovation, and Architectural and
engineering design
Economic competencies
Branding: Advertising and market
research, Firm-specific human
capital, and Organisational Structure.

Measurement, contd
• Tangibles – Plant, building, vehicles. EU KLEMS. Capital service weighted
• Intangibles – Software: EUKLEMS – R&D: own calculations. BERD for own-account. R&D performed in
R&D industry assigned to funder via IO tables. (IO performer data not used)
– Finance: new method based on own-account – Design: own-account: software method. Purchased: IO tables. All
purchased design in bus services excluded (assumed to be subcontracting). This reduces total design spend a lot
– Training: own-account survey – Marketing: IO tables – Managerial: own-account plus purchased
32

Graphs
Note: all data is deviation from industry and time means 33
1
1
1
1
1
111
1
1
1
1
1
222
22
222
22
22
2
3
33
333
3
3 3
3 33
3
44444 44
444 4
44
5
555 5
5555
55
55
6
6
6
6
6
6
6
6
6
6
66
6 777
7
7
7
77
7
777
7-.
04
-.02
0
.02
TF
P d
evi
atio
n
-.03 -.02 -.01 0 .01 .02Outside stock deviation: rd [IC]
1
1
1
1
1
111
1
1
1
1
1
222
22
222
22
22
2
3
33
3 33
3
3 3
333
3
44444 44
444 444
5
5555
55 55
55
55
6
6
6
6
6
6
6
6
6
6
66
6 777
7
7
7
7 7
7
7777
-.04
-.02
0
.02
TF
P d
evi
atio
n-.02 -.01 0 .01 .02Outside stock deviation: TTIN [IC]
1
1
1
1
1
111
1
1
1
1
1
222
22
222
22
222
3
33
3 3 3
3
33
333
3
4444444
444 444
5
5555
555
5
55
55
6
6
6
6
6
6
6
6
6
6
66
677 7
7
7
7
77
7
777
7
-.04
-.02
0
.02
TF
P d
evi
atio
n
-.04 -.02 0 .02 .04 .06Outside stock deviation: sof [IC]
1
1
1
1
1
111
1
1
1
1
1
222
22
222
22222
3
33
3 33
3
3 3
333
3
44444 44
444444
5
5555
5555
55
55
6
6
6
6
6
6
6
6
6
6
66
6 777
7
7
7
77
7
7777
-.04
-.02
0
.02
TF
P d
evi
atio
n
-.03 -.02 -.01 0 .01 .02Outside stock deviation: IP [IC]
1
1
1
1
1
111
1
1
1
1
1
222
22
222
22
22
2
3
33
333
3
3 3
333
3
4444444
444444
5
5555
5555
55
55
6
6
6
6
6
6
6
6
6
6
66
6 777
7
7
7
7 7
7
777
7-.
04
-.02
0
.02
TF
P d
evi
atio
n
-.04 -.02 0 .02 .04Outside stock deviation: EC [IC]

Regressions using intermediate consumption and labour transition weights
34
(1) (2) (3) (4) (5) (6)
ASSET IC TR IC TR IC TR
External R&D 0.43*** 2.31** 0.38*** 1.57**
(4.61) (3.05) (7.42) (2.52)
Internal R&D 0.043 0.074* 0.0027 0.036
(1.86) (1.95) (0.15) (0.83)
Total External Intangibles 0.52** 0.58
(2.97) (0.59)
Total Internal Intangibles -0.20*** -0.18***
(-5.06) (-5.64)
Total External Intangibles excl. R&D 0.39* 0.070
(2.22) (0.074)
Total Internal Intangibles excl. R&D -0.17*** -0.16***
(-5.26) (-5.14)
Observations 91 91 91 91 91 91
R-squared 0.185 0.147 0.287 0.228 0.372 0.273
Number of industries 7 7 7 7 7 7
Elasticity of external R&D 0.25 0.21 0.30 0.054 0.22 0.15
Elasticity of other external variable 0.22 0.0065

Schankerman (1982) type bias expressions
• In recessions – If dlnX<0, measured falls relative to true – If dlnYm>dlnN (intangible investment relatively stable), measured rises relative
to dlnt (but total effect depends on DlnR)
35
1( , , ), , ; knowledge stock, R=N-
GDP includes N.
( , )
Y =C+I, dlnY=s ln (1 ) ln
Define growth due to knowledge accum dlnt+s ln
Relat
N
t
M M
M M
N N
R
Y F X R t X K L R R
Y C I N
Y F X t
d N s d Y
d R
Extended asset boundary
Measured
if dlnX>0,if dlnN>dlnY ,meas is too low meas is too low extra value addedX weight too high
ion to measured TFPG, dlnt
dlnt+s ln dlnt s ( ln ln ) (s s ) ln
MeasuredExtended M
M
M M M M
R N X Xd R d N d Y d X