can electronic health records be used for population health surveillance? findings ... ·...
TRANSCRIPT

Can Electronic Health Records be Used
for Population Health Surveillance?
Findings from the NYC Macroscope
Sharon E. Perlman, MPH
Katharine H. McVeigh, PhD, MPH
Lorna Thorpe, PhD
Innovations in Monitoring Population Health Meeting
Washington, DC
January 9, 2017

NYC Department of Health New York University School of Medicine
Pui Ying Chan, MPH Lorna E. Thorpe, PhD (formerly at CUNY)
Sungwoo Lim, DrPH
Katharine H. McVeigh, PhD, MPH
Sharon Perlman, MPH
Jenny Smolen, MPH
Special thanks to Jay Bala, Amy Freeman, Ryan Grattan, Carolyn Greene, Tiffany Harris, Stephen
Immerwahr, Remle Newton-Dame, Kevin Konty, Ram Koppaka, Jesica Rodriguez-Lopez, Matt Romo, Sarah
Shih, Jesse Singer, Elisabeth Snell, Kathleen Tatem, Elizabeth Lurie, Katherine Bartley, Laura Jacobson,
Charon Gwynn, and Lauren Schreibstein
This work has been made possible by the financial support of the de Beaumont Foundation, the Robert Wood
Johnson Foundation, the Robin Hood Foundation, the NY State Health Foundation, the Doris Duke Charitable
Foundation, and the Centers for Disease Control and Prevention.
NYC Macroscope Team

“If we have data, let’s look at data. If all we have are opinions, let’s go with mine.”
- Jim Barksdale, former Netscape CEO
Good data allow for:
Better policy and programmatic decisions
Advocacy
Evaluation/accountability
Use resources more efficiently
Importance of high-quality data for public health

Traditional surveillance methods include
Birth and death certificates
Notifiable disease reporting
Hospitalization records
Surveys
Background
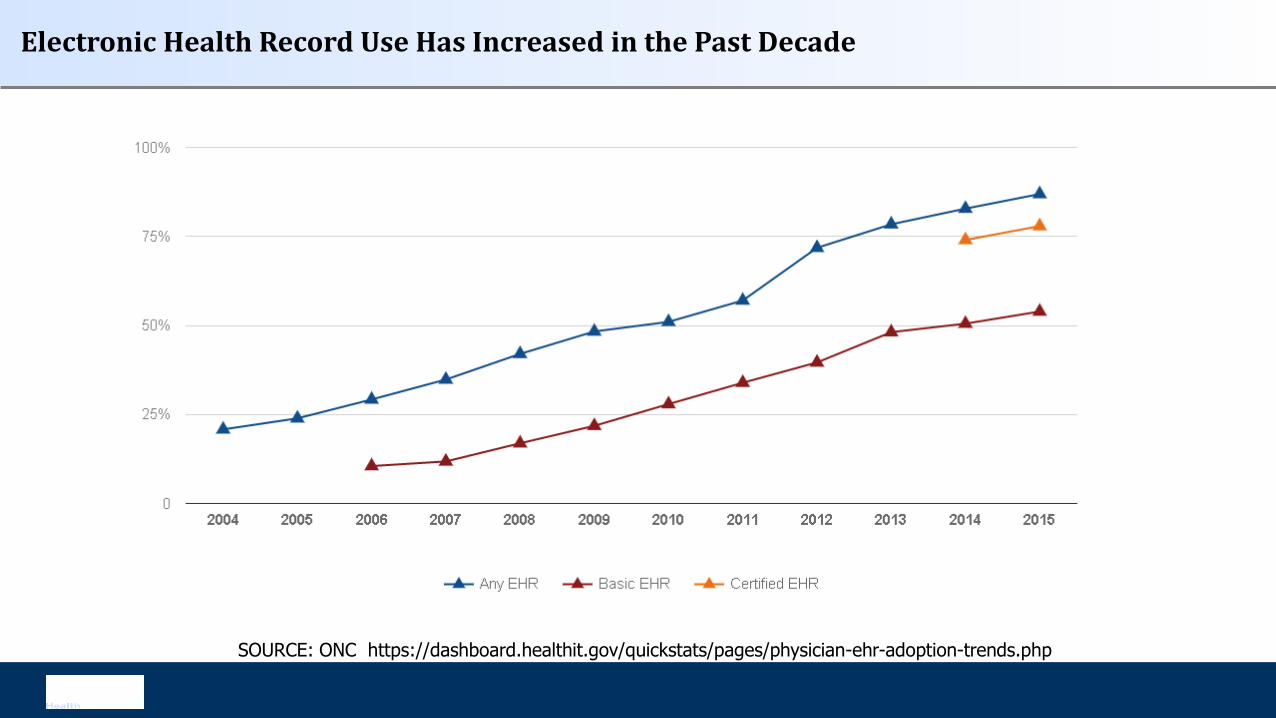
Electronic Health Record Use Has Increased in the Past Decade
SOURCE: ONC https://dashboard.healthit.gov/quickstats/pages/physician-ehr-adoption-trends.php

Traditional surveys are very valuable, but becoming more difficult to conduct.
Telephone survey response rates decreasing
Examination surveys are extremely expensive, labor intensive, often have lengthy lag times between data collection and dissemination.
EHR-based surveillance can complement existing surveillance systems.
May be only source of information in jurisdictions with limited local data.
Potential to Use EHRs for Population Health Surveillance

Only those in care
Patients and providers in an EHR network may not be representative
If data are aggregated, there may be duplicate records
Data may not be collected and recorded in uniform way
Data may be in free text or other field that is difficult to access
Possible Limitations to EHR-Based Surveillance

The NYC Macroscope uses
primary care practice data from an
EHR network to track conditions
important to public health, focusing
on chronic conditions.
Led by NYC Health Department,
in partnership with NYUMC
(formerly at CUNY)
NYC Macroscope: New York City’s EHR Surveillance System

NYC’s EHR Network: Primary Care Information Project (PCIP)
Bridges public health and
healthcare
“The Hub” allows secure
exchange of aggregate
data with PCIP practices
through a distributed model
The Hub currently covers:
Nearly 700 practices
1.9 M patients in 2013

Hub Population Health System
o eClinicalWorks EHR platform
Inclusion/exclusion criteria
Practice – Documentation quality thresholds guided by Meaningful Use standards
Provider – Primary care only
Patient – Visit in 2013, ages 20-100, sex recorded as male or female, NYC Zip Code
Key Features of NYC Macroscope

Macroscope Sample Size and Coverage
All Adult NYC Patients: 1,317,438 (n=660 practices, 2229 providers)
Seen by primary care, not specialist: 766,655
Retained after quality inclusion criteria:
716,076
(n=393 practices,
953 providers)
2013 Macroscope primary care coverage: ~17%*
*Denominator is CHS 2013 estimates of 4,137,212 NYC adults (20+) that saw provider in 2013

Weighted to the distribution of the NYC adult population that had seen a health provider in the past year
Validated against 2 population-based reference surveys
2013-14 NYC Health and Nutrition Examination Survey (NYC HANES)
N = 1,527; 1,135 in care
2013 NYC Community Health Survey (CHS)
N = 8,356; 6,166 in care
Key Features of NYC Macroscope, continued

NYC Macroscope Indicators
Outcomes
Prevalence, Treatment and Control
• Diabetes
• Hypertension
• Cholesterol
Prevalence
• Obesity
• Smoking
• Depression
Use of Preventive Services
• Vaccination against influenza
Population Subgroups
Sex
• Male
• Female
Age
• 20-39
• 40-59
• 60-100

NYC Macroscope Indicators Definitions
Indicator Macroscope 2013
(n=716,076)
NYC HANES 2013-14
(n=1,135 in care)
CHS 2013
(n=6,166 in care)
Obesity
(BMI)
Measured height, weight Measured height, weight Self-reported height. weight
Smoking
(current smoker)
Structured smoking section** Self-reported Self-reported
Hypertension, diabetes and
cholesterol diagnosis
Ever diagnosed Self-reported diagnosis Self-reported diagnosis
Diabetes Augmented Ever diagnosed** or
A1c≥6.5** or
Medication prescribed
Self-reported diagnosis or
A1c≥6.5
n/a
Hypertension Augmented Ever diagnosed* or
Systolic≥140, diastolic≥90* or
Prescribed meds*
Self-reported diagnosis or
Systolic≥140, diastolic≥90
n/a
Cholesterol Augmented Ever diagnosed or
Total cholesterol≥ 240** or
Medication prescribed
Self-reported diagnosis or
Total cholesterol≥ 240
n/a
Depression PHQ-9≥10 or ever dx PHQ-9≥10 or ever dx n/a
Influenza Vaccination CVX, CPT or ICD-9 code* Self-report* Self-report*
* In the past calendar year.
** In the past 2 calendar years.

POPULATION-BASED PREVALENCE ESTIMATE COMPARISONS
Validation Study Results

Test for
Comparison
Metric Criterion
Statistical
EquivalenceTwo One-Sided Test (TOST) P <0.05
Statistical Difference Student’s T-Test P <0.05
Relative Difference Prevalence Ratio 0.85-1.15
Prevalence
DifferencePrevalence 1 – Prevalence 2 +- 5 points
Consistency across
6 strata (age x sex)Spearman Correlation >= 0.80
Validating NYC Macroscope by Comparison with Existing Surveys
Used a priori criteria to determine if estimates were comparable enough to
well-established surveys to consider using for population health
surveillance.

Prevalence of Selected Indicators
0 5 10 15 20 25 30 35 40 45 50
Hypertension Diagnosis
Obesity Diagnosis
Diabetes Diagnosis
Smoking
Depression
Influenza Vaccination
NYC Macroscope NYC HANES Community Health Survey
Performed well
Performed poorly

Indicator
Hypertension Smoking Diabetes Obesity Hypercholesterolemia Depression Influenza
Vaccination
NYC Macroscope
% (95% CI)
32.3 (32.2, 32.4) 15.2 (15.1, 15.3) 13.9 (13.8, 14.0) 27.8 (27.7, 27.9) 49.3 (49.1, 49.5) 8.2 (8.1, 8.2) 20.9 (20.8, 21.0)
NYC HANES
% (95% CI)
32.5 (29.4, 35.7) 17.7 (15.1-20.8) 12.6 (10.6, 14.8) 31.3 (28.5-34.2) 46.9 (42.6, 51.3) 15.2 (13.0 – 17.7) 47.6 (44.0-51.3)
Community Health Survey
% (95% CI)
31.6 (30.18,
33.0)
14.9 (13.6-16.3) 12.5 (11.5, 13.6) 24.7 (23.2-26.3) 47.9 (45.7, 50.1) n/a 47.3 (45.5-49.0)
NYC Macroscope vs. NYC HANES
Absolute Difference < 5
(0.15)
(2.55)
(1.36)
(3.46)
(2.36)
(10.8)
(26.71)
Prevalence Ratio of 0.85 -
1.15
(1.00)
(0.86)
(1.11)
(0.89)
(1.05)
(.43)
(0.44)
Test of Difference
(t-test) p>0.05
(p=0.93)
(p=0.08)
(p=0.19)
(p=0.02)
(p=0.29)
(p<0.01)
(p<0.001)
Test of Equivalence (TOST)
p<0.05
(p<0.01)
(p=0.04)
(p<0.001)
(p=0.14)
(p=0.12)
(p=0.99)
(p=0.99)
Spearman Correlation
r>0.80
(1.00)
(0.83)
(1.00)
(1.00)
(0.80)
(0.71)
(1.00)
Recommendation Ready for Use Ready for Use Ready for Use Ready for Use Use with caution Not ready for use Not ready for use
NYC Macroscope 2013, NYC HANES 2013-14 and the 2013 Community Health Survey, New York City Adults in Care in the Past Year
=Criterion met =Criterion not met

SENSITIVITY AND SPECIFICITY OF NYC
MACROSCOPE INDICATORS

Background
NYC Macroscope prevalence estimates are similar to estimates from our gold standard surveys for measures of obesity, smoking, diabetes, hypertension, and hypercholesterolemia.
But, Was the similarity a reflection of good measurement properties or cross-
canceling errors?
Were these results generalizable to other EHR systems?

To answer these questions, we
Recruited NYC HANES participants who had visited a doctor in the past year (consent/HIPAA)
Obtained printed copies of EHR records by secure FAX
Abstracted data from medical records of NYC HANES participants
Used NYC Macroscope indicator algorithms to classify patient outcomes
For each individual, linked NYC Macroscope and NYC HANES outcome classifications and
assessed whether those classifications were similar or different
Across individuals, computed sensitivity and specificity to summarize the agreement between
NYC Macroscope and NYC HANES classifications
NYC Macroscope Chart Review Study Methods

Sensitivity and Specificity
SpecificitySensitivity

Measures
Outcomes limited to those that had performed well in population level analysis
• Smoking,
• Obesity,
• Hypertension (2),
• Diabetes (2)
• Hypercholesterolemia (2)

Statistical Analysis
Sensitivity and specificity of NYC Macroscope indicator definitions
In data from providers who contribute to the NYC Macroscope
In data from practices that do not contribute to the NYC Macroscope
Validity threshold: Sensitivity ≥ 0.70 AND Specificity ≥ 0.80

Sensitivity Analyses
Meaningful Use
Unstructured Data

Participant Inclusion/Exclusion Flow Chart
Enrolled in NYC HANES 2013-14
N=1,524
Had a doctor visit in past year
n=1,135
Signed consent
n=692
Signed HIPAA waiver
n=491
One or more EHRs obtained
n=277
EHR contained valid data
n=190
Not in care
n=389
No consent
n=443
No HIPAA waiver
n=201
No EHR, no visits, specialist, unable to locate, not released n=214
Excluded provider type
n=87
NYC Macroscope records
n=48
Non-Macroscope records
n=142

Samples
Non-Macroscope Records
Number
NYC
Macroscope All Records
MU1
Subsample
Records/Patients 48 142 86
Providers 39 133 79
Practices 34 89 49
EHR Vendor Platforms 1 >20 > 15
No significant differences in patient characteristics across samples

48 NYC Macroscope Records
Sensitivity Specificity
0 0.2 0.4 0.6 0.8 1
Augmented Hypercholesterolemia
Hypercholesterolemia Diagnosis
Augmenented Hypertension
Hypertension Diagnosis
Augmented Diabetes
Diabetes Diagnosis
Smoking
Obesity
0 0.2 0.4 0.6 0.8 1
Augmented Hypercholesterolemia
Hypercholesterolemia Diagnosis
Augmenented Hypertension
Hypertension Diagnosis
Augmented Diabetes
Diabetes Diagnosis
Smoking
Obesity
Validity threshold ≥ 0.70 Validity threshold ≥ 0.80

Sensitivity
0 0.1 0.2 0.3 0.4 0.5 0.6 0.7 0.8 0.9 1
Augmented Hypercholesterolemia
Hypercholesterolemia Diagnosis
Augmenented Hypertension
Hypertension Diagnosis
Augmented Diabetes
Diabetes Diagnosis
Smoking
Obesity
All Non-Macroscope Records (n=142) Non-Macroscope with MU1 Restriction (n=86) NYC Macroscope (n=48)
Validity threshold ≥ 0.70

Sensitivity
0 0.1 0.2 0.3 0.4 0.5 0.6 0.7 0.8 0.9 1
Hypertension Diagnosis
Smoking
Obesity
All Non-Macroscope Records (n=142) Non-Macroscope with MU1 Restriction (n=86) NYC Macroscope (n=48)
Validity threshold ≥ 0.70

Specificity
0 0.1 0.2 0.3 0.4 0.5 0.6 0.7 0.8 0.9 1
Augmented Hypercholesterolemia
Hypercholesterolemia Diagnosis
Augmenented Hypertension
Hypertension Diagnosis
Augmented Diabetes
Diabetes Diagnosis
Smoking
Obesity
All Non-Macroscope Records (n=142) Non-Macroscope with MU1 Restriction (n=86) NYC Macroscope (n=48)
Validity threshold ≥ 0.80

Summary
Both indicators of hypercholesterolemia performed poorly
All other measures performed well
The above conclusions are consistent across NYC Macroscope and Non-Macroscope records
Restricting records to those from providers who have attested to stage 1 Meaningful Use improved the sensitivity of the obesity, smoking and hypertension diagnosis indicators

Strengths and Limitations
Strengths Heterogeneity of providers (N = 172) and EHR vendor platforms (N > 20) Innovative sample and gold standard criterion
Limitations Small sample size/large confidence intervals

Conclusions
NYC Macroscope indicators of obesity, smoking, diabetes and hypertension prevalence are ready for use by NYC Macroscope
NYC Macroscope indicator definitions of obesity, smoking, diabetes and hypertension are generalizable to EHR data from other sources
Further work is required to develop valid indicators of hypercholesterolemia
Incorporating meaningful use criteria into EHR surveillance system design may improve validity, especially for obesity, smoking and hypertension diagnosis indicators

WHAT HAVE WE LEARNED?

• Improved ability to monitor burden of key health conditions (timeliness, completeness, smaller areas,
smaller populations)
What are our aspirations for population health surveillance using EHRs?

• Improved ability to monitor burden of key health conditions (timeliness, completeness, smaller areas,
smaller populations)
• IMPORTANT CONTEXT: Meaningful Use (MU) criteria have incentivized hospitals and practices to record
and exchange structured data on patients
• Focus has been on improving syndromic surveillance, immunization, and electronic laboratory reporting
• Hospital MU reporting is rapidly improving. Primary care practices (PCP) are adopting EHRs, but face
larger challenges achieving MU or other incentivized criteria
• Still….EHR expansion among PCPs extends surveillance opportunities to chronic disease prevalence,
behavioral risk factors and clinical preventive services
• Improved ability to monitor quality of clinical care (disease management)
• Unique aspiration of EHR-based surveillance, beyond what telephone surveys or claims data can provide
What are our aspirations for population health surveillance using EHRs?

• NYC Macroscope sample represented 17% of the 4.1
million adult New Yorkers in care in 2013
• Approximately 10% of all primary care providers in NYC
• Population coverage ranged from 8%-47% across
neighborhoods
• Lower penetrance in more affluent areas of the city
What Impact Does Coverage and Representativeness of NYC Macroscope Sample Have?
Newton-Dame et al, eGEMS 2016

• Before weighting, patients in NYC Macroscope were
younger and more likely to be living in high poverty
neighborhoods than NYC adults in care overall
• By statistically weighting to as many factors as
available in both EHR and ‘gold standard’ data
sources, we sought to reduce selection bias
• For most indicators with low measurement error,
prevalence estimates were comparable to ‘gold
standard’ survey, suggesting minimal selection bias
Representativeness of the NYC Macroscope Sample
Newton-Dame et al, eGEMS 2016

• Approximately 75% of the NYC adult population is “in care” (seen provider in past year)
In-care population more likely to be: Older, female, non-Hispanic and insured
…more likely to have: Diabetes, hyperlipidemia, and hypertension
• Changing proportions of the population that is uninsured/underinsured over time can influence
surveillance validity (uncertain future of ACA)
Currently may be inappropriate to generalize findings from primary care EHR systems in the
United States to the total population (including persons not in care)
Who Can We Generalize To? ….Estimate to the “In Care” vs Total Population
Romo et al, Preventing Chronic Disease 2016
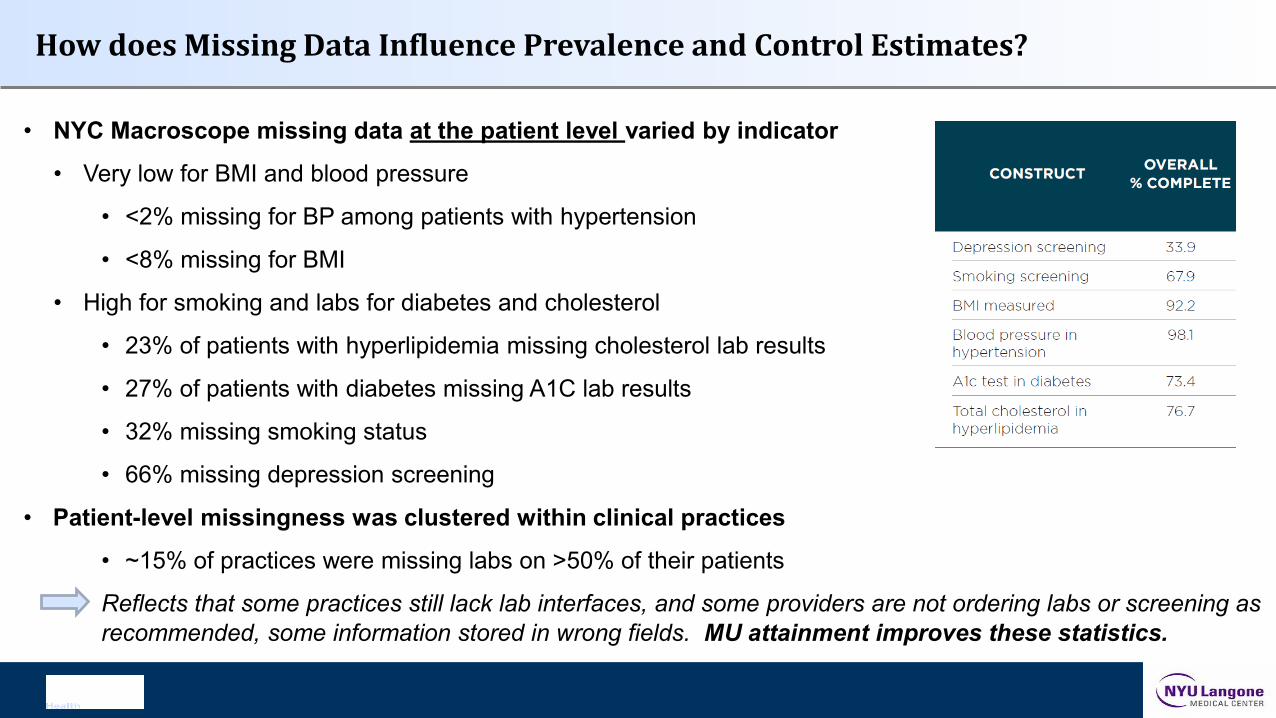
• NYC Macroscope missing data at the patient level varied by indicator
• Very low for BMI and blood pressure
• <2% missing for BP among patients with hypertension
• <8% missing for BMI
• High for smoking and labs for diabetes and cholesterol
• 23% of patients with hyperlipidemia missing cholesterol lab results
• 27% of patients with diabetes missing A1C lab results
• 32% missing smoking status
• 66% missing depression screening
• Patient-level missingness was clustered within clinical practices
• ~15% of practices were missing labs on >50% of their patients
Reflects that some practices still lack lab interfaces, and some providers are not ordering labs or screening as
recommended, some information stored in wrong fields. MU attainment improves these statistics.
How does Missing Data Influence Prevalence and Control Estimates?
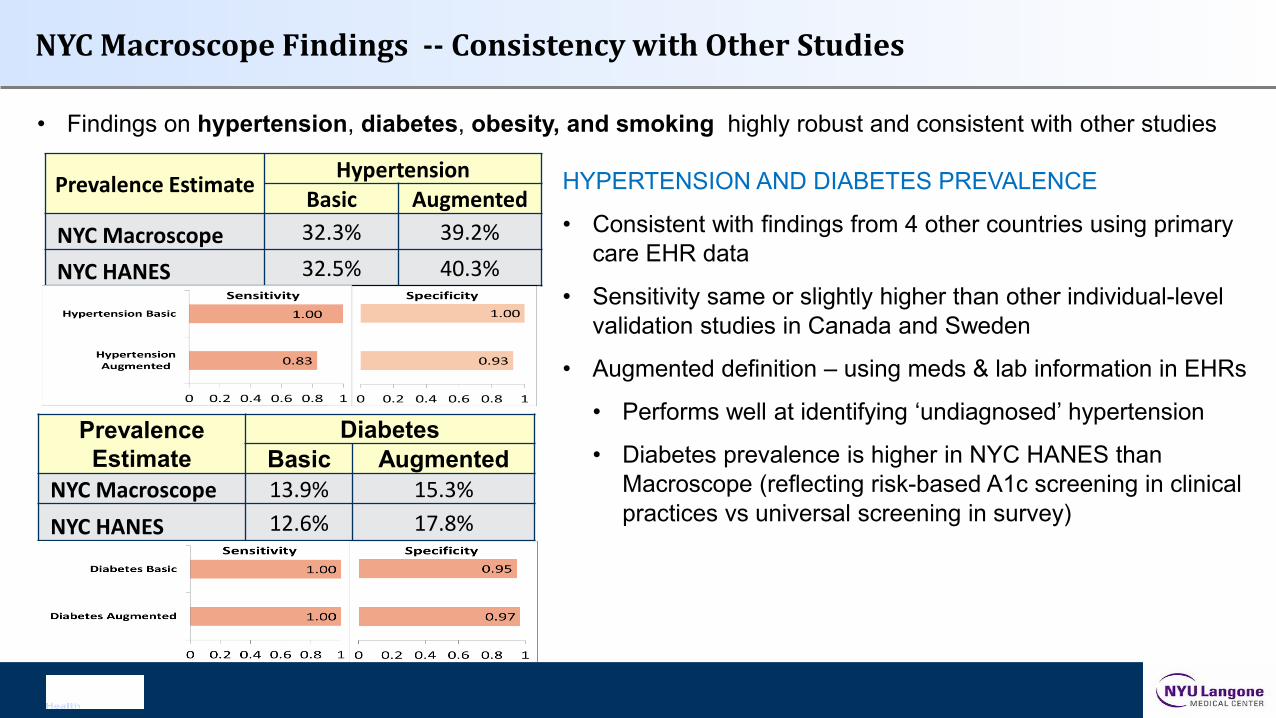
• Findings on hypertension, diabetes, obesity, and smoking highly robust and consistent with other studies
NYC Macroscope Findings -- Consistency with Other Studies
Prevalence Estimate Hypertension
Basic Augmented
NYC Macroscope 32.3% 39.2%
NYC HANES 32.5% 40.3%
HYPERTENSION AND DIABETES PREVALENCE
• Consistent with findings from 4 other countries using primary
care EHR data
• Sensitivity same or slightly higher than other individual-level
validation studies in Canada and Sweden
• Augmented definition – using meds & lab information in EHRs
• Performs well at identifying ‘undiagnosed’ hypertension
• Diabetes prevalence is higher in NYC HANES than
Macroscope (reflecting risk-based A1c screening in clinical
practices vs universal screening in survey)
Prevalence
Estimate
Diabetes
Basic Augmented
NYC Macroscope 13.9% 15.3%
NYC HANES 12.6% 17.8%

• Findings on hypertension, diabetes, obesity, and smoking highly robust and consistent with other studies
NYC Macroscope Findings -- Consistency with Other Studies
OBESITY AND SMOKING PREVALENCE
• NYC Macroscope estimates are lower than NYC HANES, yet
estimates are closer to directly-measured NYC HANES than widely
used telephone survey estimate
• Sensitivity and specificity indicate little measurement error, consistent
with other published chart reviews
• Obesity has minimal missing data, smoking has substantial missing
data, but appears to be non-differential (by age group, sex and
neighborhood poverty)
Prevalence
Estimate Obesity
NYC Macroscope 27.9%NYC HANES 31.3%NYC CHS 24.7%
Sensitivity 0.92
Specificity 0.97
Prevalence Smoking
NYC Macroscope 15.2%NYC HANES 17.7%NYC CHS 14.9%
Sensitivity 1.0
Specificity 1.0

• Validation of hyperlipidemia estimates less successful – similar to experiences elsewhere
HYPERLIPIDEMIA PREVALENCE
• Consistent with 3 other countries, our validation did not identify
that EHR estimates were statistically equivalent to survey
measures
• Sensitivity and specificity were below thresholds in all samples
• Longer screening interval, shifting definitions, and
diagnosis/treatment dependence on other factors may
contribute to poor estimation
Areas still in need of improvement: Hyperlipidemia Prevalence
Prevalence Estimate
High Cholesterol
Basic Augmented
NYC Macroscope 49.3% 54.5%
NYC HANES 46.9% 56.8%

• Few studies have examined ability of EHR records to estimate treatment and control of chronic diseases
• Our study found treatment and control of hypertension, diabetes and hyperlipidemia performed poorly
• Definitions more complex than prevalence (requiring long med lists, lab results, and nested queries)
• Statistical power for comparisons limited by small sample sizes of diagnosed adults in NYC HANES
Areas still in need of improvement: Treatment and Control Measures
Needs Improving:
• EHR coverage
• Provider representation
• Patient-level documentation
• Proper disease management

Next Steps
• Analyzing trend data (2012-2015)
o Validate trends against the NYC Community Health Survey
o Examine data by race and health disparities
Constructing and validating small geographic area estimates
Developing and testing additional indicators (e.g. childhood obesity)

Thank you!
Sharon Perlman: [email protected]
Tina McVeigh: [email protected]
Lorna Thorpe: [email protected]
We can also be reached at [email protected], or search for “NYC Macroscope”.

Indicator Definitions

Indicator Definitions

Indicator Definitions

Indicator Definitions