can data analysis improve processes?
TRANSCRIPT

Can Data Analysis Improve Process?
Sam Carr

Content• What is data? What is big data?• The importance of data analysis.• Risk of poor business processes.• How data analysis improves business
processes.• Business processes impact your
operations.

What is Data?
• Data is a set of valuable information.
• Data can be measured, collected, reported and analyzed.

What is Big Data?
• Big Data = HUGE Volume

What is Big Data?

Big Data Characteristics
• Volume• Variety• Velocity• Veracity

Who Uses Big Data?

The Importance of Data Analysis
• Understand your business.• Know your business risks.• Provide valuable information for
management decisions.

Risks of Poor Processes
• Misstatement of financial reporting• Fraud• Sales decrease • Cost inefficiencies

How data analysis improves business processes
1. Understand your purpose.

How data analysis improves business processes
2. Understand your data.

How Data Analysis Improves Business Processes
3. Choose the right analytic tool. (i.e. IDEA) and perform data analytics

How Data Analysis Improves Business Processes
4. Identify gaps based on the analysis results

How Data Analysis Improves Business Processes
5. Improve your business processes

How Data Analysis Improves Business Processes
6. Practical examples

AP Data Cleaning
Background • PBC had items paid or otherwise resolved that remained
in the Company’s Purchase Order System (PO System) and the Company’s home grown three-way-match portal databases.
• PBC was going to convert to Oracle and Management wanted to have clean date before conversion.
• The total of accumulated liability was $325 million but Management estimated the total was around $5 to $6 million.

AP Data Cleaning
1. Understand the purpose
To identify purchase order line items that have been paid or have otherwise been resolved, but remain in the PO system

AP Data Cleaning
2. Understand the data
Data Received • Purchase Order (PO) file - the Open PO
detail by line item was extracted from the PO system/ three-way match system
• Accounts Payable (AP) file - the vendor history file of payments from AP system

AP Data Cleaning
2. Understand the data (Cont.)
• 10-year range: May 2002 – April 2012• 21,434 PO’s and 80,372 line items totaling
$325M• 292,901 AP payments totaling $1.8B

AP Data Cleaning
3. Choose the right tool and perform data analytics (we chose IDEA)
• Quickly processing large data files• Smart queries• Drawing the process flow for the analysis
to create the audit trail for re-performance

AP Data CleaningData Analysis Procedure in IDEA

AP Data CleaningData Analysis Procedure in IDEA (Cont.)
PO file
Join file
PO Summarization
file
C1
AP file
AP Summarization
file
C2 C3 C4 C5 C6 C7
C1 w PO lines
C2 w PO lines
C3 w PO lines
C4 w PO lines
C5 w PO lines
C6 w PO lines
C7 w PO lines

AP Data CleaningData Analysis flowchart per IDEA
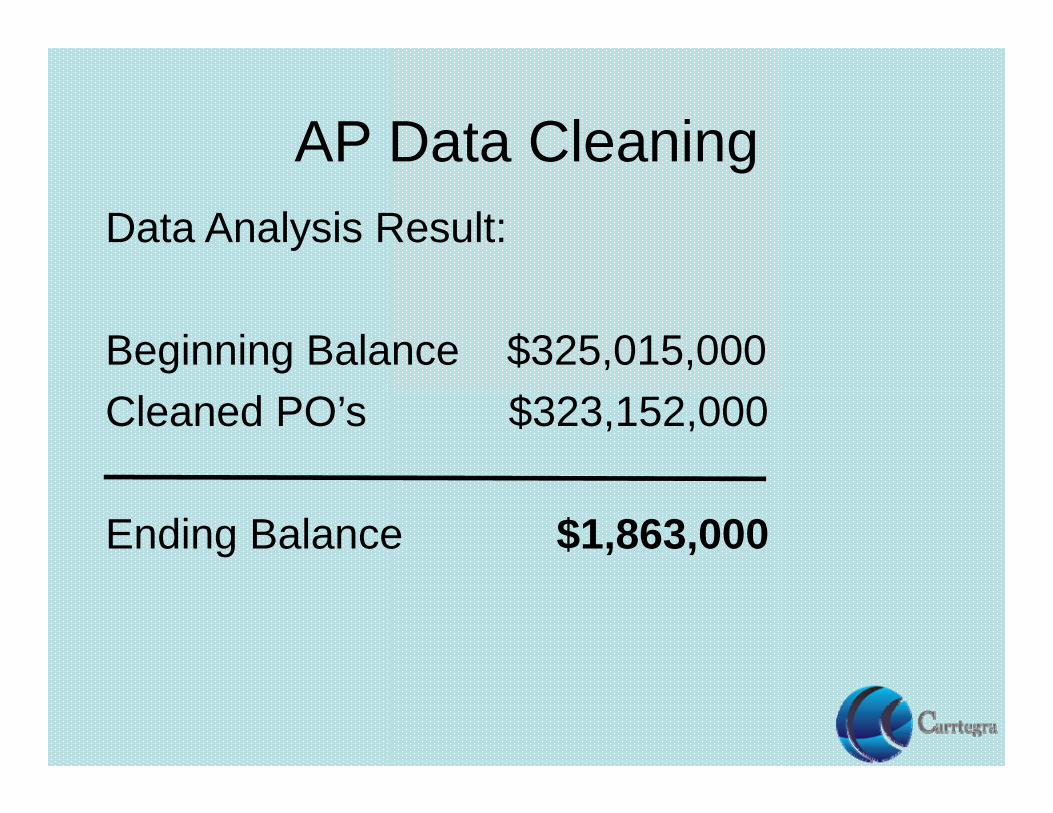
AP Data CleaningData Analysis Result:
Beginning Balance $325,015,000Cleaned PO’s $323,152,000
Ending Balance $1,863,000

AP Data Cleaning
4. Identify the gaps based on the analysis results
Why did this
happen?
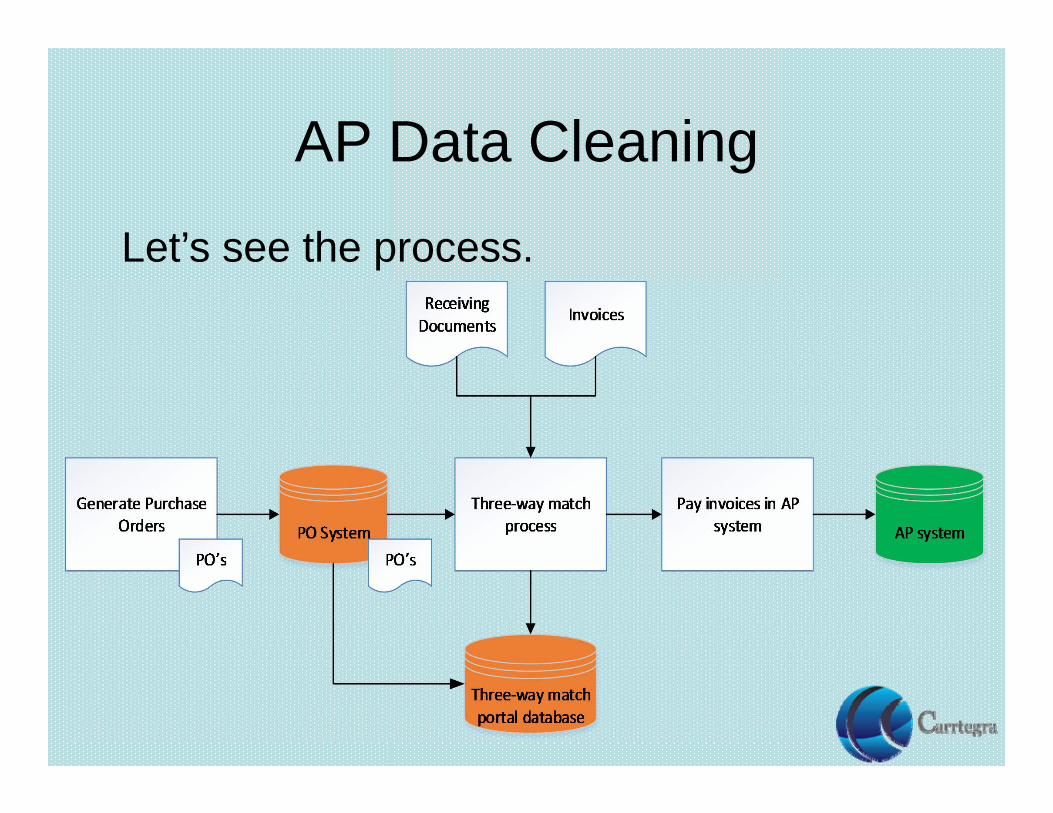
AP Data Cleaning
Let’s see the process.

AP Data Cleaning
5. Improve your business process• Fix the process• Routine testing of three-way match

AP Data Cleaning
Let’s see what should be improved
Close paid PO’s in PO system and
3‐way match portal
Three‐way match process
Pay invoices in AP system
3‐way match in AP system? YesNo

Fuel Card Compliance
Background• NPI issued fuel cards to employees who
were assigned trucks • Fuel cost increased around 15% from
2013 to 2014 but miles driven increased only 3%
• Why did fuel costs increase so much?
Fuel Card Compliance
1. Understand the purpose
To identify the cause for the increase of fuel cost .

Fuel Card Compliance
2. Understand the data
Data Received • 2013 fuel card activities• 2014 fuel card activities• Detail of employees assigned trucks and
issued Fuel Cards – both years

Fuel Card Compliance
2. Understand the data (Cont.)
• In 2013, the miles driven was 6.3 million; the fuel gallon purchased was 577,000 and the cost was $2.1 million
• In 2014, the miles driven was 6.6 million; the fuel gallon purchased was 623,000 and the cost was $2.4 million

Fuel Card Compliance
3. Choose the right tool (IDEA or Excel) and perform data analytics
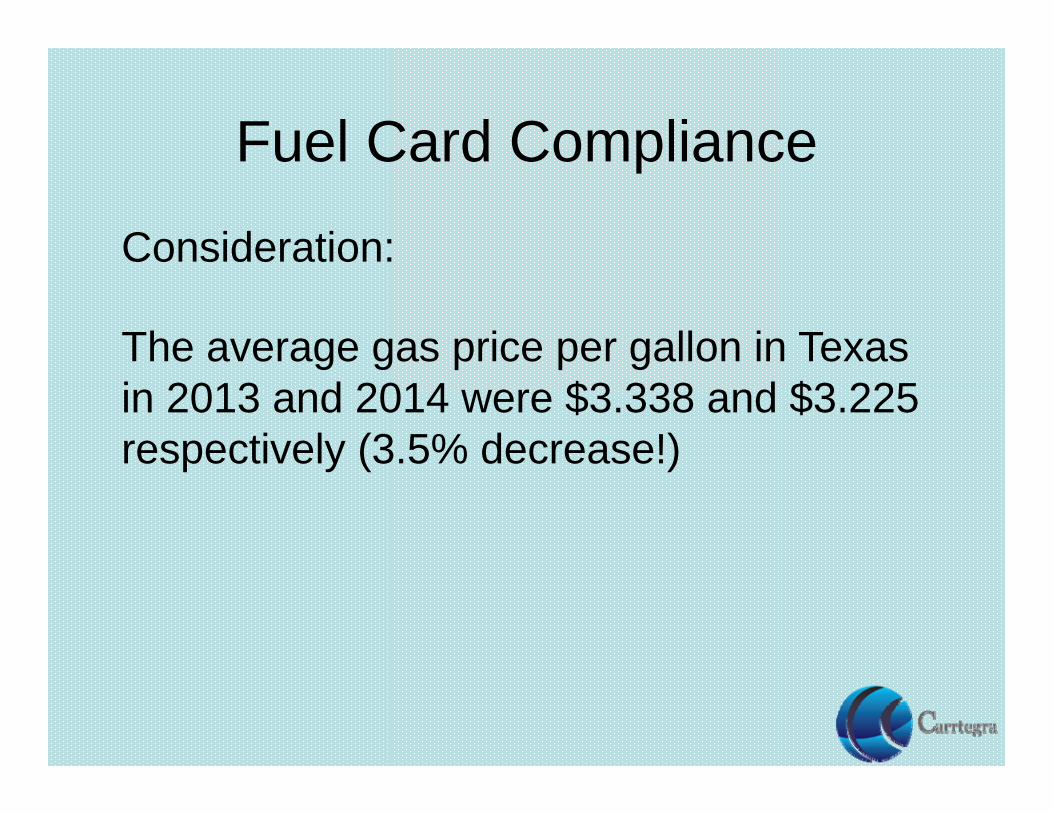
Fuel Card Compliance
Consideration:
The average gas price per gallon in Texas in 2013 and 2014 were $3.338 and $3.225 respectively (3.5% decrease!)
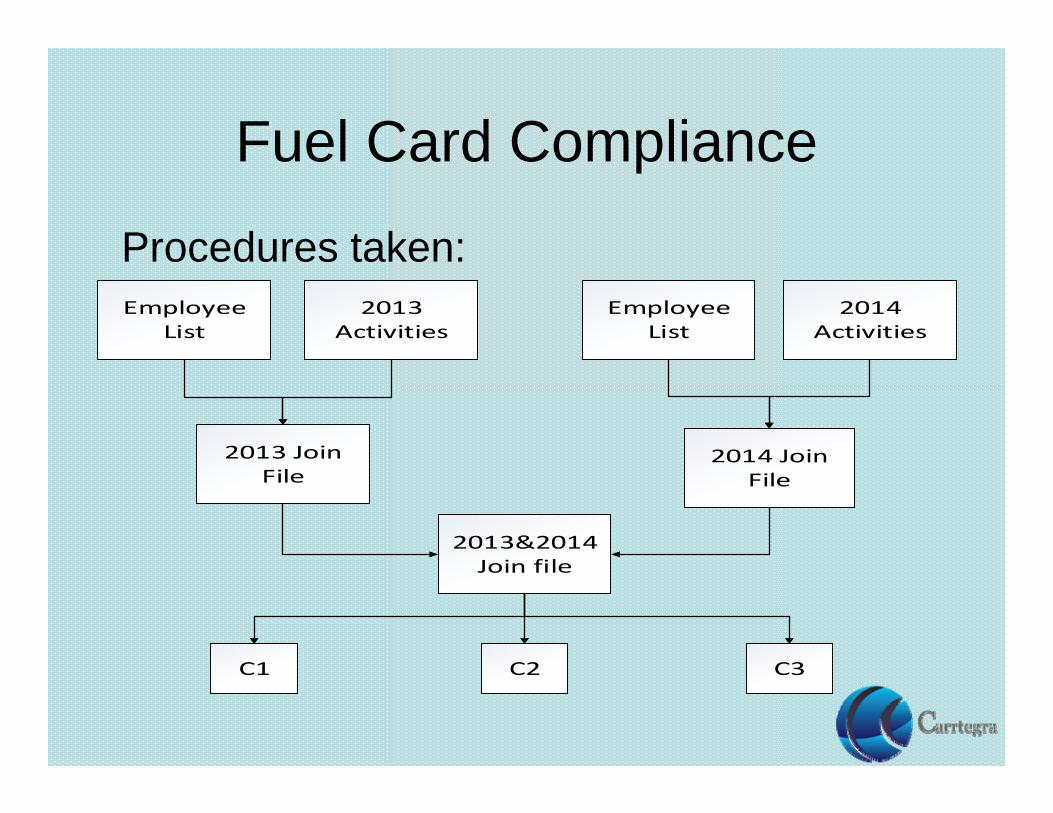
Fuel Card Compliance
Procedures taken:Employee
List
2013&2014Join file
2013 Join File
2014 Activities
2014 Join File
Employee List
2013 Activities
C1 C2 C3