can cloud computing be labeled as “green”? insights under...
TRANSCRIPT

Contents lists available at ScienceDirect
Renewable and Sustainable Energy Reviews
journal homepage: www.elsevier.com/locate/rser
Can cloud computing be labeled as “green”? Insights under anenvironmental accounting perspective
André L.A. Di Salvoa, Feni Agostinhob,⁎, Cecília M.V.B. Almeidab, Biagio F. Giannettib
a Brazilian Federal Institute for Education, Science and Technology at South region of Minas Gerais State (IFSULDEMINAS), Brazilb Paulista University (UNIP), Post-graduation Program in Production Engineering, Brazil
A R T I C L E I N F O
Keywords:Data centerEmergyCloud ComputingGreen ICT
A B S T R A C T
The importance of information and communication technology (ICT) sector on the global energy consumptionand CO2 emissions tend to grow. ICTs have a fundamental role in collaborating for a sustainable developmentby providing services in an efficient way, however, its own structure should also follow sustainable principles, forinstance, by consuming lower energy amount. The quest for sustainability of ICTs has been focused on datacenters (DC) optimization through techniques of sharing infra-structures, which would result in energyefficiency increase, carbon footprint reduction, and reduction of e-waste material disposal. In this scenario, thecloud computing technique rises as the most promising one, often receiving the “green” label. However, thislabel is usually based on electricity consumption reduction and disregards several other important “green” label-related aspects. This work uses emergy accounting (spelled with an “m”) and direct energy consumption incalculating indicators of eco-energy efficiency for DC operating under traditional and cloud computingtechniques. A traditional decentralized DC and a centralized cloud computing DC are herein considered forillustrating figures and for discussion. Results show that centralized DC is able to provide a virtual machine(VM) by demanding 51% less electricity than decentralized DC, and it consumes 87% less electricity to store abyte. Under an emergy accounting perspective, the centralized DC demands 45% less global resources than thedecentralized DC to provide a VM while demanding 85% less global resources to store a byte. Although theassessed indicators point out better eco-energy efficiency performance for the DC using cloud computingtechniques, labeling it as “green” could be considered as premature due to a lack of threshold which allows forcategorizing a system as “green”. Nevertheless, the centralized DC evaluated should be promoted due to itsbetter performance as for the considered indicators.
1. Introduction
Recent energetic crises have resulted in higher awareness of thenegative effects of energy waste and their relation with climaticchanges, highlighting the importance of sustainability to society,industry, and the academic community [1]. The concepts behindsustainability can be applied to different production systems andscales, from a world strategic energy planning until a life-style for anindividual person in a society. Specifically for companies that work oninformation and communication technology (ICT) issues, efforts aim-ing to improve their sustainability have been focused on the optimiza-tion of data centers (DC) in order to maximize computational resourcesusage [2]. Such efforts are relevant as DC's are infrastructures thatdemand high cost for maintenance and high energy consumption ([3–5]). This is especially important as about 30% of the existing servers in
a DC are usually named “dead”, i.e. they are kept switched on full time,consuming energy under a user-ratio ranging from 5% to 10% of theircapacity [6]. This results in energy and material wastage and goes inthe countercurrent of sustainability objectives.
Various concepts and technologies have emerged in the search forbetter efficiency in the use of energy and materials in DC, which iswhere cloud computing (CC) somehow stands out. According toMadhubala [7], CC is the result from the convergence and evolutionof various concepts of virtualization, distributed applications projects,computer grid, and ICT management. Cloud computing attempts tomaximize computational resources by sharing an infrastructure amongseveral users. Estimates from Cisco Global Cloud Index [8] point outthat 78% of the 2018 workload - including processing and storage –will be concentrated in cloud-operating DC's, including importantworldwide energy sectors as oil & $2 gas ([9,10]). Among several
http://dx.doi.org/10.1016/j.rser.2016.11.153Received 9 October 2015; Received in revised form 25 August 2016; Accepted 12 November 2016
⁎ CCorrespondence to: Universidade Paulista (UNIP), Programa de Pós-Graduação em Engenharia de Produção, Laboratório de Produção e Meio Ambiente, Rua Dr. Bacelar, 1212,CEP 04026-002, São Paulo, Brazil.
E-mail address: [email protected] (F. Agostinho).
Renewable and Sustainable Energy Reviews 69 (2017) 514–526
1364-0321/ © 2016 Elsevier Ltd. All rights reserved.
crossmark
potential alternatives focusing on a societal sustainable development,the increase usage of CC as a service provider has receiving specialattention due to its advantages in supporting the management ofcritical areas as energy; an example is provided by Fang et al. [11] thatemphasizes the importance of CC to smart grid in improving thepreparedness disaster level and its resilience. Simultaneously, regard-ing its own structure, several advantages in using CC rather atraditional DC is emerged. For instance, Steenhof et al. [12] argue thatresorting to CC brings about energetic-environmental benefits, includ-ing (i) reduction of wasted computing resources through bettermatching of server capacity with actual demand, (ii) flattening relativepeak loads by serving large numbers of organizations and users inshared infrastructures, (iii) operating servers at optimal utilizationrates. These benefits have been discussed by Markovic et al. [13] whopoint out that CC is more efficient in terms of electricity consumptionper service offered than traditional computing. Buyya et al. [3] alsostate that clouds are projected to be efficient energetic-wise whilecontributing to the reduction in carbon-print, a result corroborated byWilliams et al. [14] who foresee a 4.5 million-ton CO2 reduction by thetime CC reaches at least 80% of the market share in selected globalcountries. Beloglazov et al. [15] also emphasize that, besides havingbeen projected to reduce operational costs, CC could also reduceimpacts on the environment.
Advancements on CC technological and environmental perfor-mance have been done during last years, in which according toFulgare and Bhargav [16], improvements in data centers will happenby focusing mainly on realtime measurement and control, modelvalidation and heuristic based optimization, thermal energy storageand smart-grid capabilities. Shuja et al. [17] summarized studies thatassessed the sustainable and green cloud data center paradigm, inwhich renewable energy usage and waste heat utilization techniquesare the mostly used practices. According with these authors, usingmultiple sustainability techniques leads to a successful green clouddata center model, by reducing energy consumption and carbonfootprint. Rong et al. [18] discuss about the possibilities in greeningdata centers by choosing reasonable site selection (this would reduceup to 15% of total energy consumption), choosing low-power serversand auxiliary energy-saving devices (that would lead to a reduction upto 30% of currently energy usage), and optimizing resources schedulingalgorithm and management strategies (that would reduce up to 15% inthe energy used). Ebrahimi et al. [19] indicates that absorption coolingand organic Rankine cycle are the most promising technologies for datacenter waste heat reuse. Zhang et al. [20] state that among the threecategories of free cooling systems, the heat pipe system has goodenergy efficiency and cooling capacity.
Considering that reduction in direct energy consumption and itsconsequent reduction in CO2 emissions are aligned with the aims ofsustainability and the “green” label [2,5], all these presented CCbenefits have been used to support the statement that CC is atechnology that contributes to the concepts of green ICT [21].However, according to Sharma et al. [22], by adopting mechanismsto provide reliability in CC services (i.e. an increase in its size andcomplexity) usually results in higher energy consumption and carbonfootprint, indicating the existence of a trade-off and the need forfurther efforts in studying this threshold limit. . According to theMurugesan's et al. [23] definition of green computing as “the study andpractice of designing, manufacturing, using, and disposing of compu-ters, servers, and associated subsystems (i.e. monitors, printers,storage devices, and networking and communicating systems) effi-ciently and effectively, with minimal or no impact on the environment”,considering only the direct electricity consumption and its indirect CO2
emission to label CC as “green” could result in a reductionist approach,since it only considers the operational phase of DC, disregarding thematerials and equipment manufacture and disposal phases. This is alsorecognized by Cramer [24] who discusses the hidden costs of the so-called green ICTs, in which the fallacy of disregarding much of the life-
cycle of apparently “green” ICT devices are evaluated. Consumption ofany product demands raw materials and energy from the Earth and theinoperable products must be disposed of when reaching their lifespanlimit. In this sense, this kind of rebound effect1 raises doubt about howgreen a data center might turn out to be by using cloud-computingtechniques, i.e. a reduction on direct energy consumption can beobtained, but when viewed under a larger perspective, an energyincrease can be observed In this sense, Schnitzer and Ulgiati [25]argue about the need for additional and complementary performanceindicators in measuring sustainability of production systems, in whichdifferent scales and dimensions are considered by different scientificmetrics.
In an attempt to provide scientific-based indicators closely relatedto the “green” concept, new CC assessment approaches should be used.Among others, (e.g. life cycle assessment, embodied energy analysis,material flow accounting, and so on), the emergy (spelled with an “m”)environmental accounting emerges as an alternative. Emergy is theavailable energy of one kind, previously used up directly and indirectlyto produce a service or a good [27]. It is a biophysical evaluation toolfocused on a donor's-side view, which considers a holistic and globalscale perspective. Supported by the laws of thermodynamics andgeneral systems theory, this methodology aims to quantify all energyand materials flows (from both economy and nature) used in theproduction of a service or a good, and making it available. Theadvantage in using emergy accounting rather than directly used energyanalysis and/or indirect CO2-eq. emissions, as it is usually considered toclassify CC as “green”, is in that emergy recognize the “quality” ofenergy. In this sense, the evaluation scale is broader and closely relatedto green computing definition as provided by Murugesan et al. [23].
The aim of this work is to use emergy accounting and direct energyconsumption to calculate indicators of eco-efficiency and energyefficiency for DCs to support a critical discussion on the “green” labelas usually provided to cloud computing. To illustrate figures anddiscussion, two equivalent ICT structures are considered as case study:a traditional decentralized DC is compared against a centralized cloudcomputing DC. Complementarily, insights about using emergy ac-counting to obtain indicators of sustainability for ICT systems isprovided, which could be considered as an important step for emergypractitioners towards future discussions on concepts and calculationswhen studying this particular system.
2. Method
2.1. Case study description and raw data source
This work considers an important university in Brazil as a casestudy. In the year 2013, it had 92 thousand enrolled students in itsvarious graduation and post-graduation courses. To support teaching,research and extension activities, the aforementioned university had adata processing complex with close to eighty-six thousand devices,1,425 from which were web-servers located in 144 small DCs; thesenumbers emphasizes the importance of this university as a case studyobject. Every DC was directly linked to one university department, withan individual dedicated staff in charge of management and main-tenance. Besides the web-servers, for every DC was provided all othernecessary equipment, such as routers and no-breaks, among others, toguarantee the perfect system functioning. This one decentralized ICTinfrastructure is referred to, in this paper, as the “Legacy”.
Seeking to reduce energy consumption and the broadening of theICT services to final users, in 2012, the university began implementinga cloud-computing project. This structure is herein referred to as
1 Improving the efficiency in producing a good will result in a decrease of its effectiveprice and should therefore encourage a consumption increase for that good. In the end,the overall result will indicate that energy and materials savings through initial efficiencyreached was offset (or even exceeded) by the higher number of consumed goods [26].
A.L.A. Di Salvo et al. Renewable and Sustainable Energy Reviews 69 (2017) 514–526
515
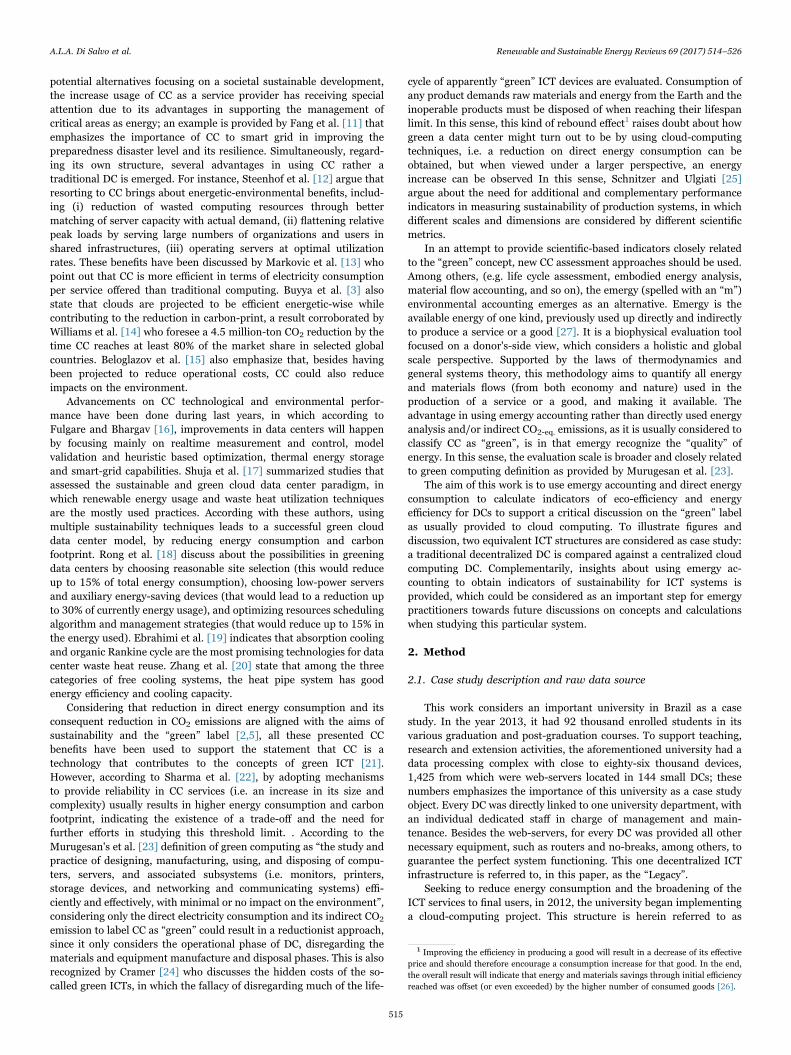
“Cloud”. With an estimated initial budget of fifty million dollars, thegoal envisaged by implementing the Cloud was to eliminate all 144existing small DC's in the Legacy. The whole infrastructure was now tobe connected to a single especially structured sector. A comparativeschematic between the legacy and the cloud is on Fig. 1. The mainfeatures of each infrastructure can be visualized on Table 1.
Raw data for the assessment of both systems were collected in locoby means of visits to the site and personal meetings with the manage-ment staff. For the Cloud, reports containing part numbers of everypiece of equipment were considered and compiled (Appendix B). Forthe Legacy, due to a secrecy agreement among the university depart-ments, macro-data were obtained from unpublished reports, furnishedby the university ICT management staff. Data on energy consumptionby the ICT equipment were obtained from technical catalogs, based onmanufacturer specifications.
2.2. Environmental accounting using emergy
Emergy approach is able to identify and quantify all energy andmaterials flows (both those from economy and those considered asfreely provided by nature) used by a production system in the makingof a good or a service [27]. Emergy can be considered as the energymemory of successive transformation processes from one energy typeinto another one, in which the starting point is the three main energysources that drive the geo-biosphere (usually named as Earth emergybudget or emergy baseline): solar insolation, tidal energy, and deepEarth heat. The energy memory concept considered in emergy methodis the same as the one considered in the embodied energy analysis [28]– one of the most widely recognized energy assessment approaches – inwhich the difference is related with the evaluation scale, i.e. the systemboundaries or window of attention. In embodied energy analysis, theresource is counted backwards until it reaches its fossil fuel status point(crude oil), whereas emergy method reaches farther still, extendingback to the existing natural resources in the geo-biosphere required tomake fossil fuel available [29].
The “quality” of energy is acknowledged and could be considered asthe main characteristic of emergy accounting as it advocates theexistence of an energy hierarchy in the universe, meaning that, while
on one hand a huge number of individuals have low influence over theUniverse, on the other hand, a few individuals have a higher influence.Every system forms a hierarchical series of energy transformationsalong which the scale of space and time increases. A large number ofsmall-scale processes contribute to the formation of a small number oflarge-scale processes, thus, energy is converted from low to highprocess orders. At every transformation step, available energy is wasted(2nd law of thermo-dynamics) whereas the energy “quality” increases.For example, Brown and Ulgiati [30] argue that a large number of solarenergy joules are required for obtaining one Joule of organic matter, alarge number of Joules of organic matter are required to obtain oneJoule of fossil fuel, several Joules of fossil fuel are required to obtainone Joule of electricity, and so forth. Further definitions, rules and usesof emergy accounting are accessible, mainly in Odum [27].
The emergy method has been used in several different case studies,from the assessment of natural [31], agricultural [32–34], andindustrial systems [35] to buildings and cities [36–38], and informa-tion [39]. However, emergy studies on ICT are hardly ever found inscientific literature.
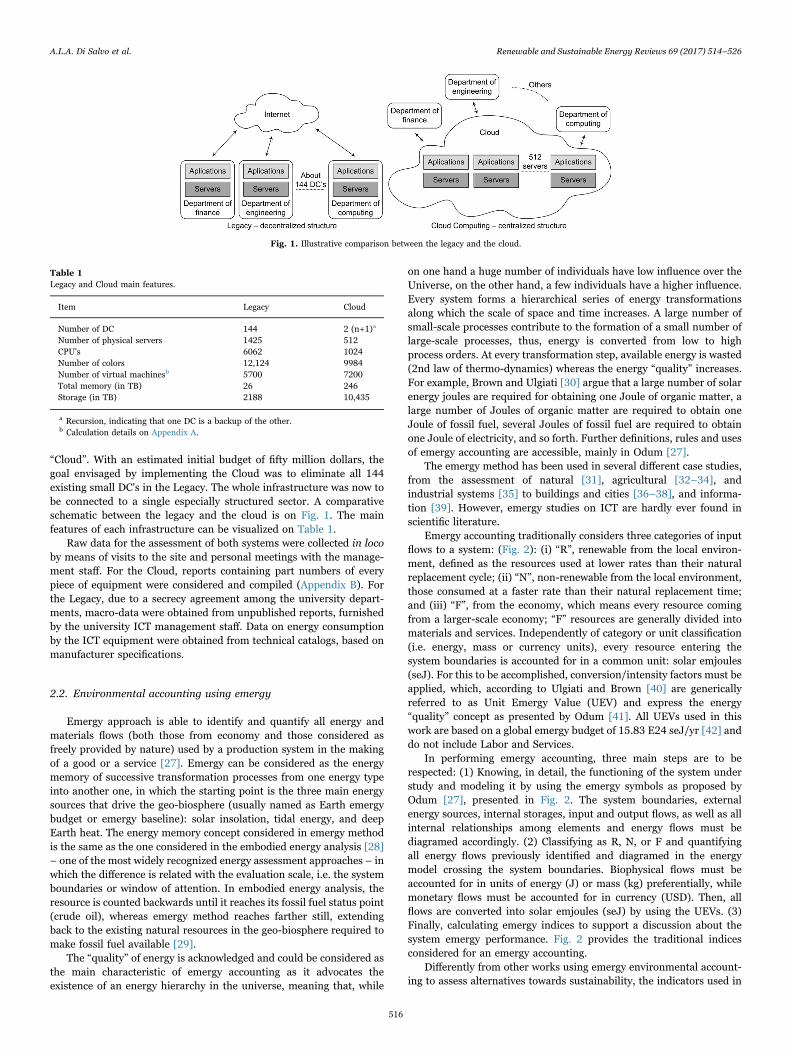
Emergy accounting traditionally considers three categories of inputflows to a system: (Fig. 2): (i) “R”, renewable from the local environ-ment, defined as the resources used at lower rates than their naturalreplacement cycle; (ii) “N”, non-renewable from the local environment,those consumed at a faster rate than their natural replacement time;and (iii) “F”, from the economy, which means every resource comingfrom a larger-scale economy; “F” resources are generally divided intomaterials and services. Independently of category or unit classification(i.e. energy, mass or currency units), every resource entering thesystem boundaries is accounted for in a common unit: solar emjoules(seJ). For this to be accomplished, conversion/intensity factors must beapplied, which, according to Ulgiati and Brown [40] are genericallyreferred to as Unit Emergy Value (UEV) and express the energy“quality” concept as presented by Odum [41]. All UEVs used in thiswork are based on a global emergy budget of 15.83 E24 seJ/yr [42] anddo not include Labor and Services.
In performing emergy accounting, three main steps are to berespected: (1) Knowing, in detail, the functioning of the system understudy and modeling it by using the emergy symbols as proposed byOdum [27], presented in Fig. 2. The system boundaries, externalenergy sources, internal storages, input and output flows, as well as allinternal relationships among elements and energy flows must bediagramed accordingly. (2) Classifying as R, N, or F and quantifyingall energy flows previously identified and diagramed in the energymodel crossing the system boundaries. Biophysical flows must beaccounted for in units of energy (J) or mass (kg) preferentially, whilemonetary flows must be accounted for in currency (USD). Then, allflows are converted into solar emjoules (seJ) by using the UEVs. (3)Finally, calculating emergy indices to support a discussion about thesystem emergy performance. Fig. 2 provides the traditional indicesconsidered for an emergy accounting.
Differently from other works using emergy environmental account-ing to assess alternatives towards sustainability, the indicators used in
Fig. 1. Illustrative comparison between the legacy and the cloud.
Table 1Legacy and Cloud main features.
Item Legacy Cloud
Number of DC 144 2 (n+1)a
Number of physical servers 1425 512CPU's 6062 1024Number of colors 12,124 9984Number of virtual machinesb 5700 7200Total memory (in TB) 26 246Storage (in TB) 2188 10,435
a Recursion, indicating that one DC is a backup of the other.b Calculation details on Appendix A.
A.L.A. Di Salvo et al. Renewable and Sustainable Energy Reviews 69 (2017) 514–526
516
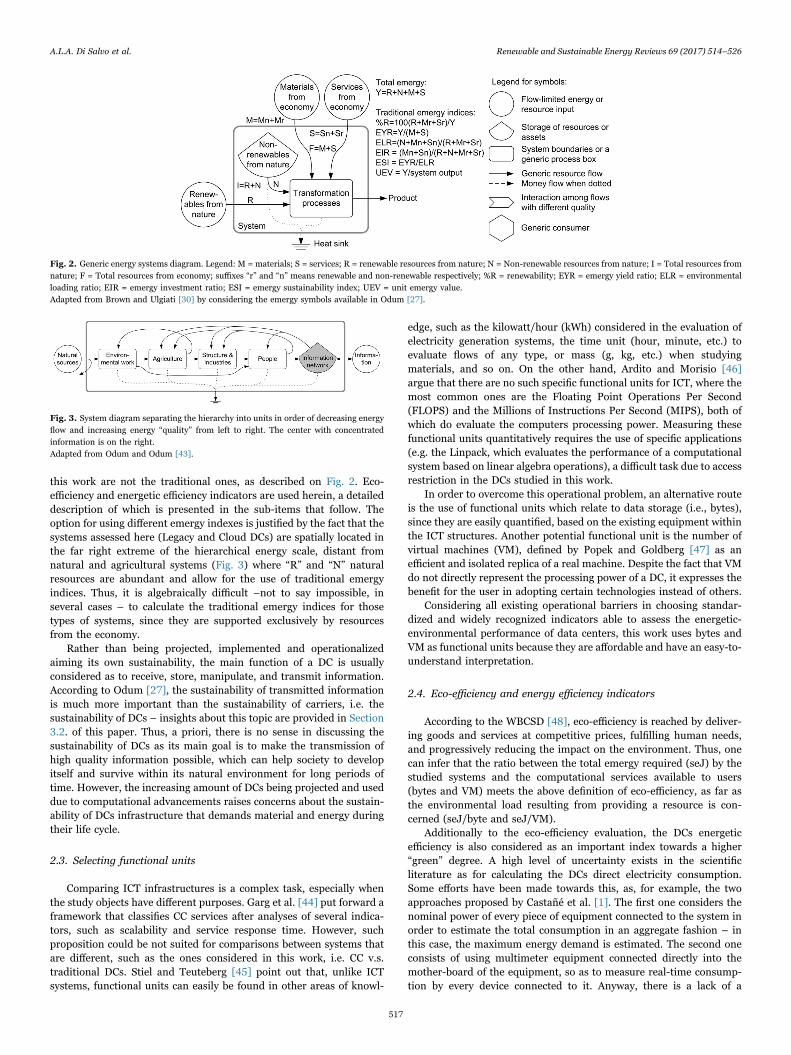
this work are not the traditional ones, as described on Fig. 2. Eco-efficiency and energetic efficiency indicators are used herein, a detaileddescription of which is presented in the sub-items that follow. Theoption for using different emergy indexes is justified by the fact that thesystems assessed here (Legacy and Cloud DCs) are spatially located inthe far right extreme of the hierarchical energy scale, distant fromnatural and agricultural systems (Fig. 3) where “R” and “N” naturalresources are abundant and allow for the use of traditional emergyindices. Thus, it is algebraically difficult –not to say impossible, inseveral cases – to calculate the traditional emergy indices for thosetypes of systems, since they are supported exclusively by resourcesfrom the economy.
Rather than being projected, implemented and operationalizedaiming its own sustainability, the main function of a DC is usuallyconsidered as to receive, store, manipulate, and transmit information.According to Odum [27], the sustainability of transmitted informationis much more important than the sustainability of carriers, i.e. thesustainability of DCs – insights about this topic are provided in Section3.2. of this paper. Thus, a priori, there is no sense in discussing thesustainability of DCs as its main goal is to make the transmission ofhigh quality information possible, which can help society to developitself and survive within its natural environment for long periods oftime. However, the increasing amount of DCs being projected and useddue to computational advancements raises concerns about the sustain-ability of DCs infrastructure that demands material and energy duringtheir life cycle.
2.3. Selecting functional units
Comparing ICT infrastructures is a complex task, especially whenthe study objects have different purposes. Garg et al. [44] put forward aframework that classifies CC services after analyses of several indica-tors, such as scalability and service response time. However, suchproposition could be not suited for comparisons between systems thatare different, such as the ones considered in this work, i.e. CC v.s.traditional DCs. Stiel and Teuteberg [45] point out that, unlike ICTsystems, functional units can easily be found in other areas of knowl-
edge, such as the kilowatt/hour (kWh) considered in the evaluation ofelectricity generation systems, the time unit (hour, minute, etc.) toevaluate flows of any type, or mass (g, kg, etc.) when studyingmaterials, and so on. On the other hand, Ardito and Morisio [46]argue that there are no such specific functional units for ICT, where themost common ones are the Floating Point Operations Per Second(FLOPS) and the Millions of Instructions Per Second (MIPS), both ofwhich do evaluate the computers processing power. Measuring thesefunctional units quantitatively requires the use of specific applications(e.g. the Linpack, which evaluates the performance of a computationalsystem based on linear algebra operations), a difficult task due to accessrestriction in the DCs studied in this work.
In order to overcome this operational problem, an alternative routeis the use of functional units which relate to data storage (i.e., bytes),since they are easily quantified, based on the existing equipment withinthe ICT structures. Another potential functional unit is the number ofvirtual machines (VM), defined by Popek and Goldberg [47] as anefficient and isolated replica of a real machine. Despite the fact that VMdo not directly represent the processing power of a DC, it expresses thebenefit for the user in adopting certain technologies instead of others.
Considering all existing operational barriers in choosing standar-dized and widely recognized indicators able to assess the energetic-environmental performance of data centers, this work uses bytes andVM as functional units because they are affordable and have an easy-to-understand interpretation.
2.4. Eco-efficiency and energy efficiency indicators
According to the WBCSD [48], eco-efficiency is reached by deliver-ing goods and services at competitive prices, fulfilling human needs,and progressively reducing the impact on the environment. Thus, onecan infer that the ratio between the total emergy required (seJ) by thestudied systems and the computational services available to users(bytes and VM) meets the above definition of eco-efficiency, as far asthe environmental load resulting from providing a resource is con-cerned (seJ/byte and seJ/VM).
Additionally to the eco-efficiency evaluation, the DCs energeticefficiency is also considered as an important index towards a higher“green” degree. A high level of uncertainty exists in the scientificliterature as for calculating the DCs direct electricity consumption.Some efforts have been made towards this, as, for example, the twoapproaches proposed by Castañé et al. [1]. The first one considers thenominal power of every piece of equipment connected to the system inorder to estimate the total consumption in an aggregate fashion – inthis case, the maximum energy demand is estimated. The second oneconsists of using multimeter equipment connected directly into themother-board of the equipment, so as to measure real-time consump-tion by every device connected to it. Anyway, there is a lack of a
Fig. 2. Generic energy systems diagram. Legend: M = materials; S = services; R = renewable resources from nature; N = Non-renewable resources from nature; I = Total resources fromnature; F = Total resources from economy; suffixes “r” and “n” means renewable and non-renewable respectively; %R = renewability; EYR = emergy yield ratio; ELR = environmentalloading ratio; EIR = emergy investment ratio; ESI = emergy sustainability index; UEV = unit emergy value.Adapted from Brown and Ulgiati [30] by considering the emergy symbols available in Odum [27].
Fig. 3. System diagram separating the hierarchy into units in order of decreasing energyflow and increasing energy “quality” from left to right. The center with concentratedinformation is on the right.Adapted from Odum and Odum [43].
A.L.A. Di Salvo et al. Renewable and Sustainable Energy Reviews 69 (2017) 514–526
517

common denominator that will enable for a comparison among DCs,regarding their energy efficiency.
Garg et al. [44] introduce two energy efficiency indexes that can beused for comparisons among DCs. One of them is the Power UsageEffectiveness (PUE), which considers the ratio of the energy consumedby the system (infrastructure + equipment) and the energy consumedby the equipment. The other one is the Data Center InfrastructureEfficiency (DCiE), obtained from dividing the energy consumed by theequipment by the total system energy (infrastructure + equipment).They are both similar and assess the influence of the equipment on thetotal electricity consumption of a DC, that is, the DCiE is calculated bythe expression 1/PUE. Besides being the most acknowledged indicatorby the international community working on energy consumption inICTs, the PUE is currently used by The Green Grid (www.thegreen-grid.org) to classify the 500 most efficient DC's regarding directelectricity usage.
In this work, direct electricity consumption is calculated for bothDCs studied by using the first method as presented by Castañé et al.[1]. Thus, the calculated value represents the DC maximum consump-tion, that is, the energy consumed by all machines operating at fullcapacity. Besides consumption by equipment, the electricity requiredfor cooling was also considered, since it is an item with a large potentialfor influencing a DC total energy consumption – this explains why largecompanies are moving their DCs to cold regions [24]. Lighting andother equipment such as fire and humidity controllers are notconsidered for lack of detailed information, but they are believed toaccount for but a small percentage of the total electricity consumed inthe DC. In order to obtain efficiency indicators that will establish arelationship between input and output, the electricity consumption isdivided by the same functional units considered in the eco-efficiencyindicators (bytes and VM). Finally, Table 2 presents the eco-efficiencyand energetic efficiency indicators used in this work.
The analysis of indicators results is based on the assumption that
they all are given the same weight and importance during the decision-making process. An integrated view supported by a radar diagram isconsidered for results analysis. In order to draw the diagram, all theindicators obtained for Legacy were considered as the referenceparameters and their values were set equal to “1”. Then, eachindividual indicator of Cloud was divided by its equivalent Legacyindicator and the obtained ratio diagrammed. The graphical readingshows how much better or worse performance than the Legacyindicator the Cloud indicator has, and which system has the bestoverall performance by looking at all indicators as a whole. Under theprocedure adopted, a smaller area would be interpreted as having abetter performance.
3. Results and discussion
Fig. 4 shows the energy diagram of both studied systems, Legacyand Cloud. Since both systems are conceived for the same purpose (i.e.data processing, storage, and information transmission), the energyand, materials flows crossing the system border are similar, however, indifferent quantities. The internal elements of the diagram are divided,basically, into two parts: one showing the relations and dependenciesof the energy and mass inflows to form an infrastructure stock; theother one representing the ICT equipment stock. While the infrastruc-ture stock requires energy and materials for building construction(including refrigeration and all other facilities) to support and maintainthe DCs, the stock of ICT equipment uses other energy and materials tosupport and maintain the equipment and electronics operating prop-erly. Electricity is a necessary high quality energy input, which interactswith other system inputs, such as Telecom services (i.e. routers andswitches) and Labor, and the internal storages of infrastructure andequipment to provide the final users with processing and storagepower. The financial support for the acquisition and maintenance ofthe DCs under study is subsidized by the state and federal govern-ments, and other funding agencies for research, since they belong to apublic university. The outputs of the systems studied are the computa-tional storage resources (measured in bytes) and virtual machinesmade available to academic community use.
Fig. 4 shows a smaller system located outside the main systemboundaries, in the upper right position. It represents the relations and
Table 2Description of the functional units, energetic efficiency indicators, and eco-efficiencyindicators used in this work.
Index Description Category
Functional unitsVM Virtual Machine. It is the number of virtual
machines available to users at every assessed DC.The total amount varies, according to theconfiguration of each VM and with the resourcesavailable at every DC.
Functional unit
Bytes Bytes. It is the amount of available space forstorage of information by the DC.
Functional unit
Eco-efficiency and energetic efficiency indexesseJ/VM Emergy/VM. It is the ratio of the total system
emergy (Y) to the number of virtual machines(VM) offered. The lower this index, the higher theefficiency in the use of emergy to provide virtualmachines.
Eco-efficiency
seJ/byte Emergy/byte. It is the ratio of the total systememergy (Y) to the amount of space provided thesystem (bytes). The lower this value, the higherthe efficiency in the use of emergy per storageunit.
Eco-efficiency
kWh/VM
Kilowatt-hour/VM. It is the ratio of the DCelectricity consumption (kWh) to the number ofthe number of virtual machines provided (VM).The lower this value, the higher the efficiency, i.e.lower electricity consumption required to feedvirtual machines.
Energeticefficiency
kWh/bytes
Kilowatt-hour/bytes. It is the ratio of theelectricity consumption by the DC (kWh) to itsstorage capacity. The lower this value, the higherthe efficiency, i.e. lower electricity consumptionper storage unit.
Energeticefficiency
Fig. 4. Energy diagram of the studied Data Center. Upper-right diagram represents thedemanded emergy by research and development activities necessary for the Data Centersystem.
A.L.A. Di Salvo et al. Renewable and Sustainable Energy Reviews 69 (2017) 514–526
518

emergy demanded to provide the services input to the main system. Inthis work the approach by Ulgiati and Brown [40] to accounting forLabor and Services inputs was considered, in which the services item ismeasured in currency and includes all hidden costs related to Laborand Services required to make the primary resource available. In thiscase, the biophysical amounts of energy and materials crossing thesystem boundaries are accounted for by using UEVs values excludingLabor & $2 Services, then, the market values of the same system inputsare accounted for as their value in currency. This is a very interestingaccounting approach– and its use is increasing among emergy analysts– especially when no information regarding the local/regional produc-tion of those primary products is available. Indirectly, the servicescategory also includes the emergy used by ICT companies for Researchand Development (R & $2D) of new technologies. A priori, theseinvestments are embedded in the market value of high-tech equipment.In spite of some uncertainties involved in this approach (i.e. since otherfactors such as profits, brand appeal, consumers’ wish, among others,are already accounted for in the cost of a device), it was considered dueto a lack of information about high-tech equipment production – thiswas expected, since industrial secrecy is involved in this highly profit-able business.
Tables 3 and 4 show the emergy evaluation of “legacy” and “cloud”respectively. Both tables have been divided into categories that includeinfrastructure, computers, electronic and telecommunication equip-
ment, operation, and services. Such division allows for a clearerunderstanding of which category influences most on the total emergybudget. The two last far-right columns in the tables show the influenceby each inflow on the system; while the first column indicates thepercentage values without including services, the second columnincludes services and it represents all the emergy used by the systemas a whole. Both approaches were considered in this work due torelated uncertainties in accounting services as currency (as previouslydescribed), thus the reader can interpret results under different views.
When comparing both systems disregarding the services category,one observes that the total Cloud emergy is about 5.02E+18 seJ/yr, afigure about nine times lower than the amount demanded by Legacy(4.40E+19 seJ/yr). When assessing the categories individually, oneverifies that both systems behave similarly, as the operation category isthe most representative one of the systems, contributing about 98% ofthe total emergy budget. This category includes the items electricityand labor, the latter representing 93.6% of total emergy for Legacy and72.5% for Cloud. In absolute values, the labor used by the Cloud isabout eleven times lower than the labor used by Legacy (1.07E+06USD/yr vs. 1.21E+07 USD/yr). These values corroborate one of theadvantages of cloud-computing presented by Sultan [56], in that thecost of migration from a traditional infrastructure to the cloud canreduce labor costs since there is less demand for labor in the Cloud.Electricity is the second most representative item of all in both systems
Table 3Emergy evaluation table of “Legacy” data center.
Item Category and description Unit/yr Amounta UEVb (seJ/Unit) Reference for UEV Emergyc (seJ/yr) Emergy without services (%) Emergy with services (%)
Infrastructure1 Lime g 7.98E+05 1.68E+09 [27] 1.34E+15 & $2lt;1 & $2lt;12 Cement g 1.15E+07 3.04E+09 [49] 3.50E+16 & $2lt;1 & $2lt;13 Crushed stone g 2.66E+07 1.68E+09 [27] 4.48E+16 & $2lt;1 & $2lt;14 Sand g 3.70E+07 1.68E+09 [27] 6.21E+16 & $2lt;1 & $2lt;15 Brick g 1.23E+07 3.36E+09 [27] 4.14E+16 & $2lt;1 & $2lt;16 Steel g 8.72E+06 3.16E+09 [50] 2.76E+16 & $2lt;1 & $2lt;1
Computers7 Computer g 6.56E+06 8.90E+10 [51] 5.83E+17 1.3 1.1
Electronics8 Plastic g 3.61E+05 9.68E+09 [52] 3.50E+15 & $2lt;1 & $2lt;19 Steel g 5.18E+05 3.16E+09 [50] 1.64E+15 & $2lt;1 & $2lt;110 Glass g 4.81E+04 2.77E+07 [42] 1.33E+12 & $2lt;1 & $2lt;111 Copper g 3.61E+04 3.00E+09 [53] 1.08E+14 & $2lt;1 & $2lt;112 Circuit board g 2.41E+05 3.00E+09 [54] 7.22E+14 & $2lt;1 & $2lt;1
Telecommunications13 Plastic g 1.96E+05 9.68E+09 [52] 1.89E+15 & $2lt;1 & $2lt;114 Steel g 3.44E+04 3.16E+09 [50] 1.09E+14 & $2lt;1 & $2lt;115 Copper g 1.85E+04 3.00E+09 [53] 5.55E+13 & $2lt;1 & $2lt;116 Circuit board g 1.59E+04 3.00E+09 [54] 4.76E+13 & $2lt;1 & $2lt;1
Others17 Steel rack g 4.58E+06 3.16E+09 [50] 1.45E+16 & $2lt;1 & $2lt;1
Operation18 Electricity J 3.39E+13 5.87E+04 [54] 1.99E+18 4.5 3.819 Labor USD 1.21E+07 3.40E+12 [55] 4.12E+19 93.6 79.7Emergy without Services = 4.40E+19 100.0 –
Services20 Infrastructured USD 4.71E+04 3.40E+12 [55] 1.60E+17 – &$2lt; 121 Equipmentse USD 1.28E+06 3.40E+12 [55] 4.35E+18 – 8.422 Electricityf USD 9.41E+05 3.40E+12 [55] 3.20E+18 – 6.2Emergy with Services = 5.17E+19 – 100.0
a Raw data available at Appendix Cb All UEVs are based on a global emergy budget of 15.83E+24 seJ/yr [42] and do not include Labor and Servicesc Emergy (seJ/yr) = Amount (Unit/yr) * UEV (seJ/Unit)d It includes items 1–6e It includes items 7–17 (Computers, Electronics, Telecommunication and Others)f It includes item 18
A.L.A. Di Salvo et al. Renewable and Sustainable Energy Reviews 69 (2017) 514–526
519

(4.5% in Legacy and 25.1% in Cloud) in relation to the total emergy.The 4.5% obtained for Cloud could be considered as high, but itselectricity consumption – in absolute units, i.e. J/yr – is about 37%lower than that of Legacy (2.14E+13 J/yr vs. 3.39E+13 J/yr). Thisresult corroborates the studies of Accenture [57], by which cloud-computing can reduce direct energy consumption by 30–90% com-pared to traditional computing. All other categories show similarbehavior, contributing around 2% to the total emergy of both systems,a negligible value as compared to the Operation category values, whichincludes electricity and labor items.
In an evaluation considering the services category, an increase inthe total emergy of both systems is observed (5.17E+19 seJ/yr forLegacy and 3.59E+19 seJ/yr for Cloud), the sevenfold increase in theCloud emergy being expressive, as compared to the 1.2 times increasefor the Legacy emergy. The Cloud formerly demanded about 9 timesless emergy than Legacy, however, in this new scenario, the differenceis 1.4 times smaller, indicating the influence of the services categoryover the total Cloud emergy. When analyzing the behavior of thecategories, one observes that the operation category continues to be themost representative one as for the Legacy, reaching 83% of its totalemergy. However, a different behavior is noticeable in the Cloud, as theServices category is now the most representative of total emergy,reaching 87%. The operation category, which formerly representedabout 98% of the total Cloud emergy, now represents around 14%.
When assessing the items that integrate the Services category of Cloud,the huge impact of its acquisition costs can be observed (computers,electronics, telecommunications and others) which represents about80% of the total system emergy. In absolute numbers, such figure isabout seven times the money invested in the Legacy (8.49 vs. 1.28million USD). This suggests that, under the approach considered in thiswork, the Cloud indirectly requires higher investments than Legacy inR & $2D to provide high-technology equipment, or even that marketvalues of the existing equipment in the Cloud are overestimated, due tothe existing subjectivity in the willing-to-pay quantitative metric. Theremaining categories contribute with less than 1% of total emergy,therefore their behavior remains unchanged, regardless of consideringor not considering the Services category. It is worth it pointing out that,should the Services category be measured under currency units by awilling-to-pay approach, these figures can change over time as a resultof economy-related circumstances. This emphasizes the importance ofmaking and presenting both calculations, i.e. considering and notconsidering the category Services.
3.1. Eco-efficiency and energy efficiency indicators
Figs. 5 and 6 present the graphic comparison between the assessedsystems considering the total emergy, energy efficiency, and eco-efficiency indicators. As for total emergy (seJ/yr), the Cloud indicates
Table 4Emergy evaluation table of “Cloud” data center.
Item Category and description Unit/yr Amounta UEVb (seJ/Unit) Reference for UEV Emergyc (seJ/yr) Emergy without services (%) Emergy with services (%)
Infrastructure1 Lime g 9.85E+04 1.68E+09 [27] 1.65E+14 & $2lt;1 & $2lt;12 Cement g 1.42E+06 3.04E+09 [49] 4.32E+15 & $2lt;1 & $2lt;13 Crushed stone g 3.29E+06 1.68E+09 [27] 5.52E+15 & $2lt;1 & $2lt;14 Sand g 4.56E+06 1.68E+09 [27] 7.66E+15 & $2lt;1 & $2lt;15 Brick g 1.52E+06 3.36E+09 [27] 5.11E+15 & $2lt;1 & $2lt;16 Steel g 1.08E+05 3.16E+09 [50] 3.40E+14 & $2lt;1 & $2lt;1
Computers7 Blade Server200/230 g 8.36E+05 8.90E+10 [51] 7.44E+16 1.5 & $2lt;1
Electronics8 Plastic g 7.80E+05 9.68E+09 [52] 7.55E+15 & $2lt;1 & $2lt;19 Steel g 1.12E+06 3.16E+09 [50] 3.53E+15 & $2lt;1 & $2lt;110 Glass g 1.04E+05 2.77E+07 [42] 2.88E+12 & $2lt;1 & $2lt;111 Copper g 7.80E+04 3.00E+09 [53] 2.34E+14 & $2lt;1 & $2lt;112 Circuit board g 5.20E+05 3.00E+09 [54] 1.56E+15 & $2lt;1 & $2lt;1
Telecommunications13 Plastic g 1.79E+05 9.68E+09 [52] 1.73E+15 & $2lt;1 & $2lt;114 Steel g 3.14E+04 3.16E+09 [50] 9.92E+13 & $2lt;1 & $2lt;115 Copper g 1.69E+04 3.00E+09 [53] 5.07E+13 & $2lt;1 & $2lt;116 Circuit board g 1.45E+04 3.00E+09 [54] 4.35E+13 & $2lt;1 & $2lt;1
Others17 Steel rack g 2.80E+06 3.16E+09 [50] 8.86E+15 & $2lt;1 & $2lt;1
Operation18 Electricity J 2.14E+13 5.87E+04 [54] 1.26E+18 25.1 3.519 Labor USD 1.07E+06 3.40E+12 [55] 3.64E+18 72.5 10.1Emergy without Services = 5.02E+18 100.0 –
Services20 Infrastructured USD 5.81E+03 3.40E+12 [55] 1.97E+16 – &$2lt;121 Equipmentse USD 8.49E+06 3.40E+12 [55] 2.89E+19 – 80.322 Electricityf USD 5.96E+05 3.40E+12 [55] 2.03E+18 – 5.6Emergy with Services = 3.59E+19 – 100.0
a Raw data available at Appendix D.b All UEVs are based on a global emergy budget of 15.83E+24 seJ/yr [42] and do not include Labor and Services.c Emergy (seJ/yr)=Amount (Unit/yr)*UEV (seJ/Unit).d It includes items 1–6.e It includes items 7–17 (Computers, Electronics, Telecommunication and Others).f It includes item 18.
A.L.A. Di Salvo et al. Renewable and Sustainable Energy Reviews 69 (2017) 514–526
520

better performance than Legacy by both approaches: disregarding andconsidering the category Services. When disregarding Services, theCloud demands about 89% less emergy than Legacy, whereas withServices included, this percentage reduces to 31%. The comparisonbetween the structures considering the emergy demand indicates whichsystem lays a heavier burden on the environment by consuming higheramounts of energy and materials in a global scale, under a donor'sperspective – disregarding information input and the renewability rateof each system input. However, as stated by Murugesan et al. [23],evaluating green computing should also consider the systems output,i.e. the virtual machines and bytes functional units adopted in thiswork. This is fundamental when assessing efficiency – which, bydefinition, is a ratio of systems inputs and outputs –, since one systemcould demand a higher amount of inputs, which potentially indicatesworse performance, while producing a higher amount of outputs, whichcould eventually increase the overall efficiency. Due to this, theefficiency indicators are also taken into account in supporting discus-sions about how green the studied systems are.
As for the eco-efficiency indicator (seJ/VM), setting up a VM inCloud takes 91% less emergy than doing likewise in Legacy (Fig. 5).This figure changes when considering the Services category (Fig. 6), asa VM available in the Cloud still shows better performance, but nowdemanding 45% less emergy rather than 91%. The same behavior wasobserved when considering the eco-efficiency in seJ/byte: the Clouddemands 98% less emergy than Legacy to store 1 byte of informationwhen disregarding the Services category, and 85% less emergy whenServices are accounted for.
Regarding the energy efficiency indicators, Fig. 5 shows that 1 VMprovided by Cloud demands 51% less energy than Legacy when the
category Services is disregarded in the calculation. To store 1 byte, theCloud's energy efficiency is even higher since it requires about 87% lessemergy than the Legacy does. Fig. 6 shows that numbers are main-tained when including the Services category. This behavior is obser-vable because the energy efficiency analysis, performed the way it wasin this work, does not consider the Services category the way it isconsidered in emergy accounting; only direct kWh of electricity usageduring the operation phase is considered in the energy efficiencyevaluation.
Numbers show that, regardless of Services category being consid-ered in the calculations or not, the Cloud is better energy-efficiency andeco-efficiency-wise than Legacy as for the two functional units con-sidered in this work (VM and bytes). These results corroborateSteenhof et al. [12], Markovic et al. [13], and Williams et al. [14]statements that a series of benefits to the environment (i,e., the efficientuse of computational resources and energy consumption reduction)result from operating a DC based on cloud computing techniques, inlieu of a traditional DC.
Even considering all favorable indicators calculated for the Cloudstudied in this work, labeling it as green could be considered aspremature. The main issue here concerns a lack of a thresholdindicating what can and what cannot be considered as green. Thedefinition by Murugesan et al. [23] of what green computing is –please, see the Introduction section - can be useful at directingstrategies towards energy and materials reduction usage under the lifecycle of equipments, but it is still subjective, whereas quantitativevalues are needed in the evaluation. In this sense, the Cloud studied inthis work could be considered as greener than Legacy. This is especiallytrue because of the lower environmental cost per virtual machineprovided and per byte stored. These results meet Marston et al. [58]findings, by which the efficient use of computational resources is one ofthe ideas within the concept of Green ICT. In order to furtherstrengthen the argumentation that Cloud is greener than Legacy, it issuggested: (i) to include equipment disposal of each DC; (ii) to includethe indirect energy consumed, besides the direct energy consumed toprovide the existing equipment in the DCs; (iii) to consider otherfunctional units so a multicriteria evaluation can be performed.
3.2. Complementary insights regarding the sustainability ofinformation systems evaluated under emergy accounting
The main difficulty faced while developing this study relates to theuse of the traditional emergy accounting indicators, which evaluate thesustainability of the studied systems and, consequently, how green theyare. For instance, the renewability index (%R) and the environmentalsustainability index (ESI) are taken as the most representative ones; formore details please see Odum [27] and Brown and Ulgiati [30]. Bothindexes can be used to evaluate the sustainability of anthropic systems,since natural systems are sustainable by definition. To calculate theseindexes, emergy flows are used when comparing the use of renewablenatural resources to the use of non-renewable ones, the use of economyresources to the use of environmental resources, and so forth. A priori,these indicators could be considered as more appropriate for eviden-cing which Data Center could be considered the greenest, since %R andESI consider a donor's side perspective of energy quality instead of areceiver's side. Furthermore, these indicators are calculated under aglobal scale view, which is recognized as an important approach byMurugesan et al. [23] when defining green computing. However,operationally speaking, calculating %R and ESI for the Data Centersstudied in this work was not possible, since they are systems located inthe extreme right side of a hierarchical energy chain (Fig. 3), thereforethey do not use natural resources directly; instead, they are basicallydependent on resources from the economy.
An alternative would be to include partial renewability of each inputgoing into the evaluated data center systems; such approach has beenproposed by Tiezzi and Marchettini [59], and further assessed by
Fig. 5. Comparison between the Legacy and Cloud, disregarding the Services category.
Fig. 6. Comparison between the Legacy and Cloud considering the Services category.
A.L.A. Di Salvo et al. Renewable and Sustainable Energy Reviews 69 (2017) 514–526
521
Ortega et al. [60], Ulgiati et al. [61], Agostinho et al. [32], Agostinhoand Ortega [62,63], Ulgiati and Brown [40], among others. However,although this approach can be used in emergy accounting of severaldifferent systems such as agriculture, industry, and even urbansystems, its use in information systems such as the ones studied hereinis rarely found in literature. This is so because the partial renewabilityof the inputs going into the information systems is negligible, as therenewability fraction of inputs was reduced when transferred from thefar left side beginning systems of a hierarchical energy chain to the farright side information system (Fig. 3).
At this point, the following question emerges: considering thatemergy accounting is a powerful tool in evaluating systems sustain-ability (or how green the system is), how can emergy accounting beused to evaluate the sustainability of systems located farther to theright side of the energy hierarchical chain? Eco-efficiency indicatorsbased on emergy accounting were considered in this work, rather thanthe traditional emergy sustainability indicators. This is due to themethodological difficulties mentioned earlier, and also to the fact that,currently, the green label of ICTs is usually evaluated by exclusivelyconsidering their energy efficiency and CO2 emissions. For instance,the most used indicators to assess the sustainability degree of ICTs arethose proposed by Atrey et al. [64]: (i) Power Usage Effectiveness(PUE); (ii) Carbon Usage Effectiveness (CUE); (iii) Energy ReuseFactor (ERF); (iv) Space and Wattage Performance (SWaP). The eco-efficiency and energy efficiency indicators shown in Table 2 areconsidered as sufficient in order to accomplish the proposed objectivesof this work, however, at no time the sustainability of data center wasevaluated. The indicators used point out which system does better atefficiently using direct energy to provide services for users (virtualmachine and bytes storage), as well as efficiently demanding emergy toprovide the same outputs. The difference between the indicators(energy vs. emergy) is based on a scale of analysis (please seeAgostinho and Pereira [29] on this regard), in which emergy account-ing considers a larger scale and, therefore, it can account for all hiddencosts not considered in an energy analysis.
At this point, another concern arises: how important is to calculatethe sustainability of information carriers (e.g. data center)? First andforemost, the most relevant aspects related to information are on thequality of it, and not in its carrier's sustainability. What really mattersis that the transmitted information be sustainable and allow for societalprogress [24,43]. Thus, the sustainability of information carriers couldbe taken as a secondary goal. This raises the hypothesis that informa-tion carriers are not designed to be sustainable. However, this does notimply that they must be inefficient in converting inputs into outputs,mainly because they are exclusively dependent on electricity energysources, which is a high quality energy due to their high Unit EmergyValue (UEV). For instance, the UEVs for hard coal and diesel(1.32E5 seJ/J and 1.81E5 seJ/J respectively; [65]) are, in average,3.7 times lower than the one for thermal electricity (5.69E5 seJ/J;[66]). Thus, the high quality energy feeding the DCs must be efficientlyused. This is also recognized by Servaes [67] who argues that there is agrowing consensus that ICT not only can contribute to the reduction ofanthropogenic greenhouse gas (GHG) emissions by increasing its ownenergy efficiency, but can also contribute as a guidance for moreefficient energy production and consumption patterns – the latter canbe interpreted as the information transmitted by the ICT.
In brief, the use of traditional emergy indicators to assess sustain-ability of information carriers is operationally difficult, since thosesystems are located on the right side of a hierarchical energy chain.However, assuming that the environmental load of information carrierscorrespond to a tiny fraction of the environmental load of a largersystem receiving good information that allows for its sustainabledevelopment, then we would say that it seems that information carriersdo not have to be sustainable; rather than that, the informationtransmitted must be sustainable. Information carriers that efficientlyuse energy and materials inputs must be identified, recognized, and
promoted, since they are able to use resources in a more efficient waythan other carriers are. Albeit efficient, the methodological approachesused in this work do not allow for granting the information carriersevaluated a green label.
4. Conclusions
Focusing on the direct energy consumption in the data centersoperational phase, results show that Cloud demands 37% less elec-tricity than Legacy (5.96E+06 kWh/yr vs. 9.41E+06 kWh/yr).Considering the functional units that represent the energy efficiency,the Cloud demands 51% less energy to provide a Virtual Machine thanLegacy does (0.83E+03 kWh/VM vs. 1.65E+03 kWh/VM), and itconsumes less energy than Legacy to store a byte (0.57E−09 kWh/bytevs. 4.30E−09 kWh/byte).
Similar behavior was observed under an emergy accountingapproach. The Cloud demands less annual emergy than Legacy(3.59E19 seJ/yr vs. 5.17E19 seJ/yr), which stands for better perfor-mance. When the functional units are considered, results evidence thatCloud demands 45% less emergy to provide a Virtual Machine thanLegacy does (4.99E+15 seJ/VM vs. 9.07E+15 seJ/VM), and it demands85% less emergy to store a byte (0.34E+04 seJ/byte vs. 2.36E+04 seJ/byte).
Analyzing in absolute terms (i.e. under kWh/yr and seJ/yr units),the Cloud proved to achieve a better performance than Legacy did, bycausing a lower load on the environment due to demanding a loweramount of global resources (directly or indirectly) for its implementa-tion and operation phases. This is important in a world with reducedavailability of energy resources. In fact, these indicators can beconsidered as more closely related to sustainability and/or greenconcepts than the ones expressing efficiency, however, they are stillunable to indicate from where the amount of used resources comesfrom; i.e. whether they come from renewable or non-renewablesources, resulting in either a sustainable or in an unsustainable system,respectively.
Although recognizing that indicators of energy efficiency and eco-efficiency evidence the better performances by the Cloud, no conclusionon labeling it as green ever stands. The reason is that the equipmentdisposal phase was not considered in the study, and because there is alack of a threshold that would allow categorizing a good or service asgreen, when those efficiency indicators are being used as parameters.Thus, the indicators of energy efficiency and eco-efficiency used in thiswork do allow to conclude that the Cloud can be considered as greenerthan Legacy.
The effectiveness of using environmental accounting metrics toassess sustainability or how green is the ICT systems claims for moreefforts in operationalizing and defining the origin of energy andmaterial inputs used to implement, operate, and dismantle the ICTsystem. However, assuming that the environmental load from informa-tion carriers corresponds to a tiny fraction of the larger systemsreceiving high-quality information, it can be said that ICT does notneed to be necessarily as green as the information transmitted does. Inother words, a priori, the ICT must allow for the transition of thatsecondary system dependent on the services provided by the ICT to agreen label. Society should use ICTs to promote its progress, however,ICTs should not damage the environment in which humans live. Thisclaim for a cost-benefit relation under a large-scale view, i.e. if usingthe ICT will indirectly allow for higher environmental benefits, thenusing it is justifiable, even if the ICT actually burdens the environmentthe way it has been doing.
Acknowledgements
Authors are grateful for the financial support from Vice-Reitoria dePós-graduação da Universidade Paulista (UNIP), and to InstitutoFederal de Educação, Ciência e Tecnologia do Sul de Minas Gerais
A.L.A. Di Salvo et al. Renewable and Sustainable Energy Reviews 69 (2017) 514–526
522

(IFSul). Thanks also to CNPq Brazil (proc. no. 307422/2015-1) for thefellowship provided to second author. The effort of José Hugo deOliveira in the English version revision is also acknowledged.
Appendix A. Calculation procedure for virtual machineamount integrating the “Cloud”
Step #1 – Available memory size in each server =512 GB RAMStep #2 – Memory size considered for calculations =480 GB RAM(A)Step #3 – Memory size per virtual machine =32 GB RAM (B)Step #4 – Number of available virtual machines per server =(A)(B)−1 =15 virtual machines (C)Step #5 – Total number of available servers considered in “Cloud”=480 servers (D)Step #6 – Total number of available virtual machines =(C) (D)=7200 virtual machines
Appendix B
See Table B1.
Appendix C. Primary data used for the emergy evaluation of“Legacy” system (Table 3)
Item #1 (Lime) – Amount =9.98 kg/m2 [68]; Constructed area perindividual datacenter =16 m2 per datacenter; Legacy datacenternumber =150 datacenter; Assumed lifetime =30 years; Conversion=(kg m−2) (m2 datacenter−1) (datacenter) (year)−1; Input flow=798.40 kg year−1
Item #2 (Cement) – Amount =144 kg/m2 [68]; Constructed area perindividual datacenter =16 m2 per datacenter; Legacy datacenternumber =150 datacenter; Assumed lifetime =30 years; Conversion=(kg m−2) (m2 datacenter−1) (datacenter) (year)−1; Input flow=11,520 kg year−1
Item #3 (Stone) – Amount =333 kg/m2 [68]; Constructed area perindividual datacenter =16 m2 per datacenter; Legacy datacenternumber =150 datacenter; Assumed lifetime =30 years; Conversion=(kg m−2) (m2 datacenter−1) (datacenter) (year)−1; Input flow=26,640 kg year−1
Item #4 (Sand) – Amount =462 kg/m2 [68]; Constructed area perindividual datacenter =16 m2 per datacenter; Legacy datacenter
number =150 datacenter; Assumed lifetime =30 years; Conversion=(kg m−2) (m2 datacenter−1) (datacenter) (year)−1; Input flow=36,960 kg year−1
Item #5 (Clay) – Amount =154 kg/m2 [68]; Constructed area perindividual datacenter =16 m2 per datacenter; Legacy datacenternumber =150 datacenter; Assumed lifetime =30 years; Conversion=(kg m−2) (m2 datacenter−1) (datacenter) (year)−1; Input flow=12,320 kg year−1
Item #6 (Steel) – Amount =10.9 kg/m2 [68]; Constructed area perindividual datacenter =16 m2 per datacenter; Legacy datacenternumber =150 datacenter; Assumed lifetime =30 years; Conversion=(kg m−2) (m2 datacenter−1) (datacenter) (year)−1; Input flow=872 kg year−1
Item #7 (Computers) – Computers refer herein to servers; Amount=1,425 computers (data collected in situ); This amount covers all150 data centers; Average value of computer weight assumptionbased on current equipment available in the market =23 kg compu-ter−1; Assumed lifetime =5 years; Conversion =(computers) (gcomputer−1) (year)−1; Input flow =6,555 kg year−1
Item #8 (Plastic) – Percentage of plastic in electronics equipment=30% [69]; Amount of electronics present in the 150 datacenters=6,094,5 kg (data collected in situ); Assumed lifetime =5 years;Conversion =(%) (kg) (year)−1; Input flow =366 kg year−1
Item #9 (Steel) – Percentage of steel in electronics equipment =43%[69]; Amount of electronics present in the 150 datacenters=6,094,5 kg (data collected in situ); Assumed lifetime =5 years;Conversion =(%) (kg) (year)−1; Input flow =524 kg year−1
Item #10 (Glass) – Percentage of glass in electronics equipment =4%[69]; Amount of electronics present in the 150 datacenters=6,094,5 kg (data collected in situ); Assumed lifetime =5 years;Conversion =(%) (kg) (year)−1; Input flow =48 kg year−1
Item #11 (Copper) – Percentage of copper in electronics equipment=3% [69]; Amount of electronics present in the 150 datacenters=6,094,5 kg (data collected in situ); Assumed lifetime =5 years;Conversion =(%) (kg) (year)−1; Input flow =36 kg year−1
Item #12 (Printed board) – Percentage of printed board in electro-nics equipment =20% [69]; Amount of electronics present in the 150datacenters =6,094,5 kg (data collected in situ); Assumed lifetime=5 years; Conversion =(20%) (kg) (year)−1; Input flow =244 kgyear−1
Item #13 (Plastic) – Percentage of plastic present in telecomequipment =74% [69]; Amount of telecom equipment present inthe 150 datacenters =1376 kg (data collected in situ); Assumedlifetime =5 years; Conversion =(%) (kg) (year)−1; Input flow =204 kgyear−1
Item #14 (Steel) – Percentage of steel in telecom equipment =13%[69]; Amount of telecom equipment present in the 150 datacenters=1376 kg (data collected in situ); Assumed lifetime =5 years;Conversion =(%) (kg) (year)−1; Input flow =35.8 kg year−1
Item #15 (Copper) – Percentage of copper in telecom equipment=7% [69]; Amount of telecom equipment present in the 150datacenters =1376 kg (data collected in situ); Assumed lifetime =5years; Conversion =(%) (kg) (year)−1; Input flow =19.3 kg year−1
Item #16 (Printed board) – Percentage of printed board in telecomequipment =6% [69]; Amount of telecom equipment present in the150 datacenters =1376 kg (data collected in situ); Assumed lifetime=5 years; Conversion =(%) (kg) (year)−1; Input flow =16.5 kg year−1
Item #17 (Rack) – Amount (refrigeration and generator considered)=23880 kg (data collected in situ); Assumed lifetime =5 years;Conversion =(steel) (g steel−1) (year)−1; Input flow =4,776 kg year−1
Item #18 (Electricity) – Total power including computers, electronicequipment, and telecom equipment =740 kW (data collected insitu); Total power refrigeration (assuming 24,000 BTUs based onequipment and other thermal load sources existing in datacenter)=348 kW; All this equipment is essential for the datacenter function-ing, thus all must be connected full time, i.e. 24 h day−1 at 365 d
Table B1Amount of devices and part number integrating the assessed “Cloud”.
Part Number Item Quantity
FAS6200 Storage netApp 8DS4243 NetApp Disk Shelves and Storage Media 242N7K-C7010 Chassi - Switch 4N7K-SUP1 Cisco Nexus 7000 M1-Series 48-Port Gigabit
Ethernet Modules8
N7K-C7010-FAB 2 Cisco Nexus 7000 Switches Fabric−2 Modules 4N7K-F132XP−15 Cisco Nexus 7000 F1-Series 32-Port 8N7K-M132XP−12 L Cisco Nexus 7000 F1-Series 32-PortCisco
Nexus 7000 M1-Series 32-Port 10 Gigabit16
N7K-M148GS−11 L Cisco Nexus 7000 M1-Series 48-Port GigabitEthernet Modules - SFP module
4
N7K-M148GT−11 L Cisco Nexus 7000 M1-Series 48-Port GigabitEthernet Modules
4
UCS-FI−6296UP Cisco UCS 6296UP 96-Port FabricInterconnect
6
UCS-FI−6140UP Cisco UCS 6140UP 40-Port FabricInterconnect
4
n.a. Cisco ASR 9006 Router 2n.a. Cisco Firewall ASA5585-SSP−40 4n.a. Blade Server 200/230 512
n.a. = not available
A.L.A. Di Salvo et al. Renewable and Sustainable Energy Reviews 69 (2017) 514–526
523

year−1; Conversion =(kW) (h day−1) (day year−1) (3,600,000 JkWh−1); Input flow =3.39 1013 J year−1
Item #19 (Labor) – Number of technical staff members needed formaintaining the Legacy =576 (144 with high level graduation and432 with technical level; data collected in situ); Wages for staff withhigh level graduation =32,424 $ yr−1; Wages for staff with technicallevel graduation =17,232 $ yr−1 per month (values estimated from[70]); Conversion =((144 persons)*(17,232 $ yr−1)) +((432 per-sons)*(32,424 $ yr−1)) Input flow =12,113,280 $ year−1
Item #20 (Services of infrastructure)–Amount =588.35 $/m2 [71];Constructed area per individual datacenter=16 m2 per datacenter;Legacy datacenter number=150 datacenter; Assumed lifetime=30years; Conversion =($ m−2) (m2 datacenter−1) (datacenter) (year)−1;Input flow=47,068 $ year−1
Item #21 (Services of computers, electronics, and telecom)–Amount=6,327,674 $ (data obtained from current market prices ofcomputers, electronics and equipments existing in the Legacy);Assumed lifetime=5 years; Conversion =($) (year)−1; Inputflow=1,265,535 $ year−1
Item #22 (Services of electricity) – Amount=9,530,880 kWh year−1
(from Item #19); Current market price of electricity=0.10 $ kWh−1;Conversion=(kWh year−1) ($ kWh−1); Input flow =953,088 $ year−1
Appendix D. Primary data used for the emergy evaluation of“Cloud” system (Table 4)
The acronym “DC1″ refers to actual Cloud Computing infrastruc-ture located in São Paulo city, while “DC2″ refers to backup DC1located in Barueri city.
Item #1 (Lime) – Amount =9.98 kg/m2 [68]; Total constructedarea=296 m2 (120 m2 DC1 and 176 m2 DC2); Assumed lifetime=30years; Conversion=(kg m−2) (m2 datacenter−1) (datacenter) (year)−1;Input flow =98.45 kg year−1
Item #2 (Cement) – Amount =144 kg/m2 [68]; Total constructedarea=296 m2 (120 m2 DC1 and 176 m2 DC2); Assumed lifetime=30years; Conversion=(kg m−2) (m2 datacenter−1) (datacenter) (year)−1;Input flow=1420 kg year−1
Item #3 (Stone) – Amount=333 kg/m2 [68]; Total constructedarea=296 m2 (120 m2 DC1 and 176 m2 DC2); Assumed lifetime=30years; Conversion=(kg m−2) (m2 datacenter−1) (datacenter) (year)−1;Input flow=3,285 kg year−1
Item #4 (Sand) – Amount=462 kg/m2 [68]; Total constructedarea=296 m2 (120 m2 DC1 and 176 m2 DC2); Assumed lifetime=30years; Conversion=(kg m−2) (m2 datacenter−1) (datacenter) (year)−1;Input flow=4558 kg year−1
Item #5 (Clay) – Amount=154 kg/m2 [68]; Total constructedarea=296 m2 (120 m2 DC1 and 176 m2 DC2); Assumed lifetime=30years; Conversion=(kg m−2) (m2 datacenter−1) (datacenter) (year)−1;Input flow=1,519 kg year−1
Item #6 (Steel) – Amount=10.9 kg/m2 [68]; Total constructedarea=296 m2 (120 m2 DC1 and 176 m2 DC2); Assumed lifetime=30 years; Conversion=(kg m−2) (m2 datacenter−1) (datacenter)(year)−1; Input flow=107.55 kg year−1
Item #7 (Computers) – Computers refers herein to servers;Amount=512 computers (data collected in situ); Computer weightbased on model =8160 g computer−1; Assumed lifetime=5 years;Conversion=(computers) (g computer−1) (year)−1; Inputflow=835,584.00 g year−1
Item #8 (Rack) – Amount=74 racks (data collected in situ); Rackweight based on model =115,66 kg rack−1; Assumed lifetime=5years; Conversion=(racks) (g racks−1) (year)−1; Input flow=1711 kg year−1
Item #9 (Plastic) – Percentage of plastic in electronics equip-ment=30% [69]; Amount of electronics present in cloud(DC1+DC2) =12,995.8 kg (data collected in situ); Assumed life-
time=5 years; Conversion=(%) (kg) (year)−1; Input flow=780 kgyear−1
Item #10 (Steel) – Percentage of steel in electronics equipment=43% [69]; Amount of electronics present in cloud (DC1+DC2)=12,995.8 kg (data collected in situ); Assumed lifetime =5 years;Conversion=(%) (kg) (year)−1; Input flow =1,118 kg year−1
Item #11 (Glass) – Percentage of glass in electronics equipment=4%[69]; Amount of electronics present in cloud (DC1+DC2)=12,995.8 kg (data collected in situ); Assumed lifetime=5 years;Conversion=(%) (kg) (year)−1; Input flow=104 kg year−1
Item #12 (Copper) – Percentage of copper t in electronics equip-ment=3% [69]; Amount of electronics present in cloud (DC1+DC2)=12,995.8 kg (data collected in situ); Assumed lifetime=5 years;Conversion=(%) (kg) (year)−1; Input flow=78 kg year−1
Item #13 (Printed board) – Percentage of printed board in electro-nics equipment=20% Amount of electronics present in cloud(DC1+DC2)=12,995.8 kg (data collected in situ); Assumed life-time=5 years; Conversion=(20%) (kg) (year)−1; Input flow=520 kgyear−1
Item #14 (Plastic) – Percentage of plastic in telecom equip-ment=74% [69]; Amount of telecom equipment present in cloud(DC1+DC2)=1208 kg (data collected in situ); Assumed lifetime=5years; Conversion=(%) (kg) (year)−1; Input flow=179 kg year−1
Item #15 (Steel) – Percentage of steel in telecom equipment=13%[69]; Amount of telecom equipment present in cloud (DC1+DC2)=1208 kg (data collected in situ); Assumed lifetime =5 years;Conversion=(%) (kg) (year)−1; Input flow=31 kg year−1
Item #16 (Copper) – Percentage of copper in telecom equip-ment=7% [69]; Amount of telecom equipment present in cloud(DC1+DC2)=1208 kg (data collected in situ); Assumed lifetime =5years; Conversion=(%) (kg) (year)−1; Input flow=17 kg year−1
Item #17 (Printed board) – Percentage of printed board in telecomequipment=6% [69]; Amount of telecom equipment present in cloud(DC1+DC2)=1208 kg (data collected in situ); Assumed lifetime=5years; Conversion=(%) (kg) (year)−1; Input flow=14 kg year−1
Item #18 (Steel) – Amount (refrigeration and generator considered)=10,928 kg (data collected in situ); Assumed lifetime=10 years;Conversion=(steel) (g steel−1) (year)−1; Input flow=1093 kg year−1
Item #19 (Electricity) – Total power including computers, electronicequipment, and telecom equipment=340 kW (data collected in situ);Total power refrigeration (assuming a chiller refrigeration machinewith 50 tr based on equipment and other thermal load sources)=340 kW; All this equipment is essential for the datacenter function-ing, thus all must be connected full time, i.e. 24 h day−1 at 365 dyear−1; Conversion=(kW) (h day−1) (day year−1)(3,600,000 J kWh−1); Input flow=2.14×10¹³ J year−1
Item #20 (Labor) – Number of technical staff members needed formaintaining the Legacy =48 (16 with high level graduation and 32with technical level; data collected in situ); Wages for staff with highlevel graduation=32,424 $ yr−1; Wages for staff with technical levelgraduation=17,232 $ yr−1 per month (values estimated from [70]);Conversion=((32 persons)*(17,23 $ yr−1)) +((16 persons)*(32,424 $yr−1)) Input flow =1,070,208 $ year−1
Item #21 (Services of infrastructure) – Amount =588.35 $/m2 [71];Total constructed area=296 m2 (120 m2 DC1 and 176 m2 DC2);Assumed lifetime=30 years; Conversion=($ m−2) (m2 datacenter−1)(datacenter) (year)−1; Input flow=5,805.00 $ year−1
Item #22 (Services of computers, electronics, and telecom) –Amount=42,444,821 $ (data obtained from current market pricesof computers, electronics and equipment present in the Cloud);Assumed lifetime=5 years; Conversion =($) (year)−1; Inputflow=8,488,964 $ year−1
Item #23 (Services of electricity) – Amount=5,956,800 kWh year−1
(from Item #20); Current market price of electricity =0.10 $ kWh−1;Conversion=(kWh year−1) ($ kWh−1); Input flow=595,680 $ year−1
A.L.A. Di Salvo et al. Renewable and Sustainable Energy Reviews 69 (2017) 514–526
524

References
[1] Castañé GG, Núñez A, Llopis P, Carretero J. E-mc2: a formal framework for energymodelling in cloud computing. Simul Model Pract Theory 2013;39:56–75.
[2] Uddin M, Rahman AA. Energy efficiency and low carbon enabler green ITframework for data centers considering green metrics. Renew Sustain Energy Rev2012;16:4078–94.
[3] Buyya R, Yeo CS, Venugopal S, Broberg J, Brandic I. Cloud computing andemerging IT platforms: vision, hype, and reality for delivering computing as the 5thutility. Future Gener Comput Syst 2009;25:599–616.
[4] Oró E, Depoorter V, Garcia A, Salom J. Energy efficiency and renewable energyintegration in data centres. Strateg Model Rev Renew Sustain Energy Rev2015;42:429–45.
[5] Uddin M, Darabidarabkhani Y, Shah A, Memon J. Evaluating power efficientalgorithms for efficiency and carbon emissions in cloud data centers: a review.Renew Sustain Energy Rev 2015;51:1553–63.
[6] Uddin M, Rahman AA. Server consolidation: an approach to make data centersenergy efficient & $2 green. Int J Sci Eng Res 2010;1:1–7.
[7] Madhubala R. An Illustrative Study on Cloud Computing. International. J SoftComput Eng 1, 2012, ps 2012:286–90.
[8] Cisco Global Cloud Index. Available at: ⟨http://www.cisco.com/c/en/us/solutions/collateral/service-provider/global-cloud-index-gci/Cloud_Index_White_Paper.pdf⟩.; 2013 [accessed 09.07.15].
[9] Perrons RK, Hems A. Cloud computing in the upstream oil & $2 gas industry: aproposed way forward. Energy Policy 2013;56:732–7.
[10] Perrons RK, Jensen JW. Data as an asset: what the oil and gas sector can learn fromother industries about “Big Data”. Energy Policy 2015;81:117–21.
[11] Fang B, Yin X, Tan Y, Li C, Gao Y, Cao Y, Li J. The contributions of cloudtechnologies to smart grid. Renew Sustain Energy Rev 2016;59:1326–31.
[12] Steenhof P, Weber C, Brooks M, Spence J, Robinson R, Simmonds R, Kiddle C,Aikema D, Savoie M, Ho B, Lemay M, Fung J, Cheriet M. A Protocol ForQuantifying The Carbon Reductions Achieved Through The Provision Of Low OrZero Carbon ICT Services. Sustain Comput: Inform Syst 2012;2:23–32.
[13] Markovic DS, Zivkovic D, Branovic I, Popovic R, Cvetkovic D. Smart power grid andcloud computing. Renew Sustain Energy Rev 2013;24:566–77.
[14] Williams DR, Thomond P, Mackenzie I. The greenhouse gas abatement potential ofenterprise cloud computing. Environ Model Softw 2014;56:6–12.
[15] Beloglazov A, Abawajy J, Buyyaa R. Energy-aware resource allocation heuristics forefficient management of data centers for Cloud computing. Future Gener ComputSyst 2012;28:755–68.
[16] Fulgare Y, Bhargav A. Advances in data center thermal management. RenewSustain Energy Rev 2015;43:981–96.
[17] Shuja J, Gani A, Shamshirband S, Ahmad RW, Bilal K. Sustainable cloud datacenters: a survey of enabling techniques and technologies. Renew Sustain EnergyRev 2016;62:195–214.
[18] Rong H, Zhang H, Xiao S, Li C, Hu C. Optimizing energy consumption for datacenters. Renew Sustain Energy Rev 2016;58:674–91.
[19] Ebrahimi K, Jones GF, Fleischer AS. A review of data center cooling technology,operating conditions and the corresponding low-grade waste heat recoveryopportunities. Renew Sustain Energy Rev 2014;31:622–38.
[20] Zhang H, Shao S, Xu H, Zou H, Tian C. Free cooling of data centers: a review.Renew Sustain Energy Rev 2014;35:171–82.
[21] Westphall CB, Villarreal SR. Principles and trends in green cloud computing. RevEletrônica De Sist De Inf 2013;12:1–19. http://dx.doi.org/10.5329/RESI.2013.1201007.
[22] Sharma Y, Javadi B, Si W, Sun D. Reliability and energy efficiency in cloudcomputing systems: survey and taxonomy. J Netw Comput Appl 2016. http://dx.doi.org/10.1016/j.jnca.2016.08.010.
[23] Murugesan S, Gangadharan G, Harmon RR, Godbole N. Fostering green IT. IT Prof2013;15:16–8.
[24] Cramer BW. Man's need or man's greed: the human rights ramifications of greenICTs. Telemat Inform 2012;29:337–47.
[25] Schnitzer H, Ulgiati S. Less bad is not good enough: approaching zero emissionstechniques and systems. J Clean Prod 2006;15:1185–9.
[26] Sorrell S, Dimitropoulos J. The rebound effect: microeconomic definitions,limitations and extensions. Ecol Econ 2008;65:636–49.
[27] OdumHT. Environmental accounting: emergy and environmental decision making.New York: John Wiley & $2 Sons Ltd.; 1996.
[28] Slesser M, editor. Energy analysis Workshop on methodology and Conventions.Stockholm, Sweden: IFIAS; 1974. 89 pp
[29] Agostinho F, Pereira L. Support area as an indicator of environmental load:comparison between embodied energy, ecological footprint, and emergy account-ing. Ecol Indic 2013;24:494–503.
[30] Brown MT, Ulgiati S. Energy quality, emergy, and transformity: H.T. Odum'scontributions to quantifying and understanding systems. Ecol Model2004;178:201–13.
[31] Ulgiati S, Ascione M, Zucaro A, Campanella L. Emergy-based complexity measuresin natural and social systems. Ecol Model 2011;11:1185–90.
[32] Agostinho F, Diniz G, Siche R, Ortega E. The use of emergy assessment and theGeographical Information System in the diagnosis of small family farms in Brazil.Ecol Model 2008;210:37–57.
[33] Giannetti BF, Ogura Y, Bonilla SH, Almeida CMVB. Emergy assessment of a coffeefarm in Brazilian Cerrado considering in a broad form the environmental services,negative externalities and fair price. Agric Syst 2011;104:679–88.
[34] Bonilla SH, Guarnetti RL, Almeida CMVB, Giannetti BF. Sustainability assessment
of a giant bamboo plantation in Brazil: exploring the influence of labor, time andspace. J Clean Prod 2010;18:83–91.
[35] Giannetti BF, Bonilla SH, Silva IR, Almeida CMVB. Cleaner production practices ina medium size gold-plated jewelry company in Brazil: when little changes make thedifference. J Clean Prod 2008;16:1106–17.
[36] Ascione M, Campanella L, Cherubini F, Ulgiati S. Environmental driving forces ofurban growth and development. An emergy-based assessment of the city of Rome,Italy. Landsc Urban Plan 2009;93:238–49.
[37] Conte E, Monno V. Beyond the building centric approach: a vision for an integratedevaluation of sustainable buildings. Environ Impact Assess Rev 2012;34:31–40.
[38] Zucaro A, Ripa M, Mellino S, Ascione M, Ulgiati S. Urban resource use andenvironmental performance indicators. Appl Decompos Anal Ecol Indic2014;47:16–25.
[39] Abel T. Emergy evaluation of DNA and culture in ‘information cycles'. Ecol Model2013;251:85–98.
[40] Ulgiati S, Brown MT. Labor and Services as Information Carriers in Emergy-LCAAccounting. J Environ Account Manag 2014;2:160–7.
[41] Odum HT. Energy circuit language and energy transformation in asymptoticgrowth. In: Gray W, Rizzo ND, editors. Unity through diversity, a festschrift forLudwig von Bertalanffy. NY: Gordon and Breach Science Publ.; 1973. p. 361–75.
[42] Odum HT, Brown MT, Brandt-Williams S. Handbook of emergy evaluation,Folio#1, Introduction and Global Budget.. Gainesville, USA: Center forEnvironmental Policy, University of Florida; 2000, Available at: ⟨http://www.cep.ees.ufl.edu/emergy/documents/folios/Folio_01.pdf⟩, [accessed 03.07.15].
[43] Odum H, Odum EC. A prosperous way down: principles and policies. USA:University Press of Colorado; 2001, 326 pp..
[44] Garg SK, Versteeg S, Buyya R. A framework for ranking of cloud computingservices. Future Gener Comput Syst 2013;29:1012–23.
[45] Stiel F, Teuteberg F. Measuring the environmental impact of IT/IS solutions - a lifecycle impact modelling approach. Environ Model Softw 2014;56:94–104.
[46] Ardito L, Morisio M. Green IT – available data and guidelines for reducing energyconsumption in IT systems. Sustain Comput: Inform Syst 2014;4:24–32.
[47] Popek GJ, Goldberg RP. Formal requirements for virtualizable third generationarchitectures, 17. ACM; 1974. p. 412–21.
[48] WBCSD. World Business Council for Sustainable Development. Eco-efficientLeadership for Improved Economic and Environmental Performance. Available at:⟨http://oldwww.wbcsd.org/DocRoot/DlFMcUZj32ZOMj5xNMXq/eeleadership.pdf⟩; 1996 [accessed 20.09.15].
[49] Pulselli RM, Simoncini E, Ridolfi E, Bastianoni S. Specific emergy of cement andconcrete: an energy-based appraisal of building materials and their transport. EcolIndic 2008;8:647–56.
[50] Bargigli S, Ulgiati S. Emergy and Life-cycle assessment of steel production inEurope. In: Brown et al., editors, Emergy synthesis 2: theory and applications of theemergy methodology. Proceedings of the 2nd biennial emergy conference. Centerfor Environmental Policy, University of Florida, Gainesville; 2003. 432 pages.
[51] Di Salvo ALA, Agostinho, F. Computing the Unit Emergy Value of computers – afirst attempt. Emergy synthesis 8: theory and applications of the emergy metho-dology. In: Proceedings of the 8th biennial emergy conference. Center forEnvironmental Policy, University of Florida, Gainesville; 2015 [in press]
[52] Buranakarn V. Evaluation of recycling and reuse of building materials using theemergy analysis method [Ph.D. thesis]. Gainesville, FL, USA: University of Florida;1998.
[53] Cohen, M.J., Sweeney, S., Brown, M.T., 2007. Computing the unit emergy value ofcrustal elements. In: Brown et al., editors, Emergy synthesis 4: theory andapplications of the emergy methodology. Proceedings of the 4th Biennial EmergyConference. Center for Environmental Policy, University of Florida, Gainesville.483pages.
[54] Brown MT, Ulgiati S. Emergy evaluations and environmental loading of electricityproduction systems. J Clean Prod 2002;10:321–34.
[55] Sweeney, S, Cohen, MJ, King, DM, Brown, MT. Creation of a Global EmergyDatabase for Standardized National Emergy Synthesis. In: Brown et al., editors,Emergy Synthesis 4: Theory and Applications of the Emergy Methodology.Proceedings of the 4th Biennial Emergy Conference. Center for EnvironmentalPolicy, University of Florida, Gainesville; 2007. 483 pp,.
[56] Sultan N. Cloud computing for education: a new dawn?. Int J Inf Manag2010;30:109–16.
[57] Accenture. Cloud Computing and Sustainability: the Environmental Benefits ofMoving to the Cloud. Accenture & $2 WSP. Available on ⟨http://www.microsoft.com/click/services/Redirect2.ashx?CR_EAC=300012377⟩; 2011 [accessed 09.07.15].
[58] Marston S, Li Z, Bandyopadhyay S, Zhang J, Ghalsasi A. Cloud Computing — thebusiness perspective. Decis Support Syst 2011;51:176–89.
[59] Tiezzi E, Marchettini N. Che Cos'è Lo Sviluppo Sostenibile? Le basi scientifichedella sostenibilità e i guasti del pensiero unico. (What is sustainable development?Scientific bases of sustainability and failures of the single thought). Book in Italianlanguage. Donzelli Editore, Roma, Itália; 1999.
[60] Ortega E, Anami MH, Diniz G. Certification of food products using emergy analysis.In: Proceedings of the third biennial international workshop advances in energys-tudies, Porto Venere, Italy; 2002.
[61] Ulgiati S, Bargigli S, Raugei M. Dotting the I’s and crossing the T’s of emergysynthesis: material flows, information and memory aspects, and performanceindicators. In: Brown et al., editors, Emergy synthesis 3: theory and applications ofthe emergy methodology. Proceedings of the 3rd biennial emergy conference.Center for Environmental Policy, University of Florida, Gainesville; 2005. 652 pp.
[62] Agostinho F, Ortega E. Integrated food, energy and environmental servicesproduction as an alternative for small rural properties in Brazil. Energy
A.L.A. Di Salvo et al. Renewable and Sustainable Energy Reviews 69 (2017) 514–526
525
2012;37:103–14.[63] Agostinho F, Ortega E. Energetic-environmental assessment of a scenario for
Brazilian cellulosic ethanol. J Clean Prod 2013;47:474–89.[64] Atrey A, Jain N, Iyengar , N. Ch SN. A Study On Green Cloud Computing. Int J Grid
Distrib Comput 2013;6:93–102.[65] Brown MT, Protano G, Ulgiati S. Assessing the geobiosphere work of generating
global reserves of coal, crude oil, and natural gas. Ecol Model 2011;222:879–87.[66] Brown MT, Raugei M, Ulgiati S. On boundaries and ‘investments' in Emergy
Synthesis and LCA: a case study on thermal vs. photovoltaic electricity. Ecol Indic2012;15:227–35.
[67] Servaes J. Introduction to “green ICT”.. Telemat Inform 2012;29:335–6.[68] Carvalho JGA. Avaliação de uma construção utilizando a contabilidade ambiental
em emergia (Emergy accounting for building construction) [M.Sc. thesis (inPortuguese). Post-graduation Program in Industrial Engineering]. São Paulo,Brazil: Paulista University; 2010.
[69] EPA. Electrical and Electronic Equipment in Ireland: A status report.Available at⟨http://www.environ.ie/en/Publications/Environment/Waste/WEEE/
FileDownLoad,1342,en.pdf⟩; 2001 [accessed 13.06.12].[70] DRH. Diretoria de Recursos Humanos (Human Resources Department). Report in
Portuguese language, São Paulo University (USP). Available at: ⟨http://www.usp.br/drh/⟩; 2014 [accessed 01.07.14].
[71] SINDUSCON. Sindicato da Indústria da Construção Civil no Estado de MinasGerais (Construction Industry Association of Minas Gerais State). Report inPortuguese language. Available at: ⟨http://www.sinduscon-mg.org.br/⟩; 2013[accessed 05.01.14]
GlossaryICT: Information and Communication TechnologyDC: Data CenterVM: Virtual MachinesseJ: Solar emjoulesCC: Cloud Computing
A.L.A. Di Salvo et al. Renewable and Sustainable Energy Reviews 69 (2017) 514–526
526