can brain atrophy measurement help us in monitoring ms progression in routine clinical practice?
TRANSCRIPT

Department of Neurology and Centre of Clinical Neuroscience Charles University in Prague
1st Medical Faculty and General University Hospital
Can brain atrophy measurement help us
in monitoring MS progression in routine clinical practice?
Dana Horáková

MS center – Prague
New center opened
March 2007
Comprehensive care
for > 4000 patients

ASA - 10 yrs evolution of disability on IFN
1999-2003, 181 pts, age 31 yrs, disease duration 3.7 yrs
100 confirmed 12 M progression
73 stable
173 RR MS

„MS world has changed“
1993 2010 2006 2013 20XX 2015 ?
Molecules in clinical
studies,
not registered yet

„MS world has changed“
1993 2010 2006 2013 20XX 2015 ?
Molecules in clinical
studies,
not registered yet

Department of Neurology and Centre of Clinical Neuroscience Charles University in Prague, 1st Medical Faculty and General University Hospital
MRI is the only window
we can use to look directly
at patological processes
in MS
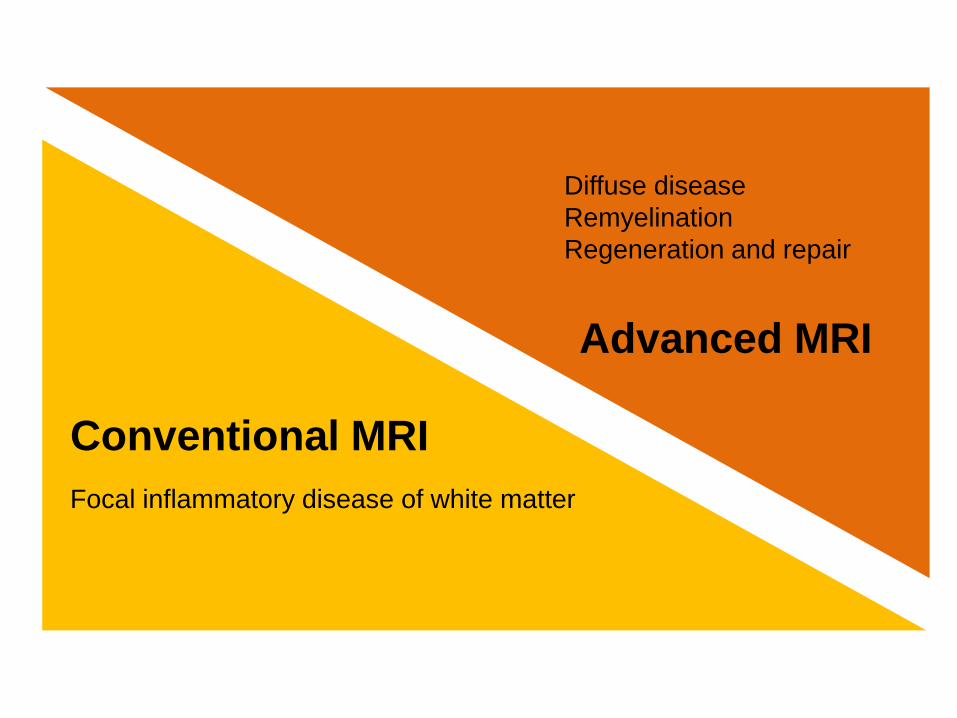
Focal inflammatory disease of white matter
Conventional MRI
Advanced MRI
Diffuse disease
Remyelination
Regeneration and repair

CONVE NT I ON A L
M
R
I
T
E
C
H
N
I
Q
U
E
S
T1W T2W
FLAIR T1W+Gd

Typical lesions
Peri
Ventricular
Posterior
Fossa
Juxta
Cortical
Spinal
cord

„Clinico-radiological paradox“
• Lack of pathologic specificity (de-, remyelination, edema, gliosis, axonal loss)
• Location – strategic areas
• Underestimation of spinal cord lesions
• Insensitivity to pathology in NAWM and NAGM
• Plasticity of the CNS
• Interaction between brain atrophy and lesion burden
• Limitations of current scales (EDSS)
Barkhof, Curr Opin in Neurology, 2002;
Zivadinov, J Neurol, 2008
Department of Neurology and Centre of Clinical Neuroscience Charles University in Prague, 1st Medical Faculty and General University Hospital
Advanced technique

New MRI Methods for Detecting Demyelination and Axonal Loss
• Brain and spinal cord atrophy
• Magnetisation transfer imaging
• Diffusion weighted and diffusion tensor imaging
• Magnetic resonance spectroscopy
• Functional MRI
• PET
• …….

Why should we measure brain atrophy? Significant brain volume loss is observed from
the earliest stage of MS and proceeds throughout
the disease course
Healthy controls 0.1-0.3 % per yr
MS 0.5-1.35 % per yr
Nicola De Stefano, CNS Drugs, 2014

How do we measure atrophy?
Cross-sectional
Global or regional brain volume
Brain parenchymal fraction
Longitudinal
Changes in particular volumes
% changes
• Proprietary software
• SIENAX
• FreeSurfer
• Scanview.cz
• SIENA
• Proprietary softwares
– Scanview.cz
Miller D, Brain, 2002
Anderson, Journal of Magnetic Resonance Imaging, 2006
De Stefano, CNS drugs, 2014
Department of Neurology and Centre of Clinical Neuroscience 1st Faculty of Medicine, Charles University in Prague and General University Hospital in Prague, Czech Republic
The results are good at a group level but
difficult to apply at an individual level

Technique independent
• ‘Ageing’ –
HC 0.1–0.3%/yr
MS 0.7–1.5%/yr
• Physiological variability
(de/hydration) Dunning, Neurology, 2005
• Other pathology
(smoking, diet, ApoE...)
• Rx effect, pseudoatrophy Zivadinov, Neurology, 2008
Technique dependent
• Scanner !!!
• Protocol !!!
• Software (measurement
accuracy – around 0.2%
• Stability of technical parameters
• Repositioning
Confounding factors
ApoE, apolipoprotein E; HC, healthy control; MS, multiple sclerosis; Rx, prescription.

Technique independent
• ‘Ageing’ –
HC 0.1–0.3%/yr
MS 0.7–1.5%/yr
• Physiological variability
(de/hydration) Dunning, Neurology, 2005
• Other pathology
(smoking, diet, ApoE...)
• Rx effect, pseudoatrophy Zivadinov, Neurology, 2008
Technique dependent
• Scanner
• Protocol
• Software (measurement accuracy
– around 0.2%
• Stability of technical parameters
• Repositioning
Confounding factors

Department of Neurology and Centre of Clinical Neuroscience 1st Faculty of Medicine, Charles University in Prague and General University Hospital in Prague, Czech Republic
Are we able to overcome these problems?

CIS, clinically isolated syndrome; IFN β, beta-interferon; MRI, magnetic resonance imaging; RRMS, relapsing–remitting MS.
April 1999
Avonex-Steroid-Azathioprine (ASA) study 181 patients with RRMS, mean disease duration 5.1 years,
positive for oligoclonal bands
Dec
2003
Dec
2009
Dec
2005
Dec
2013
4,050
MRI
scans
1,500
MRI
scans
Jul
2009
Oct
2005
Observational study of early IFN β-1a treatment in
high-risk subjects after CIS (SET study)
220 CIS patients, mean disease duration 4 months, positive for oligoclonal bands
Jul
2011
Jul
2013

• Since 1999
– 1.5 mm FLAIR
– 1 mm T1W 3D
• 25 min without Gd
• Same scanner –1.5 T Philips
Proprietary sofware, developed by
Dr J Krásenský
• T2, T1 lesion volume
• BPF with % whole brain volume change
• Regional atrophy – corpus callosum, thalamus
www.scanview.cz
ScanView QMRI protocol – Prague
FLAIR, fluid-attenuated inversion recovery; Gd, gadolinium; QMRI, quantitative magnetic resonance imaging; T1W, T1-weighted.

ASA
181 patients
10 years of
follow-up
> 4,050 MRI
scans
SET 220 patients
4 years of
follow-up
> 1,500 MRI
scans
QMRI > 2,700 patients
1–4 years of
follow-up
> 9,000 MRI
scans
> 3,000 patients with MS
> 16,500 volumetric scans using the same protocol

ASA - 10 yrs evolution on 1 line therapy 1999-2003, 181 pts, mean age 31 yrs, DD 3.7 yrs
0,5

MS patients:
0,5-1,35% per year
0,5
ASA - 10 yrs evolution on 1 line therapy 1999-2003, 181 pts, mean age 31 yrs, DD 3.7 yrs

Healthy controls:
0,1-0,3% per year
MS patients:
0,5-1,35% per year
0,5
≈5x higher

Time (years)
88
90
92
94
96
98
100
102
104
0 2 8 4 6 10 12 14 16
9-Year ASA (181 Patients and 44 Healthy Controls)
% Change in
Corpus Callosum
Volume
Whole Brain
Volume (%)
Absolute Grey
Matter Volume
(mL)
Absolute White
Matter Volume
(mL)
Healthy Controls (n=44)
Stable Patients (n=71)
Patients with1-point Increase in EDSS at
12 Months (n=110)
16
400
450
500
550
600
650
700
750
800
350
Time (years)
0 2 8 4 6 10 12 14 0
0
−10
−20
10
−30
Time (years)
2 8 4 6 10 12 14 16 16
650
700
800
400
450
500
550
600
350
750
0 2 8 4 6 10 12 14
Time (years)
ASA=Avonex-Steroid-Azathioprine study.
Horáková D Unpublished results.

Department of Neurology and Centre of Clinical Neuroscience Charles University in Prague, 1st Medical Faculty and General University Hospital
Data we receive in
a real clinical practice

Patient 1: F, 1984 , onset 2006, (22y) malignant course
CC (%), corpus callosum % change; Load, T2 lesion load; NMR, nuclear magnetic resonance.
Dept Ć.n. Date Code of
purpose Research Effects Anatomy Pathology Load BPF Atrophy CC (%)

Patient 1: last examination, 22 October 2013

Patient 1: co-registration of all available scans
22 Oct
2013
11 Aug
2008
30 Sep
2012
12 Jan
2012
16 Aug
2006
24 Sep
2009

Patient 1: colour-coding system
Red = new lesion since last scan; green = reduction in lesion since last scan; yellow = new lesions since first scan.

Department of Neurology and Centre of Clinical Neuroscience Charles University in Prague, 1st Medical Faculty and General University Hospital
Patient 2: F, 1975, onset 92 (17y) Stable

Patient 2: Stable, F, 1975, onset 92 (17y)
-1,88:11 yrs= 0,17 %
Healthy controls 0,1-0,3 %

Patient 2: Stable, F, 1975, onset 92 (17y)
9/02
9/13
9/11
9/12

Patient 2: Stable, F, 1975, onset 92 (17y)

2. M,
1972,
onset
2003
(31)
1. M,
1970,
onset
1998
(28)
1

2. M, 1972, onset 2003 (31) 1. M, 1970, onset 1998 (28)

2. M, 1972, onset 2003 (31) 1. M, 1970, onset 1998 (28)
1.55 cm3
BPF 86.7
−2.2%/13 yrs = −0.17%/yr
+1.1% CC
1.52 cm3
BPF 89.47
−5.9%/11 yrs = −0.54%/yr
−21.2% CC

2. M,
1972,
onset
2003
(31)
1. M,
1970,
onset
1998
(28)
1

Patient 5: F, 1985, onset 2007, (22y) Early escalation

Patient 5: Early escalation
-3%:3 yrs= 1,0 %
3% of CC/yr
Healthy controls 0,1-0,3 %
-1,7%:4 yrs= 0,4 %
1,25% of CC/yr
Healthy controls 0,1-0,3 %

.
Disease free concept
NEDA 4
Without relapses
Without Disability
progression
Without T2 + Gd lesions
Atrophy within a range
of healthy controls
Without
clinical activity
„Disease free Concept“
Without MRI activity
EDSS Gait
Cognition
Havrdová a kol., Roztroušená skleróza, Triton, 2013

Scanview Q-MRI System in Prague
Scanner
Protocol
Volumetric
software
Clinical
implementation
MS Centre
Interpretation
Database
Personalised
medicine
Research
Validation

Acknowledgements:
To all patients who have participated in clinical research
MS Center, Dpt of Neurology Charles University, Prague Prof E Havrdová, MD, PhD
MRI Dpt, Dpt of Radiology Charles University, Prague Prof Z Seidl, Dr M Vaněčková and RNDr J Krásenský