can africa compete with china in manufacturing? the role ... · can africa compete with china in...
TRANSCRIPT

OR I G I N A L AR T I C L E
Can Africa compete with China in manufacturing?The role of relative unit labour costs
Stephen S. Golub1 | Janet Ceglowski2 | Ahmadou Aly Mbaye3 |
Varun Prasad11Swarthmore College, Swarthmore, PA, USA2Bryn Mawr College, Bryn Mawr, PA, USA3Universit�e Cheikh Anta Diop, Dakar, Senegal
1 | INTRODUCTION
Economic ties between China and Africa have intensified in recent years, with bilateral trade growingconsiderably faster than total trade for both parties. The effects of China’s rising involvement in Afri-can economies are controversial (Asongu & Aminkeng, 2013; Brautigam, 2009; De Grauwe, Houssa,& Piccillo, 2012; Eisenman, 2012; Pigato & Tang, 2015; Tull, 2006). On the positive side, China’sdemand for African raw materials and its investments in African infrastructure contributed to Africa’simproved economic growth in the 2000s. On the other hand, trade with China does little to promoteand may even inhibit African structural transformation as booming exports of primary products exac-erbate Africa’s dependence on capital-intensive minerals and fuels while China’s exports of labour-intensive manufactures create strong headwinds for Africa’s meagre industrial base and formalemployment. Still, manufacturing wages in China have been rising quickly in recent years, potentiallycreating new opportunities for low-cost producers. This paper examines whether African countriescan develop labour-intensive manufacturing exports, taking advantage of rising wages in China.
Our principal means of assessing the competitiveness of sub-Saharan Africa’s (SSA) manufac-turing sector are measures of relative unit labour costs (RULC). We compare unit labour costs(ULCs) in SSA manufacturing to those in China. We also assess African competitiveness vis-�a-visIndia and other developing countries.
To our knowledge, our estimates are the first to evaluate SSA’s manufacturing competitive-ness with respect to China by comparing their ULCs. A number of previous contributions haveexamined manufacturing competitiveness in China and Africa, but few have made directcomparisons between Africa and China. Cox and Koo (2003) report comparative wage andproductivity data for China vis-�a-vis the United States and Mexico for 2001 but stop short ofULC comparisons. Szirmai, Ren, and Bai (2005) provide a careful analysis of relative Chineselabour productivity over time, but do not cover relative wages and ULCs. Banister (2004) is adetailed study of labour costs in Chinese manufacturing that includes a meticulouslyconstructed estimate for 2002 but does not contain productivity or unit labour cost estimates.
DOI: 10.1111/twec.12603
World Econ. 2017;1–21. wileyonlinelibrary.com/journal/twec © 2017 John Wiley & Sons Ltd | 1

Ceglowski and Golub (2007, 2012) analyse Chinese ULCs in detail, focusing on China’s com-petitiveness relative to the United States, other developed countries and a few emerging economies.In an analysis covering 1980s through the early 2000s, Ceglowski and Golub (2007) showed thatChinese ULCs in manufacturing were very low in the early 2000s at about 25%–40% of the USlevel and even lower relative to the European Union. We found that China’s cost competitivenesswas due mainly to the large currency devaluations that preceded the establishment of a de factopeg around 1995, as well as rapid productivity gains that outpaced wage growth in the 1980s andearly 1990s. From the mid-1990s to 2002, Chinese RULC stabilised at a low level, reflecting thecombined effects of exchange-rate stability and roughly equal wage and productivity growth.Ceglowski and Golub (2012) returned to this issue, with updated evidence from the 2000s. Over2003–08, China’s competitiveness deteriorated considerably, with RULC rising between 20% and70% against the United States, depending on the data used. This rise in China’s RULC reflectedvery rapid growth in Chinese wages, exceeding Chinese productivity growth, and substantial realappreciation of the Chinese renminbi. Ceglowski and Golub (2012) also note that high wagegrowth in China continued in 2009–11, outpacing productivity growth and further moderatingChinese competitiveness.
There have been fewer studies of the international competitiveness of African manufacturing.Several studies find that while informal-sector wages are low in Africa, formal-sector wages areactually very high relative to per capita GDP. Gelb, Meyer, and Ramachandran (2013) use firm-level data from World Bank Enterprise Surveys to compare formal-sector wages in African manu-facturing to those of other developing countries and conclude that Africa’s labour costs are quiteelevated and likely constitute a significant impediment to export diversification. Similar findingsare reported in Golub and Hayat (2015) and Benjamin and Mbaye (2012). These studies do notprovide time-series analyses of African competitiveness or measures of RULC. Mbaye and Golub(2003) and Edwards and Golub (2004) report findings of very high ULCs in Senegal and SouthAfrica, respectively, over a considerable period of time.
The present paper updates and combines previous studies of both China and Africa, extendingthe previous studies on China (Ceglowski & Golub, 2007, 2012), Senegal (Mbaye & Golub, 2003)and South Africa (Edwards & Golub, 2004) and adds several other countries to the African com-parators (Ethiopia, Kenya, Malawi, Mauritius and Tanzania). This choice of countries is dictatedby availability of data on manufacturing labour costs and productivity.
Section 2 reviews trends in SSA–China trade, highlighting the imbalance in manufacturedgoods in China’s favour. Section 3 develops the concept of RULC as a metric for assessingmanufacturing competitiveness. RULC encompasses differences in real wage rates, labour pro-ductivity and exchange rates into a single measure of international competitiveness. Section 4computes and analyses RULC for selected SSA countries vis-�a-vis China. Section 5 discussesthe implications of the competitiveness analysis for expanding SSA exports of labour-intensivegoods.
2 | CHINA–AFRICA TRADE IN MANUFACTURING
2.1 | Overview
Trade and investment between China and SSA took off after the liberalisation era in China, accel-erating in the 2000s (Ademola, Bankole, & Adewuyi, 2009; Broadman, 2007; Li, 2005; Lyons &Brown, 2010; Sautman & Hairong, 2007; Zafar, 2007). Figures 1 and 2 illustrate the rapid growth
2 | GOLUB ET AL.
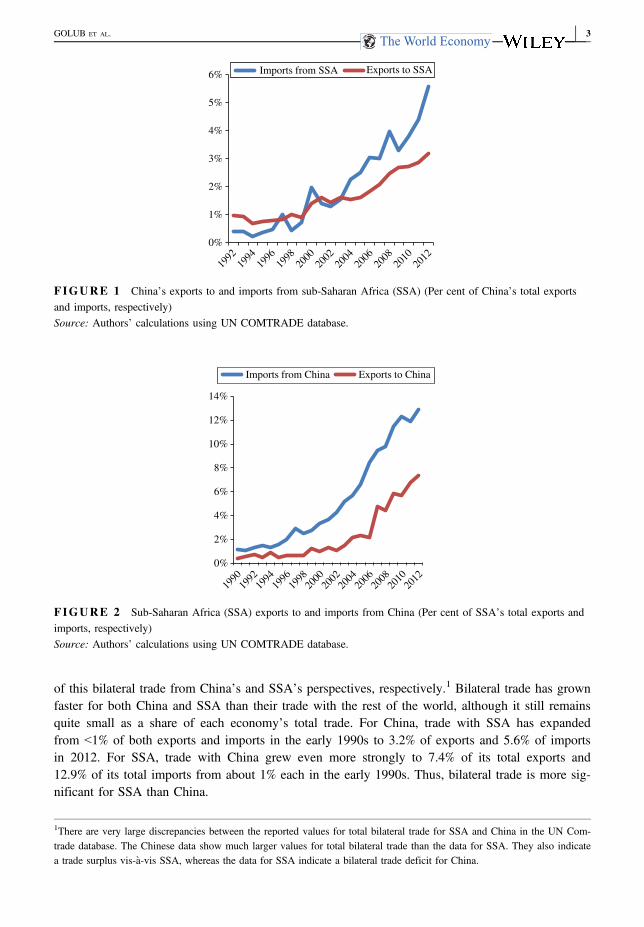
of this bilateral trade from China’s and SSA’s perspectives, respectively.1 Bilateral trade has grownfaster for both China and SSA than their trade with the rest of the world, although it still remainsquite small as a share of each economy’s total trade. For China, trade with SSA has expandedfrom <1% of both exports and imports in the early 1990s to 3.2% of exports and 5.6% of importsin 2012. For SSA, trade with China grew even more strongly to 7.4% of its total exports and12.9% of its total imports from about 1% each in the early 1990s. Thus, bilateral trade is more sig-nificant for SSA than China.
0%
1992
1994
1996
1998
2000
2002
2004
2006
2008
2010
2012
1%
2%
3%
4%
5%
6% Imports from SSA Exports to SSA
FIGURE 1 China’s exports to and imports from sub-Saharan Africa (SSA) (Per cent of China’s total exportsand imports, respectively)Source: Authors’ calculations using UN COMTRADE database.
0%
2%
4%
6%
8%
10%
12%
14%
Imports from China Exports to China
1992
1990
1994
1996
1998
2000
2002
2004
2006
2008
2010
2012
FIGURE 2 Sub-Saharan Africa (SSA) exports to and imports from China (Per cent of SSA’s total exports andimports, respectively)Source: Authors’ calculations using UN COMTRADE database.
1There are very large discrepancies between the reported values for total bilateral trade for SSA and China in the UN Com-trade database. The Chinese data show much larger values for total bilateral trade than the data for SSA. They also indicatea trade surplus vis-�a-vis SSA, whereas the data for SSA indicate a bilateral trade deficit for China.
GOLUB ET AL. | 3

Chinese foreign direct investment (FDI) in SSA has also increased rapidly. Data from the Her-itage Foundation and American Enterprise Institute indicate it rose from $9 billion in 2006 to$29 billion in 2013. As Figure 3 shows, Chinese investment in SSA also became increasingly geo-graphically diversified during this period.
2.2 | Sectoral pattern of trade
Sub-Saharan Africa’s bilateral trade is characterised by large compositional differences between itsexports to and imports from China. The bulk of SSA’s exports to China are primary products andChina’s reliance on Africa as a source of natural resources, particularly oil, increased in the 2000s(Alden & Alves, 2009; Kaplinsky, McCormick, & Morris, 2007). In contrast, Chinese exports toSSA mainly consist of light manufactures including clothing, footwear and plastic products, andheavy machinery, such as transport equipment (Haugen, 2011). These compositional differenceshave geographic implications. While a few countries account for a significant share of SSA’sexports to China, reflecting the dominance of oil and minerals in China’s bilateral import,2 Chineseexports to the region are less geographically concentrated.
To update and gain greater insight into the nature of this bilateral trade, this section presentstrade flows between China and SSA using the International Trade Center’s factor-intensity method(van Marrewijk & Hu, 2013; Maswana, 2011). Products are divided into five categories, primaryproducts and four types of manufactured goods: natural resource-intensive products, unskilledlabour-intensive products, human capital-intensive products and technology-intensive products. Theindividual products comprising each category are shown in the Appendix.
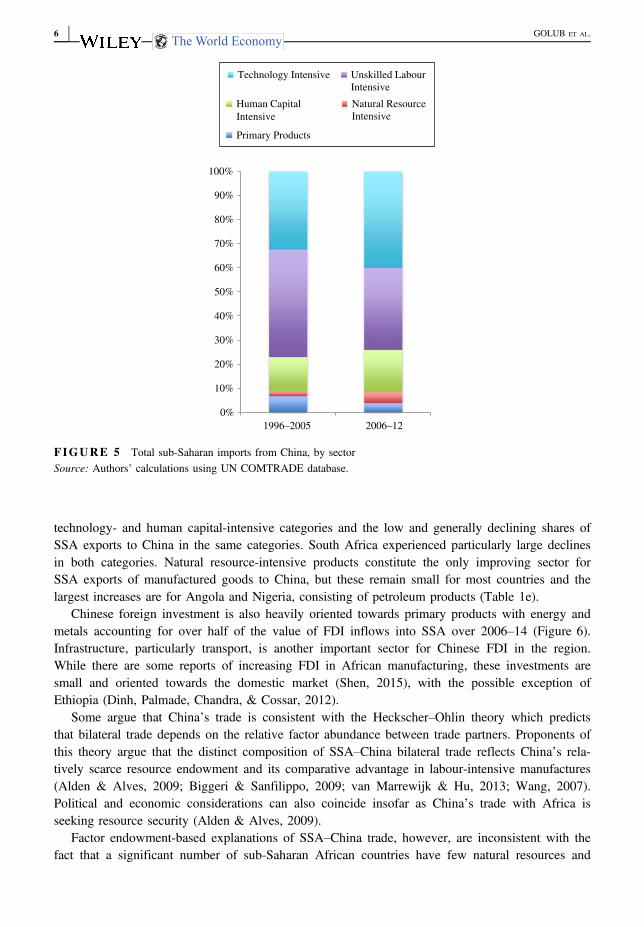
Figures 4 and 5 depict the composition of bilateral trade between China and SSA as a wholeby factor intensity for 1996–2005 and 2006–12. SSA’s bilateral exports consist overwhelmingly ofprimary products in both time periods (Figure 4). Moreover, the small share of manufacturedexports has become increasingly concentrated in natural resource-intensive products, with the
6
109
14
11
1718 18
0
2
4
6
8
10
12
14
16
18
20
2006 2007 2008 2009 2010 2011 2012 2013
FIGURE 3 Number of sub-Saharan African Countries with new Chinese Foreign Direct Investment, 2006–13Source: Authors’ calculations using data from the Heritage Foundation.
2Angola accounted for almost half of China’s total imports from SSA in 2012, up from 9% in 1992. South Africa is second,accounting for 21% of China’s imports from the region in 2012.
4 | GOLUB ET AL.

shares of technology-intensive and human capital-intensive products actually declining. Most sig-nificantly, SSA exports virtually no labour-intensive products to China. In contrast, SSA’s importsfrom China are overwhelmingly manufactured goods, with a small and declining share of primaryproducts (Figure 5). Reflecting China’s rising sophistication in production, the shares of technol-ogy- and human capital-intensive products in China’s exports to SSA have grown while those ofunskilled labour-intensive products have declined.
Table 1 shows bilateral Chinese trade with selected SSA countries and SSA as a whole, withand without South Africa, by product categories, as a share of each respective country or group’stotal bilateral trade with China. For all countries except South Africa, primary products account forthe large majority of exports to China, with the share exceeding 90% in most cases and risingbetween 1999–2005 and 2006–12 (Table 1a). Kenya is a notable exception; its share of primaryproducts fell to 71% from 89% over the two periods. Even Mauritius, the most successful exporterof manufactures in SSA, exports only primary products to China. Most SSA countries import littlein the way of primary products from China.
Table 1b reveals the large imbalance in labour-intensive goods. The share of labour-intensivegoods in exports to China is negligible for all countries and a mere 0.1% for SSA as a whole, withand without South Africa. In contrast, imports of unskilled labour-intensive products were large forall countries shown, accounting for about 45% of SSA’s total imports from China in 1999–2005and 32% in 2006–12.3 Table 1c, d show the rising proportion of SSA’s bilateral imports in the
0%
10%
20%
30%
40%
50%
60%
70%
80%
90%
100%
1996–2005 2006–12
Technology Intensive Unskilled Labour Intensive
Human Capital Intensive
Natural Resource Intensive
Primary Products
FIGURE 4 Total sub-Saharan exports to China, by sectorSource: Authors’ calculations using UN COMTRADE database.
3Benin’s share of these imports is particularly large and Nigeria’s low, reflecting Benin’s role as a smuggling entrepot intoNigeria (Golub, 2012). Ethiopia’s low share likely reflects its efforts to promote domestic industry with high importbarriers.
GOLUB ET AL. | 5
technology- and human capital-intensive categories and the low and generally declining shares ofSSA exports to China in the same categories. South Africa experienced particularly large declinesin both categories. Natural resource-intensive products constitute the only improving sector forSSA exports of manufactured goods to China, but these remain small for most countries and thelargest increases are for Angola and Nigeria, consisting of petroleum products (Table 1e).
Chinese foreign investment is also heavily oriented towards primary products with energy andmetals accounting for over half of the value of FDI inflows into SSA over 2006–14 (Figure 6).Infrastructure, particularly transport, is another important sector for Chinese FDI in the region.While there are some reports of increasing FDI in African manufacturing, these investments aresmall and oriented towards the domestic market (Shen, 2015), with the possible exception ofEthiopia (Dinh, Palmade, Chandra, & Cossar, 2012).
Some argue that China’s trade is consistent with the Heckscher–Ohlin theory which predictsthat bilateral trade depends on the relative factor abundance between trade partners. Proponents ofthis theory argue that the distinct composition of SSA–China bilateral trade reflects China’s rela-tively scarce resource endowment and its comparative advantage in labour-intensive manufactures(Alden & Alves, 2009; Biggeri & Sanfilippo, 2009; van Marrewijk & Hu, 2013; Wang, 2007).Political and economic considerations can also coincide insofar as China’s trade with Africa isseeking resource security (Alden & Alves, 2009).
Factor endowment-based explanations of SSA–China trade, however, are inconsistent with thefact that a significant number of sub-Saharan African countries have few natural resources and
0%
10%
20%
30%
40%
50%
60%
70%
80%
90%
100%
1996–2005 2006–12
Technology Intensive Unskilled Labour Intensive
Human Capital Intensive
Natural Resource Intensive
Primary Products
FIGURE 5 Total sub-Saharan imports from China, by sectorSource: Authors’ calculations using UN COMTRADE database.
6 | GOLUB ET AL.

TABLE 1 Sub-Saharan bilateral exports to and imports from China by sector (Annual average in per cent)
Exports Imports
1999–2005 2006–12 1999–2005 2006–12
a. Primary products
Angola 99.8 99.0 6.4 2.7
Benin 99.8 92.3 0.9 2.3
Cameroon 97.9 93.9 2.6 5.2
Ethiopia 75.3 90.3 0.8 0.8
Ghana 99.5 98.6 6.7 5.9
Kenya 89.5 70.8 1.6 1.2
Nigeria 99.0 95.6 2.2 3.8
Mauritius 98.3 99.3 15.0 13.1
Senegal 99.4 96.8 27.6 34.8
South Africa 38.1 61.5 7.0 3.6
Tanzania 99.0 90.8 3.4 1.0
Total SSA 85.1 84.7 6.7 3.8
Total SSA less South Africa 97.1 91.3 6.2 3.9
b. Unskilled labour-intensive products
Angola 0.0 0.0 31.0 19.7
Benin 0.0 0.3 62.4 66.5
Cameroon 0.0 0.0 47.4 28.1
Ethiopia 0.7 0.6 30.8 12.8
Ghana 0.0 0.0 43.8 34.3
Kenya 1.1 0.4 46.8 35.9
Nigeria 0.1 0.0 30.9 16.2
Mauritius 0.3 0.4 55.1 57.7
Senegal 0.5 0.0 47.9 24.5
South Africa 0.2 0.0 46.0 38.6
Tanzania 0.0 0.2 38.1 34.0
Total SSA 0.1 0.1 44.6 33.9
Total SSA less South Africa 0.1 0.1 44.3 32.1
c. Technology intensive
Angola 0.0 0.0 41.5 44.0
Benin 0.2 0.0 23.1 17.2
Cameroon 0.0 4.1 25.7 37.7
Ethiopia 0.0 0.1 46.2 64.7
Ghana 0.0 0.1 30.4 35.1
Kenya 2.9 10.6 33.3 39.5
Nigeria 0.3 1.3 44.6 50.1
(Continues)
GOLUB ET AL. | 7

TABLE 1 (Continued)
Exports Imports
1999–2005 2006–12 1999–2005 2006–12
Mauritius 1.2 0.2 12.7 13.0
Senegal 0.1 0.2 13.8 24.2
South Africa 10.3 3.3 32.7 40.2
Tanzania 0.6 1.6 37.6 39.2
Total SSA 2.5 1.2 32.4 40.1
Total SSA less South Africa 0.4 0.6 32.6 40.1
d. Human capital intensive
Angola 0.0 0.0 16.3 22.1
Benin 0.0 0.0 13.0 12.8
Cameroon 0.0 0.1 19.9 21.9
Ethiopia 0.0 0.0 20.9 19.0
Ghana 0.0 0.1 16.3 20.4
Kenya 2.4 0.1 16.7 19.7
Nigeria 0.0 0.0 19.5 21.7
Mauritius 0.1 0.1 12.6 12.1
Senegal 0.0 0.0 8.8 12.4
South Africa 14.5 2.4 11.7 14.4
Tanzania 0.0 0.0 19.3 21.3
Total SSA 3.0 0.5 14.1 17.6
Total SSA less South Africa 0.1 0.0 14.9 18.8
e. Natural resource intensive
Angola 0.4 8.1 4.8 11.5
Benin 0.2 0.9 0.5 1.2
Cameroon 2.6 5.7 4.4 7.1
Ethiopia 0.6 2.0 1.3 2.6
Ghana 1.2 3.8 2.7 4.2
Kenya 0.9 2.4 1.6 3.6
Nigeria 1.6 6.1 2.8 8.3
Mauritius 0.0 0.0 4.6 4.1
Senegal 0.5 3.6 2.0 4.1
South Africa 2.2 3.4 2.7 3.2
Tanzania 1.5 3.0 1.7 4.4
Total SSA 1.2 3.6 2.2 4.6
Total SSA less South Africa 1.0 3.7 2.0 5.1
Source: Authors’ calculations using UN Comtrade database.
8 | GOLUB ET AL.

most countries have a large reservoir of underemployed workers with very low earnings (Golub &Hayat, 2015). From this perspective, imports of labour-intensive goods from China inhibit thegrowth of manufacturing in SSA (Giovannetti & Sanfilippo, 2009; Jenkins & Edwards, 2006).Thus, while Chinese demand for raw materials has benefited some SSA countries (Jacobs, 2012),the question remains why SSA is unable to compete with China in manufacturing despite risingwages in China and plenty of underemployed labour in SSA. To address this issue, we propose aframework based on RULC.
3 | ASSESSING COMPETITIVENESS: RELATIVE UNITLABOUR COSTS
3.1 | Method
A country’s international competitiveness in manufacturing depends on its costs of production rela-tive to competitors. Relative unit labour costs are a useful metric of these relative production costsin manufacturing. The use of RULC as a measure of cost competitiveness focuses solely on labourcosts and labour productivity. While other factors such as capital costs, energy costs, human capi-tal, infrastructure, and institutional quality also matter, the RULC approach is less limiting than itmay first appear. In a world where capital and intermediate inputs are mobile and production isfootloose between countries, the relative costs of non-tradable inputs matter more for export com-petitiveness than the costs of tradable inputs such as capital and energy, which tend to be equalisedinternationally. Thus, low non-tradable input costs will be important factors in attracting footlooseinputs, notably FDI and technology transfer (Golub, Jones, & Kierzkowski, 2007) and global buy-ers will tend to source from locations with low non-tradable costs. Because labour is the mostimportant non-tradable input, particularly for labour-intensive goods, RULC provides a useful mea-sure of competitiveness. By accounting for labour productivity, it is superior to international wagecomparisons that commonly appear in policy and popular discussions of competitiveness. Infra-structure (electricity, transport and telecommunications) is also an important non-tradable input notexplicitly considered in RULC calculations, but the quality and cost of infrastructure may bereflected partially in RULC measures through their impact on labour productivity. In part for thesereasons, Turner and Van’t Dack’s (1993) and Turner and Golub’s (1997) surveys of the literatureconclude that RULC in manufacturing are the best single indicator of competitiveness. Hinkle andNsengiyumba (1999) also endorse the use of ULCs, for analysis of both levels and rates of changeof competitiveness.
In addition to its clear intuitive appeal, RULC is the key relative price in a Ricardian model oftrade (Golub & Hsieh, 2000). Ferguson (1978) showed that in the presence of mobile capital, theHeckscher–Ohlin model takes on a Ricardian character, with comparative advantage dependingonly on ULC. Jones (2016) provides empirical support for the argument that capital stocks play arather small part in explaining international differences in total factor productivity. In particular,his estimates show that labour productivity and total factor productivity are much higher in Chinathan Malawi and Kenya but that the capital–output ratio of these two African countries is veryclose to China’s.4
Notwithstanding these several advantages, it should be kept in mind that RULC do not captureall aspects of international cost competitiveness. In particular, as discussed in the concluding sec-tion, the overall business climate is also very important.
4Malawi’s is virtually identical and Kenya’s a bit below.
GOLUB ET AL. | 9

RULC is a simple concept that can be explained as follows. Let a represent the unit labourrequirement (the inverse of productivity) in manufacturing:
a ¼ LQ; (1)
where Q is value added and L is labour employment. Marginal productivity and hence a areassumed to be constant with respect to variations in L.
Let w denote the average labour compensation per worker in manufacturing. If labour is the onlyfactor of production (or other factor costs do not differ across countries), average costs of productionare equal to ULCs, the product of the unit labour requirement and average labour compensation, aw.Expressed in domestic currency, foreign ULCs are a*w*e, where * refers to the foreign country and eis the exchange rate (domestic currency per unit of foreign currency). A country’s international com-petitiveness in manufacturing then depends on its relative unit labour costs (RULC):
RULC ¼ awa�w�e
¼ aa�
� � ww�e
� �: (2)
The last expression in Equation (2) shows that RULC can be decomposed into relative productiv-ity and relative wages measured in a common currency. The home country will have a competitiveadvantage in manufacturing when RULC < 1, that is, its ULCs are below those of its trading partners.
Alternatively, Equation (2) can be written as
RULC ¼ awa�w�e
¼ aa�
� � ww�e
� �¼ ai
a�� � wi
w�ePPP� � ePPP
e
� �; (3)
where ePPP denotes the purchasing power parity (PPP) exchange rate for manufacturing defined asthe ratio of the domestic to foreign price levels for manufactured goods, p and p* respectively, thatis, ePPP = p/p*. Substituting the definition of ePPP into the middle term of the right-hand side ofEquation (3) yields:
RULC ¼ aa�
� � w=pw�=p�
� �ePPP
e
� �: (4)
A country’s competitiveness vis-�a-vis other countries depends on the three terms in Equation (4):(i) labour productivity in the home country relative to other countries; (ii) real labour compensation inthe home country relative to those of other countries;5 and (iii) the level of the bilateral exchange raterelative to its PPP level or, equivalently, the real bilateral exchange rate. Gains or losses in a country’scompetitive position over time can originate with changes in any of these ratios.
3.2 | Data
Our measures of SSA–China RULC are constructed in two steps. We first construct RULCs forindividual SSA countries and China relative to the United States. We then compare the RULCs forindividual SSA countries to the RULC for China to assess their competitiveness in manufacturingrelative to China. These calculations require data for manufacturing productivity and wages, aswell as exchange rates. Productivity is calculated as manufacturing value added per employee,deflated by a manufacturing value-added deflator and converted to US dollars at an equilibrium or
5Labour compensation is deflated by producer prices for manufacturing in Equation (4) rather than consumer prices, so it isnot an indicator of workers’ welfare.
10 | GOLUB ET AL.

purchasing power parity exchange (PPP) rate. Wages are defined as total labour compensation peremployee, converted to dollars at the market exchange rate. As is accepted in the literature oninternational labour productivity and unit labour cost comparisons, PPP exchange rates are usedfor international productivity comparisons to eliminate the effects of exchange-rate volatility onmeasures of real output, which should be invariant to such exchange-rate fluctuations. But devia-tions of exchange rates from PPP do affect relative labour costs, so it is appropriate to use the mar-ket exchange rate in converting wages. Currency depreciation consequently tends to improveinternational competitiveness by reducing labour costs relative to labour productivity.
The primary data source for manufacturing productivity and wages is the UNIDO IndustrialStatistics database (INSTAT). INSTAT reports nominal value-added, labour compensation andemployment to 2010 for various countries, including China and a limited number of African coun-tries. The INSTAT data were supplemented with national data for the United States and Senegal.The series for nominal value added in manufacturing were converted to real terms by deflatingthem by manufacturing value-added deflators derived from measures of nominal and real manufac-turing value added reported in the World Bank’s World Development Indicators.6 Two sourcesare used for PPP exchange rates: the International Comparison Project (ICP) PPPs for tradedgoods, and the University of Groningen manufacturing PPPs. While manufacturing-specific PPPsare ideal and are available for China, they are not available for most SSA countries, with theexception of South Africa.
4 | AFRICAN RELATIVE UNIT LABOUR COSTS VIS- �A-VISCHINA
This section compares manufacturing productivity, wages and unit labour costs in selected SSAcountries to China.7 Some initial insights into SSA’s competitiveness in manufacturing emerge
0
5
10
15
20
25
30
35
40
45
50
Agricu
lture
Energ
y
Meta
ls
Utiliti
es
Constr
uctio
n
Techn
ology
Transp
ort
FIGURE 6 Cumulative Chinese FDI in SSA, 2006–14 ($ billion)Source: Authors’ calculations using data from the Heritage Foundation.
6The World Bank measures of manufacturing value added differ from UNIDO’s, as the former are based on a national accountsconcept and the latter are census-based. See Ceglowski and Golub (2007, 2012) for further discussion. However, the ratios ofnominal to real value added are likely to be less dissimilar across countries than the levels of the two alternative measures.7Countries are selected based on data availability.
GOLUB ET AL. | 11

from a comparison of manufacturing wages to per capita GDP. Per capita GDP can be taken as anindicator of a country’s overall productivity level. In comparison with a number of other countries,manufacturing wages are very high in SSA relative to per capita GDP (Table 2). In 2010, mostAsian countries, including China, had ratios of manufacturing wages to per capita GDP at or below1.0. That is, average annual manufacturing wages are roughly equal to per capita income in most
TABLE 2 Annual manufacturing wages, selected countries in Africa and other regions, current US$
2000 2010
Level in US$Relative to percapita GDP Level in US$
Relative to percapita GDP
Sub-Saharan Africa
Burundi NA NA 3,261 14.9
Cameroon 3,088 5.3 NA NA
Ethiopia 771 6.3 807 2.4
Ghana 1,832 4.9 NA NA
Kenya 2,118 5.2 2,854 3.6
Malawi 436 2.8 2,045 5.7
Mauritius 3,254 0.8 6,285 0.8
Senegal 3,680 7.8 6,450 6.5
South Africa 7,981 2.6 12,331 1.7
Tanzania 2,296 7.5 1,581 3.0
North Africa
Egypt 2,028 1.3 3,453 1.2
Morocco 4,123 3.2 6,654 2.4
Tunisia 4,066 1.8 5,455 1.3
Latin America
Brazil 5,822 1.6 10,918 1.0
Colombia 4,096 1.6 4,680 0.8
Mexico 8,048 1.2 7,310 0.8
Asia
Bangladesh NA NA 680 1.6
China 1,016 1.1 4,770 1.1
India 1,356 3.0 2,619 1.8
Indonesia 929 1.2 1,897 0.6
Malaysia 4,405 1.1 6,548 0.7
Vietnam NA NA 1,727 1.3
Eastern Europe
Czech Rep. 3,964 0.7 12,673 0.7
Latvia 3,689 1.1 9,191 0.8
Poland 5,829 1.1 10,162 0.8
Source: Authors’ calculations using UNIDO INSTAT database and per capita GDP from World Bank, World Development Indicators.
12 | GOLUB ET AL.

Asian countries. The same is true in Eastern Europe and Latin America. In SSA, however, wagesare typically several times per capita GDP. The only exception is Mauritius and to a lesser extentSouth Africa. The ratio of wages to per capita GDP fell in SSA since 2000 but remained very highas of 2010.
Table 3 and Figure 7 compare the ULCs in manufacturing of individual SSA countries to Chi-nese ULCs. Two sets of RULC measures are shown based on the two alternative estimates of PPPexchange rates.8 The first set, labelled ICP-based, is based on tradable-goods PPPs (exports andimports) from the ICP. The second set of estimates, labelled ICOP-based, uses manufacturing PPPvalues derived from the University of Groningen International Comparison of Output and Produc-tivity (ICOP) project for those countries for which such data are available (China and SouthAfrica), and the ICP traded goods values for other countries. The higher values in the second setof estimates are mainly due to the fact that the China–US PPP exchange rate in ICOP is consider-ably lower than that of ICP.
In both sets of estimates, RULCs with respect to China were very high in key SSA countries inthe early 2000s (Figure 7). They have dropped for all countries since then but neverthelessremained high for most countries in 2010. Most countries’ RULC were above 1.0 in 2010, indicat-ing their ULCs in manufacturing exceeded those in China. Ethiopia and Tanzania are exceptions.As of 2010, ULCs for Ethiopia and Tanzania were at rough parity with China according to theICOP-based measures and were substantially below China’s according to the ICP-based measures(Table 3).
Table 4 breaks down the improvement in RULCs for SSA into Chinese and SSA real wageand productivity growth and real exchange-rate movements over 2000–10. Chinese productivityand wages both grew strongly, with wage growth outpacing productivity and pushing up ChineseULCs. Manufacturing productivity growth in the SSA economies was slower than China’s, sub-stantially so in most cases. However, real wage growth in the SSA economies was even slower,pushing down ULCs. In a nutshell, the improvement in SSA’s manufacturing competitivenessreflects both rising Chinese ULCs and productivity growth in SSA countries that outpaced wages.Figures 8a–f plot the factors underpinning the bilateral RULC levels vis-�a-vis China over 2000–10: relative productivity, real wages and the real bilateral exchange rate of our sample of SSAcountries relative to China. These figures show that relative real wages and relative productivity inthe SSA countries are both high and generally declining, with relative real wages exceeding
TABLE 3 Relative unit labour cost vis-�a-vis China (RULC), 2010
ICP-based measures ICOP-based measures
Ethiopia 0.61 1.01
Kenya 1.21 2.01
Malawi 1.75 2.92
Mauritius 1.61 2.68
Senegal 1.38 2.30
South Africa 1.52 3.01
Tanzania 0.56 0.94
Note: RULC > 1.0 means African countries have higher unit labour costs than China.Source: Authors’ calculations using UNIDO INSTAT database.
8The PPP exchange rates are used in constructing relative productivity.
GOLUB ET AL. | 13

relative productivity in most cases. There is no clear trend for the real bilateral exchanges ratebetween the SSA countries and China over 2000–10. However, exchange-rate changes contributedto falling RULCs for Ethiopia, Mauritius, and Tanzania; these countries all experienced real appre-ciations that were smaller than the real appreciation of China’s currency, effectively resulting in areal depreciation against the renminbi (Table 4). Overall, wage moderation in domestic currency—rather than productivity growth or real exchange-rate depreciation—is the main reason for
ICP-based measures
ICOP-based Measures
0.0
0.5
1.0
1.5
2.0
2.5
3.0
2003 2004 2005 2006 2007 2008 2009 2010
0.0
1.0
2.0
3.0
4.0
5.0
6.0
2003 2004 2005 2006 2007 2008 2009 2010
Ethiopia Kenya Mauritius
Senegal South Africa Tanzania
(b)
(a)
FIGURE 7 Relative unit labour cost vis-�a-vis China, 2003–10Source: Authors’ calculations using UNIDO INSTAT database.
14 | GOLUB ET AL.

improving competitiveness of the six African countries. Sustained improvements in African com-petitiveness accompanied by rising living standards will depend on boosting productivity growth,as China has done.
Several key findings emerge from this analysis. First, manufacturing wages in SSA are veryhigh relative to per capita GDP. Second, until recently, real wages and productivity in SSA manu-facturing have both been well above China’s levels, with the real wage differential exceeding theproductivity differential. Consequently, ULCs in our sample of SSA economies have been signifi-cantly higher than in China. These high labour costs have harmed African competitiveness and
TABLE 4 Productivity, real wages, real exchange rates and relative unit labour costs, annual per cent changes,2000–10
Productivitygrowth
Real wagegrowth
Real appreciationvis-�a-vis US dollar
Relative unit labourcost vis-�a-vis USA
Relative unit labourcost vis-�a-vis China
China 11.7 12.9 4.7 7.8 NA
Ethiopia 0.2 �1.3 2.5 2.2 �5.6
Kenya 1.5 �0.7 5.0 4.7 �3.1
Mauritius 5.2 4.8 3.1 4.7 �3.1
Senegal 2.2 0.3 6.7 6.8 �1.0
South Africa 3.0 2.0 4.6 5.6 �2.2
Tanzania 8.4 0.6 1.8 �4.2 �12.0
Source: Authors’ calculations using UNIDO INSTAT database.
TABLE 5 Productivity, wages and unit labour cost relative to the United States for China, African countries andother developing countries (United States = 1)
Productivity Wages Unit labour cost
Africa
Ethiopia 0.03 0.02 0.53
Kenya 0.05 0.06 1.23
Malawi 0.03 0.05 1.79
Mauritius 0.09 0.14 1.64
Senegal 0.10 0.15 1.41
South Africa 0.18 0.28 1.56
Tanzania 0.06 0.04 0.57
Asia
Bangladesh 0.02 0.02 0.70
China 0.18 0.11 0.61
India 0.12 0.06 0.50
Indonesia 0.08 0.04 0.55
Latin America
Brazil 0.13 0.25 1.92
Mexico 0.19 0.17 0.88
Source: Authors’ calculations using UNIDO INSTAT database.
GOLUB ET AL. | 15

explain in part Africa’s failure to develop labour-intensive manufacturing. Third, the growth of realwages and productivity in SSA manufacturing has lagged the growth in their Chinese counterpartsin recent years. Fourth, relative real wages dropped more rapidly than relative productivity for oursample of SSA countries, boosting their competitiveness vis-�a-vis China. Unit labour costs in somecountries (Ethiopia and Tanzania) fell to or even below China’s levels in 2010. For other SSAcountries, however, RULC remained high.
(a) Ethiopia(b) Kenya
0.500.600.700.800.901.001.101.201.301.401.50
0.000.100.200.300.400.500.600.700.800.90
0.500.600.700.800.901.001.101.201.301.401.50
0.00
0.50
1.00
1.50
2.00
2.50
3.00
(e) South Africa (f) Tanzania
0.500.600.700.800.901.001.101.201.301.401.50
0.00
2.00
4.00
6.00
8.00
10.00
12.00
0.500.600.700.800.901.001.101.201.301.401.50
0.000.100.200.300.400.500.600.700.800.901.00
2004
2005
2006
2007
2008
2009
2010
2004
2003
2002
2001
2000
2005
2006
2007
2008
2009
2010
2004
2003
2002
2001
2000
2005
2006
2007
2008
2009
2010 20
0420
0320
0220
0120
0020
0520
0620
0720
0820
0920
10
2004
2003
2002
2001
2000
2005
2006
2007
2008
2009
2010
2004
2003
2002
2001
2000
2005
2006
2007
2008
2009
2010
(c) Mauritius (d) Senegal
0.500.600.700.800.901.001.101.201.301.401.50
0.000.501.001.502.002.503.003.504.00
0.50
0.70
0.90
1.10
1.30
1.50
0.00
1.00
2.00
3.00
4.00
5.00
6.00
Productivity Ratio Real Wage Ratio Real Exchange Rate
FIGURE 8 Levels of productivity, real wages and the real bilateral exchange rate relative to China (ICP-basedmeasures)Note: Left hand vertical axis shows production and real wage ratio and right hand axis shows the real bilateralexchange rate vis a vis China (increase is a real appreciation).Source: Authors’ calculations using UNIDO INSTAT database.
16 | GOLUB ET AL.

While the focus of this paper is on China–Africa bilateral competitiveness, we also examinedAfrica’s competitiveness vis-�a-vis other emerging economies. Table 5 shows wages, productivityand ULCs in 2010 for the African countries in the sample, China, some other Asian developingcountries (Bangladesh, India and Indonesia) and two important Latin American emerging countries(Brazil and Mexico). All of these figures are relative to the United States, for ease of comparisonacross multiple countries. The other Asian countries have RULC that are quite similar to China’s.In fact, India and Indonesia had lower relative unit costs than China in 2010. In the case of LatinAmerica, Mexico has low RULC, well below those of most African countries, whereas Brazil hashigh RULC similar in magnitude to those of most of the African countries. Thus, the finding thatmost African ULCs are relatively high holds for other comparator countries in Table 5, especiallyIndia. The exception, Brazil, is not known as an exporter of labour-intensive manufactured goods.
High ULCs are not the only reason for Africa’s lack of competitiveness in manufacturing. Thegeneral business environment also matters. African countries tend to perform poorly in compar-isons of the quality of infrastructure, corruption and institutional quality more generally (Eifert,Gelb, & Ramachandran, 2008; Golub, O’Connell, & Du, 2008). In Ethiopia and Tanzania, the twocountries with favourable ULCs, power outages are frequent, roads are of poor quality, and portsare slow to process containers (Golub & Hayat, 2015).
5 | CONCLUSIONS AND POLICY IMPLICATIONS
Economic growth in SSA has improved but has been substantially based on capital-intensive sec-tors such as minerals and telecommunications, with consequent limited growth of formal-sectoremployment. This contrasts with Asia’s reliance on labour-intensive manufacturing exports, whichhave boosted employment and contributed dramatically to poverty reduction. China in particularhas become a dominant exporter of manufactured goods, and the composition of its bilateral tradewith SSA is highly skewed towards exports of manufactures and imports of minerals. In recentyears, however, Chinese wages have been rising rapidly and outpacing productivity growth, reduc-ing China’s competitive advantage in manufacturing and opening the door to inroads by lower-income countries, including those in SSA.
We show that SSA’s international competitiveness has improved but remains largely unfavour-able relative to China, as measured by RULC. Real wages in sub-Saharan African formal manufac-turing are very high relative to per capita income. High real wages in formal manufacturing reducecompetitiveness in labour-intensive manufacturing. Poor infrastructure and weak institutions alsoadversely affect the business environment for foreign investment. Low-income Asian countrieshave so far shown a greater ability to enter into the global market for labour-intensive manufac-tures than sub-Saharan countries. Given new Asian competitors and China’s continued dominantpresence, the possibilities for Africa to compete in low-skill manufacturing are not encouraging,despite some progress in a few countries such as Ethiopia (Dinh et al., 2012).
Instead, African countries may have greater potential to boost labour-intensive exports in othersectors, especially agriculture, including traditional primary products, horticulture and fishing(Golub et al., 2008). Agricultural exports share many of the features of manufacturing, both interms of their potential to spur growth and employment, and the institutional constraints they facein achieving this potential. Several critical aspects of manufacturing exports that promote develop-ment and poverty reduction apply to traditional and non-traditional agriculture. These include highlabour intensity, possibilities for technological upgrading and consequently raising producerincomes, and access to state-of-the-art foreign technology through FDI and outsourcing. But they
GOLUB ET AL. | 17

also include the necessity of attaining international competitiveness and thus the critical roles oflow-cost labour and a favourable climate for investment. For agriculture, especially, sanitary andphyto-sanitary norms in developed-country, markets are a major hurdle for successful exporting(Golub & McManus, 2009; Mbaye & Gueye, 2014), analogous to the demanding specifications ofglobal buyers of manufactures. SSA’s success in exporting labour-intensive products, in agricultureas in manufacturing, hinges on improving the business climate and boosting competitivenessthrough increased labour productivity and wage moderation.
ACKNOWLEDGEMENT
The authors thank Haroon Bhorat and the University of Cape Town’s Development PolicyResearch Unit (DPRU) for inviting and funding this contribution and participants in the conferenceon China in Africa in November 2014 sponsored by DPRU for comments.
ORCID
Stephen S. Golub http://orcid.org/0000-0002-8074-2631
REFERENCES
Ademola, O. T., Bankole, A. S., & Adewuyi, A. O. (2009). China–Africa Trade relations: Insights from AERCscoping studies. European Journal of Development Research, 21(4), 485–505. https://doi.org/10.1057/ejdr.2009.28
Alden, C., & Alves, A. C. (2009). China and Africa’s natural resources: The challenges and implications for devel-opment and governance (Occasional Paper 41). Retrieved from South African Institute of International Affairswebsite: http://www.voltairenet.org/IMG/pdf/China_and_Africa_s_Natural_Resources.pdf.
Asongu, S. A., & Aminkeng, G. A. (2013). The economic consequences of China–Africa relations: Debunkingmyths in the debate. Journal of Chinese Economic and Business Studies, 11(4), 261–277. https://doi.org/10.1080/14765284.2013.838384
Banister, J. (2004). Manufacturing Employment and Compensation in China. Unpublished paper prepared for UnitedStates Bureau of Labor Statistics, December (Washington, DC).
Benjamin, N. C., & Mbaye, A. A. (2012). The informal sector in francophone Africa. Washington, DC: WorldBank. https://doi.org/10.1596/978-0-8213-9537-0
Biggeri, M., & Sanfilippo, M. (2009). Understanding China’s move into Africa: An empirical analysis. Journal ofChinese Economic and Business Studies, 7(1), 31–54. https://doi.org/10.1080/14765280802604714
Brautigam, D. (2009). The Dragon’s gift: The real story of China in Africa. New York, NY: Oxford UniversityPress.
Broadman, H. G. (2007). Africa’s silk road: China and India’s new economic frontier. Washington, DC: WorldBank Publications.
Ceglowski, J., & Golub, S. (2007). Just how low are China’s labour costs?. The World Economy, 30(4), 597–617.https://doi.org/10.1111/j.1467-9701.2007.01006.x
Ceglowski, J., & Golub, S. (2012). Does China still have a labor cost advantage? Global Economy Journal, 12(3),https://doi.org/10.1515/1524-5861.1874.
Cox, W. M., & Koo, J. (2003) China: Awakening giant. Southwest Economy, 5, September/October, Federal ReserveBank of Dallas.
De Grauwe, P., Houssa, R., & Piccillo, G. (2012). African trade dynamics: Is China a different trading partner?Journal of Chinese Economic and Business Studies, 10(1), 15–45. https://doi.org/10.1080/14765284.2012.638460
Dinh, H. T., Palmade, V., Chandra, V., & Cossar, F. (2012). Light manufacturing in Africa: Targeted policies toenhance private investment and jobs. Washington, DC: World Bank. https://doi.org/10.1596/978-0-8213-8961-4
18 | GOLUB ET AL.

Edwards, L., & Golub, S. (2004). South Africa’s international cost competitiveness and exports in manufacturing.World Development, 32(8), 1323–1339. https://doi.org/10.1016/j.worlddev.2004.03.005
Eifert, B., Gelb, A., & Ramachandran, V. (2008). The cost of doing business in Africa: Evidence from the invest-ment climate data. World Development, 36(9), 1531–1546. https://doi.org/10.1016/j.worlddev.2007.09.007
Eisenman, J. (2012). China–Africa Trade patterns: Causes and consequences. Journal of Contemporary China, 21(77), 793–810. https://doi.org/10.1080/10670564.2012.684964
Ferguson, D. G. (1978). International capital mobility and comparative advantage: The two-country two-factor case.Journal of International Economics, 8(3), 373–396. https://doi.org/10.1016/0022-1996(78)90002-8
Gelb, A., Meyer, C. J., & Ramachandran, V. (2013). Does poor mean cheap? A Comparative look at Africa’s indus-trial labor costs (Center for Global Development Working Paper No. 325). Retrieved from cgdev website:https://www.cgdev.org/publication/does-poor-mean-cheap-comparative-look-africas-industrial-labor-costs.
Giovannetti, G., & Sanfilippo, M. (2009). Do Chinese exports crowd-out African goods? An econometric analysisby country and sector. European Journal of Development Research, 21(4), 506–530. https://doi.org/10.1057/ejdr.2009.20
Golub, S. S. (2012). Entrepot trade and smuggling in West Africa: Benin, Togo and Nigeria. The World Economy,35(9), 1139–1161. https://doi.org/10.1111/j.1467-9701.2012.01469.x
Golub, S. S., & Hayat, F. (2015). Employment, unemployment and underemployment in Africa. In C. Monga, & J.Lin (Eds.), Oxford handbook of Africa and Economics (pp. 136–153). New York, NY: Oxford University Press.
Golub, S. S., & Hsieh, C.-T. (2000). The classical theory of comparative advantage revisited. Review of Interna-tional Economics, 8(2), 221–234. https://doi.org/10.1111/1467-9396.00217
Golub, S. S., Jones, R. W., & Kierzkowski, H. (2007). Globalization and country-specific services links. Journal ofEconomic Policy Reform, 10, 63–88. https://doi.org/10.1080/17487870701272827
Golub, S. S., & McManus, J. (2009). Horticulture exports and African development, report prepared for UNCTAD.Golub, S. S., O’Connell, S. A., & Du, W. (2008). Export competitiveness and development in LDCs: Policies,
issues, and priorities for least developed countries. Geneva: UNCTAD.Haugen, H. Ø. (2011). Chinese exports to Africa: Competition, complementarity and cooperation between micro-
level actors. Forum for Development Studies, 38(2), 157–176. https://doi.org/10.1080/08039410.2011.572286Hinkle, L. E., & Nsengiyumba, F. (1999). External real exchange rates: Purchasing power parity, the Mundell Flem-
ing Model, and competitiveness in traded goods. In L. E. Hinkle, & P. J. Montiel (Eds.), Exchange ratemisalignment: Concepts and measurement (pp. 41–104). Washington, DC: Oxford University Press.
Jacobs, B. (2012). A Dragon and a Dove? A comparative overview of Chinese and European trade relations withSub-Saharan Africa. Journal of Current Chinese Affairs, 40(4), 17–60.
Jenkins, R., & Edwards, C. (2006). The economic impacts of China and India on Sub-Saharan Africa: Trends andprospects. Journal of Asian Economics, 17(2), 207–225. https://doi.org/10.1016/j.asieco.2006.02.002
Jones, C. I. (2016). The facts of economic growth. In J. B. Taylor, & H. Uhlig (Eds.), Handbook of macroecon-omics, Vol. 2 (pp. 3–69). Amsterdam, the Netherlands: Elsevier.
Kaplinsky, R., McCormick, D., & Morris, M. (2007). The impact of China on sub-Saharan Africa (Working paper291). Brighton: IDS. Retrieved from http://opendocs.ids.ac.uk/opendocs/handle/123456789/4142
Li, H. (2005). The Chinese path of economic reform and its implications. Asian Affairs: An American Review, 31(4), 195–211. https://doi.org/10.3200/AAFS.31.4.195-211
Lyons, M., & Brown, A. (2010). Has mercantilism reduced urban poverty in SSA? Perceptions of Boom, Bust, andthe China-Africa Trade in Lom�e and Bamako. World Development, 38(5), 771–782. https://doi.org/10.1016/j.worlddev.2009.11.009
van Marrewijk, C., & Hu, S. (2013). An empirical analysis of the China-Africa Trade Puzzle: The role of China’strade policies (SAIS Working Papers in African Studies). Washington D.C. Retrieved from http://www.etsg.org/ETSG2013/Papers/234.pdf.
Maswana, J. C. (2011). Emerging patterns in Sino-African Trade and potentials for enterprise development. China-OECD/DAC Study Group, Conference at Addis Ababa.
Mbaye, A. A., & Golub, S. (2003). Unit labor costs, international competitiveness, and exports: The case of Senegal.Journal of African Economies, 2, 219–248.
Mbaye, A. A., & Gueye, A. (2014). SPS standards and international competitiveness in Africa: The case of Senegal.In M. Jansen, M. S. Jallab, & M. Smeets (Eds.), Connecting to global markets (pp. 73–85). Geneva, Switzerland:World Trade Organization.
GOLUB ET AL. | 19

Pigato, M., & Tang, W. (2015). China and Africa: Expanding economic ties in an evolving global context. WorldBank. Retrieved from World Bank website: http://documents.worldbank.org/curated/en/241321468024314010/pdf/95161-REPLACEMENT-FILE-PUBLIC-China-FDI-Africa-conference-Final-1-May-2015-Final.pdf
Sautman, B., & Hairong, Y. (2007). Friends and interests: China’s distinctive links with Africa. African StudiesReview, 50(3), 75–114. https://doi.org/10.1353/arw.2008.0014
Shen, X. (2015). Private Chinese investment in Africa: Myths and realities. Development Policy Review, 33(1), 83–106. https://doi.org/10.1111/dpr.12093
Szirmai, A., Ren, R., & Bai, M. (2005). Chinese manufacturing performance in comparative perspective, 1980–2002 (Economic Growth Center Discussion Paper No. 920) Yale University. Retrieved from https://papers.ssrn.com/sol3/papers.cfm?abstract_id=770948.
Tull, D. M. (2006). China’s engagement in Africa: Scope, significance and consequences. The Journal of ModernAfrican Studies, 44(03), 459–479. https://doi.org/10.1017/S0022278X06001856
Turner, A. G., & Golub, S. S. (1997). Towards a system of unit labor cost-based competitiveness indicators foradvanced, developing and transition countries. In International Monetary Fund, Staff studies for the world econ-omic outlook (pp. 47–60). Washington, DC: IMF.
Turner, P., & Van’t Dack, J. (1993). Measuring international price and cost competitiveness (Bank for InternationalSettlements Economic Paper No. 39, November). Retrieved from https://www.bis.org/publ/econ39.htm.
Wang, J. Y. (2007). What drives China’s growing role in Africa? (IMF working Paper 7-211, October). Retrievedfrom IMF website: http://www.imf.org/en/Publications/WP/Issues/2016/12/31/What-Drives-Chinas-Growing-Role-in-Africa-21282
Zafar, A. (2007). The growing relationship between China and Sub-Saharan Africa: Macroeconomic, trade, invest-ment, and aid links. The World Bank Research Observer, 22(1), 103–130. https://doi.org/10.1093/wbro/lkm001
How to cite this article: Golub SS, Ceglowski J, Mbaye AA, Prasad V. Can Africacompete with China in manufacturing? The role of relative unit labour costs. World Econ.2017;00:1–21. https://doi.org/10.1111/twec.12603
APPENDIX
DEFINITION OF PRODUCT GROUPS
Group Constituents SITC codes
Primary products Food, beverages, minerals, crude oil,animal and vegetable oils
0, 1, 2, 32, 333, 34, 35, 4
Natural resourceintensive
Leather manufactures, lime, cement, clay,mineral manufactures, precious stones,pig iron, non-ferrous metals
61, 63, 661, 662, 663,667, 671, 68
Human capitalintensive
Dyeing materials, essential oils, rubbermanufactures, steel ingots,telecommunications equipment, photographicapparatus, watches
53, 55, 62, 672, 673, 674,675, 676.677, 678, 679,69, 761, 762, 73, 885,894, 895, 896, 897, 898, 899
(Continues)
20 | GOLUB ET AL.

APPENDIX (Continued)
Group Constituents SITC codes
Unskilled labourintensive
Textile yarn, glass, prefabricated buildings,plumbing, heating, furniture, travel goods,apparel, footwear
65, 664, 665, 666, 81, 82,83, 84, 85, 894, 895
Technologyintensive
Organic and inorganic chemicals,fertilisers, plastics
51, 52, 54, 56, 57, 58, 59, 71, 72, 73,7475, 764, 77, 792, 87, 881, 882, 883,884, 892, 893
GOLUB ET AL. | 21