can a social cash transfer program improve youth mental health in kenya?
TRANSCRIPT

Can a social cash transfer
program improve youth
mental health in Kenya?
Population Association of America Annual Meeting
May 30, 2015
Contact:
Kelly Kilburn

Kelly Kilburn, MA
Carolyn Halpern, PhD
Audrey Pettifor, PhD
Harsha Thirumurthy, PhD
Sudhanshu Handa, PhD
Funded by National Institutes for Health

Youth Mental Health in Low-
Income Countries
• Can interventions
help break the
cycle of poverty
and poor mental
health?
– social causation
pathway
– social drift pathway
Poverty
Social
Causation
Social Drift
Poor Mental
Health
Source: Lund et al. (2011) Poverty and mental disorders: Breaking the cycle in low-income and middle-income countries.
Lancet 378:1502-1514.
Is there a cycle between poverty and mental
health?
Cash Transfers and Mental Health
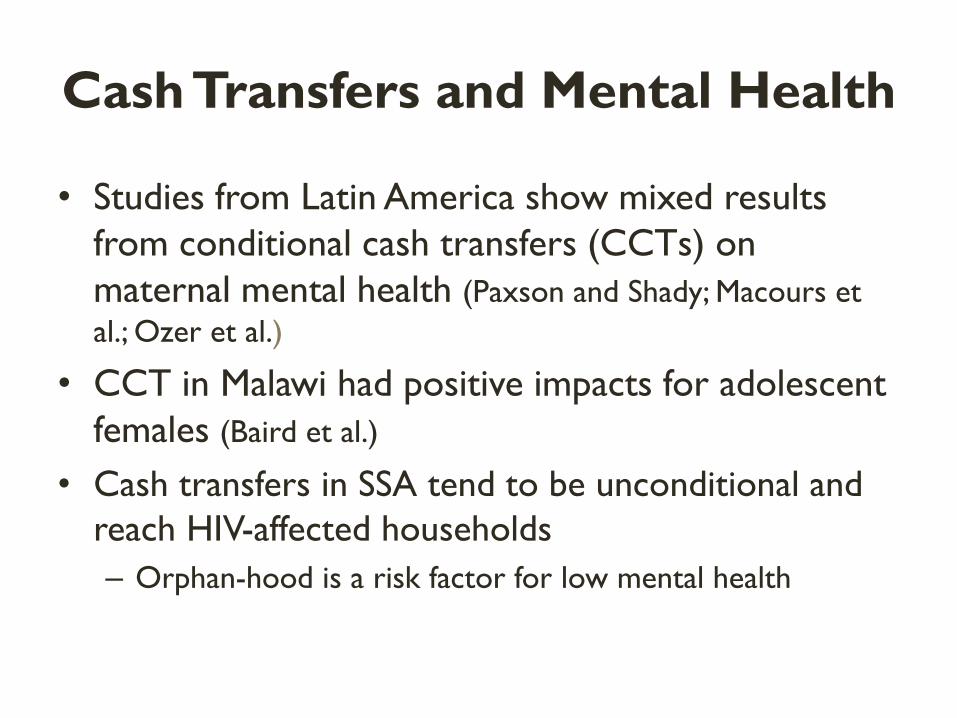
• Studies from Latin America show mixed results
from conditional cash transfers (CCTs) on
maternal mental health (Paxson and Shady; Macours et
al.; Ozer et al.)
• CCT in Malawi had positive impacts for adolescent
females (Baird et al.)
• Cash transfers in SSA tend to be unconditional and
reach HIV-affected households
– Orphan-hood is a risk factor for low mental health

Kenya Cash Transfer for Orphans and
Vulnerable Children (CT-OVC)
• Unconditional, national social protection program
– Reached 135,000 households and 270,000 OVC
across the country as of 2012.
• Targets households who are ultra-poor and contain an
OVC age 0-17 years
• Two-stage target identification process
– No self-selection, universal take-up
• Eligible households receive a flat monthly transfer of
$20 USD

• Random assignment of
eligible locations in
seven districts
• In each district, 2
locations randomized
to Control, 2 to
Treatment
• 3 rounds of data: 2007,
2009, 2011
Study Design
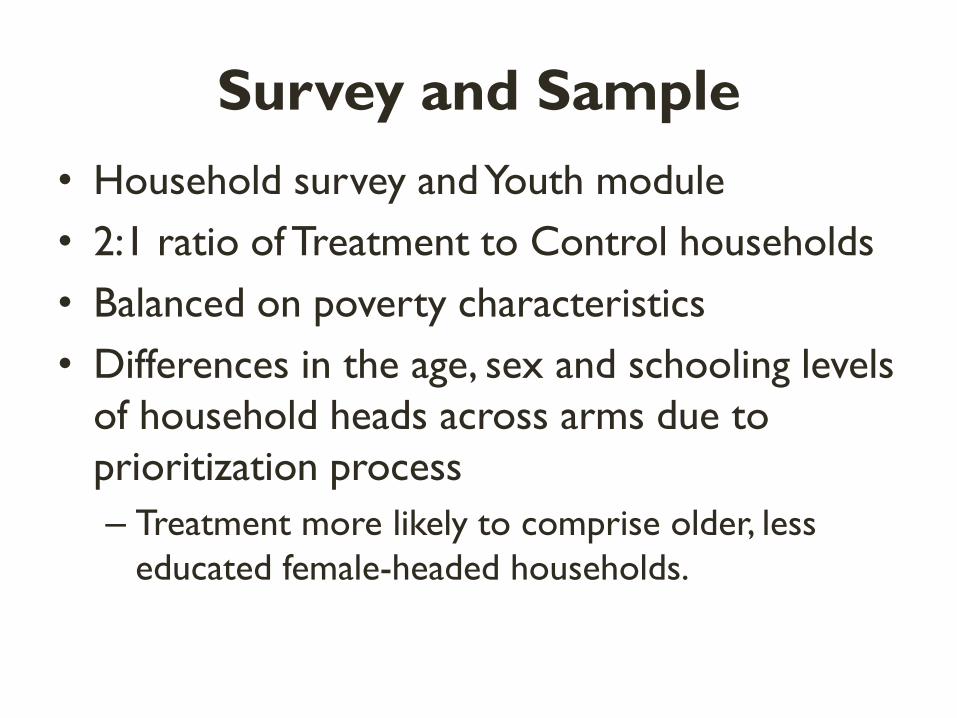
Survey and Sample
• Household survey and Youth module
• 2:1 ratio of Treatment to Control households
• Balanced on poverty characteristics
• Differences in the age, sex and schooling levels
of household heads across arms due to
prioritization process
– Treatment more likely to comprise older, less
educated female-headed households.

The youth sample
• Individual interviews for up to two residents
between 15-25 years of age
2,215 out of 2,806 interviewed (79%)
• Restricted the sample of analysis to 15-24 year
olds and those who had been in the
household for a year or more

Total Intervention Control
Demographics
Age 18.4 18.4 18.6
Male 0.620 0.60 0.61
Orphan 0.54 0.56 0.49
Child of Head 0.49 0.55 0.47
Grandchild of head 0.30 0.34 0.20
Female head 0.62 0.63 0.60
Age of Head in years 60.4 62.0 56.9
Head any education 0.54 0.53 0.58
Nairobi residence 0.12 0.14 0.07
Observations 2006 1408 598
Characteristics of young people age 15-24 in
wave 3 (2011) sample
Significant differences bolded

Psychosocial and Health Outcomes
Total Intervention Control
CES-D ≥ 10 0.33 0.32 0.37
CES-D ≥ 10 women (N=689)0.34 0.34 0.33
CES-D ≥ 10 men (N=1129)0.34 0.31 0.40
HOPE 0.54 0.56 0.50
No illness/injury past 4 weeks0.73 0.72 0.74
Healthier than year ago 0.50 0.49 0.43
Observations 2006 1408 598
CES-D ≥10 binary indicator for scoring a 10 or above on the CES-D depression scale.
HOPE a binary indicator for scoring at above the median on the Hope scale.
Significant differences bolded


Additional Analysis
• Orphan Status
• Mediation of schooling and labor

Conclusions and Next Steps
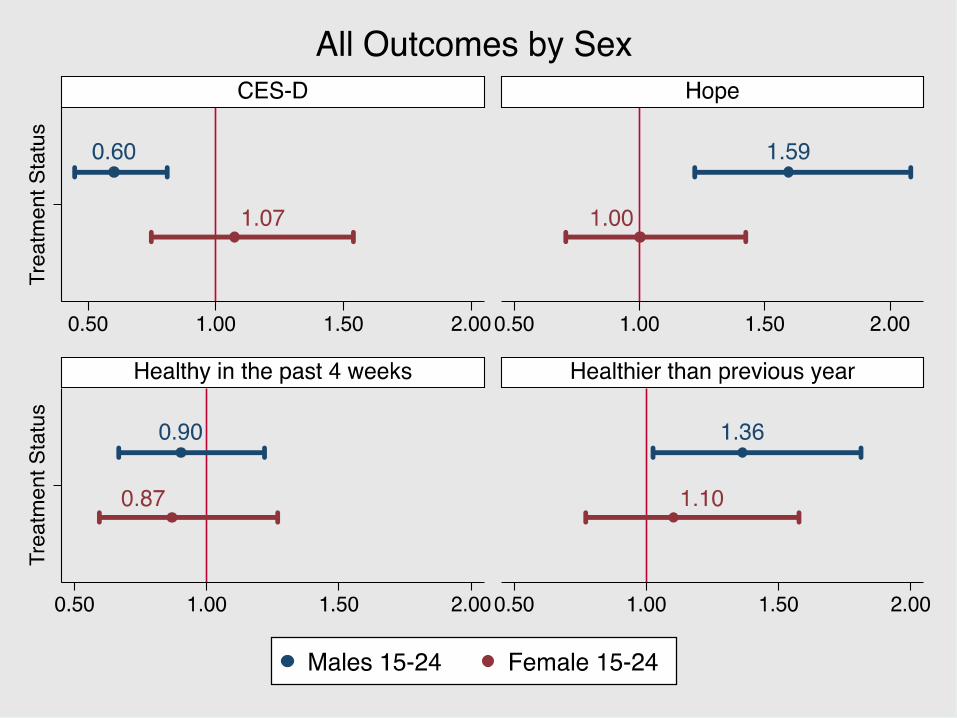
• CT-OVC confers protective mental health effects for young men and orphans; no protective effect for females.
– Differential effect based on age
• The causal pathway is unclear although the SCT is helping to keep youth in school
• Suggests interventions addressing the social causation pathway may improve mental health impacts for young people
• Evaluate panel data other national cash transfer programs—Malawi, Zimbabwe, Zambia

Balance and test of randomization
2007 2009 2011
Demographics T C T C T C
Household size 5.48 5.79 5.54 5.81 5.53 5.82
Female head 0.65 0.57 0.65 0.59 0.65 0.59
Age of head in years 62.34 56.06 62.21 56.20 62.55 56.55
Head not completed primary 0.53 0.38 0.53 0.38 0.53 0.38
Poverty
Per adult equiv. monthly exp. (Ks) 1533.3 1501.3 1541.8 1459.9 1550.1 1442.0
Walls of mud/dung/grass/sticks 0.75 0.84 0.75 0.86 0.74 0.87
Roof of mud/dung/grass/sticks 0.23 0.22 0.23 0.23 0.22 0.22
Floor of mud/dung 0.66 0.74 0.65 0.77 0.66 0.79
No toilet 0.55 0.56 0.55 0.56 0.54 0.56
Unprotected water source 0.62 0.68 0.61 0.70 0.61 0.70