campus space, facilities, and services - homepage - cmu › ira › factbook › pdf › facts2009...
TRANSCRIPT
Campus Space,Facilities, and Services
Table of Contents
Campus Space, Facilities, and Services Introduction 7.1
Computing Services 7.3 Facilities Operations 7.4 Campus Recycling 7.5 Distribution of Students by Housing Type, Level, and Gender 7.6 Housing Capacity 7.7 Total Space in Square Footage by Major Division, College/Division, and Use Category 7.8 Net Assignable Space by Major Use and Division 7.9 Total Space in Square Footage by Major Division and College/Division by Use Category, University Owned 7.10 by Use Category, Leased Space 7.11 by A21 Utilization 7.12 by A21 Utilization, Owned Space 7.14 by A21 Utilization, Leased Space 7.16 by Building 7.18 University Police, Clery Act Report 7.21 Parking Capacity 7.22 Permit Parking Capacity by Lot 7.22 Permit Assignments by Relationship 7.22 Campus Map 7.24
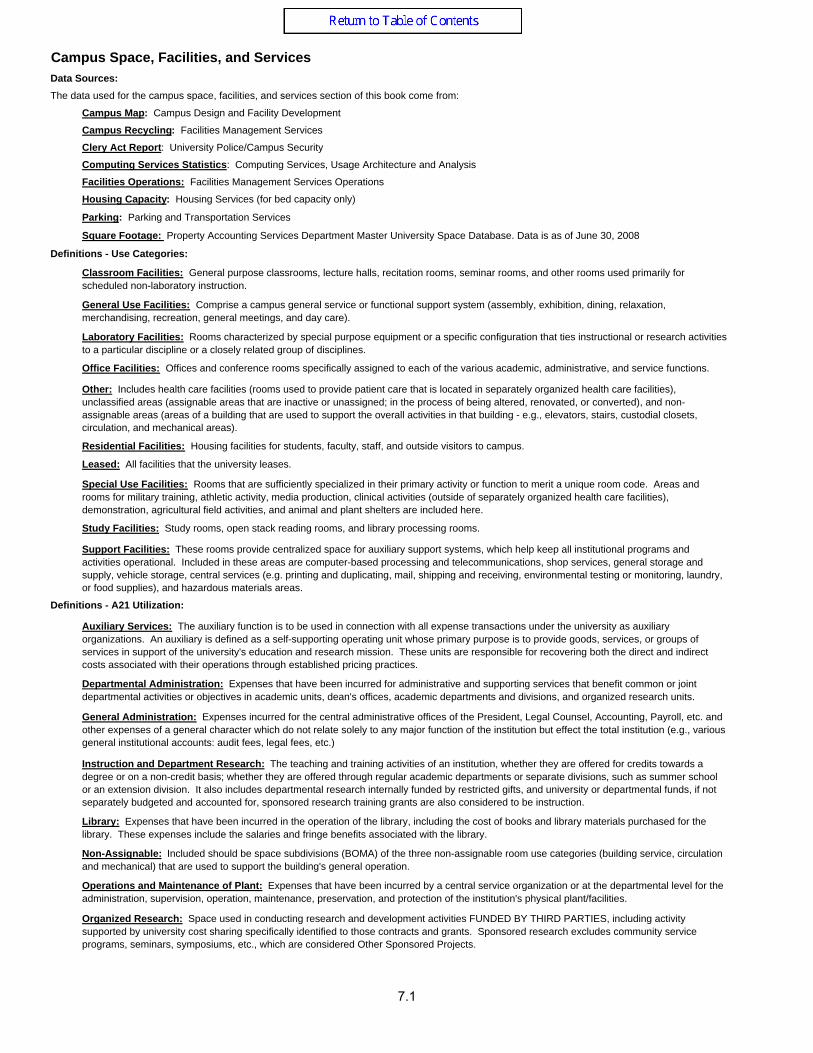
Campus Space, Facilities, and ServicesData Sources:The data used for the campus space, facilities, and services section of this book come from:
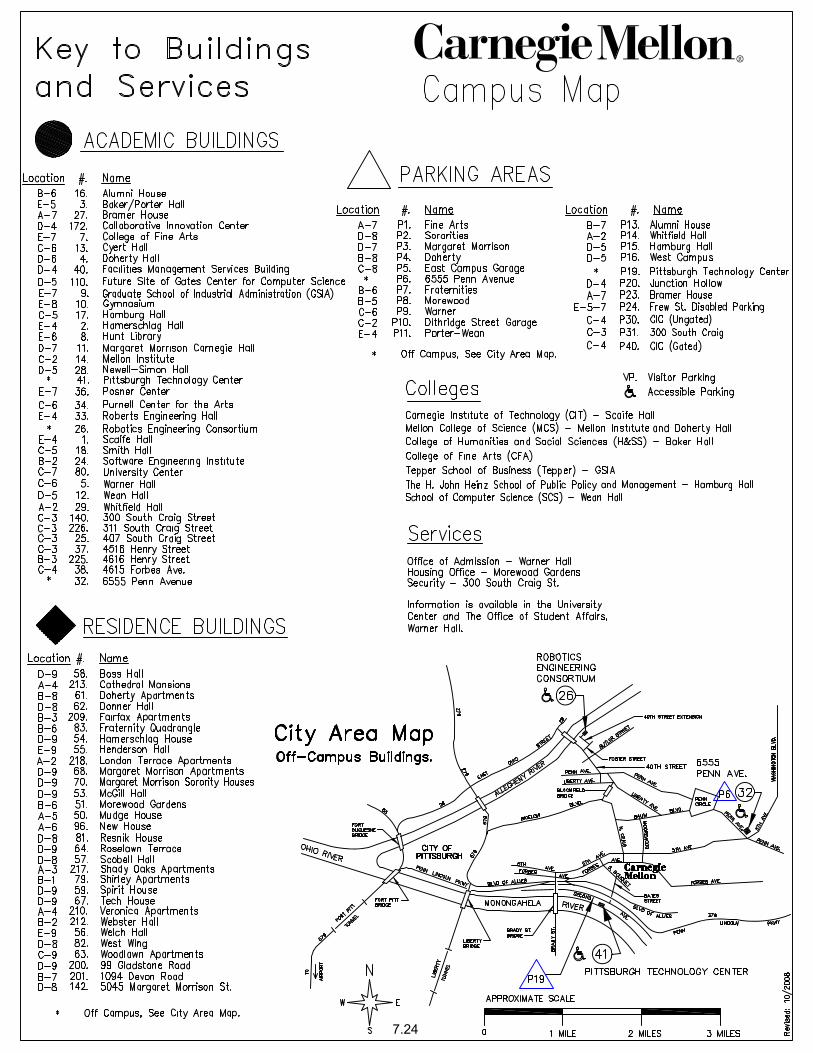
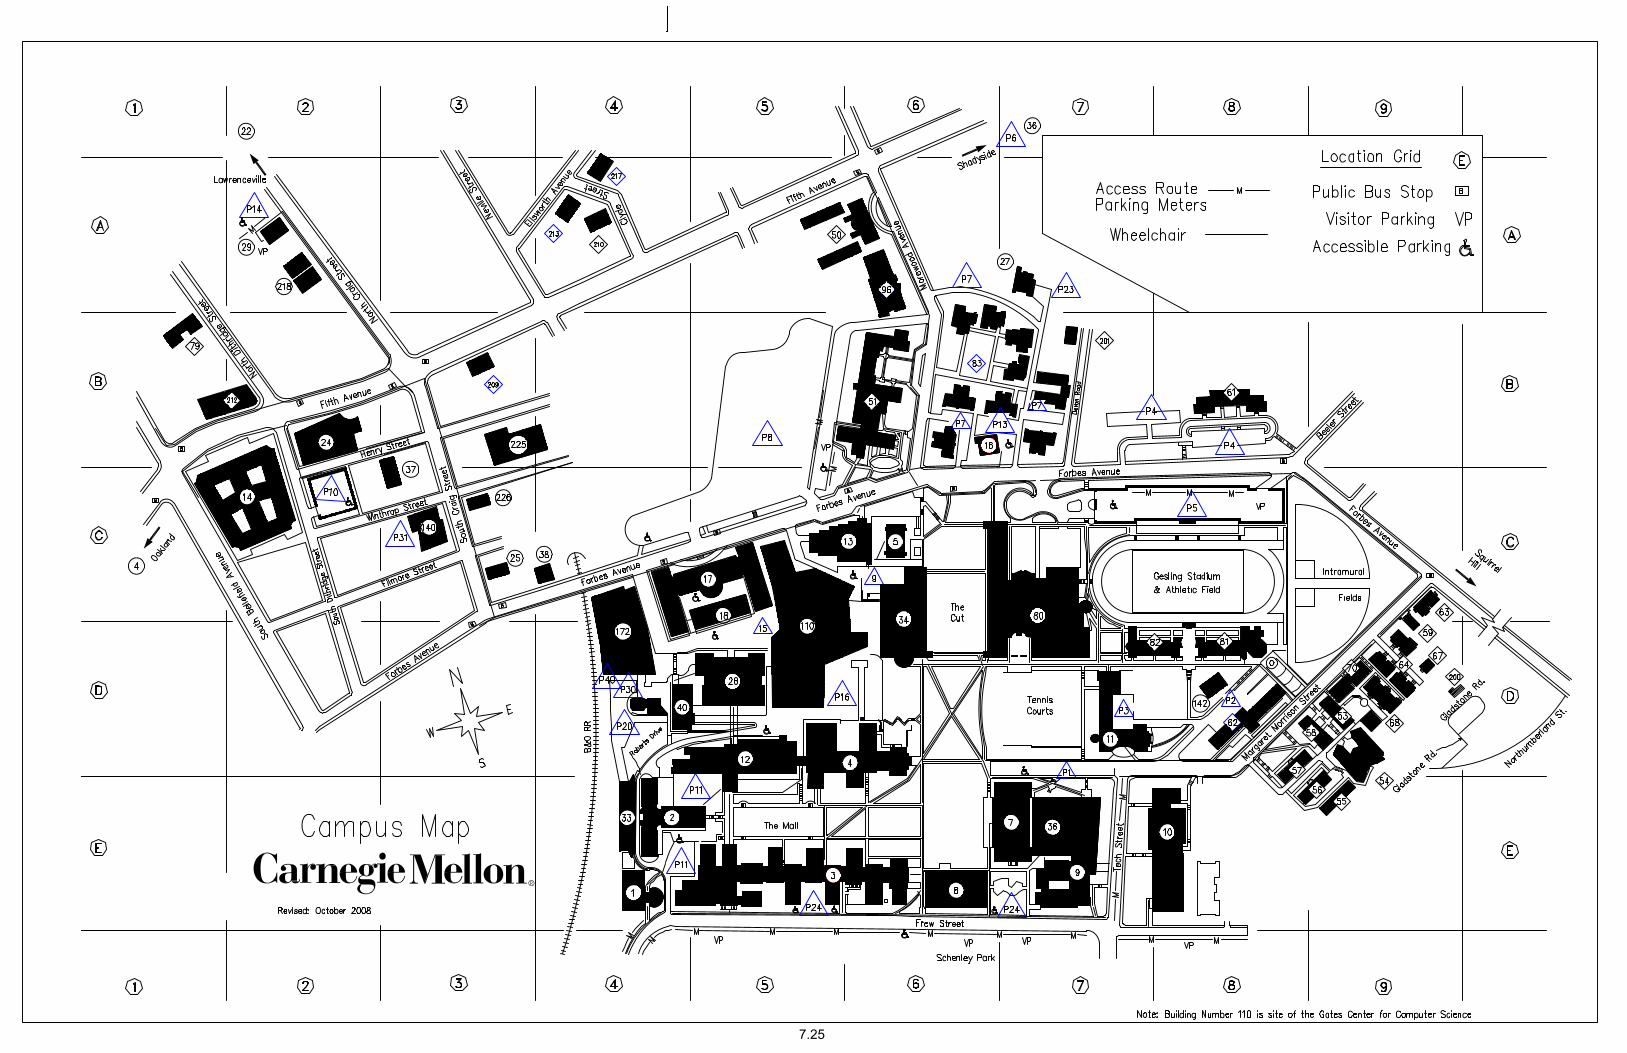
Campus Map: Campus Design and Facility Development
Campus Recycling: Facilities Management Services
Clery Act Report: University Police/Campus Security
Computing Services Statistics: Computing Services, Usage Architecture and Analysis
Facilities Operations: Facilities Management Services Operations
Housing Capacity: Housing Services (for bed capacity only)
Parking: Parking and Transportation Services
Square Footage: Property Accounting Services Department Master University Space Database. Data is as of June 30, 2008
Definitions - Use Categories:
Classroom Facilities: General purpose classrooms, lecture halls, recitation rooms, seminar rooms, and other rooms used primarily for scheduled non-laboratory instruction.
General Use Facilities: Comprise a campus general service or functional support system (assembly, exhibition, dining, relaxation, merchandising, recreation, general meetings, and day care).
Laboratory Facilities: Rooms characterized by special purpose equipment or a specific configuration that ties instructional or research activities to a particular discipline or a closely related group of disciplines.
Office Facilities: Offices and conference rooms specifically assigned to each of the various academic, administrative, and service functions.
Other: Includes health care facilities (rooms used to provide patient care that is located in separately organized health care facilities), unclassified areas (assignable areas that are inactive or unassigned; in the process of being altered, renovated, or converted), and non-assignable areas (areas of a building that are used to support the overall activities in that building - e.g., elevators, stairs, custodial closets, circulation, and mechanical areas).
Residential Facilities: Housing facilities for students, faculty, staff, and outside visitors to campus.
Leased: All facilities that the university leases.
Special Use Facilities: Rooms that are sufficiently specialized in their primary activity or function to merit a unique room code. Areas and rooms for military training, athletic activity, media production, clinical activities (outside of separately organized health care facilities), demonstration, agricultural field activities, and animal and plant shelters are included here.
Study Facilities: Study rooms, open stack reading rooms, and library processing rooms.
Support Facilities: These rooms provide centralized space for auxiliary support systems, which help keep all institutional programs and activities operational. Included in these areas are computer-based processing and telecommunications, shop services, general storage and supply, vehicle storage, central services (e.g. printing and duplicating, mail, shipping and receiving, environmental testing or monitoring, laundry, or food supplies), and hazardous materials areas.
Definitions - A21 Utilization:
Auxiliary Services: The auxiliary function is to be used in connection with all expense transactions under the university as auxiliary organizations. An auxiliary is defined as a self-supporting operating unit whose primary purpose is to provide goods, services, or groups of services in support of the university's education and research mission. These units are responsible for recovering both the direct and indirect costs associated with their operations through established pricing practices.
Departmental Administration: Expenses that have been incurred for administrative and supporting services that benefit common or joint departmental activities or objectives in academic units, dean's offices, academic departments and divisions, and organized research units.
General Administration: Expenses incurred for the central administrative offices of the President, Legal Counsel, Accounting, Payroll, etc. and other expenses of a general character which do not relate solely to any major function of the institution but effect the total institution (e.g., various general institutional accounts: audit fees, legal fees, etc.)
Instruction and Department Research: The teaching and training activities of an institution, whether they are offered for credits towards a degree or on a non-credit basis; whether they are offered through regular academic departments or separate divisions, such as summer school or an extension division. It also includes departmental research internally funded by restricted gifts, and university or departmental funds, if not separately budgeted and accounted for, sponsored research training grants are also considered to be instruction.
Library: Expenses that have been incurred in the operation of the library, including the cost of books and library materials purchased for the library. These expenses include the salaries and fringe benefits associated with the library.
Non-Assignable: Included should be space subdivisions (BOMA) of the three non-assignable room use categories (building service, circulation and mechanical) that are used to support the building's general operation.
Operations and Maintenance of Plant: Expenses that have been incurred by a central service organization or at the departmental level for the administration, supervision, operation, maintenance, preservation, and protection of the institution's physical plant/facilities.
Organized Research: Space used in conducting research and development activities FUNDED BY THIRD PARTIES, including activity supported by university cost sharing specifically identified to those contracts and grants. Sponsored research excludes community service programs, seminars, symposiums, etc., which are considered Other Sponsored Projects.
7.1
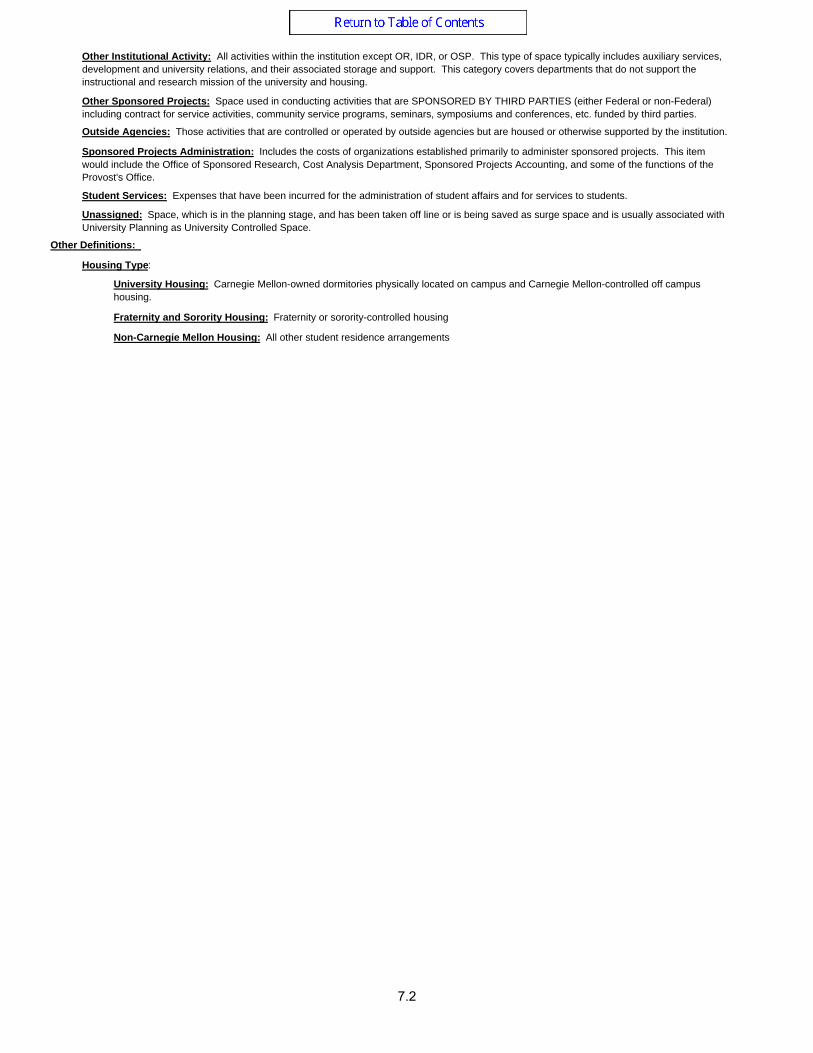
Other Institutional Activity: All activities within the institution except OR, IDR, or OSP. This type of space typically includes auxiliary services, development and university relations, and their associated storage and support. This category covers departments that do not support the instructional and research mission of the university and housing.
Other Sponsored Projects: Space used in conducting activities that are SPONSORED BY THIRD PARTIES (either Federal or non-Federal) including contract for service activities, community service programs, seminars, symposiums and conferences, etc. funded by third parties.
Outside Agencies: Those activities that are controlled or operated by outside agencies but are housed or otherwise supported by the institution.
Sponsored Projects Administration: Includes the costs of organizations established primarily to administer sponsored projects. This item would include the Office of Sponsored Research, Cost Analysis Department, Sponsored Projects Accounting, and some of the functions of the Provost's Office.
Student Services: Expenses that have been incurred for the administration of student affairs and for services to students.
Unassigned: Space, which is in the planning stage, and has been taken off line or is being saved as surge space and is usually associated with University Planning as University Controlled Space.
Other Definitions:
Housing Type:
University Housing: Carnegie Mellon-owned dormitories physically located on campus and Carnegie Mellon-controlled off campus housing.
Fraternity and Sorority Housing: Fraternity or sorority-controlled housing
Non-Carnegie Mellon Housing: All other student residence arrangements
7.2
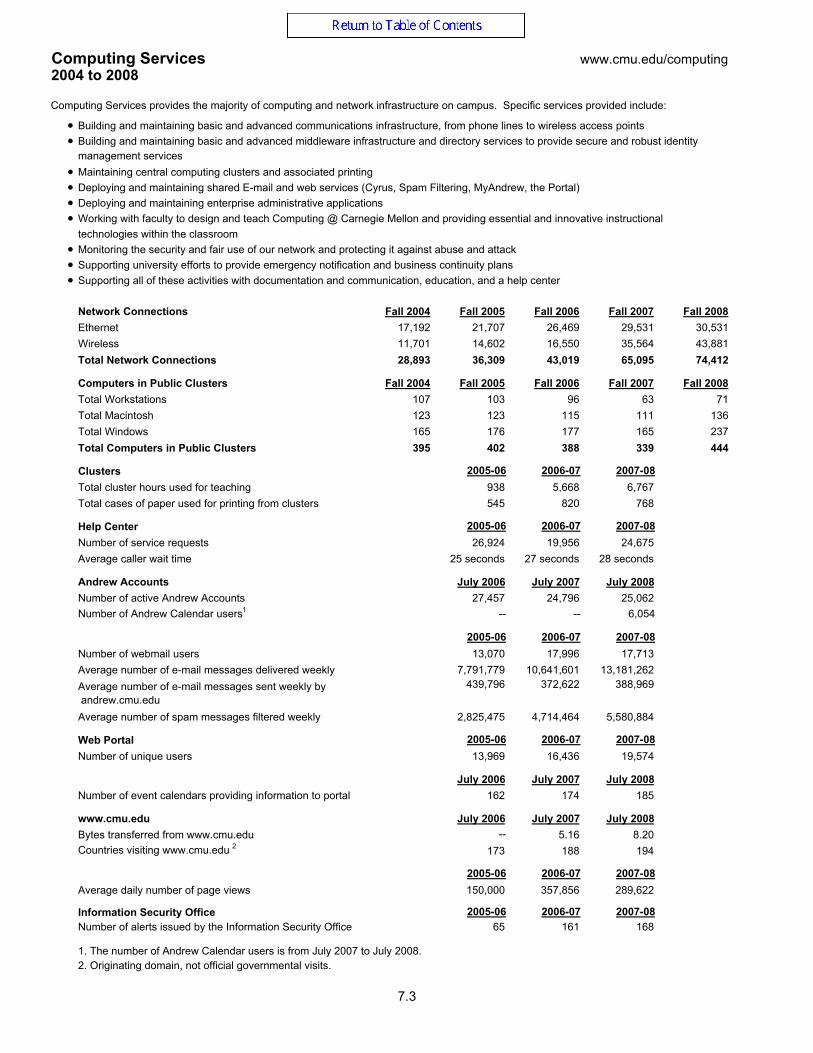
Computing Services2004 to 2008
Computing Services provides the majority of computing and network infrastructure on campus. Specific services provided include:
●●
management services●●●●
●●●
Network Connections Fall 2004 Fall 2005 Fall 2006 Fall 2007 Fall 2008Ethernet 17,192 21,707 26,469 29,531 30,531Wireless 11,701 14,602 16,550 35,564 43,881Total Network Connections 28,893 36,309 43,019 65,095 74,412
Computers in Public Clusters Fall 2004 Fall 2005 Fall 2006 Fall 2007 Fall 2008Total Workstations 107 103 96 63 71Total Macintosh 123 123 115 111 136Total Windows 165 176 177 165 237Total Computers in Public Clusters 395 402 388 339 444
Clusters 2005-06 2006-07 2007-08Total cluster hours used for teaching 938 5,668 6,767Total cases of paper used for printing from clusters 545 820 768
Help Center 2005-06 2006-07 2007-08Number of service requests 26,924 19,956 24,675Average caller wait time 25 seconds 27 seconds 28 seconds
Andrew Accounts July 2006 July 2007 July 2008Number of active Andrew Accounts 27,457 24,796 25,062Number of Andrew Calendar users1 -- -- 6,054
2005-06 2006-07 2007-08Number of webmail users 13,070 17,996 17,713Average number of e-mail messages delivered weekly 7,791,779 10,641,601 13,181,262Average number of e-mail messages sent weekly by andrew.cmu.edu
439,796 372,622 388,969
Average number of spam messages filtered weekly 2,825,475 4,714,464 5,580,884
Web Portal 2005-06 2006-07 2007-08Number of unique users 13,969 16,436 19,574
July 2006 July 2007 July 2008Number of event calendars providing information to portal 162 174 185
www.cmu.edu July 2006 July 2007 July 2008Bytes transferred from www.cmu.edu -- 5.16 8.20Countries visiting www.cmu.edu 2 173 188 194
2005-06 2006-07 2007-08Average daily number of page views 150,000 357,856 289,622
Information Security Office 2005-06 2006-07 2007-0865 161 168
1. The number of Andrew Calendar users is from July 2007 to July 2008.2. Originating domain, not official governmental visits.
Deploying and maintaining enterprise administrative applications
Monitoring the security and fair use of our network and protecting it against abuse and attack
Working with faculty to design and teach Computing @ Carnegie Mellon and providing essential and innovative instructional technologies within the classroom
Number of alerts issued by the Information Security Office
www.cmu.edu/computing
Building and maintaining basic and advanced communications infrastructure, from phone lines to wireless access points
Maintaining central computing clusters and associated printingDeploying and maintaining shared E-mail and web services (Cyrus, Spam Filtering, MyAndrew, the Portal)
Building and maintaining basic and advanced middleware infrastructure and directory services to provide secure and robust identity
Supporting all of these activities with documentation and communication, education, and a help centerSupporting university efforts to provide emergency notification and business continuity plans
7.3
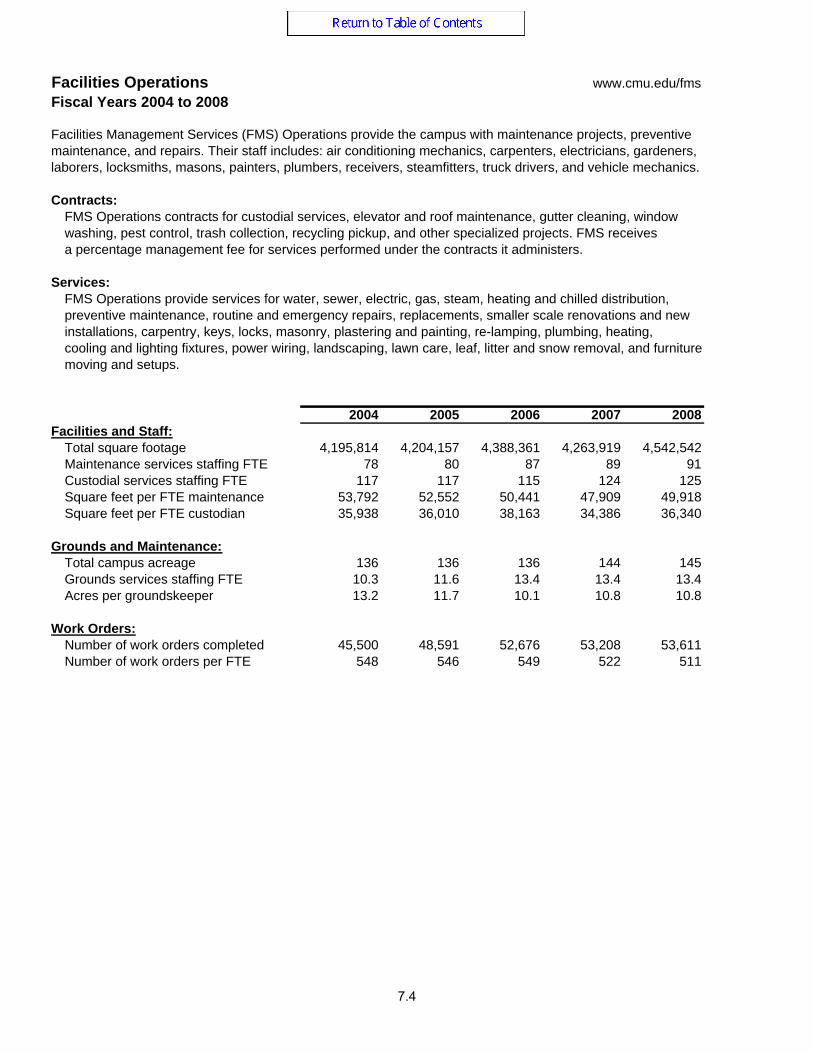
Facilities OperationsFiscal Years 2004 to 2008
Facilities Management Services (FMS) Operations provide the campus with maintenance projects, preventivemaintenance, and repairs. Their staff includes: air conditioning mechanics, carpenters, electricians, gardeners,laborers, locksmiths, masons, painters, plumbers, receivers, steamfitters, truck drivers, and vehicle mechanics.
Contracts:FMS Operations contracts for custodial services, elevator and roof maintenance, gutter cleaning, windowwashing, pest control, trash collection, recycling pickup, and other specialized projects. FMS receivesa percentage management fee for services performed under the contracts it administers.
Services:FMS Operations provide services for water, sewer, electric, gas, steam, heating and chilled distribution, preventive maintenance, routine and emergency repairs, replacements, smaller scale renovations and new installations, carpentry, keys, locks, masonry, plastering and painting, re-lamping, plumbing, heating, cooling and lighting fixtures, power wiring, landscaping, lawn care, leaf, litter and snow removal, and furniture
2004 2005 2006 2007 2008Facilities and Staff:
Total square footage 4,195,814 4,204,157 4,388,361 4,263,919 4,542,542Maintenance services staffing FTE 78 80 87 89 91Custodial services staffing FTE 117 117 115 124 125Square feet per FTE maintenance 53,792 52,552 50,441 47,909 49,918Square feet per FTE custodian 35,938 36,010 38,163 34,386 36,340
Grounds and Maintenance:Total campus acreage 136 136 136 144 145Grounds services staffing FTE 10.3 11.6 13.4 13.4 13.4Acres per groundskeeper 13.2 11.7 10.1 10.8 10.8
Work Orders:Number of work orders completed 45,500 48,591 52,676 53,208 53,611Number of work orders per FTE 548 546 549 522 511
moving and setups.
www.cmu.edu/fms
7.4
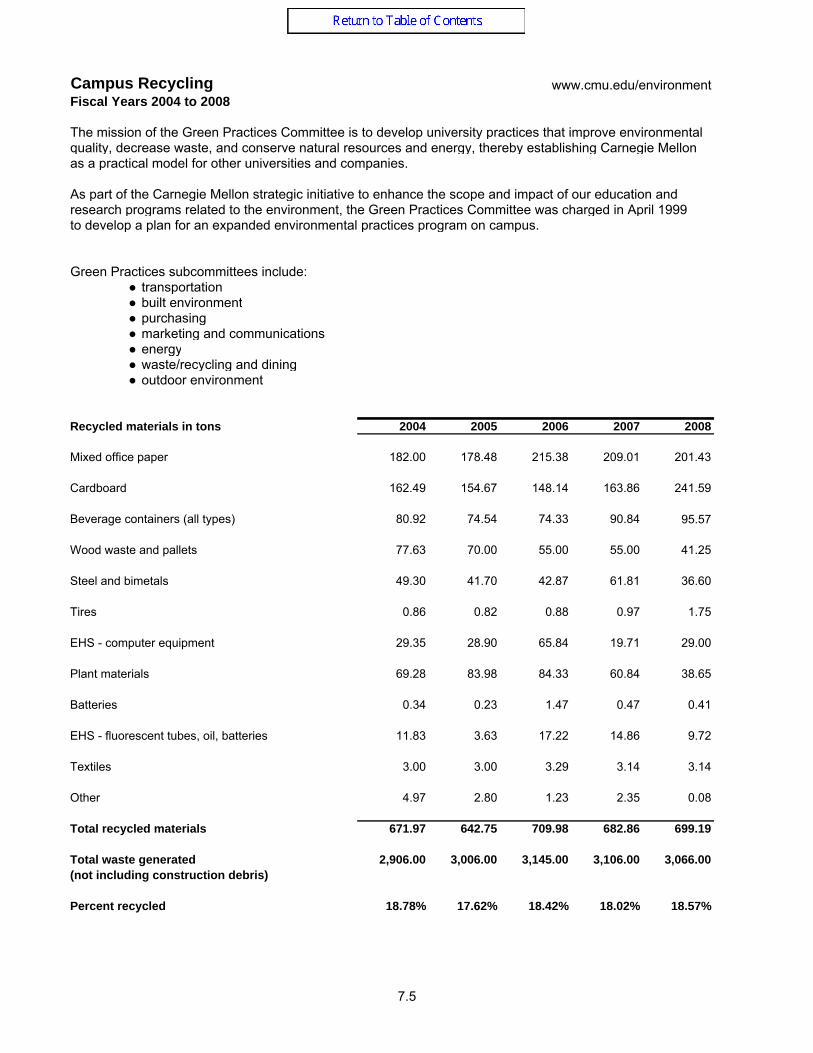
Campus Recycling www.cmu.edu/environmentFiscal Years 2004 to 2008
The mission of the Green Practices Committee is to develop university practices that improve environmentalquality, decrease waste, and conserve natural resources and energy, thereby establishing Carnegie Mellon as a practical model for other universities and companies.
As part of the Carnegie Mellon strategic initiative to enhance the scope and impact of our education andresearch programs related to the environment, the Green Practices Committee was charged in April 1999to develop a plan for an expanded environmental practices program on campus.
Green Practices subcommittees include:● transportation● built environment● purchasing● marketing and communications● energy● waste/recycling and dining● outdoor environment
Recycled materials in tons 2004 2005 2006 2007 2008
Mixed office paper 182.00 178.48 215.38 209.01 201.43
Cardboard 162.49 154.67 148.14 163.86 241.59
Beverage containers (all types) 80.92 74.54 74.33 90.84 95.57
Wood waste and pallets 77.63 70.00 55.00 55.00 41.25
Steel and bimetals 49.30 41.70 42.87 61.81 36.60
Tires 0.86 0.82 0.88 0.97 1.75
EHS - computer equipment 29.35 28.90 65.84 19.71 29.00
Plant materials 69.28 83.98 84.33 60.84 38.65
Batteries 0.34 0.23 1.47 0.47 0.41
EHS - fluorescent tubes, oil, batteries 11.83 3.63 17.22 14.86 9.72
Textiles 3.00 3.00 3.29 3.14 3.14
Other 4.97 2.80 1.23 2.35 0.08
Total recycled materials 671.97 642.75 709.98 682.86 699.19
Total waste generated 2,906.00 3,006.00 3,145.00 3,106.00 3,066.00(not including construction debris)
Percent recycled 18.78% 17.62% 18.42% 18.02% 18.57%
7.5
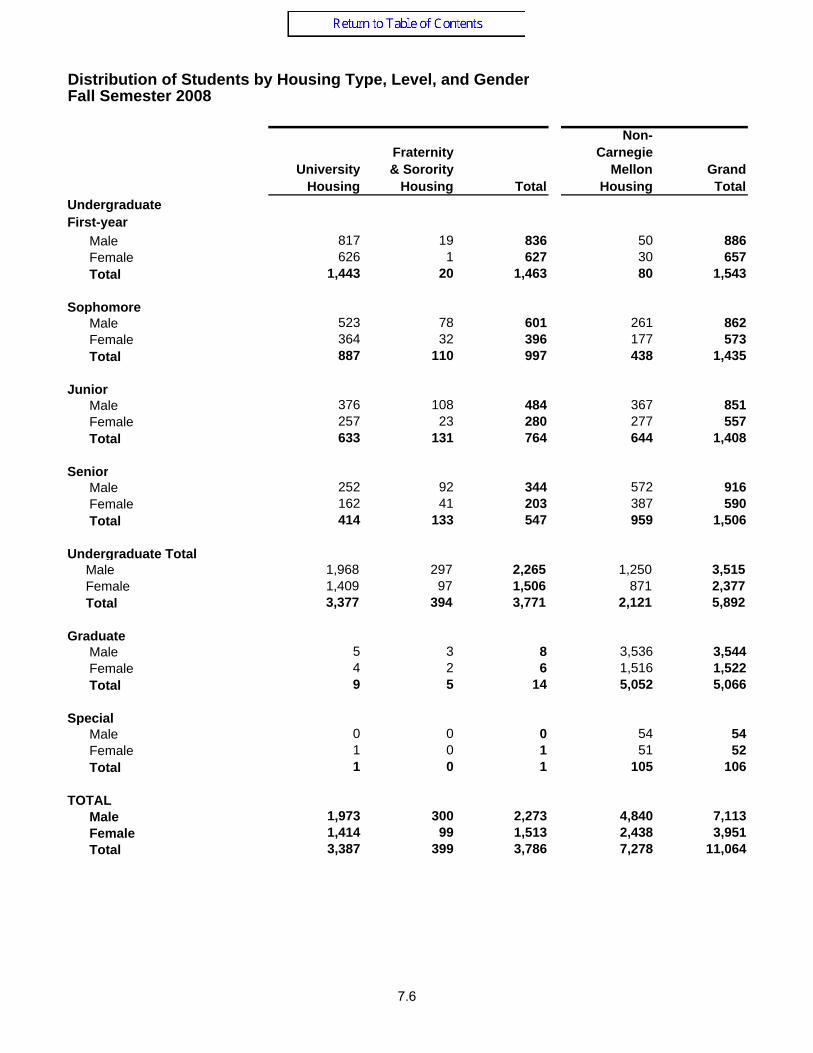
University Housing
Fraternity & Sorority
Housing Total
Non- Carnegie
Mellon Housing
Grand Total
UndergraduateFirst-year
Male 817 19 836 50 886Female 626 1 627 30 657Total 1,443 20 1,463 80 1,543
SophomoreMale 523 78 601 261 862Female 364 32 396 177 573Total 887 110 997 438 1,435
JuniorMale 376 108 484 367 851Female 257 23 280 277 557Total 633 131 764 644 1,408
SeniorMale 252 92 344 572 916Female 162 41 203 387 590Total 414 133 547 959 1,506
Undergraduate Total Male 1,968 297 2,265 1,250 3,515 Female 1,409 97 1,506 871 2,377 Total 3,377 394 3,771 2,121 5,892
GraduateMale 5 3 8 3,536 3,544Female 4 2 6 1,516 1,522Total 9 5 14 5,052 5,066
SpecialMale 0 0 0 54 54Female 1 0 1 51 52Total 1 0 1 105 106
TOTALMale 1,973 300 2,273 4,840 7,113Female 1,414 99 1,513 2,438 3,951Total 3,387 399 3,786 7,278 11,064
Distribution of Students by Housing Type, Level, and GenderFall Semester 2008
7.6
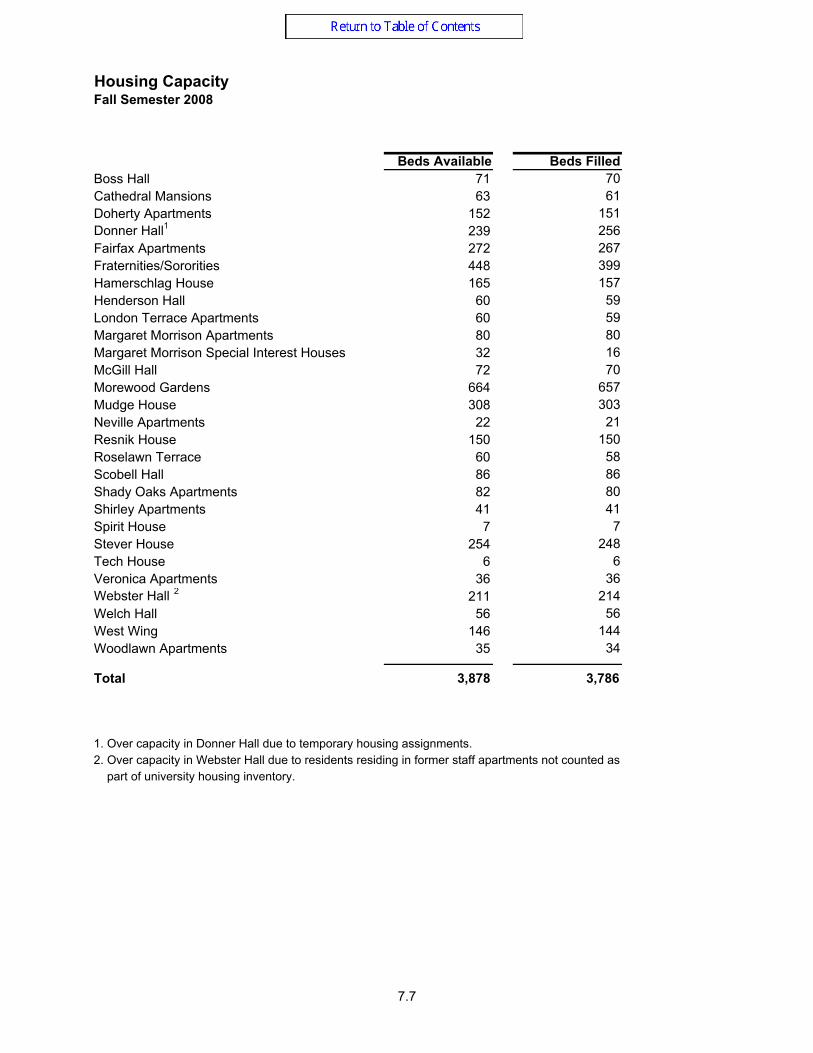
Housing CapacityFall Semester 2008
Beds Available Beds FilledBoss Hall 71 70Cathedral Mansions 63 61Doherty Apartments 152 151Donner Hall1 239 256Fairfax Apartments 272 267Fraternities/Sororities 448 399Hamerschlag House 165 157Henderson Hall 60 59London Terrace Apartments 60 59Margaret Morrison Apartments 80 80Margaret Morrison Special Interest Houses 32 16McGill Hall 72 70Morewood Gardens 664 657Mudge House 308 303Neville Apartments 22 21Resnik House 150 150Roselawn Terrace 60 58Scobell Hall 86 86Shady Oaks Apartments 82 80Shirley Apartments 41 41Spirit House 7 7Stever House 254 248Tech House 6 6Veronica Apartments 36 36Webster Hall 2 211 214Welch Hall 56 56West Wing 146 144Woodlawn Apartments 35 34
Total 3,878 3,786
1. Over capacity in Donner Hall due to temporary housing assignments.2. Over capacity in Webster Hall due to residents residing in former staff apartments not counted as part of university housing inventory.
7.7
Classroom Facilities
Laboratory Facilities
Office Facilities
Study Facilities
Special Use
Facilities
General Use
FacilitiesSupport
FacilitiesResidential
Facilities Other Total
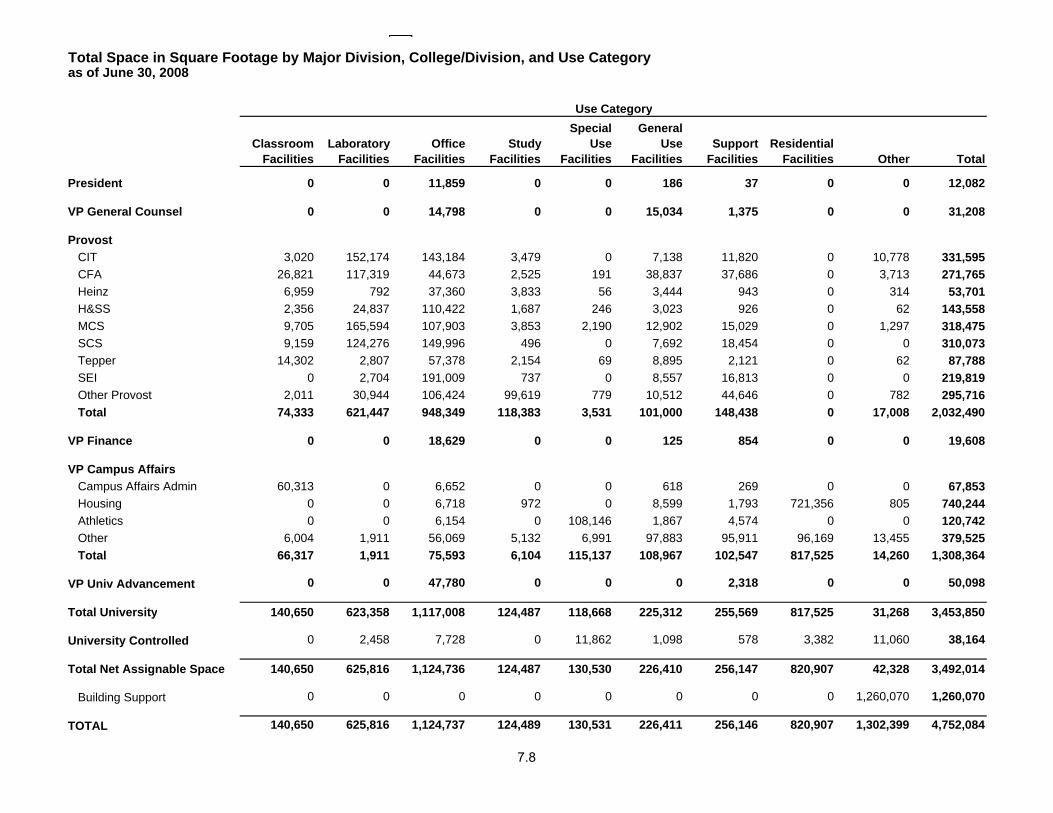
President 0 0 11,859 0 0 186 37 0 0 12,082
VP General Counsel 0 0 14,798 0 0 15,034 1,375 0 0 31,208
ProvostCIT 3,020 152,174 143,184 3,479 0 7,138 11,820 0 10,778 331,595CFA 26,821 117,319 44,673 2,525 191 38,837 37,686 0 3,713 271,765Heinz 6,959 792 37,360 3,833 56 3,444 943 0 314 53,701H&SS 2,356 24,837 110,422 1,687 246 3,023 926 0 62 143,558MCS 9,705 165,594 107,903 3,853 2,190 12,902 15,029 0 1,297 318,475SCS 9,159 124,276 149,996 496 0 7,692 18,454 0 0 310,073Tepper 14,302 2,807 57,378 2,154 69 8,895 2,121 0 62 87,788SEI 0 2,704 191,009 737 0 8,557 16,813 0 0 219,819Other Provost 2,011 30,944 106,424 99,619 779 10,512 44,646 0 782 295,716Total 74,333 621,447 948,349 118,383 3,531 101,000 148,438 0 17,008 2,032,490
VP Finance 0 0 18,629 0 0 125 854 0 0 19,608
VP Campus AffairsCampus Affairs Admin 60,313 0 6,652 0 0 618 269 0 0 67,853Housing 0 0 6,718 972 0 8,599 1,793 721,356 805 740,244Athletics 0 0 6,154 0 108,146 1,867 4,574 0 0 120,742Other 6,004 1,911 56,069 5,132 6,991 97,883 95,911 96,169 13,455 379,525Total 66,317 1,911 75,593 6,104 115,137 108,967 102,547 817,525 14,260 1,308,364
VP Univ Advancement 0 0 47,780 0 0 0 2,318 0 0 50,098
Total University 140,650 623,358 1,117,008 124,487 118,668 225,312 255,569 817,525 31,268 3,453,850
University Controlled 0 2,458 7,728 0 11,862 1,098 578 3,382 11,060 38,164
Total Net Assignable Space 140,650 625,816 1,124,736 124,487 130,530 226,410 256,147 820,907 42,328 3,492,014
Building Support 0 0 0 0 0 0 0 0 1,260,070 1,260,070
TOTAL 140,650 625,816 1,124,737 124,489 130,531 226,411 256,146 820,907 1,302,399 4,752,084
Total Space in Square Footage by Major Division, College/Division, and Use Category as of June 30, 2008
Use Category
7.8
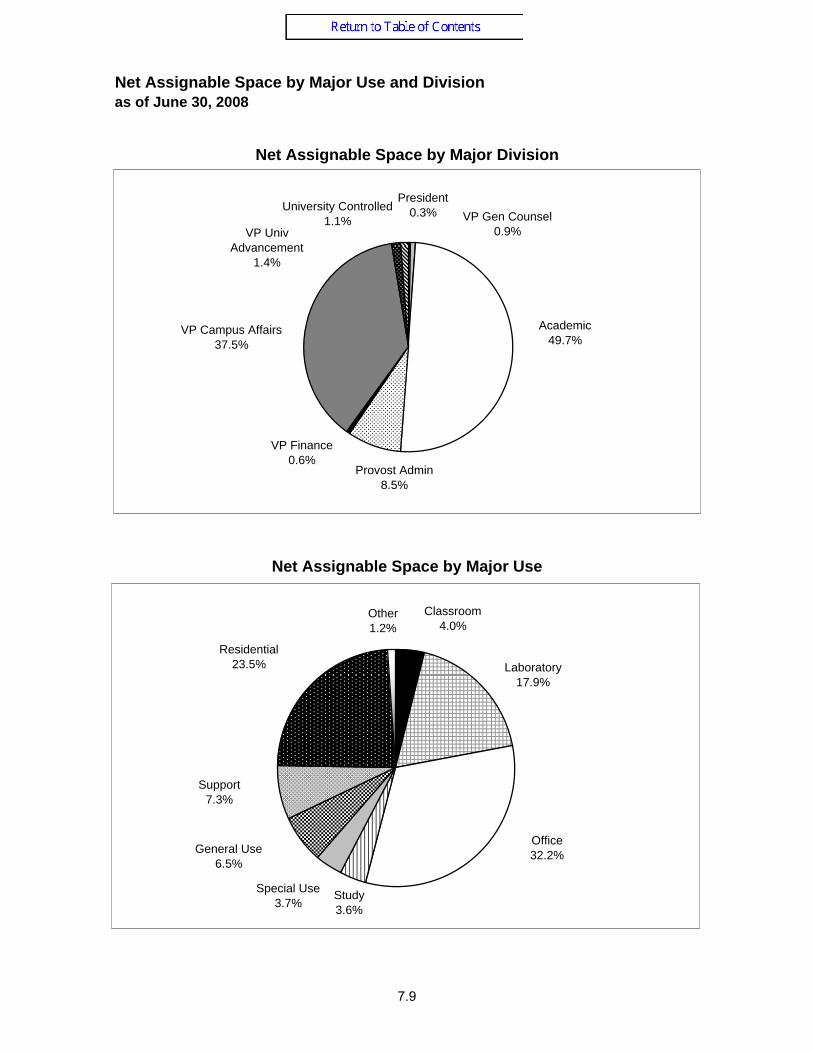
Net Assignable Space by Major Use and Division as of June 30, 2008
Net Assignable Space by Major Division
Net Assignable Space by Major Use
VP Campus Affairs 37.5%
VP Univ Advancement
1.4%
University Controlled 1.1%
President0.3% VP Gen Counsel
0.9%
Academic49.7%
Provost Admin8.5%
VP Finance0.6%
Classroom4.0%
Other1.2%
Residential23.5%
Support7.3%
General Use6.5%
Special Use3.7%
Study3.6%
Office32.2%
Laboratory17.9%
7.9
Classroom Facilities
Laboratory Facilities
Office Facilities
Study Facilities
Special Use
Facilities
General Use
FacilitiesSupport
FacilitiesResidential
Facilities Other Total
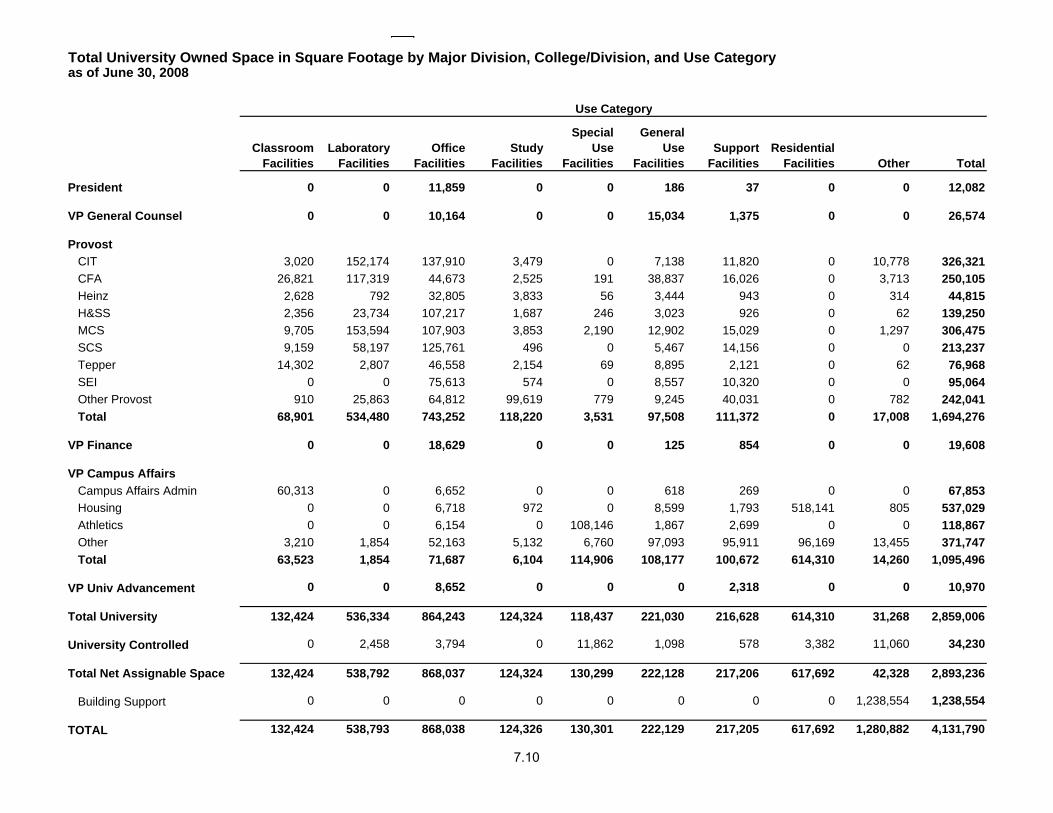
President 0 0 11,859 0 0 186 37 0 0 12,082
VP General Counsel 0 0 10,164 0 0 15,034 1,375 0 0 26,574
ProvostCIT 3,020 152,174 137,910 3,479 0 7,138 11,820 0 10,778 326,321CFA 26,821 117,319 44,673 2,525 191 38,837 16,026 0 3,713 250,105Heinz 2,628 792 32,805 3,833 56 3,444 943 0 314 44,815H&SS 2,356 23,734 107,217 1,687 246 3,023 926 0 62 139,250MCS 9,705 153,594 107,903 3,853 2,190 12,902 15,029 0 1,297 306,475SCS 9,159 58,197 125,761 496 0 5,467 14,156 0 0 213,237Tepper 14,302 2,807 46,558 2,154 69 8,895 2,121 0 62 76,968SEI 0 0 75,613 574 0 8,557 10,320 0 0 95,064Other Provost 910 25,863 64,812 99,619 779 9,245 40,031 0 782 242,041Total 68,901 534,480 743,252 118,220 3,531 97,508 111,372 0 17,008 1,694,276
VP Finance 0 0 18,629 0 0 125 854 0 0 19,608
VP Campus AffairsCampus Affairs Admin 60,313 0 6,652 0 0 618 269 0 0 67,853Housing 0 0 6,718 972 0 8,599 1,793 518,141 805 537,029Athletics 0 0 6,154 0 108,146 1,867 2,699 0 0 118,867Other 3,210 1,854 52,163 5,132 6,760 97,093 95,911 96,169 13,455 371,747Total 63,523 1,854 71,687 6,104 114,906 108,177 100,672 614,310 14,260 1,095,496
VP Univ Advancement 0 0 8,652 0 0 0 2,318 0 0 10,970
Total University 132,424 536,334 864,243 124,324 118,437 221,030 216,628 614,310 31,268 2,859,006
University Controlled 0 2,458 3,794 0 11,862 1,098 578 3,382 11,060 34,230
Total Net Assignable Space 132,424 538,792 868,037 124,324 130,299 222,128 217,206 617,692 42,328 2,893,236
Building Support 0 0 0 0 0 0 0 0 1,238,554 1,238,554
TOTAL 132,424 538,793 868,038 124,326 130,301 222,129 217,205 617,692 1,280,882 4,131,790
Total University Owned Space in Square Footage by Major Division, College/Division, and Use Category as of June 30, 2008
Use Category
7.10
Classroom Facilities
Laboratory Facilities
Office Facilities
Study Facilities
Special Use
Facilities
General Use
FacilitiesSupport
FacilitiesResidential
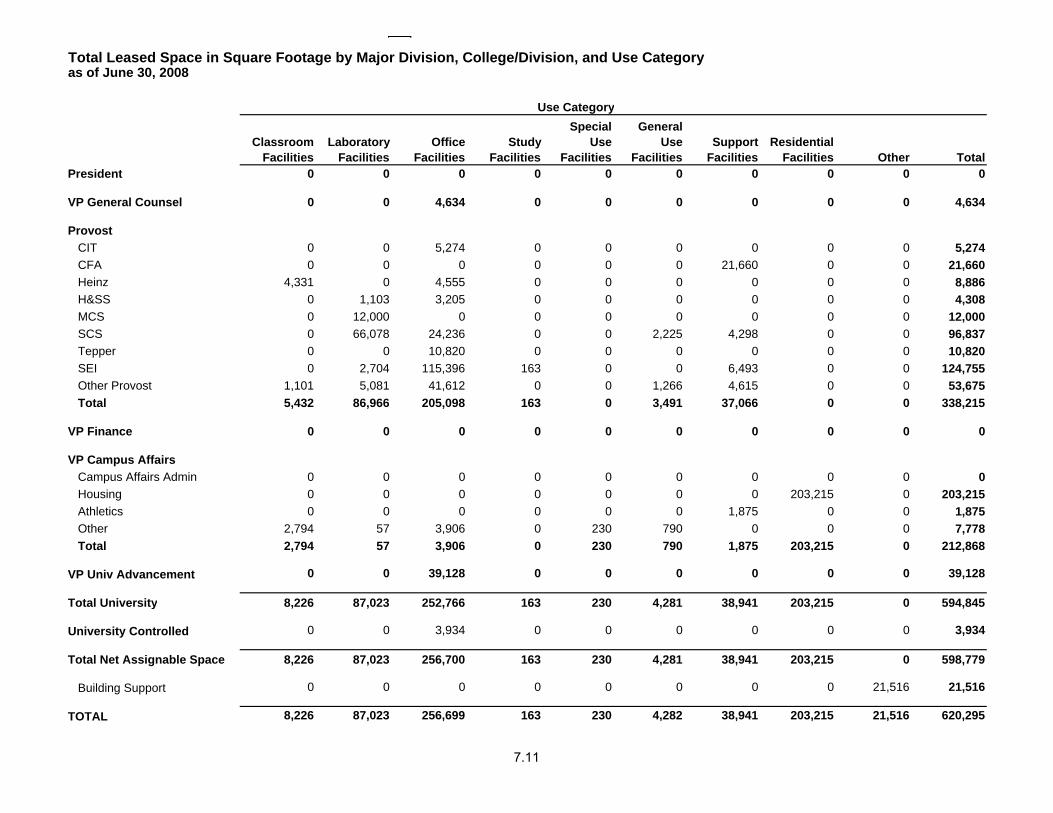
Facilities Other TotalPresident 0 0 0 0 0 0 0 0 0 0
VP General Counsel 0 0 4,634 0 0 0 0 0 0 4,634
ProvostCIT 0 0 5,274 0 0 0 0 0 0 5,274CFA 0 0 0 0 0 0 21,660 0 0 21,660Heinz 4,331 0 4,555 0 0 0 0 0 0 8,886H&SS 0 1,103 3,205 0 0 0 0 0 0 4,308MCS 0 12,000 0 0 0 0 0 0 0 12,000SCS 0 66,078 24,236 0 0 2,225 4,298 0 0 96,837Tepper 0 0 10,820 0 0 0 0 0 0 10,820SEI 0 2,704 115,396 163 0 0 6,493 0 0 124,755Other Provost 1,101 5,081 41,612 0 0 1,266 4,615 0 0 53,675Total 5,432 86,966 205,098 163 0 3,491 37,066 0 0 338,215
VP Finance 0 0 0 0 0 0 0 0 0 0
VP Campus AffairsCampus Affairs Admin 0 0 0 0 0 0 0 0 0 0Housing 0 0 0 0 0 0 0 203,215 0 203,215Athletics 0 0 0 0 0 0 1,875 0 0 1,875Other 2,794 57 3,906 0 230 790 0 0 0 7,778Total 2,794 57 3,906 0 230 790 1,875 203,215 0 212,868
VP Univ Advancement 0 0 39,128 0 0 0 0 0 0 39,128
Total University 8,226 87,023 252,766 163 230 4,281 38,941 203,215 0 594,845
University Controlled 0 0 3,934 0 0 0 0 0 0 3,934
Total Net Assignable Space 8,226 87,023 256,700 163 230 4,281 38,941 203,215 0 598,779
Building Support 0 0 0 0 0 0 0 0 21,516 21,516
TOTAL 8,226 87,023 256,699 163 230 4,282 38,941 203,215 21,516 620,295
Total Leased Space in Square Footage by Major Division, College/Division, and Use Category as of June 30, 2008
Use Category
7.11
Instruction and Dept Research
Organized Research
Other Institutional
Activity
Other Sponsored
Projects
Operations and Maintenance
of PlantGeneral
AdminDepart Admin
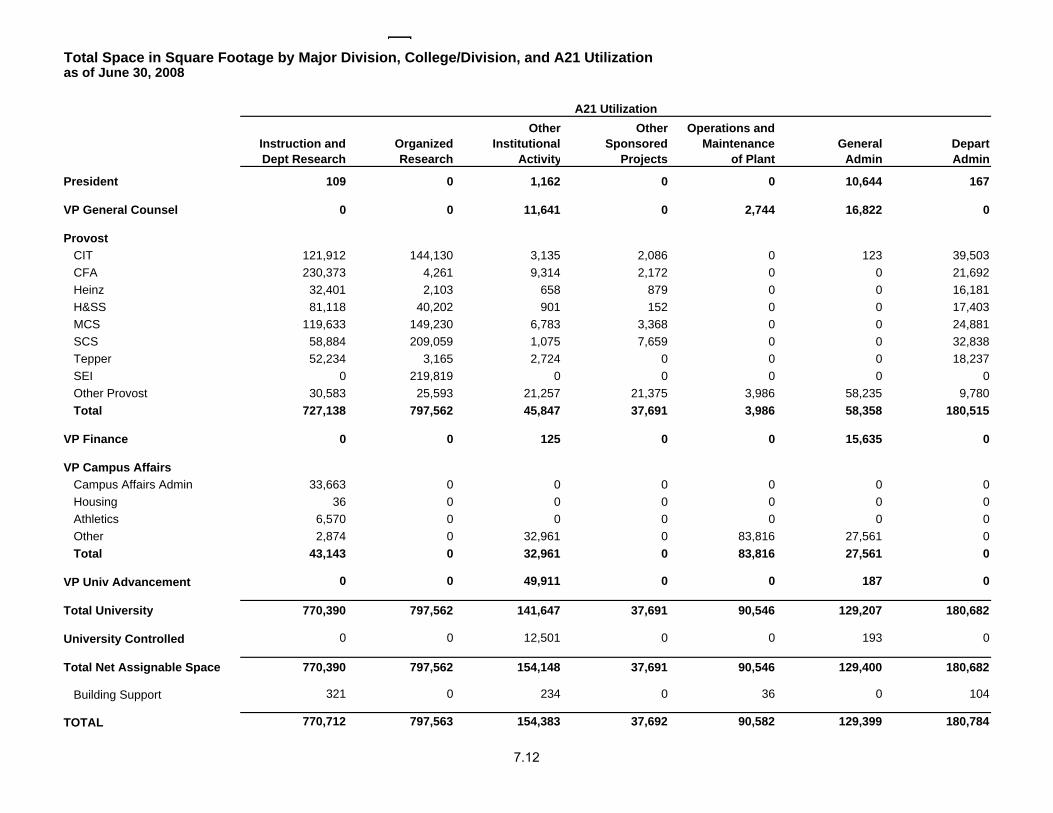
President 109 0 1,162 0 0 10,644 167
VP General Counsel 0 0 11,641 0 2,744 16,822 0
ProvostCIT 121,912 144,130 3,135 2,086 0 123 39,503CFA 230,373 4,261 9,314 2,172 0 0 21,692Heinz 32,401 2,103 658 879 0 0 16,181H&SS 81,118 40,202 901 152 0 0 17,403MCS 119,633 149,230 6,783 3,368 0 0 24,881SCS 58,884 209,059 1,075 7,659 0 0 32,838Tepper 52,234 3,165 2,724 0 0 0 18,237SEI 0 219,819 0 0 0 0 0Other Provost 30,583 25,593 21,257 21,375 3,986 58,235 9,780Total 727,138 797,562 45,847 37,691 3,986 58,358 180,515
VP Finance 0 0 125 0 0 15,635 0
VP Campus AffairsCampus Affairs Admin 33,663 0 0 0 0 0 0Housing 36 0 0 0 0 0 0Athletics 6,570 0 0 0 0 0 0Other 2,874 0 32,961 0 83,816 27,561 0Total 43,143 0 32,961 0 83,816 27,561 0
VP Univ Advancement 0 0 49,911 0 0 187 0
Total University 770,390 797,562 141,647 37,691 90,546 129,207 180,682
University Controlled 0 0 12,501 0 0 193 0
Total Net Assignable Space 770,390 797,562 154,148 37,691 90,546 129,400 180,682
Building Support 321 0 234 0 36 0 104
TOTAL 770,712 797,563 154,383 37,692 90,582 129,399 180,784
Total Space in Square Footage by Major Division, College/Division, and A21 Utilization as of June 30, 2008
A21 Utilization
7.12
Sponsored Projects Admin Library
Student Services
Outside Agencies
Auxiliary Services Unassigned
Non-Assignable Total
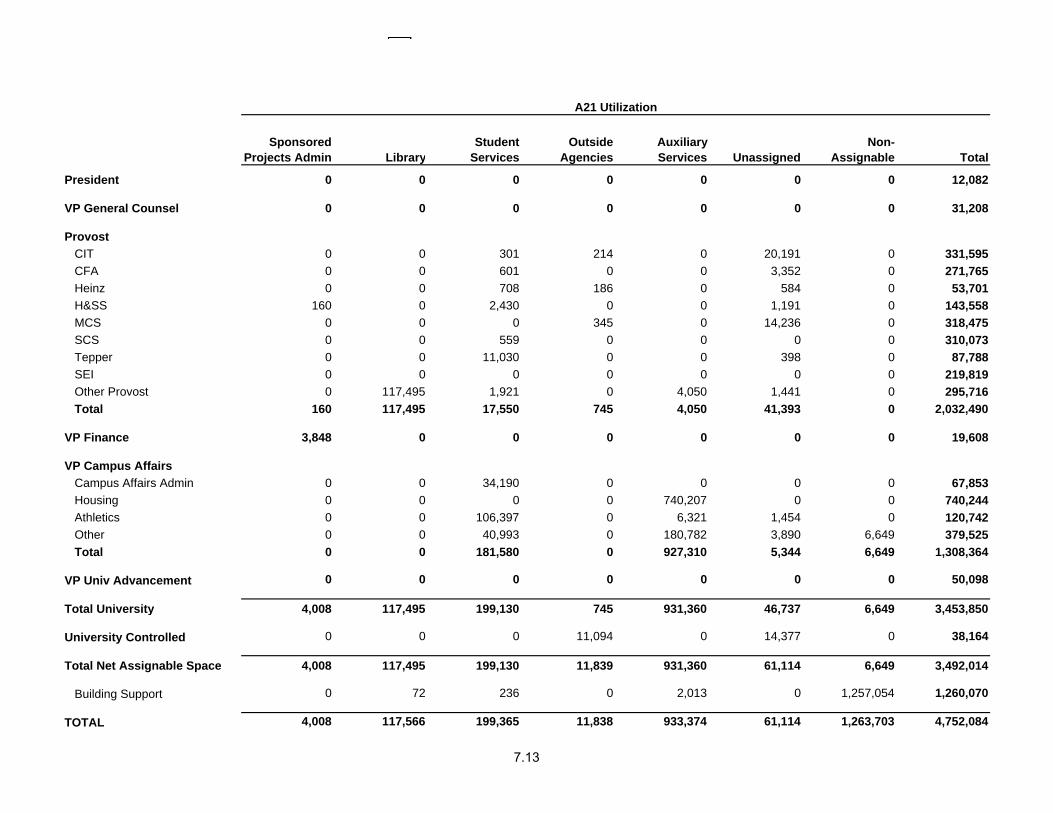
President 0 0 0 0 0 0 0 12,082
VP General Counsel 0 0 0 0 0 0 0 31,208
ProvostCIT 0 0 301 214 0 20,191 0 331,595CFA 0 0 601 0 0 3,352 0 271,765Heinz 0 0 708 186 0 584 0 53,701H&SS 160 0 2,430 0 0 1,191 0 143,558MCS 0 0 0 345 0 14,236 0 318,475SCS 0 0 559 0 0 0 0 310,073Tepper 0 0 11,030 0 0 398 0 87,788SEI 0 0 0 0 0 0 0 219,819Other Provost 0 117,495 1,921 0 4,050 1,441 0 295,716Total 160 117,495 17,550 745 4,050 41,393 0 2,032,490
VP Finance 3,848 0 0 0 0 0 0 19,608
VP Campus AffairsCampus Affairs Admin 0 0 34,190 0 0 0 0 67,853Housing 0 0 0 0 740,207 0 0 740,244Athletics 0 0 106,397 0 6,321 1,454 0 120,742Other 0 0 40,993 0 180,782 3,890 6,649 379,525Total 0 0 181,580 0 927,310 5,344 6,649 1,308,364
VP Univ Advancement 0 0 0 0 0 0 0 50,098
Total University 4,008 117,495 199,130 745 931,360 46,737 6,649 3,453,850
University Controlled 0 0 0 11,094 0 14,377 0 38,164
Total Net Assignable Space 4,008 117,495 199,130 11,839 931,360 61,114 6,649 3,492,014
Building Support 0 72 236 0 2,013 0 1,257,054 1,260,070
TOTAL 4,008 117,566 199,365 11,838 933,374 61,114 1,263,703 4,752,084
A21 Utilization
7.13
Instruction and Dept Research
Organized Research
Other Institutional
Activity
Other Sponsored
Projects
Operations and Maintenance
of PlantGeneral
AdminDepart Admin
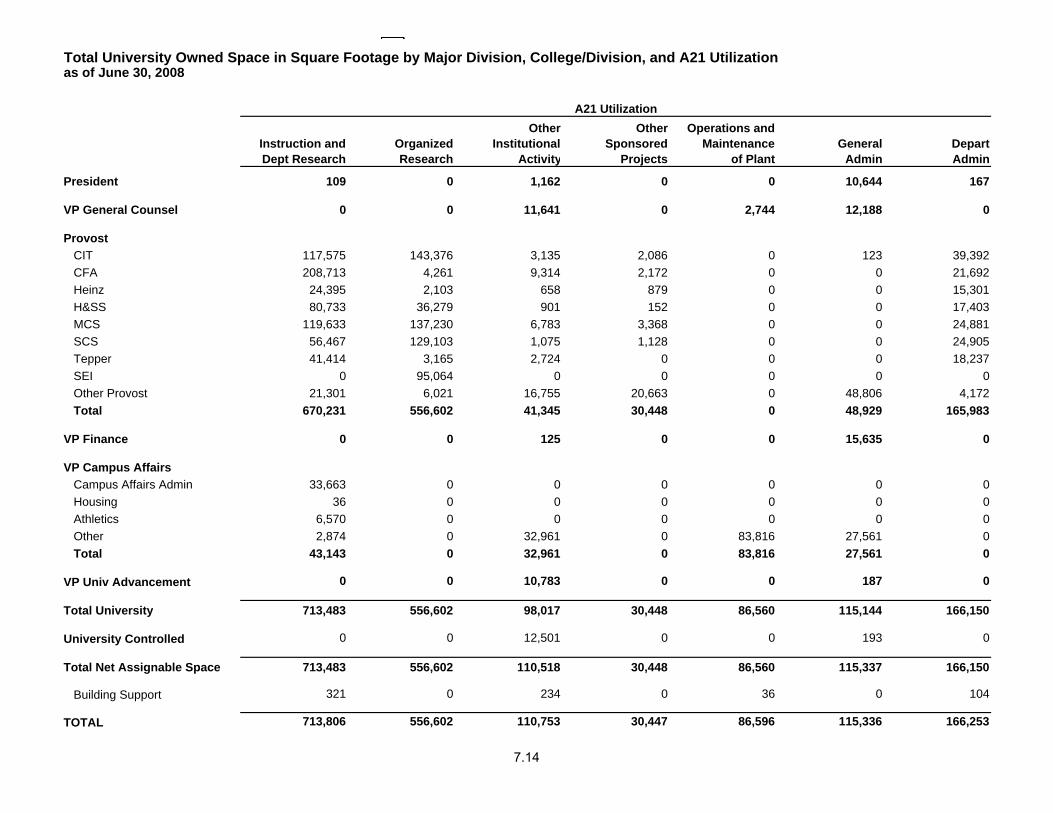
President 109 0 1,162 0 0 10,644 167
VP General Counsel 0 0 11,641 0 2,744 12,188 0
ProvostCIT 117,575 143,376 3,135 2,086 0 123 39,392CFA 208,713 4,261 9,314 2,172 0 0 21,692Heinz 24,395 2,103 658 879 0 0 15,301H&SS 80,733 36,279 901 152 0 0 17,403MCS 119,633 137,230 6,783 3,368 0 0 24,881SCS 56,467 129,103 1,075 1,128 0 0 24,905Tepper 41,414 3,165 2,724 0 0 0 18,237SEI 0 95,064 0 0 0 0 0Other Provost 21,301 6,021 16,755 20,663 0 48,806 4,172Total 670,231 556,602 41,345 30,448 0 48,929 165,983
VP Finance 0 0 125 0 0 15,635 0
VP Campus AffairsCampus Affairs Admin 33,663 0 0 0 0 0 0Housing 36 0 0 0 0 0 0Athletics 6,570 0 0 0 0 0 0Other 2,874 0 32,961 0 83,816 27,561 0Total 43,143 0 32,961 0 83,816 27,561 0
VP Univ Advancement 0 0 10,783 0 0 187 0
Total University 713,483 556,602 98,017 30,448 86,560 115,144 166,150
University Controlled 0 0 12,501 0 0 193 0
Total Net Assignable Space 713,483 556,602 110,518 30,448 86,560 115,337 166,150
Building Support 321 0 234 0 36 0 104
TOTAL 713,806 556,602 110,753 30,447 86,596 115,336 166,253
Total University Owned Space in Square Footage by Major Division, College/Division, and A21 Utilizationas of June 30, 2008
A21 Utilization
7.14
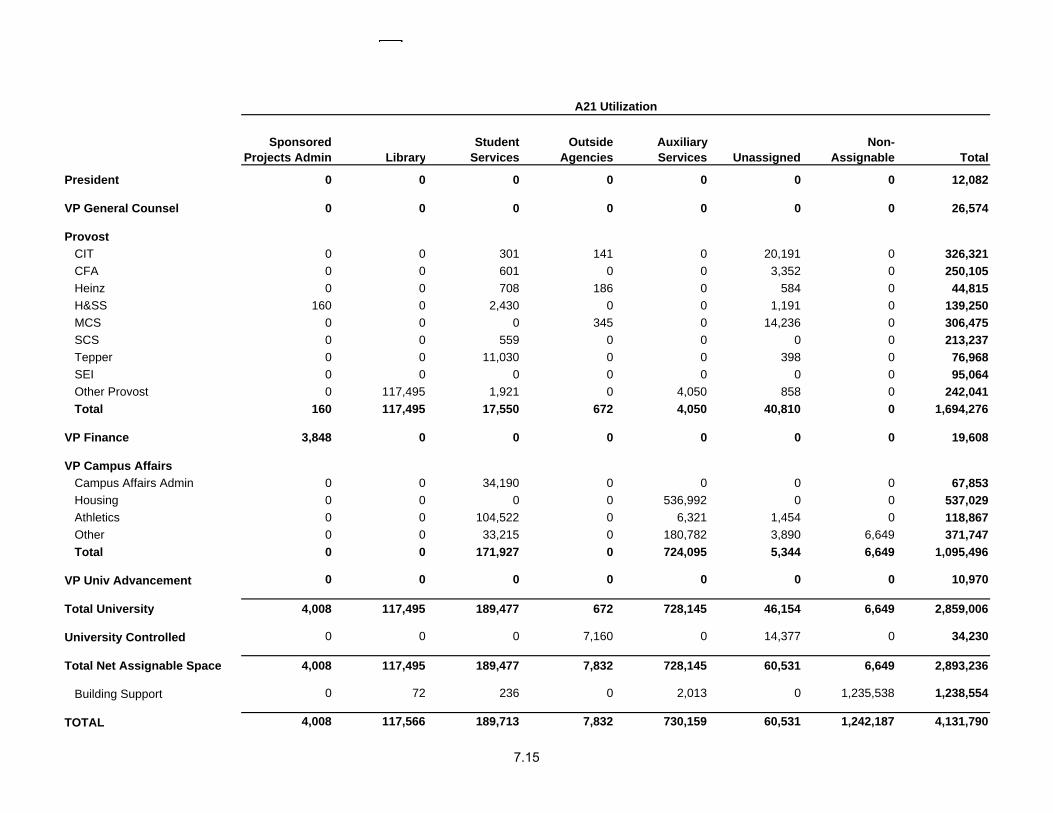
Sponsored Projects Admin Library
Student Services
Outside Agencies
Auxiliary Services Unassigned
Non-Assignable Total
President 0 0 0 0 0 0 0 12,082
VP General Counsel 0 0 0 0 0 0 0 26,574
ProvostCIT 0 0 301 141 0 20,191 0 326,321CFA 0 0 601 0 0 3,352 0 250,105Heinz 0 0 708 186 0 584 0 44,815H&SS 160 0 2,430 0 0 1,191 0 139,250MCS 0 0 0 345 0 14,236 0 306,475SCS 0 0 559 0 0 0 0 213,237Tepper 0 0 11,030 0 0 398 0 76,968SEI 0 0 0 0 0 0 0 95,064Other Provost 0 117,495 1,921 0 4,050 858 0 242,041Total 160 117,495 17,550 672 4,050 40,810 0 1,694,276
VP Finance 3,848 0 0 0 0 0 0 19,608
VP Campus AffairsCampus Affairs Admin 0 0 34,190 0 0 0 0 67,853Housing 0 0 0 0 536,992 0 0 537,029Athletics 0 0 104,522 0 6,321 1,454 0 118,867Other 0 0 33,215 0 180,782 3,890 6,649 371,747Total 0 0 171,927 0 724,095 5,344 6,649 1,095,496
VP Univ Advancement 0 0 0 0 0 0 0 10,970
Total University 4,008 117,495 189,477 672 728,145 46,154 6,649 2,859,006
University Controlled 0 0 0 7,160 0 14,377 0 34,230
Total Net Assignable Space 4,008 117,495 189,477 7,832 728,145 60,531 6,649 2,893,236
Building Support 0 72 236 0 2,013 0 1,235,538 1,238,554
TOTAL 4,008 117,566 189,713 7,832 730,159 60,531 1,242,187 4,131,790
A21 Utilization
7.15
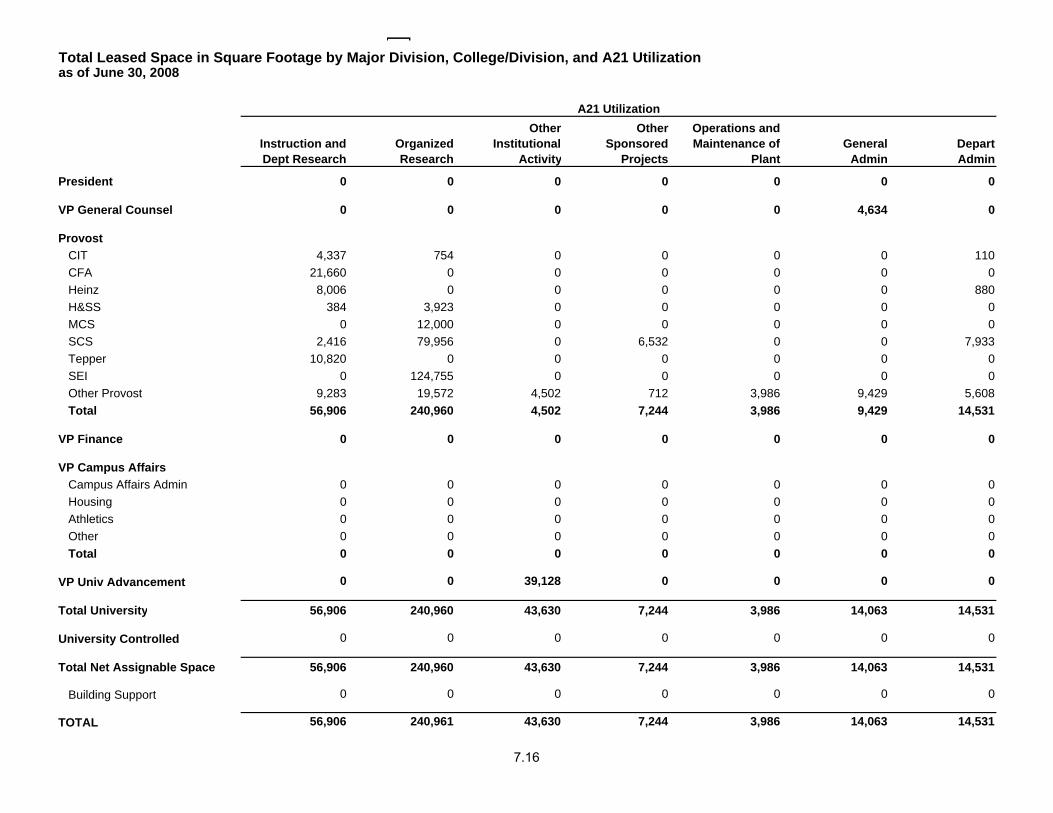
Instruction and Dept Research
Organized Research
Other Institutional
Activity
Other Sponsored
Projects
Operations and Maintenance of
PlantGeneral
AdminDepart Admin
President 0 0 0 0 0 0 0
VP General Counsel 0 0 0 0 0 4,634 0
ProvostCIT 4,337 754 0 0 0 0 110CFA 21,660 0 0 0 0 0 0Heinz 8,006 0 0 0 0 0 880H&SS 384 3,923 0 0 0 0 0MCS 0 12,000 0 0 0 0 0SCS 2,416 79,956 0 6,532 0 0 7,933Tepper 10,820 0 0 0 0 0 0SEI 0 124,755 0 0 0 0 0Other Provost 9,283 19,572 4,502 712 3,986 9,429 5,608Total 56,906 240,960 4,502 7,244 3,986 9,429 14,531
VP Finance 0 0 0 0 0 0 0
VP Campus AffairsCampus Affairs Admin 0 0 0 0 0 0 0Housing 0 0 0 0 0 0 0Athletics 0 0 0 0 0 0 0Other 0 0 0 0 0 0 0Total 0 0 0 0 0 0 0
VP Univ Advancement 0 0 39,128 0 0 0 0
Total University 56,906 240,960 43,630 7,244 3,986 14,063 14,531
University Controlled 0 0 0 0 0 0 0
Total Net Assignable Space 56,906 240,960 43,630 7,244 3,986 14,063 14,531
Building Support 0 0 0 0 0 0 0
TOTAL 56,906 240,961 43,630 7,244 3,986 14,063 14,531
Total Leased Space in Square Footage by Major Division, College/Division, and A21 Utilization as of June 30, 2008
A21 Utilization
7.16
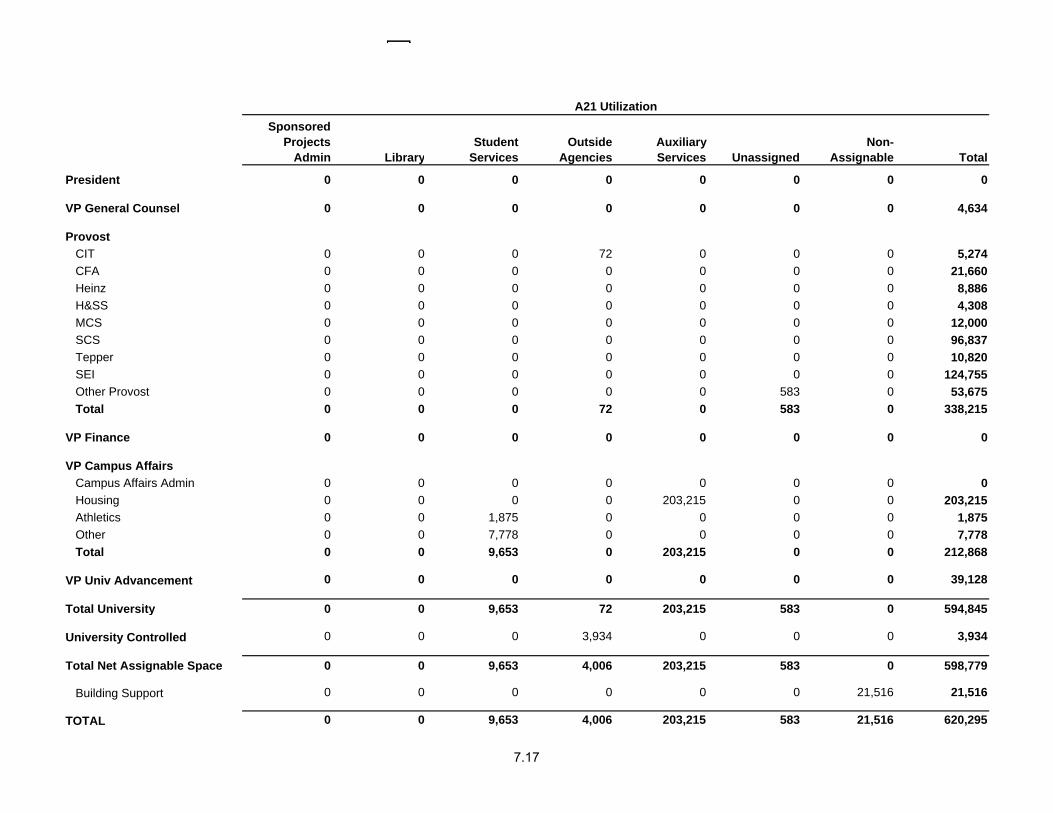
Sponsored Projects
Admin LibraryStudent
ServicesOutside
AgenciesAuxiliary Services Unassigned
Non-Assignable Total
President 0 0 0 0 0 0 0 0
VP General Counsel 0 0 0 0 0 0 0 4,634
ProvostCIT 0 0 0 72 0 0 0 5,274CFA 0 0 0 0 0 0 0 21,660Heinz 0 0 0 0 0 0 0 8,886H&SS 0 0 0 0 0 0 0 4,308MCS 0 0 0 0 0 0 0 12,000SCS 0 0 0 0 0 0 0 96,837Tepper 0 0 0 0 0 0 0 10,820SEI 0 0 0 0 0 0 0 124,755Other Provost 0 0 0 0 0 583 0 53,675Total 0 0 0 72 0 583 0 338,215
VP Finance 0 0 0 0 0 0 0 0
VP Campus AffairsCampus Affairs Admin 0 0 0 0 0 0 0 0Housing 0 0 0 0 203,215 0 0 203,215Athletics 0 0 1,875 0 0 0 0 1,875Other 0 0 7,778 0 0 0 0 7,778Total 0 0 9,653 0 203,215 0 0 212,868
VP Univ Advancement 0 0 0 0 0 0 0 39,128
Total University 0 0 9,653 72 203,215 583 0 594,845
University Controlled 0 0 0 3,934 0 0 0 3,934
Total Net Assignable Space 0 0 9,653 4,006 203,215 583 0 598,779
Building Support 0 0 0 0 0 0 21,516 21,516
TOTAL 0 0 9,653 4,006 203,215 583 21,516 620,295
A21 Utilization
7.17
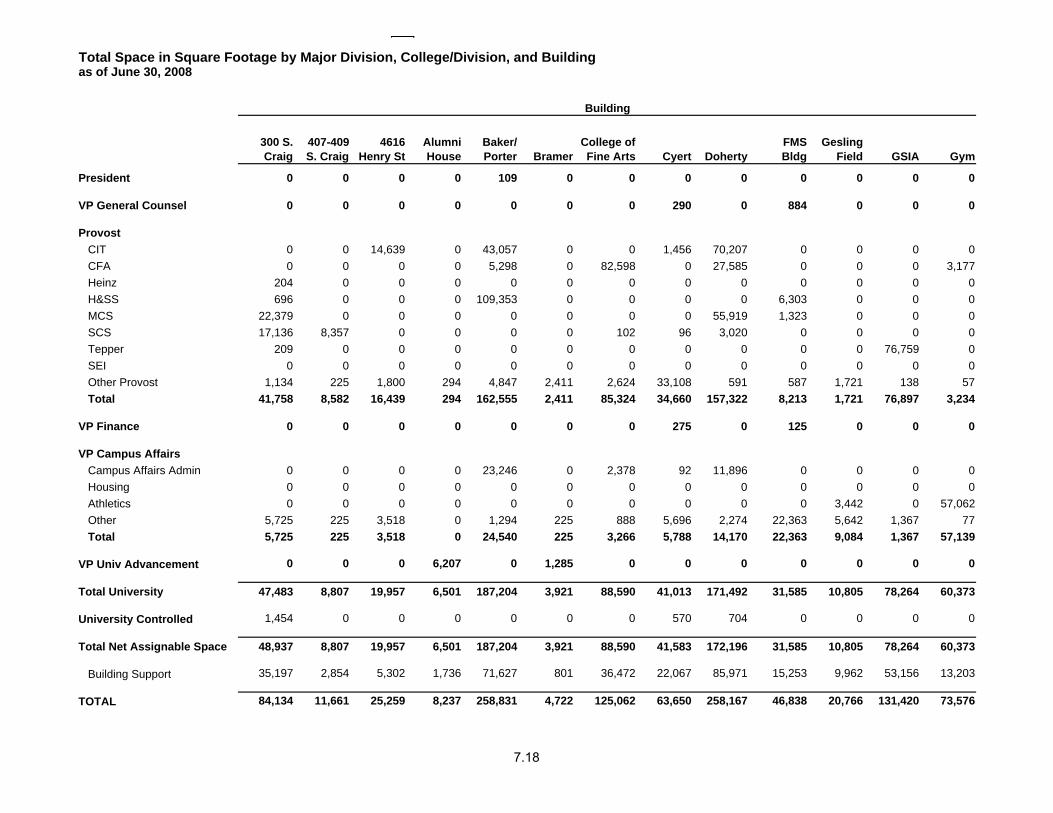
300 S. Craig
407-409 S. Craig
4616 Henry St
Alumni House
Baker/ Porter Bramer
College of Fine Arts Cyert Doherty
FMS Bldg
Gesling Field GSIA Gym
President 0 0 0 0 109 0 0 0 0 0 0 0 0
VP General Counsel 0 0 0 0 0 0 0 290 0 884 0 0 0
ProvostCIT 0 0 14,639 0 43,057 0 0 1,456 70,207 0 0 0 0CFA 0 0 0 0 5,298 0 82,598 0 27,585 0 0 0 3,177Heinz 204 0 0 0 0 0 0 0 0 0 0 0 0H&SS 696 0 0 0 109,353 0 0 0 0 6,303 0 0 0MCS 22,379 0 0 0 0 0 0 0 55,919 1,323 0 0 0SCS 17,136 8,357 0 0 0 0 102 96 3,020 0 0 0 0Tepper 209 0 0 0 0 0 0 0 0 0 0 76,759 0SEI 0 0 0 0 0 0 0 0 0 0 0 0 0Other Provost 1,134 225 1,800 294 4,847 2,411 2,624 33,108 591 587 1,721 138 57Total 41,758 8,582 16,439 294 162,555 2,411 85,324 34,660 157,322 8,213 1,721 76,897 3,234
VP Finance 0 0 0 0 0 0 0 275 0 125 0 0 0
VP Campus AffairsCampus Affairs Admin 0 0 0 0 23,246 0 2,378 92 11,896 0 0 0 0Housing 0 0 0 0 0 0 0 0 0 0 0 0 0Athletics 0 0 0 0 0 0 0 0 0 0 3,442 0 57,062Other 5,725 225 3,518 0 1,294 225 888 5,696 2,274 22,363 5,642 1,367 77Total 5,725 225 3,518 0 24,540 225 3,266 5,788 14,170 22,363 9,084 1,367 57,139
VP Univ Advancement 0 0 0 6,207 0 1,285 0 0 0 0 0 0 0
Total University 47,483 8,807 19,957 6,501 187,204 3,921 88,590 41,013 171,492 31,585 10,805 78,264 60,373
University Controlled 1,454 0 0 0 0 0 0 570 704 0 0 0 0
Total Net Assignable Space 48,937 8,807 19,957 6,501 187,204 3,921 88,590 41,583 172,196 31,585 10,805 78,264 60,373
Building Support 35,197 2,854 5,302 1,736 71,627 801 36,472 22,067 85,971 15,253 9,962 53,156 13,203
TOTAL 84,134 11,661 25,259 8,237 258,831 4,722 125,062 63,650 258,167 46,838 20,766 131,420 73,576
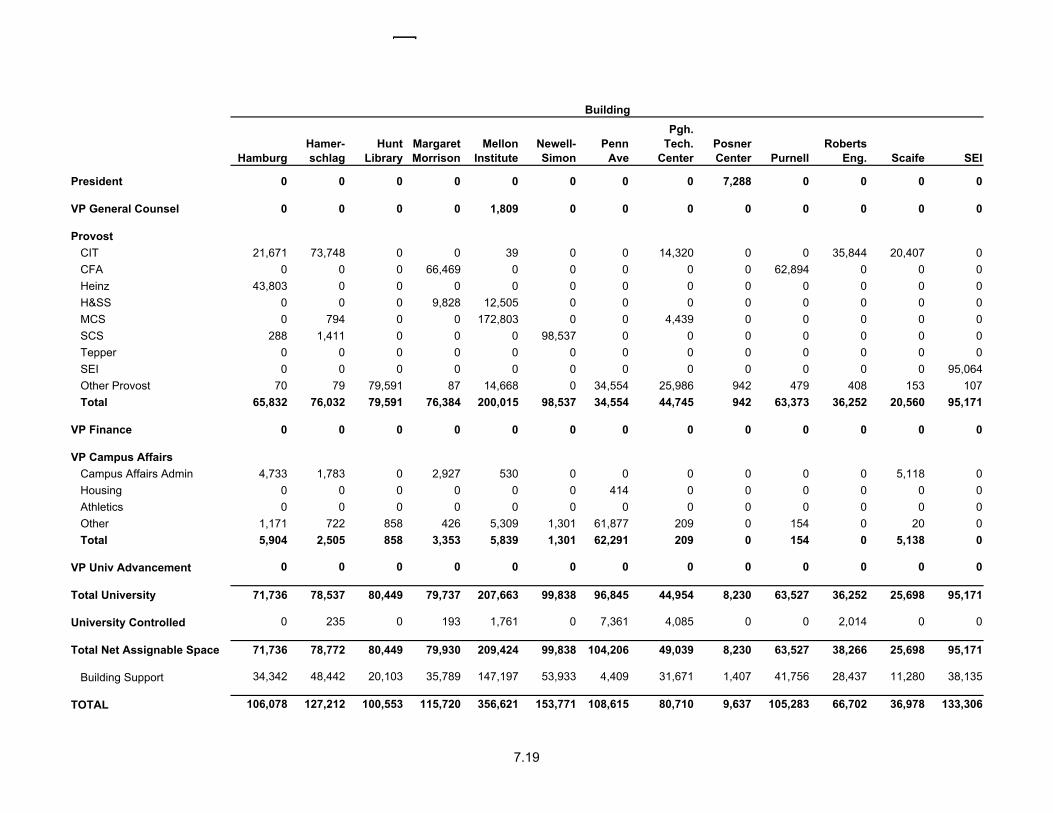
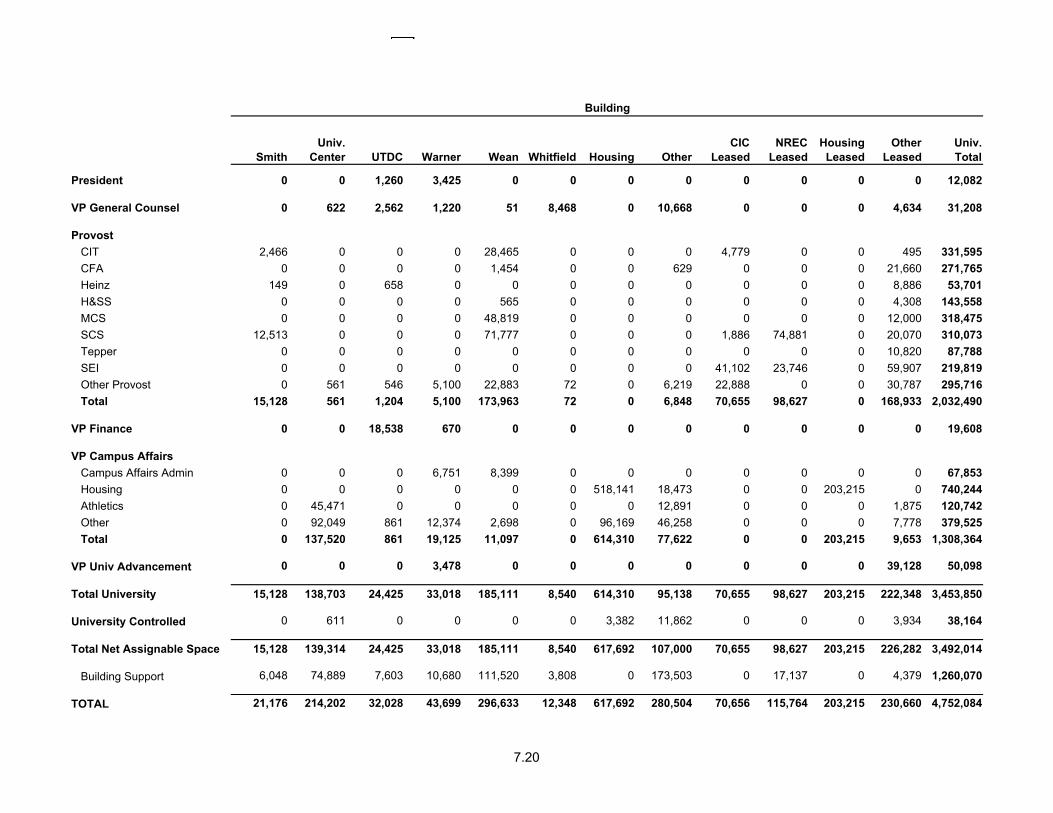
Total Space in Square Footage by Major Division, College/Division, and Buildingas of June 30, 2008
Building
7.18
HamburgHamer-schlag
Hunt Library
Margaret Morrison
Mellon Institute
Newell-Simon
Penn Ave
Pgh. Tech.
CenterPosner Center Purnell
Roberts Eng. Scaife SEI
President 0 0 0 0 0 0 0 0 7,288 0 0 0 0
VP General Counsel 0 0 0 0 1,809 0 0 0 0 0 0 0 0
ProvostCIT 21,671 73,748 0 0 39 0 0 14,320 0 0 35,844 20,407 0CFA 0 0 0 66,469 0 0 0 0 0 62,894 0 0 0Heinz 43,803 0 0 0 0 0 0 0 0 0 0 0 0H&SS 0 0 0 9,828 12,505 0 0 0 0 0 0 0 0MCS 0 794 0 0 172,803 0 0 4,439 0 0 0 0 0SCS 288 1,411 0 0 0 98,537 0 0 0 0 0 0 0Tepper 0 0 0 0 0 0 0 0 0 0 0 0 0SEI 0 0 0 0 0 0 0 0 0 0 0 0 95,064Other Provost 70 79 79,591 87 14,668 0 34,554 25,986 942 479 408 153 107Total 65,832 76,032 79,591 76,384 200,015 98,537 34,554 44,745 942 63,373 36,252 20,560 95,171
VP Finance 0 0 0 0 0 0 0 0 0 0 0 0 0
VP Campus AffairsCampus Affairs Admin 4,733 1,783 0 2,927 530 0 0 0 0 0 0 5,118 0Housing 0 0 0 0 0 0 414 0 0 0 0 0 0Athletics 0 0 0 0 0 0 0 0 0 0 0 0 0Other 1,171 722 858 426 5,309 1,301 61,877 209 0 154 0 20 0Total 5,904 2,505 858 3,353 5,839 1,301 62,291 209 0 154 0 5,138 0
VP Univ Advancement 0 0 0 0 0 0 0 0 0 0 0 0 0
Total University 71,736 78,537 80,449 79,737 207,663 99,838 96,845 44,954 8,230 63,527 36,252 25,698 95,171
University Controlled 0 235 0 193 1,761 0 7,361 4,085 0 0 2,014 0 0
Total Net Assignable Space 71,736 78,772 80,449 79,930 209,424 99,838 104,206 49,039 8,230 63,527 38,266 25,698 95,171
Building Support 34,342 48,442 20,103 35,789 147,197 53,933 4,409 31,671 1,407 41,756 28,437 11,280 38,135
TOTAL 106,078 127,212 100,553 115,720 356,621 153,771 108,615 80,710 9,637 105,283 66,702 36,978 133,306
Building
7.19
SmithUniv.
Center UTDC Warner Wean Whitfield Housing OtherCIC
LeasedNREC
LeasedHousing
LeasedOther
LeasedUniv. Total
President 0 0 1,260 3,425 0 0 0 0 0 0 0 0 12,082
VP General Counsel 0 622 2,562 1,220 51 8,468 0 10,668 0 0 0 4,634 31,208
ProvostCIT 2,466 0 0 0 28,465 0 0 0 4,779 0 0 495 331,595CFA 0 0 0 0 1,454 0 0 629 0 0 0 21,660 271,765Heinz 149 0 658 0 0 0 0 0 0 0 0 8,886 53,701H&SS 0 0 0 0 565 0 0 0 0 0 0 4,308 143,558MCS 0 0 0 0 48,819 0 0 0 0 0 0 12,000 318,475SCS 12,513 0 0 0 71,777 0 0 0 1,886 74,881 0 20,070 310,073Tepper 0 0 0 0 0 0 0 0 0 0 0 10,820 87,788SEI 0 0 0 0 0 0 0 0 41,102 23,746 0 59,907 219,819Other Provost 0 561 546 5,100 22,883 72 0 6,219 22,888 0 0 30,787 295,716Total 15,128 561 1,204 5,100 173,963 72 0 6,848 70,655 98,627 0 168,933 2,032,490
VP Finance 0 0 18,538 670 0 0 0 0 0 0 0 0 19,608
VP Campus AffairsCampus Affairs Admin 0 0 0 6,751 8,399 0 0 0 0 0 0 0 67,853Housing 0 0 0 0 0 0 518,141 18,473 0 0 203,215 0 740,244Athletics 0 45,471 0 0 0 0 0 12,891 0 0 0 1,875 120,742Other 0 92,049 861 12,374 2,698 0 96,169 46,258 0 0 0 7,778 379,525Total 0 137,520 861 19,125 11,097 0 614,310 77,622 0 0 203,215 9,653 1,308,364
VP Univ Advancement 0 0 0 3,478 0 0 0 0 0 0 0 39,128 50,098
Total University 15,128 138,703 24,425 33,018 185,111 8,540 614,310 95,138 70,655 98,627 203,215 222,348 3,453,850
University Controlled 0 611 0 0 0 0 3,382 11,862 0 0 0 3,934 38,164
Total Net Assignable Space 15,128 139,314 24,425 33,018 185,111 8,540 617,692 107,000 70,655 98,627 203,215 226,282 3,492,014
Building Support 6,048 74,889 7,603 10,680 111,520 3,808 0 173,503 0 17,137 0 4,379 1,260,070
TOTAL 21,176 214,202 32,028 43,699 296,633 12,348 617,692 280,504 70,656 115,764 203,215 230,660 4,752,084
Building
7.20
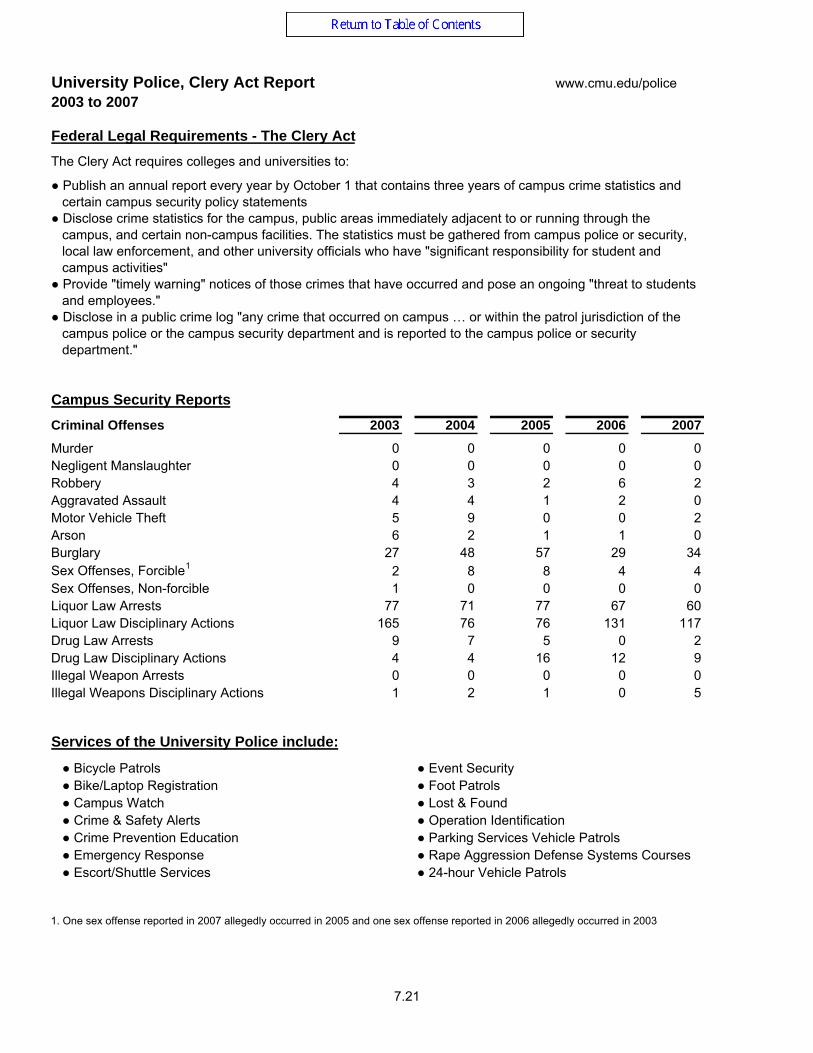
University Police, Clery Act Report www.cmu.edu/police2003 to 2007
Federal Legal Requirements - The Clery ActThe Clery Act requires colleges and universities to:
● Publish an annual report every year by October 1 that contains three years of campus crime statistics and certain campus security policy statements● Disclose crime statistics for the campus, public areas immediately adjacent to or running through the campus, and certain non-campus facilities. The statistics must be gathered from campus police or security, local law enforcement, and other university officials who have "significant responsibility for student and campus activities"● Provide "timely warning" notices of those crimes that have occurred and pose an ongoing "threat to students and employees."● Disclose in a public crime log "any crime that occurred on campus … or within the patrol jurisdiction of the campus police or the campus security department and is reported to the campus police or security department."
Campus Security ReportsCriminal Offenses 2003 2004 2005 2006 2007
Murder 0 0 0 0 0Negligent Manslaughter 0 0 0 0 0Robbery 4 3 2 6 2Aggravated Assault 4 4 1 2 0Motor Vehicle Theft 5 9 0 0 2Arson 6 2 1 1 0Burglary 27 48 57 29 34Sex Offenses, Forcible1 2 8 8 4 4Sex Offenses, Non-forcible 1 0 0 0 0Liquor Law Arrests 77 71 77 67 60Liquor Law Disciplinary Actions 165 76 76 131 117Drug Law Arrests 9 7 5 0 2Drug Law Disciplinary Actions 4 4 16 12 9Illegal Weapon Arrests 0 0 0 0 0Illegal Weapons Disciplinary Actions 1 2 1 0 5
Services of the University Police include:
● Bicycle Patrols ● Event Security● Bike/Laptop Registration ● Foot Patrols● Campus Watch ● Lost & Found● Crime & Safety Alerts ● Operation Identification● Crime Prevention Education ● Parking Services Vehicle Patrols● Emergency Response ● Rape Aggression Defense Systems Courses● Escort/Shuttle Services ● 24-hour Vehicle Patrols
1. One sex offense reported in 2007 allegedly occurred in 2005 and one sex offense reported in 2006 allegedly occurred in 2003
7.21
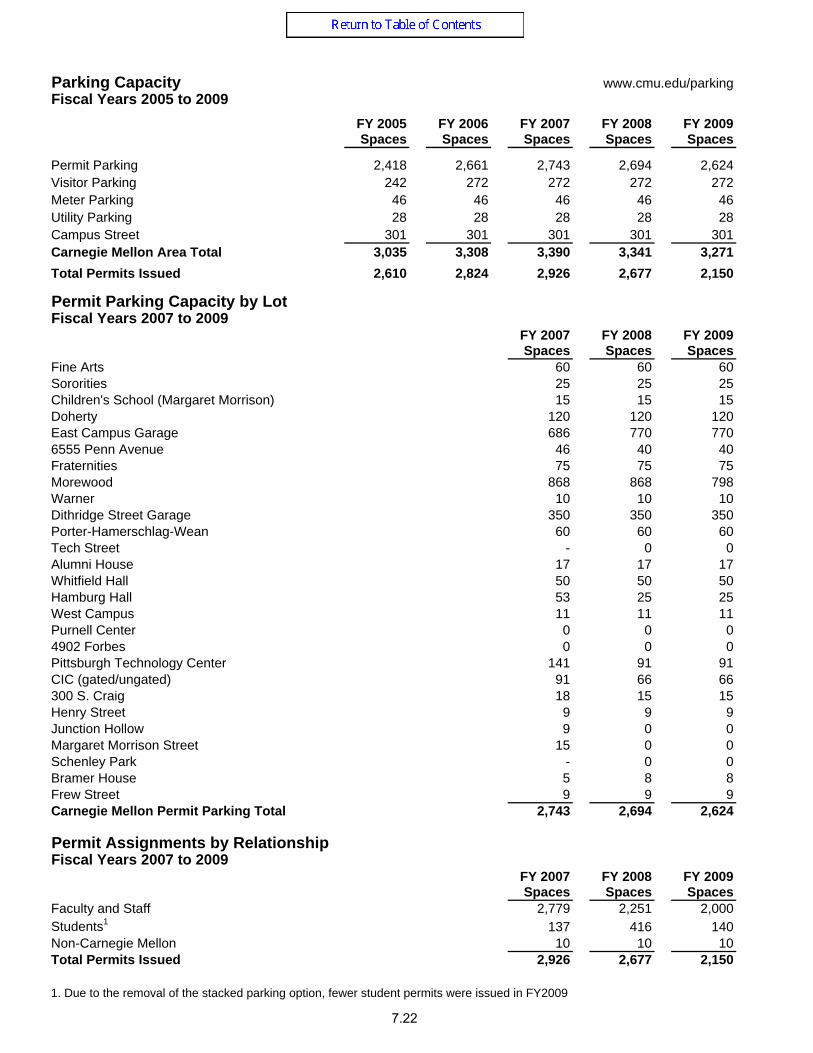
Parking Capacity www.cmu.edu/parkingFiscal Years 2005 to 2009
FY 2005 FY 2006 FY 2007 FY 2008 FY 2009Spaces Spaces Spaces Spaces Spaces
Permit Parking 2,418 2,661 2,743 2,694 2,624Visitor Parking 242 272 272 272 272Meter Parking 46 46 46 46 46Utility Parking 28 28 28 28 28Campus Street 301 301 301 301 301Carnegie Mellon Area Total 3,035 3,308 3,390 3,341 3,271Total Permits Issued 2,610 2,824 2,926 2,677 2,150
Permit Parking Capacity by Lot Fiscal Years 2007 to 2009
FY 2007 FY 2008 FY 2009Spaces Spaces Spaces
Fine Arts 60 60 60Sororities 25 25 25Children's School (Margaret Morrison) 15 15 15Doherty 120 120 120East Campus Garage 686 770 7706555 Penn Avenue 46 40 40Fraternities 75 75 75Morewood 868 868 798Warner 10 10 10Dithridge Street Garage 350 350 350Porter-Hamerschlag-Wean 60 60 60Tech Street - 0 0Alumni House 17 17 17Whitfield Hall 50 50 50Hamburg Hall 53 25 25West Campus 11 11 11Purnell Center 0 0 04902 Forbes 0 0 0Pittsburgh Technology Center 141 91 91CIC (gated/ungated) 91 66 66300 S. Craig 18 15 15Henry Street 9 9 9Junction Hollow 9 0 0Margaret Morrison Street 15 0 0Schenley Park - 0 0Bramer House 5 8 8Frew Street 9 9 9Carnegie Mellon Permit Parking Total 2,743 2,694 2,624
Permit Assignments by Relationship Fiscal Years 2007 to 2009
FY 2007 FY 2008 FY 2009Spaces Spaces Spaces
Faculty and Staff 2,779 2,251 2,000Students1 137 416 140Non-Carnegie Mellon 10 10 10Total Permits Issued 2,926 2,677 2,150
1. Due to the removal of the stacked parking option, fewer student permits were issued in FY2009
7.22

7.24
7.25