campus computing 2004 - southeastern louisiana university
TRANSCRIPT

Campus Computing 2004 Executive Summary
The Campus Computing Survey, a part of the Campus Computing Project, is an annual national survey of information technology in higher education. The survey focuses primarily on academic computing issues. Southeastern Louisiana University submitted the 2004 Campus Computing Survey on September 7, 2004. This report shows a comparison of campus computing at Southeastern at that time with Public Universities and All Institutions who responded, based on the 2004 Campus Computing Survey. Uses of Information Technology • Southeastern is quite competitive with other institutions and public universities on the use of
computer facilities and resources in classrooms. Southeastern rates higher than All Institutions and Public Universities in use of electronic mail. Internet resources has the lowest rate of usage in classes at Southeastern.
0 10 20 30 40 50 60 70 80 90 100
i Institutional Research and Assessment

Points of Excellence
• Southeastern ranked quite well in the quality of its Web site, providing most of the academic resources and services to students, faculty and staff. Admission and financial aid applications, course catalog, course registration, fee-payment, on-line courses, and IT support resources and training are just some of the resources and services available through Southeastern’s Web site.
• Southeastern is among 41% of All Institutions and 35% of Public Universities that require computer
instruction or competency for all undergraduate students. • The technology infrastructure at Southeastern is outstanding. Almost in all the categories,
Southeastern rates better than the average rate of All Institutions and Public Universities.
0 1 2 3 4 5 6 7
Areas for Improvement • The number of FTE help desk/technical support personnel at Southeastern is quite low. The average
number of personnel at All Institutions is 36 and at Public Universities is 115, while Southeastern has only 20. The ratio user support (enrollment/help desk) at Southeastern is 738 students to 1 help desk person, while the ratio at All Institutions is 280:1 and at Public Universities is 211:1.
• Southeastern does not have a written policy for duplication of copyrighted software/software piracy
and downloading commercial music/videos from the web, while most institutions already have one.
ii Institutional Research and Assessment

• While campus network and Internet access are provided to most faculty at Southeastern, the percentage of classrooms connected to the campus network/have Internet access is quite low. Areas that need improvement are student housing and wireless network access. Only 10% of the dorms have network connection, and only 4% of the classrooms are covered or served by wireless network access.
0 10 20 30 40 50 60 70 80 90 100
• The total academic computing budget 2003-2004 at Southeastern was $1,900,000. The budget is
approximately 62% of the average budget for All Institutions and 19% of the average budget for Public Universities. Southeastern’s total academic computing budget increased $250,000 for 2004-2005 compared to 2003-2004. The total academic computing budget is about 70% of total campus IT spending, and the total campus IT spending is about 4% of total campus budget at Southeastern.
0
2,000,000
4,000,000
6,000,000
8,000,000
10,000,000
12,000,000
1,900,000
3,086,045
10,062,065
iii Institutional Research and Assessment

Campus Computing 2004
Southeastern All Institutions
Public Universities
Number of Respondents 1 516 72General Campus Policies About Desktop ComputersDoes your Institution have: % Yes % Yes
A formal policy promoting or mandating computers/technology resources forCurriculum utilization? No 29.7 % 31.9 %Undergraduates? No 22.4 % 33.3 %Graduate/professional students? No 34.2 % 37.5 %Distance education? No 28.8 % 37.5 %
A computer instruction/competency, technology/information literacy requirement forAll undergraduates? Yes 40.7 % 34.7 %All faculty? No 8.3 % 2.8 %All administration? No 8.7 % 4.2 %All staff? No 9.5 % 2.8 %
A special computer use/technology fee or annual/term computer use charge for all students? Yes 51.0 % 72.2 %Total annual computer use fee (where charged) $ 120 $ 92 $ 115
A written policy/code of conduct/acceptable use policy forCampus e-mail accounts? Yes 95.0 % 97.2 %Campus-hosted individual/personal Web pages? Yes 79.5 % 93.1 %Duplication of copyrighted software/software piracy? No 92.9 % 97.2 %Fair use of copyrighted content (books, articles, etc.)? Yes 88.4 % 90.3 %Downloading commercial music/videos from the web? No 76.3 % 86.1 %
Operating systems recommended/supported % Yes % YesMac OS 9 or earlier No 40.5 % 55.6 %Mac OS X No 77.8 % 90.3 %UNIX Yes 60.8 % 87.5 %Linux Yes 60.4 % 80.6 %Windows 95/98/ME Yes 39.8 % 40.3 %Windows NT Workstation Yes 35.3 % 55.6 %Windows 2000 Yes 82.2 % 87.5 %Windows XP Yes 95.8 % 95.8 %Open VMS Yes 12.7 % 12.5 %Novell Yes 35.1 % 40.3 %
1 Institutional Research and Assessment
Campus Computing 2004
Southeastern All Institutions
Public Universities
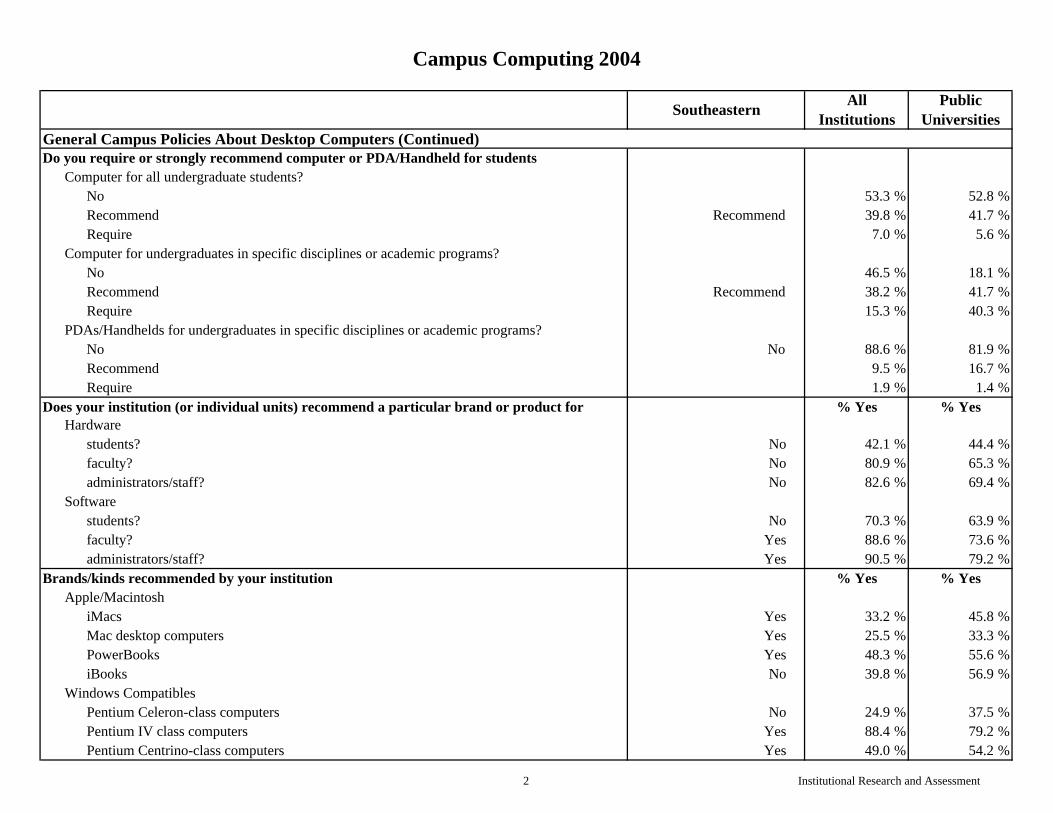
General Campus Policies About Desktop Computers (Continued)Do you require or strongly recommend computer or PDA/Handheld for students
Computer for all undergraduate students?No 53.3 % 52.8 %Recommend Recommend 39.8 % 41.7 %Require 7.0 % 5.6 %
Computer for undergraduates in specific disciplines or academic programs?No 46.5 % 18.1 %Recommend Recommend 38.2 % 41.7 %Require 15.3 % 40.3 %
PDAs/Handhelds for undergraduates in specific disciplines or academic programs?No No 88.6 % 81.9 %Recommend 9.5 % 16.7 %Require 1.9 % 1.4 %
Does your institution (or individual units) recommend a particular brand or product for % Yes % YesHardware
students? No 42.1 % 44.4 %faculty? No 80.9 % 65.3 %administrators/staff? No 82.6 % 69.4 %
Softwarestudents? No 70.3 % 63.9 %faculty? Yes 88.6 % 73.6 %administrators/staff? Yes 90.5 % 79.2 %
Brands/kinds recommended by your institution % Yes % YesApple/Macintosh
iMacs Yes 33.2 % 45.8 %Mac desktop computers Yes 25.5 % 33.3 %PowerBooks Yes 48.3 % 55.6 %iBooks No 39.8 % 56.9 %
Windows CompatiblesPentium Celeron-class computers No 24.9 % 37.5 %Pentium IV class computers Yes 88.4 % 79.2 %Pentium Centrino-class computers Yes 49.0 % 54.2 %
2 Institutional Research and Assessment

Campus Computing 2004
Southeastern All Institutions
Public Universities
General Campus Policies About Desktop Computers (Continued)Brands/kinds recommended by your institution % Yes % Yes
Unix/Linux SystemsApple No 23.4 % 44.4 %IBM Yes 43.2 % 69.4 %Sun No 23.7 % 29.2 %Dell Yes 19.7 % 31.9 %Silicon Graphics No 5.0 % 18.1 %HP/Compaq No 33.2 % 63.9 %Other No 5.8 % 5.6 %
As of Fall 2004, will your institution have an initial or single sign-on campus portal?Campus portal not available as of Fall 2004 20.5 % 6.9 %Portal issue under discussion/review 23.4 % 19.4 %
Portal being installed/under development in 2004/05Portal being installed/under development in
2004/05
19.0 % 22.2 %
Campus portal up and functioning for Fall 2004 37.1 % 51.4 %Our campus portal is/will be:
Homegrown/local 20.5 % 19.1 %Blackboard 8.2 % 4.8 %Campus Cruiser 2.4 % 0 %Campus Pipeline/Sungard SCT 22.1 % 28.6 %eCollege 0.5 % 0 %Jenzabar 4.5 % 0 %Oracle 7.8 % 12.7 %PeopleSoft PeopleSoft 8.5 % 11.1 %Unicon/Academus 2.4 % 0 %UPortal 7.3 % 12.7 %WebCT 0.7 % 0 %Other 15.3 % 11.1 %
3 Institutional Research and Assessment

f
Campus Computing 2004
Southeastern All Institutions
Public Universities
Uses of Information TechnologyHow strongly do you agree or strongly agree: % Agree or % Agree or
Strongly Agree Strongly AgreeFaculty have unreasonable expectations about user support Agree 48.5 % 41.7 %Technology has improved instruction on my campus Strongly Agree 90.3 % 93.1 %We plan to require all students to own a computer by Fall 2005 Disagree 10.4 % 6.9 %Access to Internet 2 by Fall 2005 is essential to our long-term tech needs Strongly Agree 33.3 % 85.9 %Our administrative systems provide effective support for conducting college business Agree 82.4 % 76.4 %My campus does a good job of planning our short- and mid- range technical needs Agree 80.3 % 73.6 %We are experiencing major cost over-runs/unexpected costs in our ERP deployment activities Strongly Agree 13.8 % 12.5 %Current IT budget cuts will severely impede efforts to enhance eLearning Strongly Agree 29.5 % 33.3 %Current IT budget cuts will severely impede/interrupt ERP replacement/upgrade efforts Strongly Agree 24.6 % 22.2 %Open source offers a viable alternative for key campus ERP applications Disagree 28.9 % 29.6 %Open source will play an increasing important role in our campus IT strategy Strongly Agree 51.9 % 63.4 %
The single most important IT issue over the next 2 or 3 years is: % Most % Most Important Important
Providing online/distance education via the web 7.5 % 8.3 %Providing adequate user support 10.0 % 4.2 %Assist faculty integrate technology into instruction 18.5 % 8.3 %
Financing replacement of aging hardware/softwareFinancing replacement oaging hardware/software
11.2 % 11.1 %
Moving toward campus-wide wireless networks 2.7 % 6.9 %Integrating academic and administrative IT services 3.3 % 2.8 %Providing student portal services 4.6 % 1.4 %Network and data security 21.2 % 20.8 %Hiding/retaining qualified IT staff 3.7 % 5.6 %Upgrading/replacing administrative IT/ERP systems 17.2 % 30.6 %
Current IT/Computer Facilities and Resources Average AverageHeadcount enrollment on campus as of Spring 2004 14,761 10,048 24,265Number of institution owned desktop or notebook computers as of May 2004 2,500 3,223 10,263Number of institution owned Unix workstations as of May 2004 10 334 570Number of personally owned computers used on campus as of May 2004 250 3,441 11,536
4 Institutional Research and Assessment

Campus Computing 2004
Southeastern All Institutions
Public Universities
Current IT/Computer Facilities and Resources (Continued)Proportion of individuals who own desktop or notebook computers
StudentsDesktops 55 % 53.9 % 57.7 %Notebooks 25 % 30.7 % 31.5 %
FacultyDesktops 90 % 70.1 % 75.5 %Notebooks 15 % 24.4 % 26.4 %
Number of desktop computers purchased by: Average Average2003-04 (estimate)
Students 4,000 111 274Faculty 300 174 497Administrators/staff 300 191 480Campus labs, clusters & other instructional use 220 199 346
2004-05 (estimate)Students 4,000 646 1,872Faculty 350 163 409Administrators/staff 350 197 491Campus labs, clusters & other instructional use 220 195 346
Number of notebook computers purchased by: Average Average2003-04 (estimate)
Students 2,500 370 899Faculty 75 71 191Administrators/staff 50 52 133Campus labs, clusters & other instructional use 60 28 49
2004-05 (estimate)Students 3,000 424 1,012Faculty 150 89 226Administrators/staff 200 63 154Campus labs, clusters & other instructional use 50 40 70
Number of desktop computer labs, clusters and classrooms as of May 2004 60 88 170How many dedicated to departments or units? 28 36 70
5 Institutional Research and Assessment

Campus Computing 2004
Southeastern All Institutions
Public Universities
Current IT/Computer Facilities and Resources (Continued)Number of desktop computers/workstations in all labs/classrooms/clusters as of May 2004
Computers 1,470 907 1,781Unix Workstations 0 34 132
Number of network servers as of May 2004 50 138 433Percentage of operating systems installed on institutionally-owned computers and servers
Computers/clientsMac 5 % 10.6 % 10.1 %Win 95/98/ME 53 % 8.3 % 9.8 %Win 2000 0 % 26.7 % 26.5 %Win XP 40 % 50.9 % 44.5 %Unix 1 % 2.3 % 5.9 %Linux 1 % 2.4 % 5.2 %
Network serversMac 0 % 2.7 % 3.5 %Win NT 0 % 7.4 % 8.8 %Win 2000 35 % 32.7 % 27.6 %Win 2003 0 % 20.7 % 19.9 %Unix 5 % 12.9 % 19.8 %Linux 35 % 10.4 % 12.6 %Novell 25 % 11.5 % 8.3 %
Number of FTE help desk/technical support personnel 20 35.9 114.9Ratio user support (enrollment/help desk) 738 279.9 211.2Percentage of faculty with individual/personal Web page 1 29.0 32.9Percentage of classes that use:
Computer-based classrooms/labs 35 % 34.9 % 28.3 %Computer-based simulations/exercises 20 % 18.9 % 17.9 %Presentation handouts 30 % 53.1 % 50.1 %Electronic mail 90 % 75.6 % 82.3 %Commercial courseware/instructional resources 15 % 28.3 % 25.9 %Internet resources 10 % 56.6 % 56.7 %Course management tools for online course resources 25 % 40.1 % 42.6 %Web pages for class materials and resources 40 % 40.3 % 49.7 %
6 Institutional Research and Assessment
Campus Computing 2004
Southeastern All Institutions
Public Universities
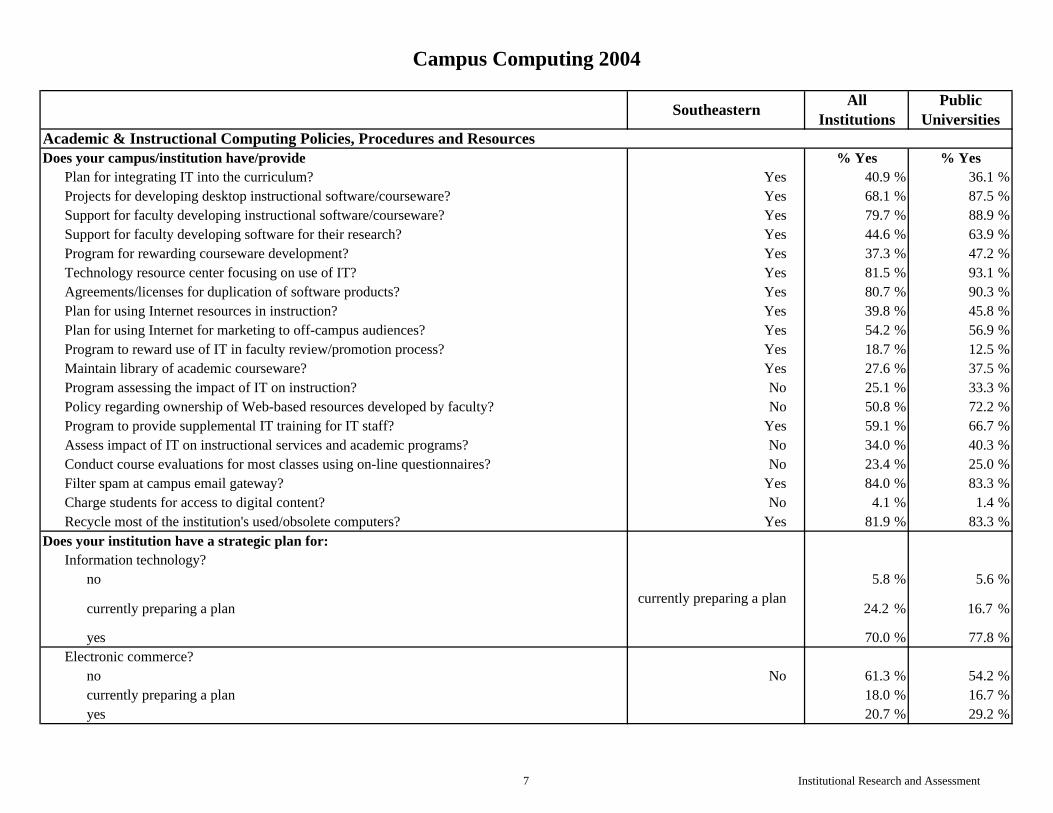
Academic & Instructional Computing Policies, Procedures and ResourcesDoes your campus/institution have/provide % Yes % Yes
Plan for integrating IT into the curriculum? Yes 40.9 % 36.1 %Projects for developing desktop instructional software/courseware? Yes 68.1 % 87.5 %Support for faculty developing instructional software/courseware? Yes 79.7 % 88.9 %Support for faculty developing software for their research? Yes 44.6 % 63.9 %Program for rewarding courseware development? Yes 37.3 % 47.2 %Technology resource center focusing on use of IT? Yes 81.5 % 93.1 %Agreements/licenses for duplication of software products? Yes 80.7 % 90.3 %Plan for using Internet resources in instruction? Yes 39.8 % 45.8 %Plan for using Internet for marketing to off-campus audiences? Yes 54.2 % 56.9 %Program to reward use of IT in faculty review/promotion process? Yes 18.7 % 12.5 %Maintain library of academic courseware? Yes 27.6 % 37.5 %Program assessing the impact of IT on instruction? No 25.1 % 33.3 %Policy regarding ownership of Web-based resources developed by faculty? No 50.8 % 72.2 %Program to provide supplemental IT training for IT staff? Yes 59.1 % 66.7 %Assess impact of IT on instructional services and academic programs? No 34.0 % 40.3 %Conduct course evaluations for most classes using on-line questionnaires? No 23.4 % 25.0 %Filter spam at campus email gateway? Yes 84.0 % 83.3 %Charge students for access to digital content? No 4.1 % 1.4 %Recycle most of the institution's used/obsolete computers? Yes 81.9 % 83.3 %
Does your institution have a strategic plan for:Information technology?
no 5.8 % 5.6 %
currently preparing a plancurrently preparing a plan
24.2 % 16.7 %
yes 70.0 % 77.8 %Electronic commerce?
no No 61.3 % 54.2 %currently preparing a plan 18.0 % 16.7 %yes 20.7 % 29.2 %
7 Institutional Research and Assessment

Campus Computing 2004
Southeastern All Institutions
Public Universities
Academic & Instructional Computing Policies, Procedures and Resources (Continued)Does your institution have a strategic plan for:
Instructional technology/instruction integration?no 28.3 % 26.4 %
currently preparing a plancurrently preparing a plan
30.6 % 27.8 %
yes 41.1 % 45.8 %Deploying course management tools?
no 26.9 % 20.8 %
currently preparing a plancurrently preparing a plan
20.7 % 16.7 %
yes 52.4 % 62.5 %Distance education?
no 41.0 % 22.2 %currently preparing a plan 19.0 % 18.1 %yes yes 40.0 % 59.7 %
Campus portal services?no 31.5 % 15.3 %
currently preparing a plancurrently preparing a plan
32.1 % 37.5 %
yes 36.4 % 47.2 %Wireless networks?
no 15.5 % 5.6 %currently preparing a plan 29.2 % 27.8 %yes yes 55.3 % 66.7 %
Web services (integration/deployment)?no 25.2 % 23.6 %
currently preparing a plancurrently preparing a plan
26.1 % 31.9 %
yes 48.7 % 44.4 %
8 Institutional Research and Assessment

Campus Computing 2004
Southeastern All Institutions
Public Universities
Academic & Instructional Computing Policies, Procedures and Resources (Continued)Does your institution have a strategic plan for:
Network security?no 10.8 % 8.3 %
currently preparing a plancurrently preparing a plan
27.5 % 20.8 %
yes 61.7 % 70.8 %IT disaster recovery?
no 12.2 % 5.6 %currently preparing a plan 32.3 % 26.4 %yes Yes 55.5 % 68.1 %
Administrative Systems/ERP upgrade/replacement?no 17.3 % 11.3 %
currently preparing a plancurrently preparing a plan
16.7 % 19.7 %
yes 66.1 % 69.0 %Digital content management?
no 51.1 % 41.7 %
currently preparing a plancurrently preparing a plan
31.9 % 33.3 %
yes 17.0 % 25.0 %Has your institution established a single product standard for:
Desktop/notebook computer operating system?No No 66.5 % 91.7 %Macintosh 0.2 % 0 %Win 2000 5.4 % 0 %Win XP 27.9 % 8.3 %Linux 0 % 0 %
9 Institutional Research and Assessment

Campus Computing 2004
Southeastern All Institutions
Public Universities
Academic & Instructional Computing Policies, Procedures and Resources (Continued)Has your institution established a single product standard for:
Desktop/notebook product or manufacturer?No No 63.3 % 90.3 %Apple 0.2 % 0 %Dell 19.2 % 5.6 %Gateway 7.2 % 1.4 %HP/Compaq 3.7 % 0 %IBM 3.1 % 1.4 %Other 3.5 % 1.4 %
Course management system?No 11.6 % 13.9 %Blackboard Blackboard 44.8 % 29.2 %eCollege 2.1 % 0 %Sakai 0.8 % 4.2 %WebCT 31.3 % 50.0 %Other 9.5 % 2.8 %
What academic resources/services are on your campus Web site? % Yes % YesUndergraduate admissions applications Yes 94.2 % 97.2 %Financial aid application Yes 83.8 % 95.8 %Current course catalog Yes 98.3 % 100.0 %Program/major/degree requirements Yes 93.4 % 95.8 %Course registration Yes 84.1 % 98.6 %Course add/drop options Yes 78.1 % 98.6 %E-commerce (fee payments, etc.) Yes 65.4 % 88.9 %On-line courses (i.e., full course online) Yes 72.0 % 90.3 %Student ePortfolio Yes 21.5 % 29.2 %Library/card catalog Yes 92.8 % 93.1 %Interlibrary loan services Yes 83.2 % 87.5 %Journals and reference resources Yes 88.8 % 93.1 %Course reserves Yes 59.0 % 80.6 %Student transcripts Yes 71.0 % 84.7 %IT support resources Yes 88.8 % 94.4 %
10 Institutional Research and Assessment

Campus Computing 2004
Southeastern All Institutions
Public Universities
Academic & Instructional Computing Policies, Procedures and Resources (Continued)What academic resources/services are on your campus Web site? % Yes % Yes
IT training/tutorials Yes 71.2 % 84.7 %Instructional software Yes 55.5 % 83.3 %Desktop software (MS Office, etc) No 31.7 % 47.2 %Degree audit software No 54.9 % 68.1 %Faculty/staff directory Yes 95.9 % 98.6 %Student newspaper Yes 57.8 % 84.7 %Student handbook Yes 79.1 % 86.1 %Athletic event schedule Yes 87.0 % 98.6 %Alumni information/services Yes 84.7 % 94.4 %Press releases/media services Yes 89.7 % 95.8 %Campus book store Yes 75.4 % 83.3 %Campus resale services Yes 23.6 % 37.5 %Personalized student calendar Yes 34.6 % 37.5 %Campus OneCard account services No 27.5 % 51.4 %
Future Issues Affecting Campus ComputingHow important are the following to campus computing and IT planning over the next 2-3 years? (Scale from 1 ="Not Important" to 7 ="Very Important")
Average Average
Operating system/interface/development toolsWindows 2000 Desktop 1 3.0 3.5Windows 2000 Server 6 3.6 3.7Windows XP 6 6.2 6.0Windows 2003 Server 6 6.0 5.8Macintosh OS 9 (& earlier) 2 1.9 2.3Macintosh OS X (client) 4 4.5 4.6Macintosh OS X (server) 1 3.2 3.8Solaris 1 3.5 5.0Unix 6 4.5 5.3Linux (client) 5 3.6 4.7Linux (server) 6 5.0 5.9
11 Institutional Research and Assessment

Campus Computing 2004
Southeastern All Institutions
Public Universities
Future Issues Affecting Campus Computing (Continued)How important are the following to campus computing and IT planning over the next 2-3 years? (Scale from 1 ="Not Important" to 7 ="Very Important")
Average Average
HardwareNotebook computers 7 6.0 6.0Macintosh computers 4 3.7 4.0Unix workstations 5 3.0 4.3Tablet computers 6 4.0 4.1PDAs/handheld computers 6 4.3 4.9Cellular Phones 1 4.5 5.0
Instructional applications and resourcesDeveloping instructional software 7 4.5 4.8Using instructional software in classes 7 6.1 6.2Using instructional software as a supplement to class 7 6.2 6.4Computer-based classroom presentation facilities 7 6.4 6.3Internet resources for instruction 7 6.3 6.4Web pages for classes 7 5.9 6.0Web-based tutorials 7 5.5 5.6e-Books (e-textbooks) 6 4.3 4.1Course management systems 7 6.4 6.5On-line course evaluation 7 5.6 5.8
User support services/campus IT servicesOn-line IT training 7 5.1 5.3On-line technical support 7 5.6 5.8Computer resale program 7 3.2 3.3Computer repair services 7 4.4 4.0Help-desk services 7 6.4 6.6Alumni e-mail accounts 7 4.1 4.6Alumni services via the campus web site 7 5.0 4.9Student eProfiles 7 4.9 5.2
12 Institutional Research and Assessment

Campus Computing 2004
Southeastern All Institutions
Public Universities
Future Issues Affecting Campus Computing (Continued)How important are the following to campus computing and IT planning over the next 2-3 years? (Scale from 1 ="Not Important" to 7 ="Very Important")
Average Average
Networking & lnternet/Web issues & resourcesMerging data & telecommunication networks 7 5.4 5.9Wireless networks 6 6.2 6.5Wi-Max networks 5 3.9 4.5Bluetooth 4 3.5 3.8Voice over IP 7 5.0 5.3Microsoft Exchange 2 4.4 4.3Java 6 5.0 5.6XML (SOAP) 6 4.9 5.3.NET (Microsoft) 6 4.0 4.2Open Net (Sun One) 2 2.9 3.8Shockwave 4 3.8 4.0Quicktime Player 2 4.3 4.5Real Player 4 4.4 4.4Microsoft Media Player 4 4.8 4.7Gigabit Ethernet 6 6.3 6.4ATM 7 2.6 2.6Grid Computing 3 3.4 5.0Adobe Acrobat 6 5.6 5.6Internet 2 4 4.5 6.1Internet videoconferencing 7 5.4 6.0Network security 7 6.8 6.9Identify management 7 6.0 6.5E-commerce on the Web 6 5.4 5.6Open source software 5 4.7 5.2Student portal services 6 6.0 6.3IMS standards 5 4.5 5.0Data encryption 5 5.6 5.9
13 Institutional Research and Assessment

Campus Computing 2004
Southeastern All Institutions
Public Universities
Future Issues Affecting Campus Computing (Continued)How important are the following to campus computing and IT planning over the next 2-3 years? (Scale from 1 ="Not Important" to 7 ="Very Important")
Average Average
Networking & lnternet/Web issues & resourcesCourse management systems 4 5.7 5.8Software licensing 6 6.2 6.2Instant messaging 6 4.6 4.6Controlling/filtering spam 7 6.5 6.6
Administrative software/ERP--Upgrade or replacementAccounting/Financial Management 6 5.6 5.5Admissions/Recruitment 6 5.9 6.0Alumni 4 5.0 4.8CRM software 2 4.4 4.1Development 4 4.9 4.8eProceurement/Purchasing 6 4.9 5.2Human Resources 6 5.4 5.5Student Financial Aid 6 5.8 5.9Student Information Systems (SIS) 6 6.0 6.1
Vendor Services/OutsourcingOutsourcing ERP services 1 2.5 2.4Outsourcing instructional technology services 1 2.4 2.3Outsourcing user support 1 2.5 2.2eProcurement 1 3.3 3.4Student/campus portal 1 4.2 4.1Web hosting 1 3.4 3.3
14 Institutional Research and Assessment

Campus Computing 2004
Southeastern All Institutions
Public Universities
Rating the Technology Infrastructure(Scale from 1 ="Poor" to 7 ="Excellent") Average Average
Computer networks and data communication 6 6.0 6.0Telecommunications and phone system 6 5.5 5.7Wireless networks 6 4.4 4.7User support services 6 5.5 5.3On-line reference resources in campus library/library system 6 5.8 5.8Web resources to support instruction 6 5.2 5.3E-commerce capacity 5 3.8 4.1Campus web site services/student portal 6 4.6 4.8Network security against hackers and virus attacks 6 5.3 5.4Disaster planning 6 4.4 4.6IT training for faculty 6 4.6 4.7IT training for students 6 4.1 4.3Campus portal 6 3.7 4.1
Addressing Budget Issues by:Reducing purchases of computer technology
Doing this already 30.5 % 33.3 %Beginning in 2004-05 5.2 % 0 %Reviewing for 2004-05 8.9 % 9.7 %Decided not to do Decided not to do 55.4 % 56.9 %
Charging fees to departments and service unitsDoing this already Doing this already 22.6 % 61.1 %Beginning in 2004-05 3.9 % 2.8 %Reviewing for 2004-05 15.4 % 16.7 %Decided not to do 58.1 % 19.4 %
Requiring a computer/IT fee for all studentsDoing this already Doing this already 49.8 % 68.1 %Beginning in 2004-05 1.9 % 0 %Reviewing for 2004-05 10.0 % 16.7 %Decided not to do 38.2 % 15.3 %
15 Institutional Research and Assessment

Campus Computing 2004
Southeastern All Institutions
Public Universities
Addressing Budget Issues by: (Continued)Leasing rather than buying hardware
Doing this already 20.9 % 20.8 %Beginning in 2004-05 1.5 % 1.4 %Reviewing for 2004-05 14.1 % 19.4 %Decided not to do Decided not to do 63.5 % 58.3 %
More active recycling of older equipment to other departments/unitsDoing this already 75.9 % 83.3 %Beginning in 2004-05 1.7 % 2.8 %Reviewing for 2004-05 4.4 % 4.2 %Decided not to do Decided not to do 18.0 % 9.7 %
Reducing hours in public access facilitiesDoing this already 15.3 % 22.2 %Beginning in 2004-05 2.3 % 0 %Reviewing for 2004-05 7.9 % 9.7 %Decided not to do Decided not to do 74.5 % 68.1 %
Reducing servicesDoing this already 21.6 % 33.3 %Beginning in 2004-05 3.7 % 5.6 %Reviewing for 2004-05 Reviewing for 2004-05 11.6 % 13.9 %Decided not to do 63.1 % 47.2 %
Reorganizing operationsDoing this already 49.0 % 65.3 %Beginning in 2004-05 7.7 % 2.8 %Reviewing for 2004-05 Reviewing for 2004-05 20.5 % 25.0 %Decided not to do 22.8 % 6.9 %
Reducing StaffDoing this already 22.4 % 31.9 %Beginning in 2004-05 3.1 % 1.4 %Reviewing for 2004-05 8.3 % 11.1 %Decided not to do Decided not to do 66.2 % 55.6 %
16 Institutional Research and Assessment

Campus Computing 2004
Southeastern All Institutions
Public Universities
Addressing Budget Issues by: (Continued)Using information technology to reduce instructional costs
Doing this already Doing this already 43.4 % 45.8 %Beginning in 2004-05 3.7 % 6.9 %Reviewing for 2004-05 22.4 % 25.0 %Decided not to do 30.5 % 22.2 %
Making greater use of student assistantsDoing this already Doing this already 72.0 % 87.5 %Beginning in 2004-05 3.9 % 1.4 %Reviewing for 2004-05 8.5 % 4.2 %Decided not to do 15.6 % 6.9 %
Outsourcing Internet access to commercial providersDoing this already Doing this already 19.3 % 18.1 %Beginning in 2004-05 1.2 % 0 %Reviewing for 2004-05 7.0 % 12.5 %Decided not to do 72.6 % 69.4 %
Outsourcing computing services to commercial providersDoing this already 12.4 % 11.1 %Beginning in 2004-05 1.7 % 0 %Reviewing for 2004-05 7.5 % 9.7 %Decided not to do Decided not to do 78.4 % 79.2 %
Outsourcing student portal services to commercial providersDoing this already 4.3 % 1.4 %Beginning in 2004-05 1.5 % 0 %Reviewing for 2004-05 Reviewing for 2003-04 10.8 % 9.7 %Decided not to do 83.4 % 88.9 %
Delaying/deffering ERP deployment/replacement/upgradesDoing this already 19.3 % 20.8 %Beginning in 2004-05 2.9 % 2.8 %Reviewing for 2004-05 9.7 % 9.7 %Decided not to do Decided not to do 68.2 % 66.7 %
17 Institutional Research and Assessment

Campus Computing 2004
Southeastern All Institutions
Public Universities
Addressing Budget Issues by: (Continued)Deferring/reducing use of consultants on IT projects
Doing this already 43.5 % 43.1 %Beginning in 2004-05 3.3 % 5.6 %Reviewing for 2004-05 11.4 % 15.3 %Decided not to do Decided not to do 41.8 % 36.1 %
Migrating to Linux desktop applicationsDoing this already 6.4 % 2.8 %Beginning in 2004-05 1.9 % 0 %Reviewing for 2004-05 Reviewing for 2003-04 25.7 % 47.2 %Decided not to do 66.0 % 50.0 %
Migrating to Open Source administrative/ERP applicationsDoing this already 5.4 % 0 %Beginning in 2004-05 2.7 % 6.9 %Reviewing for 2004-05 17.8 % 23.6 %Decided not to do Decided not to do 74.1 % 69.4 %
Strategic, Budget and Personnel Issues(Scale from 1 ="Not Important" to 7 ="Very Important") Average Average
Assessing benefits of current investment 7 5.8 5.9Clarifying goals and campus plans for technology resources 7 6.3 6.3Providing incentives for faculty to use technology 6 4.8 5.0Allocating funds to support expanded services 6 5.4 5.4Faculty concerns about benefits of computing in the curriculum 6 4.9 4.9Administrative concerns about benefits of computing in the curriculum 6 4.6 4.4Developing/strengthening vendor relationships 6 4.9 4.9Charging fees to students for computer/network access 6 4.0 4.8Establishing/maintaining campus-wide hardware standards 7 5.8 5.5Establishing/maintaining campus-wide software standards 7 5.9 5.6Operating a computer resale program for students & faculty 5 2.8 3.0Developing budget model to replace aging equipment 6 6.0 6.0Using Intemet/Web resources in instruction 7 6.0 5.9Using technology based commercial curriculum products 6 4.8 4.4
18 Institutional Research and Assessment

Campus Computing 2004
Southeastern All Institutions
Public Universities
Strategic, Budget and Personnel Issues (Continued)(Scale from 1 ="Not Important" to 7 ="Very Important") Average Average
Using IT to enhance distance education program 7 5.0 5.4Negotiating site licensing with textbook publishers 7 4.0 3.8Negotiating site licensing with academic publishers 6 4.2 4.1Sharing digital resources with other campuses/institutions 6 4.9 5.2Developing campus policies for Web-based intellectual property 7 5.4 5.2Helping IT personnel stay current with new technologies 7 6.2 6.0Retaining current IT personnel, given off-campus competition 7 5.7 5.5Electronic commerce 5 4.9 5.2Web-based instructional/course management systems 6 6.1 6.1Acquiring IT resources via corporate grants from key vendors 5 4.8 4.9Providing a "campus portal" for Web-based student services 6 6.0 6.3Moving more of our user support services to the Web 6 5.8 5.8Surveying student and faculty about IT issues and services 6 5.6 5.8Assessing the return on investment for IT spending/resources 6 5.4 5.4Researching the total cost of ownership for IT purchases 5 5.1 5.3Supporting PDA/handheld devices 5 4.4 5.0Managing/distributing digital learning resources 6 5.0 5.3Controlling/restricting file sharing of commercial content 6 5.4 5.3Deploying/migrating to Open Source applications 7 3.7 4.3
This Year's Computing Budget Compared to Last Year's Total academic computing budget
Reduced >5% 8.9 % 1.4 %Reduced 3-5% 6.4 % 11.1 %Reduced 1-3% 9.1 % 19.4 %No change 37.8 % 36.1 %Increased 1-3% Increased 1-3% 25.1 % 20.8 %Increased 3-5% 6.8 % 6.9 %Increased >5% 6.0 % 4.2 %
19 Institutional Research and Assessment

Campus Computing 2004
Southeastern All Institutions
Public Universities
This Year's Computing Budget Compared to Last Year's (Continued)Total administrative computing budget
Reduced >5% 8.7 % 1.4 %Reduced 3-5% 7.0 % 13.9 %Reduced 1-3% 9.7 % 12.5 %No change 36.7 % 36.1 %Increased 1-3% Increased 1-3% 23.2 % 13.9 %Increased 3-5% 7.0 % 9.7 %Increased >5% 7.9 % 12.5 %
Purchases of computers by academic computing unitsReduced >5% 9.1 % 2.8 %Reduced 3-5% 4.6 % 6.9 %Reduced 1-3% 10.0 % 16.7 %No change 50.8 % 52.8 %Increased 1-3% 17.6 % 15.3 %Increased 3-5% Increased 3-5% 3.9 % 2.8 %Increased >5% 4.1 % 2.8 %
Purchases of computers by administrative computing unitsReduced >5% 9.7 % 2.8 %Reduced 3-5% 5.4 % 6.9 %Reduced 1-3% 10.8 % 15.3 %No change 51.0 % 54.2 %Increased 1-3% 17.2 % 18.1 %Increased 3-5% Increased 3-5% 3.7 % 2.8 %Increased >5% 2.3 % 0 %
Purchases of computers by academic departmentsReduced >5% 8.9 % 2.8 %Reduced 3-5% 4.8 % 5.6 %Reduced 1-3% 9.3 % 16.7 %No change 52.5 % 50.0 %Increased 1-3% 18.3 % 19.4 %Increased 3-5% Increased 3-5% 3.7 % 2.8 %Increased >5% 2.5 % 2.8 %
20 Institutional Research and Assessment

Campus Computing 2004
Southeastern All Institutions
Public Universities
This Year's Computing Budget Compared to Last Year's (Continued)All institutional purchases of desktop/notebook computers
Reduced >5% 9.3 % 2.8 %Reduced 3-5% 5.6 % 6.9 %Reduced 1-3% 10.8 % 22.2 %No change 40.7 % 40.3 %Increased 1-3% 21.6 % 18.1 %Increased 3-5% Increased 3-5% 5.6 % 4.2 %Increased >5% 6.4 % 5.6 %
Network serversReduced >5% 4.6 % 2.8 %Reduced 3-5% 4.6 % 1.4 %Reduced 1-3% 7.1 % 9.7 %No change 44.8 % 51.4 %Increased 1-3% 22.8 % 20.8 %Increased 3-5% Increased 3-5% 10.0 % 9.7 %Increased >5% 6.0 % 4.2 %
Server software and related productsReduced >5% 4.4 % 1.4 %Reduced 3-5% 3.9 % 2.8 %Reduced 1-3% 7.3 % 12.5 %No change 48.3 % 51.4 %Increased 1-3% Increased 1-3% 22.6 % 22.2 %Increased 3-5% 8.7 % 6.9 %Increased >5% 4.8 % 2.8 %
User training and supportReduced >5% 5.6 % 2.8 %Reduced 3-5% 3.3 % 1.4 %Reduced 1-3% 9.3 % 20.8 %No change No change 58.3 % 58.3 %Increased 1-3% 16.2 % 12.5 %Increased 3-5% 4.4 % 2.8 %Increased >5% 2.9 % 1.4 %
21 Institutional Research and Assessment

Campus Computing 2004
Southeastern All Institutions
Public Universities
This Year's Computing Budget Compared to Last Year's (Continued)Campus portal services
Reduced >5% 3.7 % 1.4 %Reduced 3-5% 1.4 % 0 %Reduced 1-3% 3.3 % 4.2 %No change 57.3 % 55.6 %Increased 1-3% Increased 1-3% 17.6 % 12.5 %Increased 3-5% 7.7 % 15.3 %Increased >5% 9.1 % 11.1 %
ERP software and servicesReduced >5% 3.5 % 1.4 %Reduced 3-5% 1.5 % 1.4 %Reduced 1-3% 3.7 % 5.6 %No change No change 52.9 % 50.0 %Increased 1-3% 16.8 % 13.9 %Increased 3-5% 8.7 % 5.6 %Increased >5% 12.9 % 22.2 %
eCommerce/campus commerce servicesReduced >5% 3.9 % 1.4 %Reduced 3-5% 2.1 % 1.4 %Reduced 1-3% 3.5 % 5.6 %No change No change 67.3 % 72.2 %Increased 1-3% 15.5 % 12.5 %Increased 3-5% 4.6 % 4.2 %Increased >5% 3.1 % 2.8 %
External service providersReduced >5% 5.0 % 4.2 %Reduced 3-5% 4.6 % 1.4 %Reduced 1-3% 8.7 % 9.7 %No change No change 66.2 % 72.2 %Increased 1-3% 8.7 % 5.6 %Increased 3-5% 4.1 % 5.6 %Increased >5% 2.7 % 1.4 %
22 Institutional Research and Assessment

Campus Computing 2004
Southeastern All Institutions
Public Universities
This Year's Computing Budget Compared to Last Year's (Continued)Security issues
Reduced >5% 2.1 % 0 %Reduced 3-5% 1.5 % 0 %Reduced 1-3% 3.3 % 2.8 %No change 33.6 % 26.4 %Increased 1-3% Increased 1-3% 24.7 % 23.6 %Increased 3-5% 18.9 % 22.2 %Increased >5% 15.8 % 25.0 %
Consultants for IT projects and servicesReduced >5% 9.1 % 6.9 %Reduced 3-5% 6.2 % 1.4 %Reduced 1-3% 11.4 % 22.2 %No change 46.0 % 38.9 %Increased 1-3% Increased 1-3% 14.7 % 12.5 %Increased 3-5% 5.0 % 6.9 %Increased >5% 7.7 % 11.1 %
The Technology Budget Average AveragePercentage institutions experiencing computing budget cut in 2003-04 0 % 19.7 % 19.4 %
Percentage of budget that was cut N/A 1.5 % 0.7 %Total academic computing budget 2004-05 $ 1,900,000 $ 3,086,045 $ 10,062,065 Percent of budget allocated to:
Hardware 30 % 21.5 % 14.7 %Software 2 % 13.2 % 9.6 %Personnel 25 % 46.4 % 50.7 %Content licenses 5 % 6.3 % 5.4 %User support 13 % 17.0 % 20.2 %Network service/support 25 % 12.9 % 13.7 %
Academic computing as an estimated percentage of total campus IT spending 70 % 33.3 % 30.0 %Total computing/IT expenditure as an estimated percentage of total campus spending 4 % 6.6 % 5.2 %
23 Institutional Research and Assessment

Campus Computing 2004
Southeastern All Institutions
Public Universities
The Technology Budget (Continued) Average AverageCurrent replacement cycle for desktop/notebook computers (years)
Student labs1 year 1.0 % 0 %2 years 8.3 % 6.9 %3 years 3 years 58.1 % 69.4 %4 years 25.9 % 20.8 %5 years 6.8 % 2.8 %
Faculty officesI year 0.2 % 0 %2 years 1.7 % 0 %3 years 35.6 % 37.5 %4 years 4 years 48.2 % 47.2 %5 years 14.3 % 15.3 %
Administrative offices1 year 0.2 % 0 %2 years 0.6 % 0 %3 years 3 years 30.9 % 40.3 %4 years 50.4 % 47.2 %5 years 18.0 % 12.5 %
Web and Networking IssuesHow does your institution address the problem of spam?
No institutional effort/policy 3.5 % 4.2 %
Recommend end-user filters Recommend end-userfilters
53.3 % 70.8 %
Deploy server filters Deploy server filters 87.6 % 87.5 %Use DNS blacklists Use DNS blacklists 51.7 % 51.4 %Other 10.0 % 9.7 %
24 Institutional Research and Assessment

Campus Computing 2004
Southeastern All Institutions
Public Universities
Web and Networking Issues (Continued)How important are the following issues on your campus? Average Average(Scale from 1 ="Not Important" to 7 ="Very Important")
Supporting instructional labs & clusters 7 6.1 5.7Creating Web pages for department use and course resources 7 5.1 4.9Managing dial-up access from off campus users 1 2.3 2.8Digital image libraries/archives 5 4.5 4.8Creating plug & play network for notebook computer users 6 4.6 4.7Disaster recovery 7 5.8 5.9Virtual private networks (VPN) 5 5.1 5.5Network security 7 6.6 6.8ATM 7 2.3 2.4Gigabit ethernet 7 5.9 6.3Electronic commerce 6 4.6 4.9Wireless networks 6 5.9 6.2Wi-Max wireless networks 7 3.6 4.3Making campus networks accessible to PDA/handheld devices 6 3.9 4.7Data encryption 6 5.2 5.5PDA/handheld computer 6 3.9 4.5
Primary medium for campus backbone/networkLinking buildings
Copper 0.2 % 0 %Fiber 99.2 % 100.0 %Other Gigabit 0.6 % 0 %
Within buildingsCopper Copper 76.8 % 73.6 %Fiber 22.0 % 26.4 %Wireless 1.2 % 0 %
25 Institutional Research and Assessment
Campus Computing 2004
Southeastern All Institutions
Public Universities
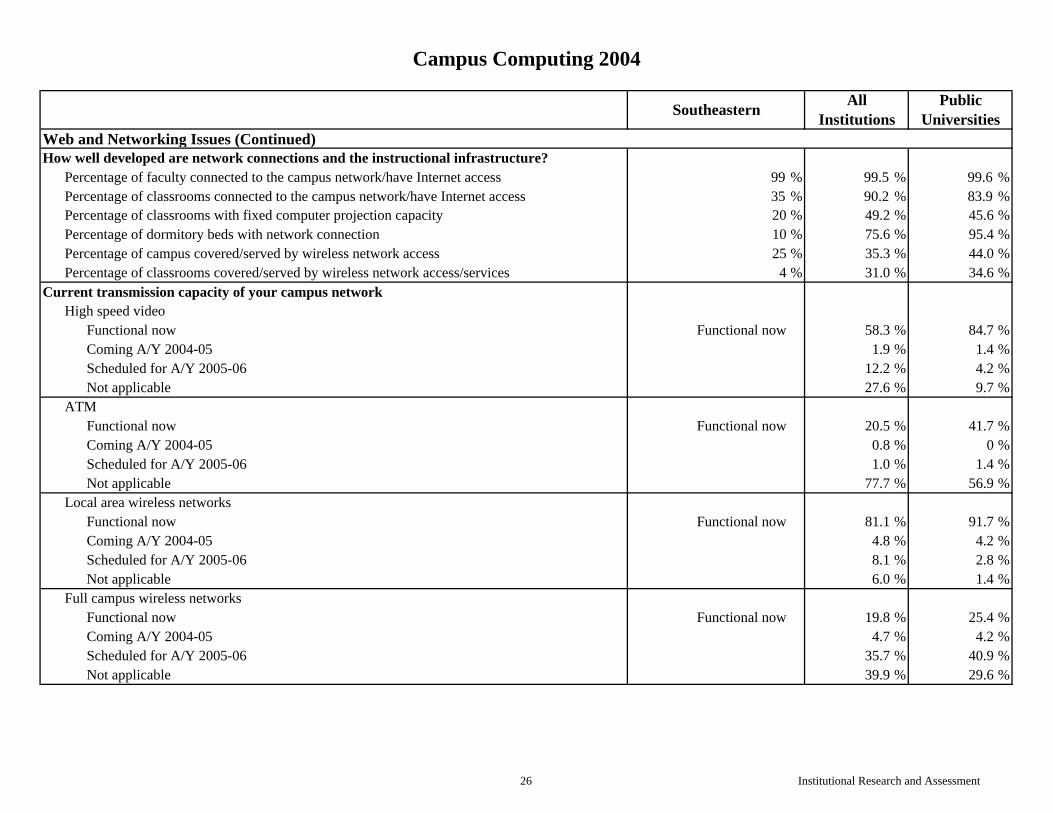
Web and Networking Issues (Continued)How well developed are network connections and the instructional infrastructure?
Percentage of faculty connected to the campus network/have Internet access 99 % 99.5 % 99.6 %Percentage of classrooms connected to the campus network/have Internet access 35 % 90.2 % 83.9 %Percentage of classrooms with fixed computer projection capacity 20 % 49.2 % 45.6 %Percentage of dormitory beds with network connection 10 % 75.6 % 95.4 %Percentage of campus covered/served by wireless network access 25 % 35.3 % 44.0 %Percentage of classrooms covered/served by wireless network access/services 4 % 31.0 % 34.6 %
Current transmission capacity of your campus networkHigh speed video
Functional now Functional now 58.3 % 84.7 %Coming A/Y 2004-05 1.9 % 1.4 %Scheduled for A/Y 2005-06 12.2 % 4.2 %Not applicable 27.6 % 9.7 %
ATMFunctional now Functional now 20.5 % 41.7 %Coming A/Y 2004-05 0.8 % 0 %Scheduled for A/Y 2005-06 1.0 % 1.4 %Not applicable 77.7 % 56.9 %
Local area wireless networksFunctional now Functional now 81.1 % 91.7 %Coming A/Y 2004-05 4.8 % 4.2 %Scheduled for A/Y 2005-06 8.1 % 2.8 %Not applicable 6.0 % 1.4 %
Full campus wireless networksFunctional now Functional now 19.8 % 25.4 %Coming A/Y 2004-05 4.7 % 4.2 %Scheduled for A/Y 2005-06 35.7 % 40.9 %Not applicable 39.9 % 29.6 %
26 Institutional Research and Assessment

Campus Computing 2004
Southeastern All Institutions
Public Universities
Web and Networking Issues (Continued)Current transmission capacity of your campus network
Gigabit EthernetFunctional now Functional now 77.6 % 81.9 %Coming A/Y 2004-05 2.9 % 0 %Scheduled for A/Y 2005-06 11.4 % 13.9 %Not applicable 8.1 % 4.2 %
Voice over IPFunctional now 26.8 % 43.1 %Coming A/Y 2004-05 Coming A/Y 2004-05 4.8 % 6.9 %Scheduled for A/Y 2005-06 20.5 % 20.8 %Not applicable 47.9 % 29.2 %
Internet2Functional now Functional now 35.9 % 94.4 %Coming A/Y 2004-05 2.5 % 1.4 %Scheduled for A/Y 2005-06 10.2 % 1.4 %Not applicable 51.4 % 2.8 %
Does your institution provide off-campus network access services for:Dial-up/ISPStudents
No No 63.4 % 34.7 %Yes, without a fee 30.0 % 47.2 %Yes, for a fee 6.6 % 18.1 %
FacultyNo No 48.9 % 23.6 %Yes, without a fee 45.3 % 62.5 %Yes, for a fee 5.8 % 13.9 %
27 Institutional Research and Assessment

Campus Computing 2004
Southeastern All Institutions
Public Universities
Web and Networking Issues (Continued)Does your institution provide off-campus network access services for:
DSL/BroadbandStudents
No No 92.3 % 81.9 %Yes, without a fee 4.1 % 4.2 %Yes, for a fee 3.7 % 13.9 %
FacultyNo No 90.5 % 81.9 %Yes, without a fee 5.8 % 4.2 %Yes, for a fee 3.7 % 13.9 %
WirelessStudents
No No 93.0 % 90.3 %Yes, without a fee 6.0 % 8.3 %Yes, for a fee 1.0 % 1.4 %
FacultyNo No 92.7 % 90.3 %Yes, without a fee 6.4 % 8.3 %Yes, for a fee 1.0 % 1.4 %
Number of dial-up modem ports available for student use 0 86.9 326.0Number of "plug & play" ports on campus for mobile computer users 0 505.2 611.1Number of wireless nodes on the campus network 500 138.5 253.1Does your institution limit the size of email documents/attachments Yes Yes = 68.1 % Yes = 75.0 %
Maximum file size (Mbytes) 10 19.0 26.0Does your institution limit the size of student web sites Yes Yes = 54.8 % Yes = 73.6 %
Maximum size (Mbytes) 50 36.0 51.0
28 Institutional Research and Assessment

Campus Computing 2004
Southeastern All Institutions
Public Universities
Organization, Planning and Impact IssuesIs your campus part of a multicampus system with shared computing resources? Yes Yes = 48.6 % Yes = 61.1 %Academic and administrative computing are:
Separate units 26.5 % 26.4 %One single unit One single unit 73.6 % 73.6 %
Has your institution reorganized IS units in the past 2 years? % Yes % YesAcademic computing No 34.0 % 33.3 %Administrative computing No 32.1 % 37.5 %Libraries No 12.7 % 9.7 %Telecom No 27.5 % 30.6 %
Do you anticipate a reorganization of IS in the next 2 years? % Yes % YesAcademic computing No 29.5 % 36.1 %Administrative computing No 27.2 % 31.9 %Libraries No 15.3 % 9.7 %Telecom No 27.4 % 31.9 %
The heads of the academic and administrative units report to:Academic computing
President 5.4 % 4.2 %Provost Provost 16.2 % 20.8 %CIO or CTO 58.7 % 63.9 %Other vice provost/vice president 15.3 % 9.7 %Dean 4.4 % 1.4 %
Administrative computingPresident 7.0 % 4.2 %Provost 7.0 % 11.1 %CIO or CTO CIO or CTO 63.3 % 65.3 %Other vice provost/vice president 20.7 % 19.4 %Dean 2.1 % 0 %
29 Institutional Research and Assessment

Campus Computing 2004
Southeastern All Institutions
Public Universities
Organization, Planning and Impact Issues (Continued)The heads of the academic and administrative units report to:
LibrariesPresident 1.6 % 2.8 %Provost Provost 63.1 % 72.2 %CIO or CTO 9.3 % 6.9 %Other vice provost/vice president 13.4 % 5.6 %Dean 12.8 % 12.5 %
Does institution have a chief information/technology officer?No 15.1 % 8.3 %Currently under discussion 4.1 % 1.4 %Yes Yes 80.9 % 90.3 %
What academic and operational units report to the CIO/CTO? % Yes % YesAcademic computing Yes 74.1 % 87.5 %Administrative computing Yes 79.2 % 83.3 %Libraries No 12.4 % 6.9 %Media center No 48.5 % 41.7 %Telecommunications Yes 67.4 % 77.8 %
The CIO (or senior institutional computing/IT officer) reports to:President No 32.5 % 23.6 %Provost/vice president for academic affairs Yes 31.7 % 50.0 %CFO/vice president for business/adm affairs No 26.7 % 19.4 %Other No 9.1 % 6.9 %
Who provides tech support for most departmental computer labs?Individual department 11.0 % 34.7 %Central IT service unit Central IT service unit 64.6 % 19.4 %Both 24.4 % 45.8 %
Who makes decisions about selecting course management products?Individual department 8.1 % 5.6 %Central IT service unit 56.8 % 58.3 %Both Both 35.1 % 36.1 %
30 Institutional Research and Assessment

Organization, Planning and Impact Issues (Continued)How does your institution deal with the "life cycle"?
One time allocation 11.4 % 26.4 %Developing budget Developing budget 27.6 % 34.7 %Have budget 61.0 % 38.9 %
How well does your institution prepare students for the technology skills needed over the next decade? (Scale from 1 ="Poor" to 5 ="Excellent")
Academic field/programBiological and physical sciences 5 3.9 3.8Business 5 4.0 4.2Education 5 3.8 3.9Fine/performing arts 5 3.6 3.7Humanities 5 3.4 3.3Mathematics 5 3.9 3.8Social science 5 3.6 3.6Occupational programs 5 3.6 3.6Overall campus preparation 5 3.8 3.9
How well prepared are faculty to use technology as a resource?(Scale from 1 ="Poor" to 5 ="Excellent")
For instruction: overall campus preparation 4 3.6 3.6For scholarship & research: overall campus preparation 4 3.5 3.7Internet & Web resources: overall campus preparation 4 3.7 3.7
Campus Computing 2004
Southeastern All Institutions
Public Universities
Average Average
Average Average
31 Institutional Research and Assessment