cambridge international examinations cambridge ... (0460)/0460_w17_qp_4… · use these results to...
TRANSCRIPT

This document consists of 16 printed pages, 4 blank pages and 1 Insert.
DC (RW/SG) 132851/5© UCLES 2017 [Turn over
Cambridge International ExaminationsCambridge International General Certificate of Secondary Education
*4574868004*
GEOGRAPHY 0460/43Paper 4 Alternative to Coursework October/November 2017 1 hour 30 minutesCandidates answer on the Question Paper.Additional Materials: Calculator Protractor Ruler
READ THESE INSTRUCTIONS FIRST
Write your Centre number, candidate number and name in the spaces provided.Write in dark blue or black pen.You may use an HB pencil for any diagrams or graphs.Do not use staples, paper clips, glue or correction fluid.DO NOT WRITE IN ANY BARCODES.
Write your answer to each question in the space provided.If additional space is required, you should use the lined pages at the end of the booklet. The question number(s) must be clearly shown.
Answer all questions.
The Insert contains Figs. 1, 2 and 6 and Tables 2 and 3 for Question 1, and Fig. 7 and Tables 4, 5, 6 and 7 for Question 2.The Insert is not required by the Examiner.Sketch maps and diagrams should be drawn whenever they serve to illustrate an answer.
At the end of the examination, fasten all your work securely together.The number of marks is given in brackets [ ] at the end of each question or part question.
The syllabus is approved for use in England, Wales and Northern Ireland as a Cambridge International Level 1/Level 2 Certificate.

2
0460/43/O/N/17© UCLES 2017
1 Students in the UK visited a coastal area where a spit had formed. Fig. 1 (Insert) shows a map of the area.
(a) Which one of the following is the correct description of a spit? Tick (✓) your answer.
Description Tick (✓)
a resistant rock that is separated from the land by erosion
a tall, steep cliff which extends out into the sea
an inlet which is sheltered on both sides by cliffs
a sheltered area of coastline where sand collects
a ridge of sand or shingle attached to the land at one end
[1]
The students decided to test the following hypotheses:
Hypothesis 1: The spit has been formed by constructive waves moving beach material along the coast.
Hypothesis 2: The coastal area is being managed to encourage sustainable tourism.
Sustainable tourism meets the needs of people now and protects the area for future generations.
(b) Before they began their fieldwork the students discussed safety on the beach with their teacher.
Suggest three precautions the students or teacher needed to take to reduce the risk of accidents.
1 ................................................................................................................................................
...................................................................................................................................................
2 ................................................................................................................................................
...................................................................................................................................................
3 ................................................................................................................................................
...............................................................................................................................................[3]

3
0460/43/O/N/17© UCLES 2017 [Turn over
(c) To investigate Hypothesis 1 the students needed to know more about the waves along the coastline. They had learned that waves are either constructive or destructive.
Wave frequency is the number of waves which break on the shore per minute.
The wave frequency of constructive waves is less than 10 waves per minute and the wave frequency of destructive waves is 10 or more waves per minute.
(i) Describe a method the students could use to measure wave frequency.
...........................................................................................................................................
...........................................................................................................................................
...........................................................................................................................................
...........................................................................................................................................
...........................................................................................................................................
.......................................................................................................................................[3]
(ii) The results of the students’ measurements of wave frequency are shown in Table 1 below.
Table 1
Results of students’ measurements
Measurement number Waves per minute
1 6
2 8
3 8
4 7
5 8
6 6
7 9
8 7
9 8
10 7
Average
Calculate the average (mean) number of waves per minute. Insert your answer into Table 1. [1]

4
0460/43/O/N/17© UCLES 2017
(d) The students had learned that longshore drift is important in moving beach material along the coast.
(i) Which one of the following statements about longshore drift is correct? Tick (✓) your answer.
Statement Tick (✓)
Waves approach the coastline at an angle.
Swash moves material down the beach.
Longshore drift occurs in deep water.
Backwash moves material up the beach.
The direction of longshore drift depends on the tide. [1]
(ii) To investigate longshore drift the students used two fieldwork methods. These are described in Fig. 2 (Insert), which is part of a student’s fieldwork notes.
Suggest one disadvantage of method 1.
...........................................................................................................................................
.......................................................................................................................................[1]
(iii) Suggest one way the students could have made sure that their results using method 2 were accurate.
...........................................................................................................................................
.......................................................................................................................................[1]
(iv) The results of method 1 are shown in Table 2 (Insert). Use these results to plot the average distance moved along the beach in Fig. 3 below. [1]
average321
14.6
14.4
14.2
14.0
13.8
13.6
13.4
13.2
0
distance(m)
test
Results of method 1Results of method 1
Fig. 3

5
0460/43/O/N/17© UCLES 2017 [Turn over
(v) The results of method 2 are shown in Table 3 (Insert). Use these results to complete Fig. 4 below. [1]
Height of beach material either side of the two groynes
2
1.5
1
0.5
0
2
1.5
1
0.5
0Groyne BGroyne A
heightof top ofgroyneabovebeach
(m)
heightof top ofgroyneabovebeach
(m)
east sidewest sideeast sidewest side
beach
beachbeach
Fig. 4
(vi) What conclusion would the students make about Hypothesis 1: The spit has been formed by constructive waves moving beach material along the coast? Support your answer with evidence from Tables 1, 2 and 3, and Figs. 3 and 4.
...........................................................................................................................................
...........................................................................................................................................
...........................................................................................................................................
...........................................................................................................................................
...........................................................................................................................................
...........................................................................................................................................
...........................................................................................................................................
.......................................................................................................................................[4]
(vii) Look again at Fig. 1 (Insert). Suggest why the groynes have been built on the beach.
...........................................................................................................................................
...........................................................................................................................................
...........................................................................................................................................
.......................................................................................................................................[2]

6
0460/43/O/N/17© UCLES 2017
(e) The coastline where the students did their fieldwork attracts many visitors. To investigate Hypothesis 2: The coastal area is being managed to encourage sustainable tourism, the students needed to assess the types and amount of management found on and near the beach.
(i) First they recorded evidence of management methods in the tally chart shown in Fig. 5 below. Complete the tally chart with their result of counting eight litter bins in the area. [1]
Tally chart
Evidence of management Tally Number counted
board‑walk llll 5
café l 1
campsite ll 2
car park ll 2
direction signpost llll llll 9
fence lll 3
footpath llll 4
information board ll 2
litter bin
recycling point l 1
toilets l 1
tourist information centre l 1
Fig. 5
(ii) Another student located some of this evidence on a sketch map of part of the area near the beach. This is shown in Fig. 6 (Insert).
Describe the location of the footpaths shown on the map.
...........................................................................................................................................
...........................................................................................................................................
...........................................................................................................................................
.......................................................................................................................................[2]

7
0460/43/O/N/17© UCLES 2017 [Turn over
(iii) Is Hypothesis 2: The coastal area is being managed to encourage sustainable tourism true or false? Circle your answer below.
True False
Explain your conclusion. Include evidence from Figs. 5 and 6.
...........................................................................................................................................
...........................................................................................................................................
...........................................................................................................................................
...........................................................................................................................................
...........................................................................................................................................
...........................................................................................................................................
...........................................................................................................................................
.......................................................................................................................................[4]
(f) For extension work the students drew the beach profile from the edge of the sea to the top of the beach. They used a tape measure, two ranging poles and a clinometer. Describe how they made their measurements.
...................................................................................................................................................
...................................................................................................................................................
...................................................................................................................................................
...................................................................................................................................................
...................................................................................................................................................
...................................................................................................................................................
...................................................................................................................................................
...............................................................................................................................................[4]
[Total: 30 marks]

8
0460/43/O/N/17© UCLES 2017
BLANK PAGE

9
0460/43/O/N/17© UCLES 2017 [Turn over
2 Students in India wanted to find out more about people who had migrated to the city of Jaipur from within India and lived in squatter settlements made up of homemade shelters on pavements or next to roads.
The students decided to test the following hypotheses:
Hypothesis 1: More migrants who live in the squatter settlement came from the area around Jaipur than areas further away.
Hypothesis 2: The quality of life of residents in the squatter settlement is poor.
(a) To investigate the hypotheses the students used a questionnaire with 10% of the residents of the squatter settlements.
(i) Describe a sampling method for how the students could choose people to complete the questionnaire. Explain why you have chosen this method.
Name of sampling method ................................................................................................
Description of method .......................................................................................................
...........................................................................................................................................
Explanation for choice .......................................................................................................
...........................................................................................................................................
.......................................................................................................................................[3]
(ii) Explain why a 10% sample (300 people) is an appropriate number of residents to answer the questionnaire.
...........................................................................................................................................
...........................................................................................................................................
...........................................................................................................................................
.......................................................................................................................................[2]
10
0460/43/O/N/17© UCLES 2017
(b) The questionnaire is shown in Fig. 7 (Insert).
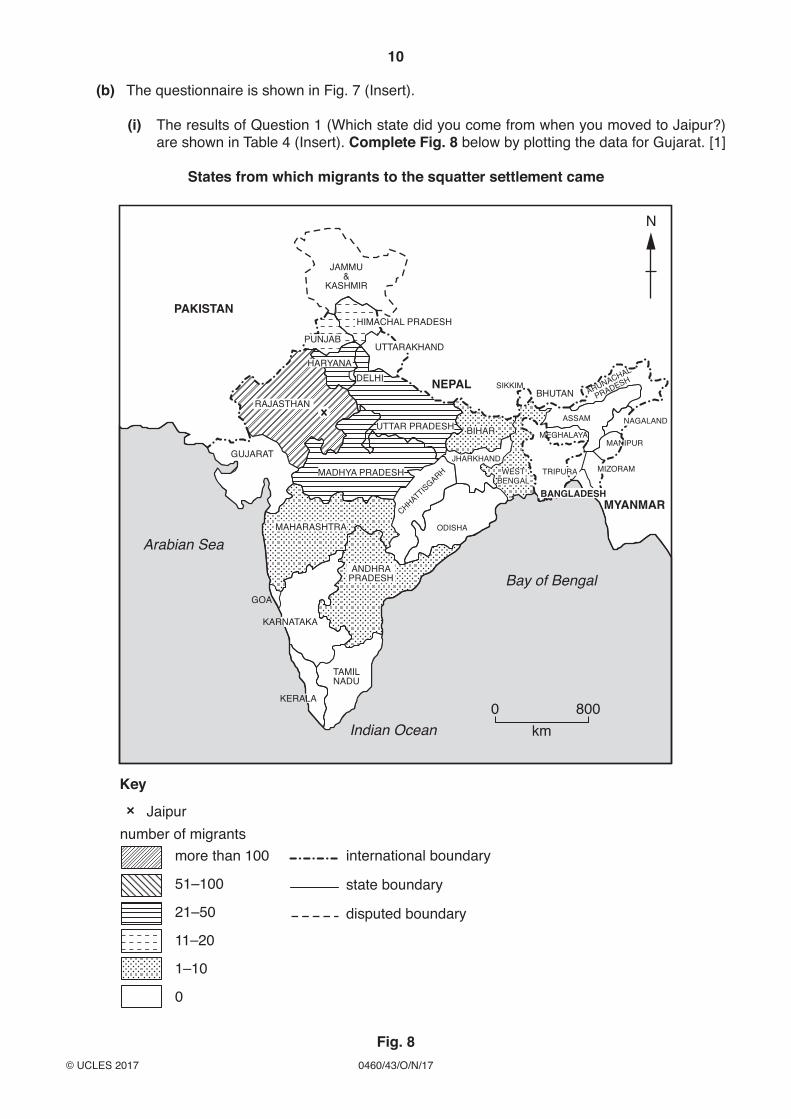
(i) The results of Question 1 (Which state did you come from when you moved to Jaipur?) are shown in Table 4 (Insert). Complete Fig. 8 below by plotting the data for Gujarat. [1]
States from which migrants to the squatter settlement came
km0 800
Bay of Bengal
Arabian Sea
Indian Ocean
RAJASTHAN
PAKISTAN
NEPALBHUTAN
MYANMAR
GUJARAT
HARYANAUTTARAKHAND
HIMACHAL PRADESH
UTTAR PRADESH
MADHYA PRADESH
BANGLADESH
MAHARASHTRA
KARNATAKA
KERALA
PUNJAB
DELHI
BIHAR
ARUNACHAL
PRADESH
ASSAM
JHARKHAND
CHHATTISGARH
JAMMU&
KASHMIR
ANDHRAPRADESH
TAMILNADU
WESTBENGAL
NAGALAND
MIZORAM
ODISHA
TRIPURA
MEGHALAYAMANIPUR
SIKKIM
Key
number of migrantsinternational boundary
state boundary
disputed boundary
more than 100
51–100
21–50
11–20
1–10
0
N
GOA
Jaipur
Fig. 8

11
0460/43/O/N/17© UCLES 2017 [Turn over
(ii) Suggest one other suitable method to display the results of Question 1 on a map of India.
.......................................................................................................................................[1]
(iii) What is the correct conclusion about Hypothesis 1: More migrants who live in the squatter settlement came from the area around Jaipur than areas further away? Support your answer with evidence from Fig. 8 and Table 4.
...........................................................................................................................................
...........................................................................................................................................
...........................................................................................................................................
...........................................................................................................................................
...........................................................................................................................................
.......................................................................................................................................[3]
(iv) Suggest reasons for the pattern of migration shown in Fig. 8.
...........................................................................................................................................
...........................................................................................................................................
...........................................................................................................................................
.......................................................................................................................................[2]

12
0460/43/O/N/17© UCLES 2017
(c) To investigate Hypothesis 2: The quality of life of residents in the squatter settlement is poor, the students used the results of Questions 2, 3 and 4 in their questionnaire.
(i) The students plotted their results of Question 2 (Where do you get most of your water from?) and Question 3 (What is your main method of lighting?) in pie graphs shown in Figs. 9A and 9B below. Use the data in Table 5 (Insert) to complete the pie graph in Fig. 9A. [3]
Main source of water0%
10%90%
80%
70%
60%
20%
30%
40%50%
Key
public taps
nearby shops or houses
public handpumps
public wells
water tankers
Fig. 9A
Main method of lighting0%
10%90%
80%
70%
60%
20%
30%
40%50%
Key
kerosene (paraffin) lamps
street lights
no lighting
gas lamps
battery lamps
Fig. 9B
(ii) In Fig. 9B what percentage of residents have ‘no lighting’?
.........................% [1]
13
0460/43/O/N/17© UCLES 2017 [Turn over
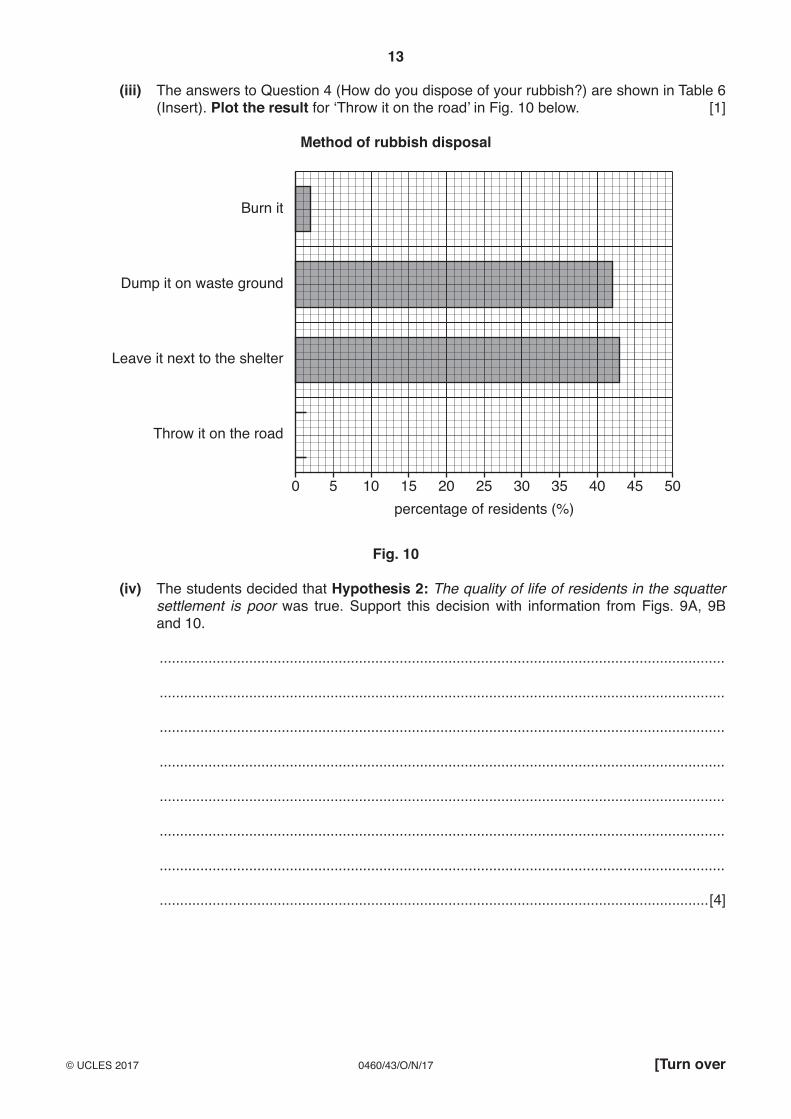
(iii) The answers to Question 4 (How do you dispose of your rubbish?) are shown in Table 6 (Insert). Plot the result for ‘Throw it on the road’ in Fig. 10 below. [1]
Method of rubbish disposal
percentage of residents (%)
Throw it on the road
Leave it next to the shelter
Dump it on waste ground
Burn it
50454035302520151050
Fig. 10
(iv) The students decided that Hypothesis 2: The quality of life of residents in the squatter settlement is poor was true. Support this decision with information from Figs. 9A, 9B and 10.
...........................................................................................................................................
...........................................................................................................................................
...........................................................................................................................................
...........................................................................................................................................
...........................................................................................................................................
...........................................................................................................................................
...........................................................................................................................................
.......................................................................................................................................[4]

14
0460/43/O/N/17© UCLES 2017
(d) (i) The answers to Question 5 (What is the job of the main income earner in the family?) are shown in Table 7 (Insert). Use the results to complete Fig. 11 below. [3]
Job of main income earner100
90
80
70
60
50
40
30
20
10
0
percentageof residentsinterviewed
(%)
other
polishing shoessnake charmer
pulling rickshaws
painting trucks and buses
digging and selling sand
collecting waste iron and rags
making statuettes
playing musical instruments on the street
Fig. 11

15
0460/43/O/N/17© UCLES 2017
(ii) Why do the jobs shown in Fig. 11 help to support the students’ conclusion that residents in the squatter settlement have a poor quality of life?
...........................................................................................................................................
...........................................................................................................................................
...........................................................................................................................................
.......................................................................................................................................[2]
(e) To extend their work the students discussed ways to solve the problem of people living on pavements or next to roads. They suggested two possible solutions which are shown in Fig. 12 below.
Two possible solutions suggested by students
Solution ABuild low‑cost houses with basic water, sewage and power supplies which are cheap to rent.
Solution BPolice remove the people living on the pavements or next to roads and council workers clear the area of rubbish.
Fig. 12
Explain why solution A is better for people living on pavements or next to roads than solution B.
...................................................................................................................................................
...................................................................................................................................................
...................................................................................................................................................
...................................................................................................................................................
...................................................................................................................................................
...................................................................................................................................................
...................................................................................................................................................
...............................................................................................................................................[4]
[Total: 30 marks]

16
0460/43/O/N/17© UCLES 2017
Additional Pages
If you use the following lined pages to complete the answer(s) to any question(s), the question number(s) must be clearly shown.
..................................................................................................................................................................
..................................................................................................................................................................
..................................................................................................................................................................
..................................................................................................................................................................
..................................................................................................................................................................
..................................................................................................................................................................
..................................................................................................................................................................
..................................................................................................................................................................
..................................................................................................................................................................
..................................................................................................................................................................
..................................................................................................................................................................
..................................................................................................................................................................
..................................................................................................................................................................
..................................................................................................................................................................
..................................................................................................................................................................
..................................................................................................................................................................
..................................................................................................................................................................
..................................................................................................................................................................
..................................................................................................................................................................
..................................................................................................................................................................
..................................................................................................................................................................
..................................................................................................................................................................
..................................................................................................................................................................
..................................................................................................................................................................
..................................................................................................................................................................
..................................................................................................................................................................

17
0460/43/O/N/17© UCLES 2017
..................................................................................................................................................................
..................................................................................................................................................................
..................................................................................................................................................................
..................................................................................................................................................................
..................................................................................................................................................................
..................................................................................................................................................................
..................................................................................................................................................................
..................................................................................................................................................................
..................................................................................................................................................................
..................................................................................................................................................................
..................................................................................................................................................................
..................................................................................................................................................................
..................................................................................................................................................................
..................................................................................................................................................................
..................................................................................................................................................................
..................................................................................................................................................................
..................................................................................................................................................................
..................................................................................................................................................................
..................................................................................................................................................................
..................................................................................................................................................................
..................................................................................................................................................................
..................................................................................................................................................................
..................................................................................................................................................................
..................................................................................................................................................................
..................................................................................................................................................................
..................................................................................................................................................................
..................................................................................................................................................................
..................................................................................................................................................................

18
0460/43/O/N/17© UCLES 2017
BLANK PAGE

19
0460/43/O/N/17© UCLES 2017
BLANK PAGE

20
0460/43/O/N/17© UCLES 2017
Permission to reproduce items where third‑party owned material protected by copyright is included has been sought and cleared where possible. Every reasonable effort has been made by the publisher (UCLES) to trace copyright holders, but if any items requiring clearance have unwittingly been included, the publisher will be pleased to make amends at the earliest possible opportunity.
To avoid the issue of disclosure of answer‑related information to candidates, all copyright acknowledgements are reproduced online in the Cambridge International Examinations Copyright Acknowledgements Booklet. This is produced for each series of examinations and is freely available to download at www.cie.org.uk after the live examination series.
Cambridge International Examinations is part of the Cambridge Assessment Group. Cambridge Assessment is the brand name of University of Cambridge Local Examinations Syndicate (UCLES), which is itself a department of the University of Cambridge.
BLANK PAGE