cal’s dinner card deals - lausd. · pdf file2.2 demonstrate an understanding that rate...
TRANSCRIPT
LEARNING RESEARCH AND DEVELOPMENT CENTER © 2005 University of Pittsburgh
1
Cal’s Dinner Card Deals
Overview: In this lesson students compare three linear functions in the context of Dinner Card Deals. Students are required to interpret a graph for each Dinner Card Deal to help them decide which is the better deal and why. Goals:
• Students will solve the problem using an equation, a graph, and a table. • Students will interpret a linear equation in terms of the problem. • Students will justify their solutions to the problem. • Students will interpret a graph of the linear function in terms of the problem. • Students will identify and interpret the x- and y-intercepts of the graph of the linear function in terms of the problem.
Algebra Standards: 1.0 Students write verbal expressions and sentences as algebraic expressions and equations; they evaluate algebraic expressions, solve simple linear equations, and graph and interpret their results: 1.1 Write and solve one-step linear equation in one variable. 1.3 Apply algebraic order of operations and the commutative, associate, and distributive properties to evaluate expressions; and justify each step in the process. 1.4 Solve problems manually by using the correct order of operations or by using a scientific calculator. 2.0 Students analyze and use tables, graphs, and rules to solve problems involving rate and proportions. 2.2 Demonstrate an understanding that rate is a measure of one quantity per unit value of another quantity.
Mathematical Reasoning Standard: 1.0 Students make decisions about how to approach problems: 1.1 Analyze problems by identifying relationships, distinguishing relevant from irrelevant information, identifying missing information, sequencing and prioritizing information, and observing patterns. 1.2 Formulate and justify mathematical conjectures based on a general description of the mathematical question or problem posed.

LEARNING RESEARCH AND DEVELOPMENT CENTER © 2005 University of Pittsburgh
2
1.3 Determine when and how to break a problem into simpler parts. 2.0 Students use strategies, skills and concepts in finding solutions: 2.4 Use a variety of methods, such as words, numbers, symbols, charts, graphs, tables, diagrams, and models, to explain mathematical reasoning. 2.5 Express the solution clearly and logically by using the appropriate mathematical notation and terms and clear language; support solution with evidence in both verbal and symbolic work. 2.7 Make precise calculation and check the validity of the results form the context of the problem. 3.0 Students move beyond a particular problem by generalizing to other situations: 3.1 Evaluate the reasonableness of the solution in the context of the original situation. 3.3 Develop generalization of the results obtained and the strategies used and apply them in new problem situations.
Building on Prior Knowledge: Students graph and interpret linear and some nonlinear functions. Students solve simple linear equations and inequalities over the rational numbers.
Materials: Cal’s Dinner Card Deals Task handout and transparency, calculators, chart paper and graph paper.

LEARNING RESEARCH AND DEVELOPMENT CENTER © 2005 University of Pittsburgh
3
Cal's Dinner Card Deals
0
10
20
30
40
50
60
70
80
90
100
0 1 2 3 4 5 6 7 8 9 10
Number of Dinners Purchased (N)
Regular Price
Plan A
Plan B
CAL’s DINNER CARD DEALS The graph below shows data for three dinner plans. Make observations about each of the graphs. What is the formula for determining the cost of each dinner plan? Decide which plan is the best and explain your reasoning. With permission from Smith, Silver and Stein (2005) Using cases to transform mathematics teaching and learning, Vol. 2: Algebra. New York: Teachers College Press. The COMET Project is funded by the National Science Foundation (ESI-9731428). The project is co-directed by Margaret Smith, Edward Silver, and Mary Kay Stein and is housed at the Learning Research and Development Center at the University of Pittsburgh.
LEARNING RESEARCH AND DEVELOPMENT CENTER © 2005 University of Pittsburgh
4
Phase Action Comments S E T U P
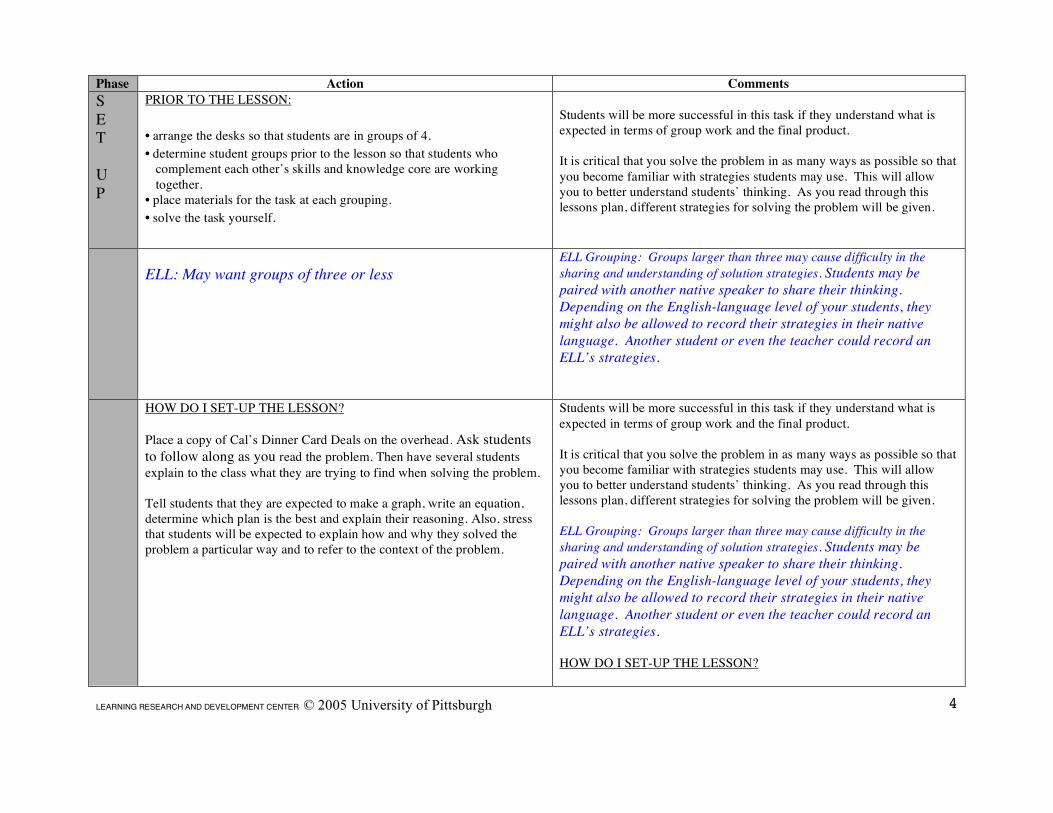
PRIOR TO THE LESSON: • arrange the desks so that students are in groups of 4. • determine student groups prior to the lesson so that students who
complement each other’s skills and knowledge core are working together.
• place materials for the task at each grouping. • solve the task yourself.
Students will be more successful in this task if they understand what is expected in terms of group work and the final product. It is critical that you solve the problem in as many ways as possible so that you become familiar with strategies students may use. This will allow you to better understand students’ thinking. As you read through this lessons plan, different strategies for solving the problem will be given.
ELL: May want groups of three or less
ELL Grouping: Groups larger than three may cause difficulty in the sharing and understanding of solution strategies. Students may be paired with another native speaker to share their thinking. Depending on the English-language level of your students, they might also be allowed to record their strategies in their native language. Another student or even the teacher could record an ELL’s strategies.
HOW DO I SET-UP THE LESSON? Place a copy of Cal’s Dinner Card Deals on the overhead. Ask students to follow along as you read the problem. Then have several students explain to the class what they are trying to find when solving the problem. Tell students that they are expected to make a graph, write an equation, determine which plan is the best and explain their reasoning. Also, stress that students will be expected to explain how and why they solved the problem a particular way and to refer to the context of the problem.
Students will be more successful in this task if they understand what is expected in terms of group work and the final product. It is critical that you solve the problem in as many ways as possible so that you become familiar with strategies students may use. This will allow you to better understand students’ thinking. As you read through this lessons plan, different strategies for solving the problem will be given. ELL Grouping: Groups larger than three may cause difficulty in the sharing and understanding of solution strategies. Students may be paired with another native speaker to share their thinking. Depending on the English-language level of your students, they might also be allowed to record their strategies in their native language. Another student or even the teacher could record an ELL’s strategies. HOW DO I SET-UP THE LESSON?

LEARNING RESEARCH AND DEVELOPMENT CENTER © 2005 University of Pittsburgh
5
Phase Action Comments As students describe the task, listen for their understanding of the goals of the task. It is important that they indicate the goal is to find out which of the plans is the best. The best plan may differ according to the context they apply. Students will need to justify their answers, which may involve determining when one plan becomes better than another and when two plans may cost the same. Be careful not to tell students how to solve the task or to set up a procedure for solving the task because your goal is for students to do the problem solving. ELL: Use a word wall with pictures to illustrate the vocabulary that may come up in the solving of the task: y-intercept, slope, x-axis, y-axis, etc. Point to the words on the word wall as you discuss the task. Reviewing such terms visually helps connect concepts to a student’s native-language knowledge of linear equations.
E P L O R E
PRIVATE PROBLEM SOLVING TIME Give students 5 - 7 minutes of private think time to begin to solve the problem individually. Circulate among the groups assessing students’ understanding of the idea below. FACILITATING SMALL GROUP RPOBLEM SOLVING What do I do if students have difficulty getting started? Allow students to work in their groups to solve the problem. Assist students/groups who are struggling to get started by prompting with questions such as: - What do you know about the dinner card deals? - What would the cost be for one meal on the regular plan? Two meals? Three meals? - What would be the cost for one meal on Plan A? Two meals? Three meals? No meals? Plan B? - How are the three plans different? The same? - Find a way to determine the cost for any number of meals?
PRIVATE PROBLEM SOLVING TIME Make sure that students’ thinking is not interrupted by talking of other students. If students begin talking, tell them that they will have time to share their thoughts in a few minutes. FACILITATING SMALL GROUP RPOBLEM SOLVING What do I do if students have difficulty getting started? By asking a question such as “What do you know about the meal plans?” the teacher is providing students with a question that can be used over and over when problem solving. This will help them focus on what they know, what they were given, and what they need to determine. By beginning with one meal students can begin to identify the relationship between the number of meals that are purchased and the cost of the meals. By looking at zero meals students should begin to make comparisons between the meal plans. ELL: Similar questions can be used for ELL students. Both the student and the teacher may point to the graph or the table to ask questions or to explain their thinking. You use these questions to help students make sense of the problem. Students can underline or

LEARNING RESEARCH AND DEVELOPMENT CENTER © 2005 University of Pittsburgh
6
Phase Action Comments make notes of important information in the task. Teacher may
record for the student depending of the English-language level of the students.
What misconceptions might students have? Students might connect lines on the graph interpreting the data as continuous rather than discrete. Ask: What does the line mean? How much of a meal is between two points?
What misconceptions might students have? Misconceptions are common. Students may have learned the information incorrectly or they may generalize ideas prematurely. - Press students for the meaning of the numbers within the context of the problem. Consistently asking about the context helps students to make sense of the problem and appreciate the benefit when problem solving, especially if it helps them make sense of the problem.
USING A TABLE - Students only make a table for one plan. Ask the student: - Which Dinner Card Deal is a better deal? How do you know this f from the table? How do you know this from the graph? - What patterns do you notice from your table? - (Point to the y-intercept on the graph) Where is this amount in your table? What does this amount mean? - How is the cost of the meals changing from one meal to the next? - How can you solve for 100 dinners in the regular plan? For Plan A? For Plan B?
USING A TABLE A table can be created from the data points shown on the graph. By looking at the difference in cost between consecutive numbers of dinners purchased, a pattern can be found for each dinner plan.
• For the Regular Plan, there is a +10 pattern (the cost increases by 10 between consecutive rows).
• For Plan A, there is a +8 pattern (the cost increases by 8 between consecutive rows).
• For Plan B, there is a +6 pattern (the cost increases by 6 between consecutive rows). After identifying this pattern, it is possible, but not necessary, to fill in the costs for 4, 6, and 7 dinners purchased.
Possible Solution Paths

LEARNING RESEARCH AND DEVELOPMENT CENTER © 2005 University of Pittsburgh
7
Phase Action Comments
Which Dinner Card Deal is a better deal? How do you know this from the table? How do you know this from the graph?
• The Regular Plan is the best deal if the diner only uses the card to
LEARNING RESEARCH AND DEVELOPMENT CENTER © 2005 University of Pittsburgh
8
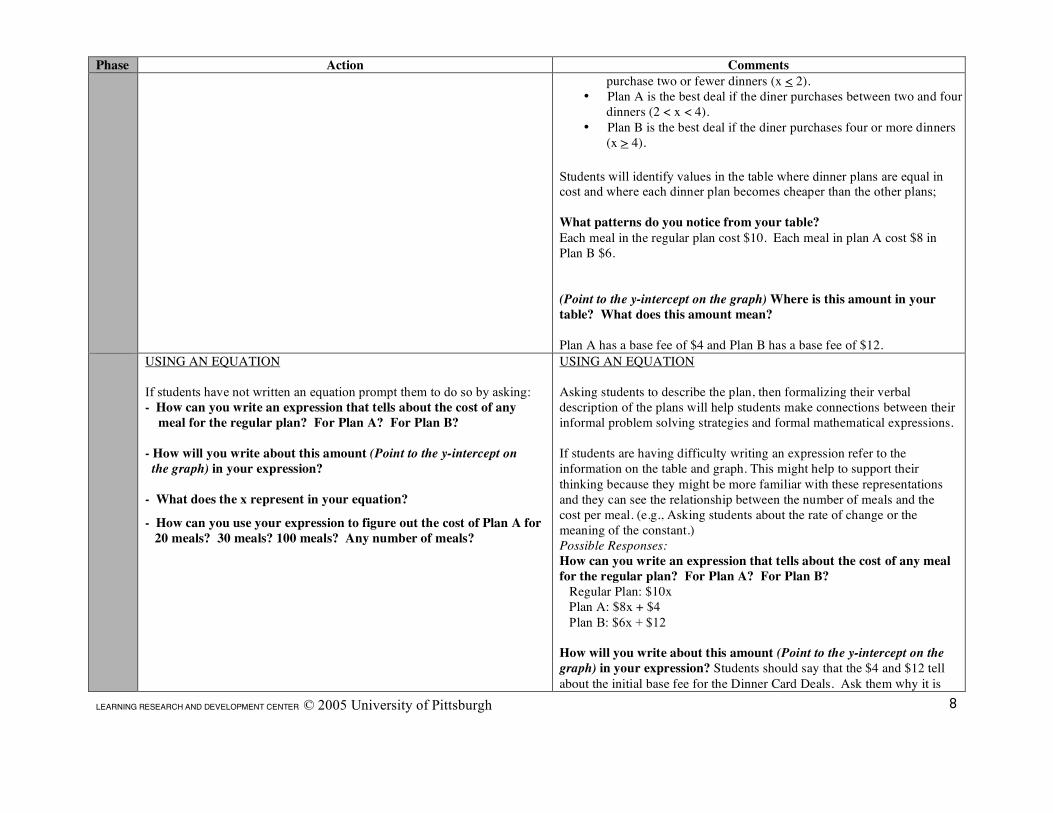
Phase Action Comments purchase two or fewer dinners (x < 2). • Plan A is the best deal if the diner purchases between two and four dinners (2 < x < 4). • Plan B is the best deal if the diner purchases four or more dinners (x > 4).
Students will identify values in the table where dinner plans are equal in cost and where each dinner plan becomes cheaper than the other plans; What patterns do you notice from your table? Each meal in the regular plan cost $10. Each meal in plan A cost $8 in Plan B $6. (Point to the y-intercept on the graph) Where is this amount in your table? What does this amount mean? Plan A has a base fee of $4 and Plan B has a base fee of $12.
USING AN EQUATION If students have not written an equation prompt them to do so by asking: - How can you write an expression that tells about the cost of any meal for the regular plan? For Plan A? For Plan B? - How will you write about this amount (Point to the y-intercept on the graph) in your expression? - What does the x represent in your equation?
- How can you use your expression to figure out the cost of Plan A for 20 meals? 30 meals? 100 meals? Any number of meals?
USING AN EQUATION Asking students to describe the plan, then formalizing their verbal description of the plans will help students make connections between their informal problem solving strategies and formal mathematical expressions. If students are having difficulty writing an expression refer to the information on the table and graph. This might help to support their thinking because they might be more familiar with these representations and they can see the relationship between the number of meals and the cost per meal. (e.g., Asking students about the rate of change or the meaning of the constant.) Possible Responses: How can you write an expression that tells about the cost of any meal for the regular plan? For Plan A? For Plan B? Regular Plan: $10x Plan A: $8x + $4 Plan B: $6x + $12
How will you write about this amount (Point to the y-intercept on the graph) in your expression? Students should say that the $4 and $12 tell about the initial base fee for the Dinner Card Deals. Ask them why it is

LEARNING RESEARCH AND DEVELOPMENT CENTER © 2005 University of Pittsburgh
9
Phase Action Comments added on. They should be able to tell you that it is a one time fee charged for the Dinner Card Deal. What does the x represent in your equation? Students should tell you that the x represents the number of meals in each plan. How can you use your equation to figure out the cost of Plan A for 20 meals? 30 meals? 100 meals? Any number of meals? $8(20) + $4 = $164 $8(30) + $4 = $244 $8x + $4 = y
USING A GRAPH -Independent and Dependent Variable To assess student understanding of the dependent and independent variable ask: - What goes on the x-axis and what goes on the y-axis? Why? - Does the amount of meals you purchase depend on the cost or does the cost of the plan depend on how many meals you purchased? - Scale of the Graph - What units are we dealing with for each axis? - Tell students: The scale for the x -and y-axis don’t have to increase by the same increment. They don’t have to go by ones. - The Point of Intersection and the Solution to the Problem Ask students to indicate where the solution to the problem is on the graph. If they indicate that it is the point of intersection, ask What does the point of intersection means in this problem?
USING A GRAPH - Independent and Dependent Variable Students should label the x-axis as their “meals purchased” or “meals” axis and the y-axis as their “cost” axis. Mathematical Reasoning: Students should explain that the cost depends on the number of meals purchased. - Scale of the Graph Look for students who do not use fixed increments (e.g., some will start with 1 meal, 2 meals and then jump to 10, 20). Students may believe they must use the same scale for both axes. - The Point of Intersection and the Solution to the Problem Mathematical Reasoning: Students should state that the point of intersection is the point where both plans cost the same for the same number of meals. It is important to hear students talk about both the cost and meals.
S H A R E, D
FACILITATING THE GROUP DISCUSSION What order will I have students post solution paths so I will be able to help students make connections between the solution paths? As you circulate among the groups, look for solutions that will be shared with the whole group and consider the order in which they will be shared. Ask students to post their work in the front of the classroom. We usually begin with a table that has represented all three plans on the same chart. Give the owners of the poster an opportunity to explain their solution path.
FACILITATING THE GROUP DISCUSSION What order will I have students post solution paths so I will be able to help students make connections between the solution paths? Even though you may display all solution paths, you should strategically pick specific solution paths to discuss with the whole group. The goal is to discuss mathematical ideas associated with cost per meal (rate of change/slope) and plan fee (y-intercept) for each plan. They should be able to say why one plan starts out as the better plan but over

LEARNING RESEARCH AND DEVELOPMENT CENTER © 2005 University of Pittsburgh
10
Phase Action Comments I S C U S S, A N D A N A L Y Z E
After a group has explained their solution path, then ask others in the class to respond to the following questions: Begin with a table:
- Which Dinner Card Deal is the better deal and why? Who agrees and why? Does anyone disagree and why?
- Why do they have a cost on the chart when zero dinners have been purchased?
- What is the cost of each additional meal in the Regular Plan? In Plan A? In Plan B? How do you see this in the table?
- How can two plans end up costing the same amount at a specific number of meals when one clearly starts out more than the other?
- y-Intercept or Initial Fee Point to 0 meals in the table and ask: What does this mean in terms of the Dinners purchased?
- Point to the graph and ask: One plan begins at $4.00 and the other at $12.00. What does that mean with respect to each plan?
Ask students who have written an equation to share their work:
- How would you solve for any number of meals in the Regular Plan? Plan A? Plan B?
- What does the x represent? - What does the +$4 and +$12 represent in each plan? Why do
you add these in the expression? - When you look at the expression how can you tell which plan
will start out more expensive but in the end become the better plan?
- Is the Initial fee shown in the equations? Why did they add the fee on?
- What makes Plan B end up being a better deal than Plan A? So Plan B has an initial fee that is greater than Plan As initial fee, so how can Plan B end up being the better deal?
Connect the equation and the table to the Graph:
- Will the lines be connected on the graph? - What does the point of intersection tell you about the meals?
Did anyone know that they two graphs would intersect at some point? How did you know?
- How do you know from the table what the graph will look
time it is not the least expensive plan. They should understand how this information is represented in a table, a graph and an equation. Possible Responses Which Dinner Card Deal is the better deal and why? Who agrees and why? Does anyone disagree and why? Students will identify values in the table where dinner plans are equal in cost and where each dinner plan becomes cheaper than the other plans; Why do they have a cost on the chart when zero dinners have been purchased? The first is the concept of a base price (initial activation fee). The Regular Price plan has no initial cost for the plan (i.e., nothing is paid unless you actually buy a dinner with the dinner plan), whereas Plan A and B have initial costs for the cards (i.e., Plan A costs $4 and Plan B costs $12 even if a dinner is never bought). The second concept central to the dinner card plans is a constant rate of change (i.e., a linear relationship). For each of the dinner plans, each additional dinner purchased adds the same amount to the total cost (i.e., $10 for each dinner on the Regular Plan, $8 for each dinner on Plan A, and $6 for each dinner on Plan B). Possible Responses: When you look at the expression how can you tell which plan will start out more expensive but in the end become the better plan? or What makes Plan B end up being a better deal than Plan A? So Plan B has an initial fee that is greater than Plan As initial fee, so how can Plan B end up being the better deal? This is an opportunity to discuss slope or rate of change. Student will tell you that Plan B catches up with Plan A. Ask them what they mean. Students will tell you that the cost of each meal in Plan B is less than the cost of each meal in Plan A. Press students to tell you why this matters. Play devil’s advocate, tell students that you thought Plan B would end being more expensive because it begins with a base fee of $12 and Plan A only has a base fee of $4. Students should talk about the cost per meal for Plan B being less means that it makes up for the difference between the initial fee for Plan B versus Plan A. Is the Initial fee shown in the equations? Why did they add the fee on? Mark this information by saying: We call the $4 and $12.00 the y-

LEARNING RESEARCH AND DEVELOPMENT CENTER © 2005 University of Pittsburgh
11
Phase Action Comments like?
- What is the slope of the Regular Plan, Plan A, and Plan B?
intercepts because this is where the number of meals (the x value) is equal to zero and where the graphs touch or cross the y-axis. Mathematical Reasoning: The graph could be used to count out the rate of change between data points for each dinner plan to determine the cost per meal. Students would then need to make sense of the y-intercept as the ‘cost for 0 meals purchased’ or the initial fee of the dinner card. The coefficient - When you ask students why they multiplied 8(5) or 6(5) they should say that every meal that you buy you are charged $8 or $6 per meal so if you buy 20 meals this is 20 times the 8 or 6. You can refer to the 8 or 6 as the coefficient. y-Intercept or Initial Fee Students should state that the y-intercepts are the costs of the plans for buying zero meals. They may call the amount the base fee. The constant - Students should explain that the base fee is added because it is a one-time fee, not a per-meal fee. Will the lines be connected on the graph? If the data are treated as continuous rather than discrete, the points on the graph can be connected to form lines for each dinner plan. Then the y-intercept (b) and slope (m) of each line can be identified. Using the slope-intercept form of a linear equation,
!
y =mx + b , the formulas presented in the solutions A and B can be written for the cost (y) of any number of dinners (x) purchased on each plan.
HOMEWORK Create two other plans, one that is a better deal than Plan B if you really like to each out a lot. Make a table and show your new plan on the graph. Explain why your plan is a better plan than the three plans from Edith Hart’s classroom.
ELL: Make sure you give any extensions or homework to your students in writing. Your students may be up to the challenge, but if the problem is given verbally they may miss the question entirely