call: fp7-env-2008-1, env.2008.1.1.4.1 funding scheme: collaborative project partners: 22
DESCRIPTION
COMBINE –Comprehensive Modelling of the Earth System for Better Climate Prediction and Projection M. A. Giorgetta, Max Planck Institute for Meteorology, Hamburg IS-ENES kick-off meeting, 30-31 March 2009. Call: FP7-ENV-2008-1, ENV.2008.1.1.4.1 Funding scheme: Collaborative project - PowerPoint PPT PresentationTRANSCRIPT
COMBINE – Comprehensive Modelling of the Earth System for Better Climate Prediction and Projection
M. A. Giorgetta, Max Planck Institute for Meteorology, HamburgIS-ENES kick-off meeting, 30-31 March 2009
Call: FP7-ENV-2008-1, ENV.2008.1.1.4.1
Funding scheme: Collaborative project
Partners: 22
Duration: 48 months (plan: 01.05.2009 – 30.04.2013)
Status: in negotiation
EC sci. officer: Philippe Tulkens
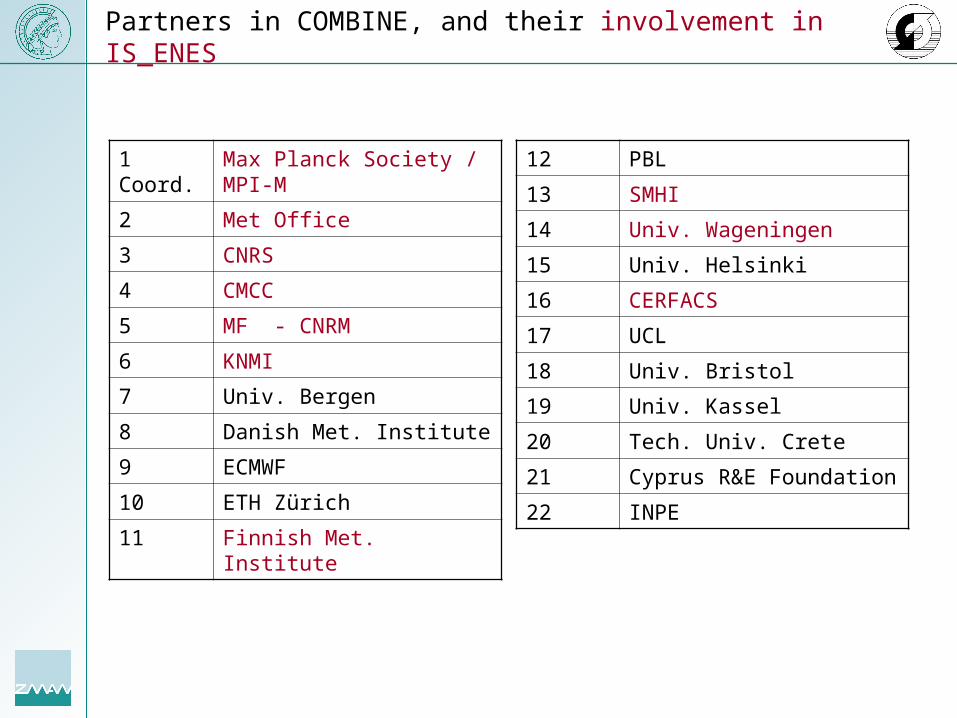
Partners in COMBINE, and their involvement in IS_ENES
1 Coord. Max Planck Society / MPI-M
2 Met Office
3 CNRS
4 CMCC
5 MF - CNRM
6 KNMI
7 Univ. Bergen
8 Danish Met. Institute
9 ECMWF
10 ETH Zürich
11 Finnish Met. Institute
12 PBL
13 SMHI
14 Univ. Wageningen
15 Univ. Helsinki
16 CERFACS
17 UCL
18 Univ. Bristol
19 Univ. Kassel
20 Tech. Univ. Crete
21 Cyprus R&E Foundation
22 INPE

Selected key questions in climate research
Do internal modes of variability exist in the climate system that allow skillful climate prediction on decadal time scales? What is the nature of these modes? Initialization methods and data? In which regions does predictability exist? For which time scales is a prediction skillful? (5, 10, 20 years?)
What is the role of different processes and related feedbacks for climate sensitivity and climate change on the centennial time scale (until 2100 and longer)? Carbon and nitrogen cycles (and methane) Clouds aerosols and chemistry Stratospheric dynamics Cryosphere: sea ice and ice shields
How to develop new mitigation scenarios?F( impacts( climate change( RCP scenarios, feedbacks ) )
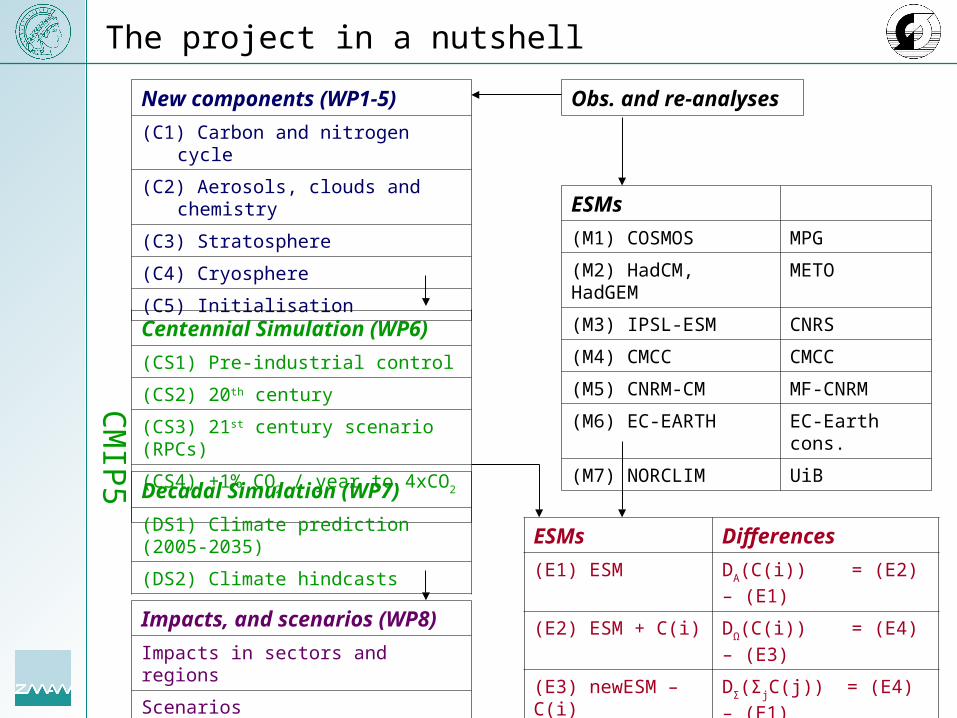
The project in a nutshell
New components (WP1-5)
(C1) Carbon and nitrogen cycle
(C2) Aerosols, clouds and chemistry
(C3) Stratosphere
(C4) Cryosphere
(C5) Initialisation
ESMs Differences
(E1) ESM DΑ(C(i)) = (E2) – (E1)
(E2) ESM + C(i) DΩ(C(i)) = (E4) – (E3)
(E3) newESM – C(i) DΣ(ΣjC(j)) = (E4) – (E1)
(E4) newESM
Centennial Simulation (WP6)
(CS1) Pre-industrial control
(CS2) 20th century
(CS3) 21st century scenario (RPCs)
(CS4) +1% CO2 / year to 4xCO2
ESMs
(M1) COSMOS MPG
(M2) HadCM, HadGEM METO
(M3) IPSL-ESM CNRS
(M4) CMCC CMCC
(M5) CNRM-CM MF-CNRM
(M6) EC-EARTH EC-Earth cons.
(M7) NORCLIM UiB
Decadal Simulation (WP7)
(DS1) Climate prediction (2005-2035)
(DS2) Climate hindcasts
Impacts, and scenarios (WP8)
Impacts in sectors and regions
Scenarios
Obs. and re-analyses
CM
IP5

Example: Exploring CMIP5 expts in ENSEMBLES
Method proposed for the future CMIP5 experiments, i.e. experiments for the 5th IPCC assessment of climate change (Hibbard et al., 2007):
ConcentrationsSurface temperatureEmissions
2B 1 2A
Carbon cycle - climate model
Impacts in regions and sectorsStory lines
(Mitigation) Scenario
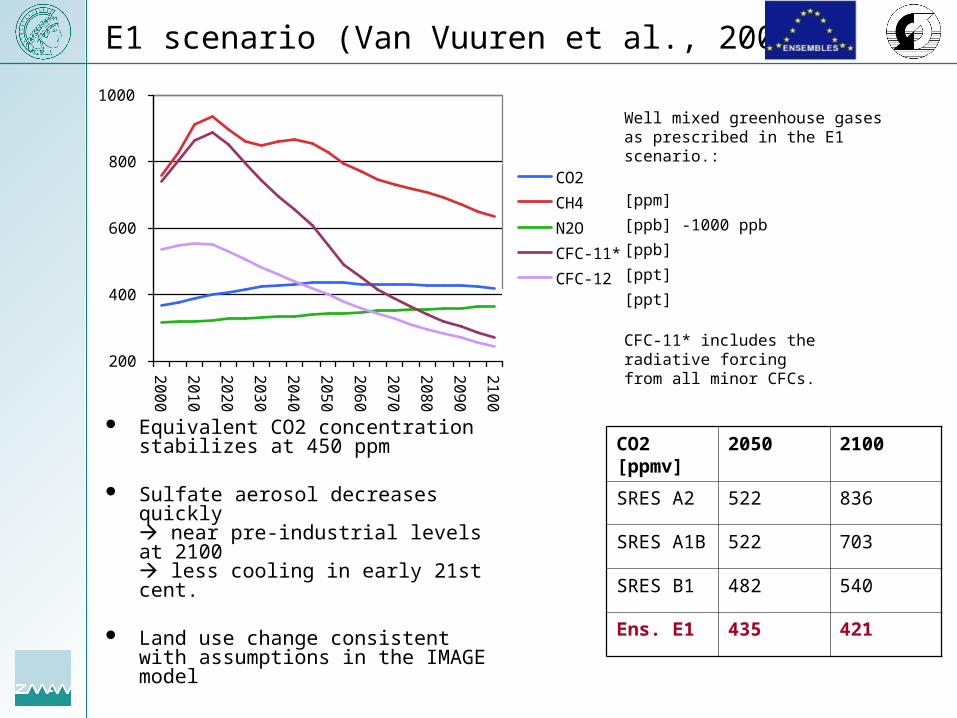
E1 scenario (Van Vuuren et al., 2007)
Equivalent CO2 concentration stabilizes at 450 ppm
Sulfate aerosol decreases quickly near pre-industrial levels at 2100 less cooling in early 21st cent.
Land use change consistent with assumptions in the IMAGE model
200
400
600
800
1000
2000
2010
2020
2030
2040
2050
2060
2070
2080
2090
2100
CO2
CH4
N2O
CFC-11*
CFC-12
Well mixed greenhouse gases as prescribed in the E1 scenario.:
[ppm]
[ppb] -1000 ppb
[ppb]
[ppt]
[ppt]
CFC-11* includes the radiative forcingfrom all minor CFCs.
CO2 [ppmv]
2050 2100
SRES A2 522 836
SRES A1B 522 703
SRES B1 482 540
Ens. E1 435 421
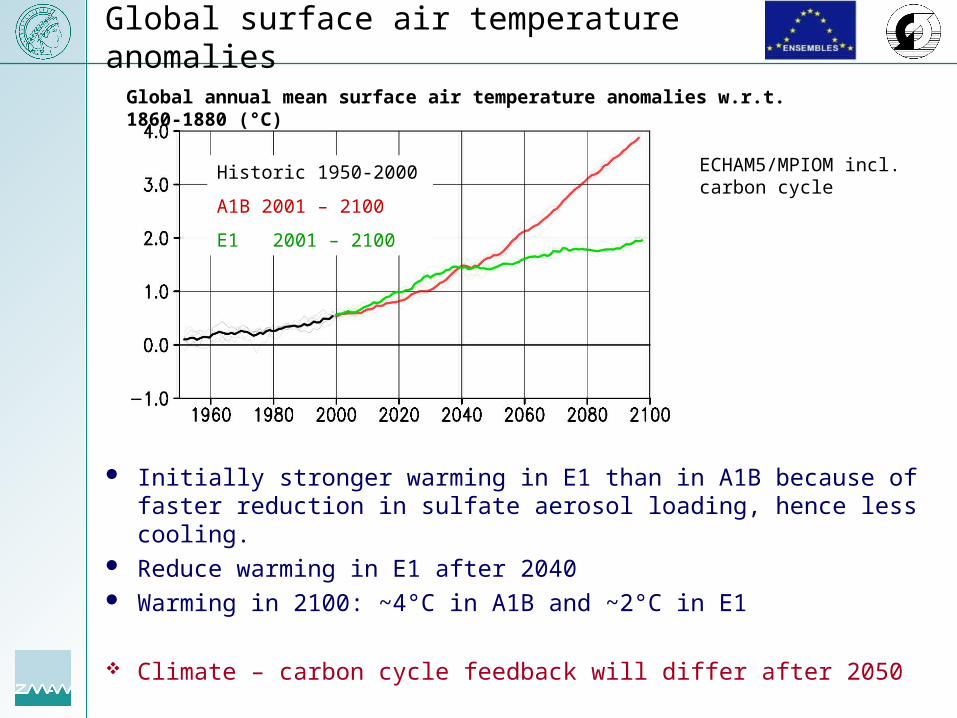
Global surface air temperature anomalies
Initially stronger warming in E1 than in A1B because of faster reduction in sulfate aerosol loading, hence less cooling.
Reduce warming in E1 after 2040 Warming in 2100: ~4°C in A1B and ~2°C in E1
Climate – carbon cycle feedback will differ after 2050
Historic 1950-2000
A1B 2001 – 2100
E1 2001 – 2100
Global annual mean surface air temperature anomalies w.r.t. 1860-1880 (°C)
ECHAM5/MPIOM incl.carbon cycle
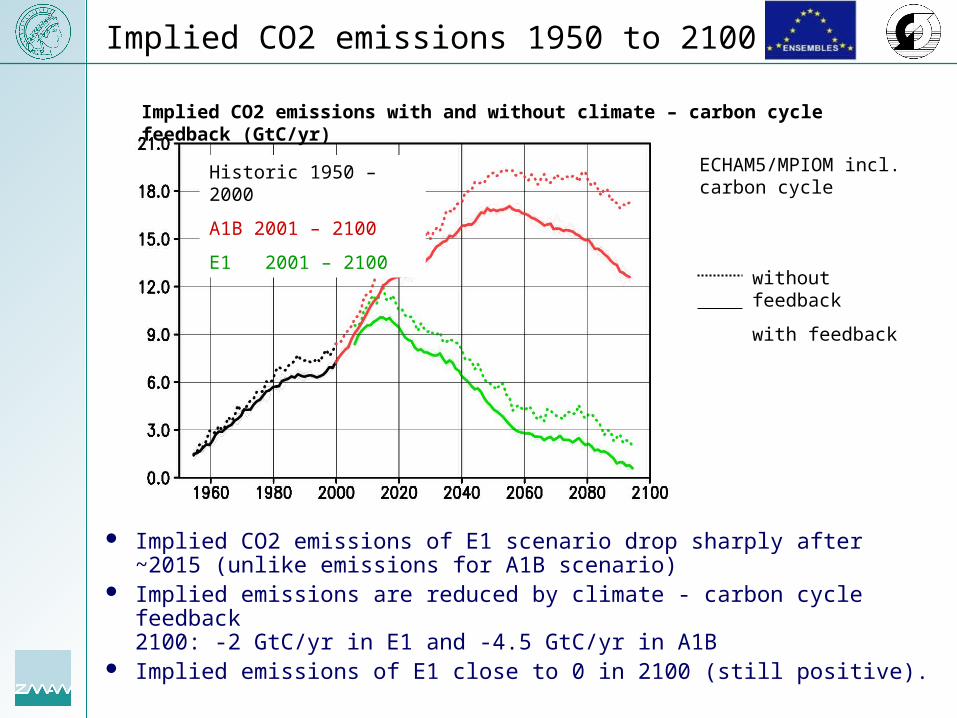
Implied CO2 emissions 1950 to 2100
Implied CO2 emissions of E1 scenario drop sharply after ~2015 (unlike emissions for A1B scenario)
Implied emissions are reduced by climate - carbon cycle feedback2100: -2 GtC/yr in E1 and -4.5 GtC/yr in A1B
Implied emissions of E1 close to 0 in 2100 (still positive).
Historic 1950 – 2000
A1B 2001 – 2100
E1 2001 – 2100
Implied CO2 emissions with and without climate – carbon cycle feedback (GtC/yr)
without feedback
with feedback
ECHAM5/MPIOM incl.carbon cycle
Summary
In COMBINE we hope to make some interesting science w.r.t. The role of different processes for feedbacks that regulate
climate change Predictability on the decadal time scale related to the internal
variability of the climate system and initialization techniques Impacts in sectors and regions for RCP scenarios Iterative improvement of mitigation scenarios.
And we hope for a fruitful interaction with IS-ENES: Infrastructure support in archiving, and dissemination of large
data sets for the full project lifetime (CMIP5 and beyond) Generally more transparent supercomputing and data
processing infrastructure at the European and international level.

Thank you

COMBINE & IPCC-AR5 time lines
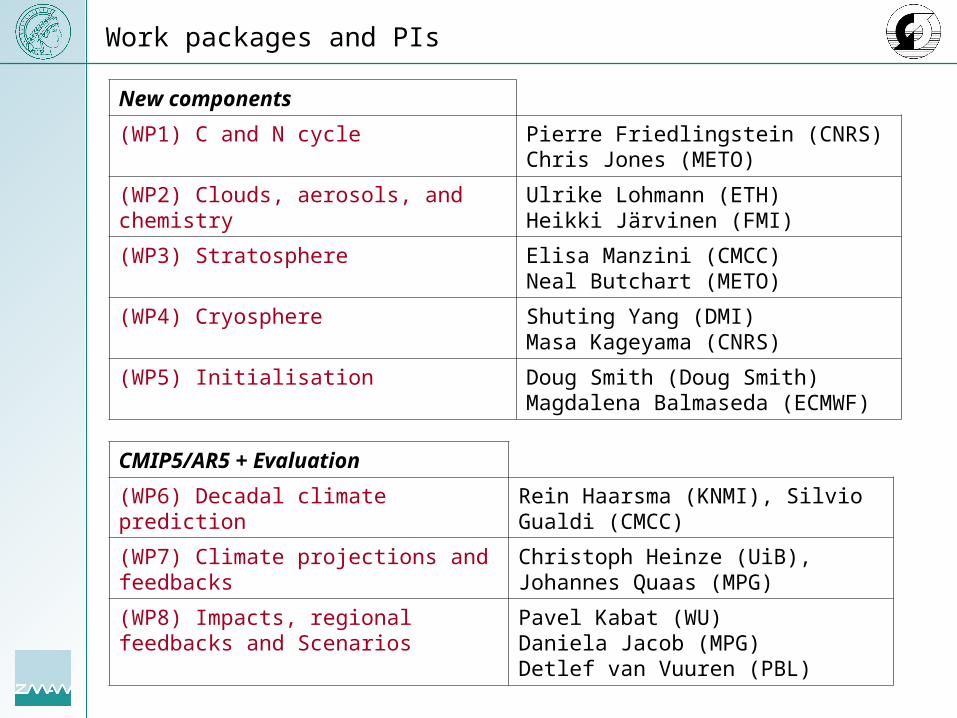
Work packages and PIs
New components
(WP1) C and N cycle Pierre Friedlingstein (CNRS)Chris Jones (METO)
(WP2) Clouds, aerosols, and chemistry Ulrike Lohmann (ETH)Heikki Järvinen (FMI)
(WP3) Stratosphere Elisa Manzini (CMCC)Neal Butchart (METO)
(WP4) Cryosphere Shuting Yang (DMI)Masa Kageyama (CNRS)
(WP5) Initialisation Doug Smith (Doug Smith)Magdalena Balmaseda (ECMWF)
CMIP5/AR5 + Evaluation
(WP6) Decadal climate prediction Rein Haarsma (KNMI), Silvio Gualdi (CMCC)
(WP7) Climate projections and feedbacks
Christoph Heinze (UiB), Johannes Quaas (MPG)
(WP8) Impacts, regional feedbacks and Scenarios
Pavel Kabat (WU)Daniela Jacob (MPG)Detlef van Vuuren (PBL)
Text of call FP7-ENV-2008-1
Area 6.1.1.4. Future Climate
ENV.2008.1.1.4.1. New components in Earth System modelling for better climate projectionsFuture climate predictions necessitate development of models which incorporate more complete range of Earth System parameters in comparison to the existing ones, as well as the Earth System feedbacks on future climate change. Incorporation of Earth system components (e.g., chemistry, stratosphere, nitrogen cycle, aerosols and ozone, cryosphere, ocean biochemistry and carbon sink, human dimension) within climate models and applications of these to a number of case studies (e.g. decadal-timescale prediction). Implications of these feedbacks for impacts of climate change on different sectors (e.g. water resources, agriculture, forestry, air quality) through specific simulations.
Expected impact: The project outcome should contribute to the 5th IPCC assessment on climate change and provide solid scientific basis for future policy actions at European and international level …
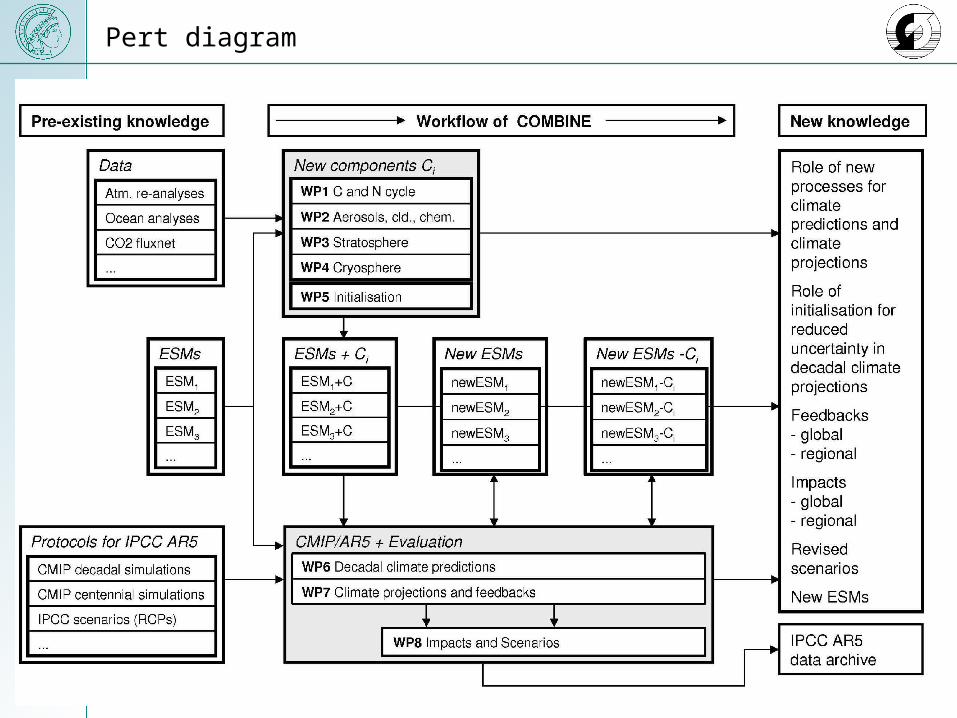
Pert diagram
Motivation for this study
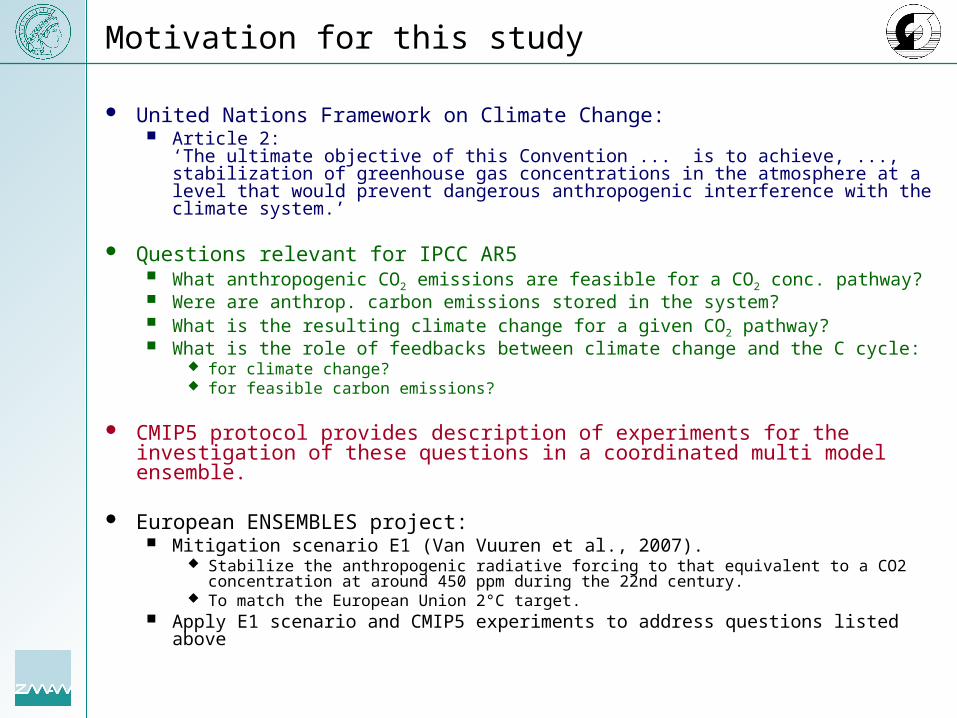
United Nations Framework on Climate Change: Article 2:
‘The ultimate objective of this Convention ... is to achieve, ..., stabilization of greenhouse gas concentrations in the atmosphere at a level that would prevent dangerous anthropogenic interference with the climate system.’
Questions relevant for IPCC AR5 What anthropogenic CO2 emissions are feasible for a CO2 conc. pathway? Were are anthrop. carbon emissions stored in the system? What is the resulting climate change for a given CO2 pathway? What is the role of feedbacks between climate change and the C cycle:
for climate change? for feasible carbon emissions?
CMIP5 protocol provides description of experiments for the investigation of these questions in a coordinated multi model ensemble.
European ENSEMBLES project: Mitigation scenario E1 (Van Vuuren et al., 2007).
Stabilize the anthropogenic radiative forcing to that equivalent to a CO2 concentration at around 450 ppm during the 22nd century.
To match the European Union 2°C target. Apply E1 scenario and CMIP5 experiments to address questions listed above

Pre-industrial control simulation
Climate of undisturbed system stable over 1000 years,no systematic drift in surface air temperature or CO2 concentration
Surface air temperature(left scale, °C)
Atmospheric CO2 concentration (right scale, ppmv)
Global annual mean surface air temperature (°C) and CO2 concentration (ppmv) Pre-industrial conditions, thick lines: 11-year running means
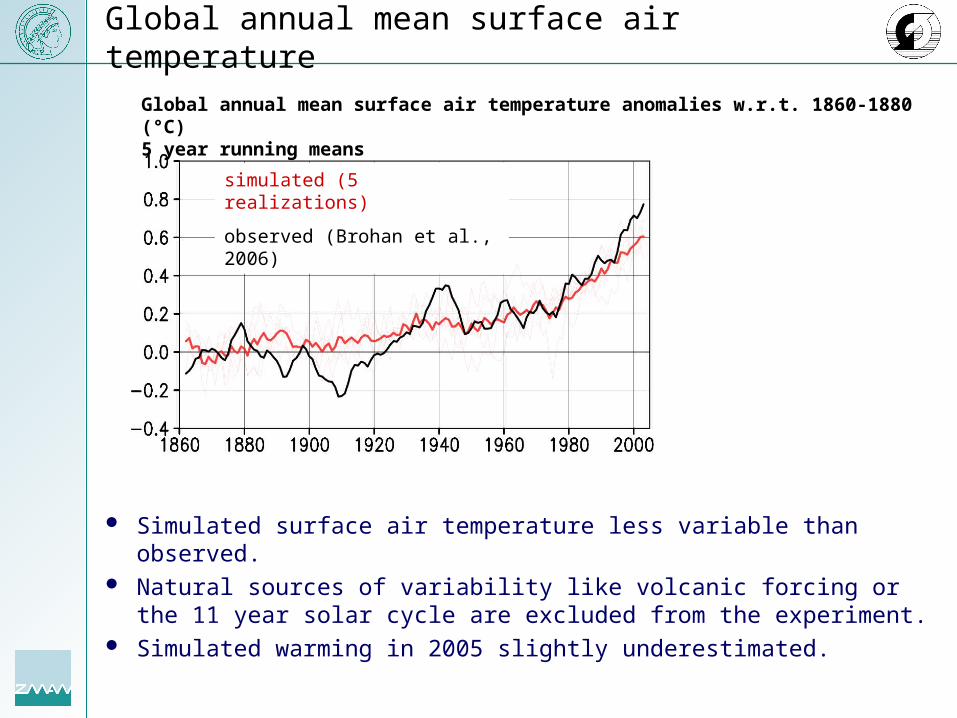
Global annual mean surface air temperature
Simulated surface air temperature less variable than observed. Natural sources of variability like volcanic forcing or the 11 year
solar cycle are excluded from the experiment. Simulated warming in 2005 slightly underestimated.
Global annual mean surface air temperature anomalies w.r.t. 1860-1880 (°C)5 year running means
simulated (5 realizations)
observed (Brohan et al., 2006)
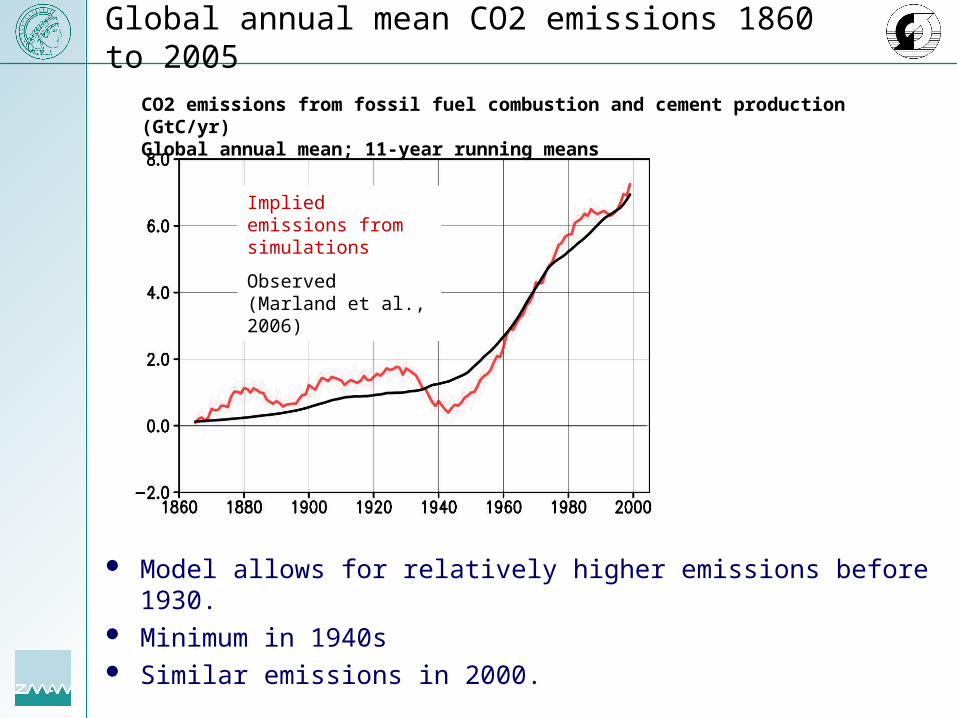
Global annual mean CO2 emissions 1860 to 2005
Model allows for relatively higher emissions before 1930. Minimum in 1940s Similar emissions in 2000.
Implied emissions from simulations
Observed (Marland et al., 2006)
CO2 emissions from fossil fuel combustion and cement production (GtC/yr)Global annual mean; 11-year running means
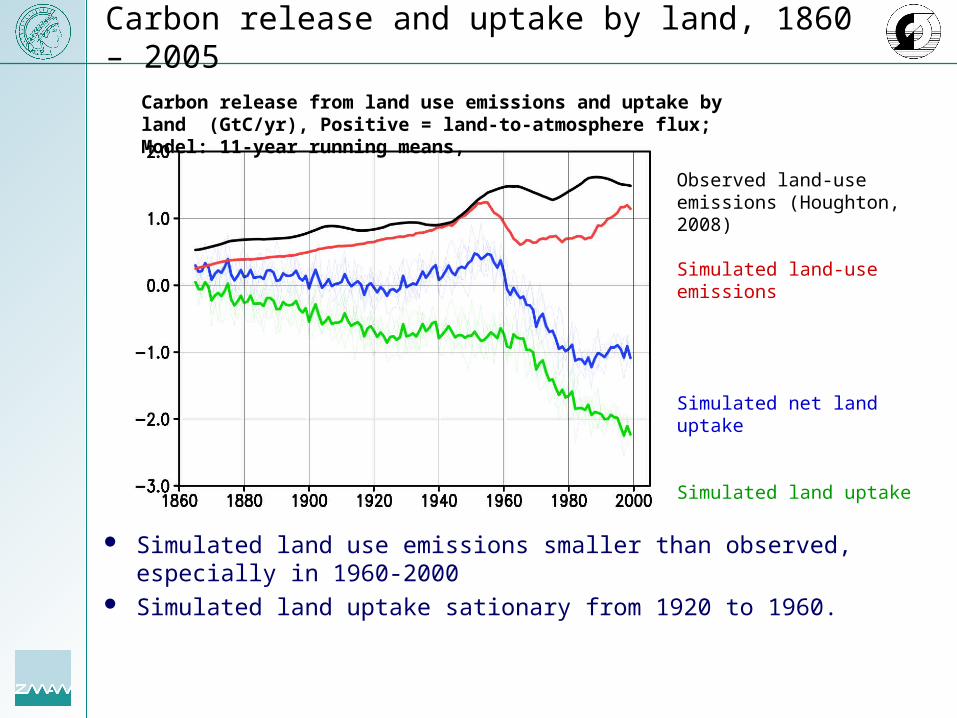
Carbon release and uptake by land, 1860 – 2005
Simulated land use emissions smaller than observed, especially in 1960-2000
Simulated land uptake sationary from 1920 to 1960.
Observed land-use emissions (Houghton, 2008)
Simulated land-use emissions
Simulated net land uptake
Simulated land uptake
Carbon release from land use emissions and uptake by land (GtC/yr), Positive = land-to-atmosphere flux; Model: 11-year running means,
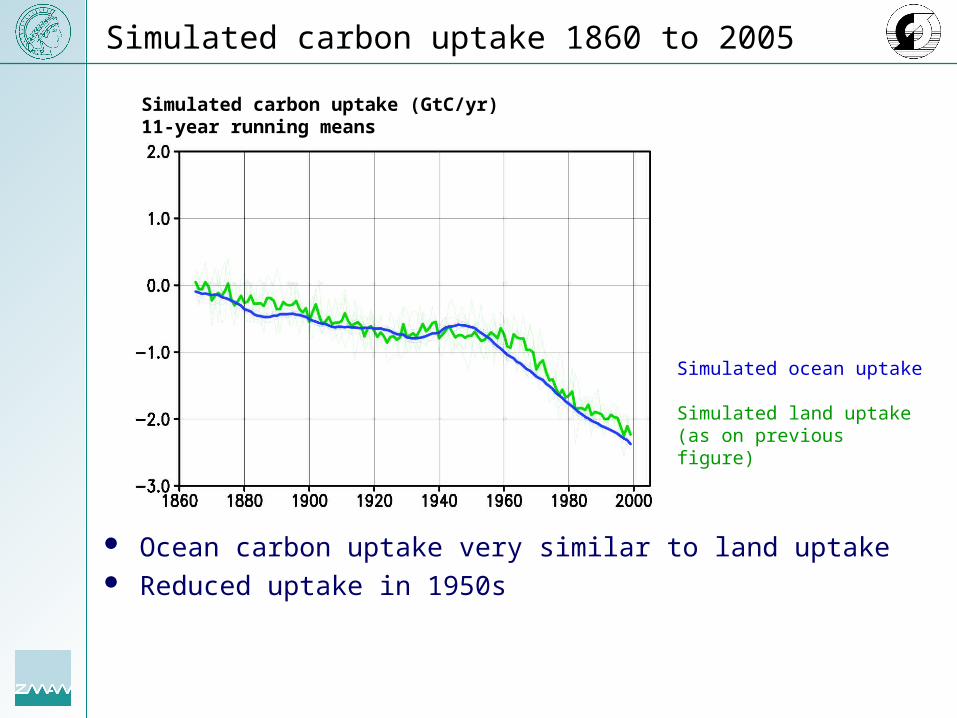
Simulated carbon uptake 1860 to 2005
Ocean carbon uptake very similar to land uptake Reduced uptake in 1950s
Simulated carbon uptake (GtC/yr)11-year running means
Simulated ocean uptake
Simulated land uptake(as on previous figure)

Momentum, Energy, H2O, CO2
OceanMPIOM 3°L40
HAMOCC
LandHD
JSBACH
AtmosphereECHAM5 T31/L19
~4°
Solar variations
Volcanic aerosolCO2 emissions/conc.
Carbon cycle climate model
Natural forcingAnthropogenic forcing
Land use change
CH4, N2O, CFC conc.
Carbon cycle – climate model
X X
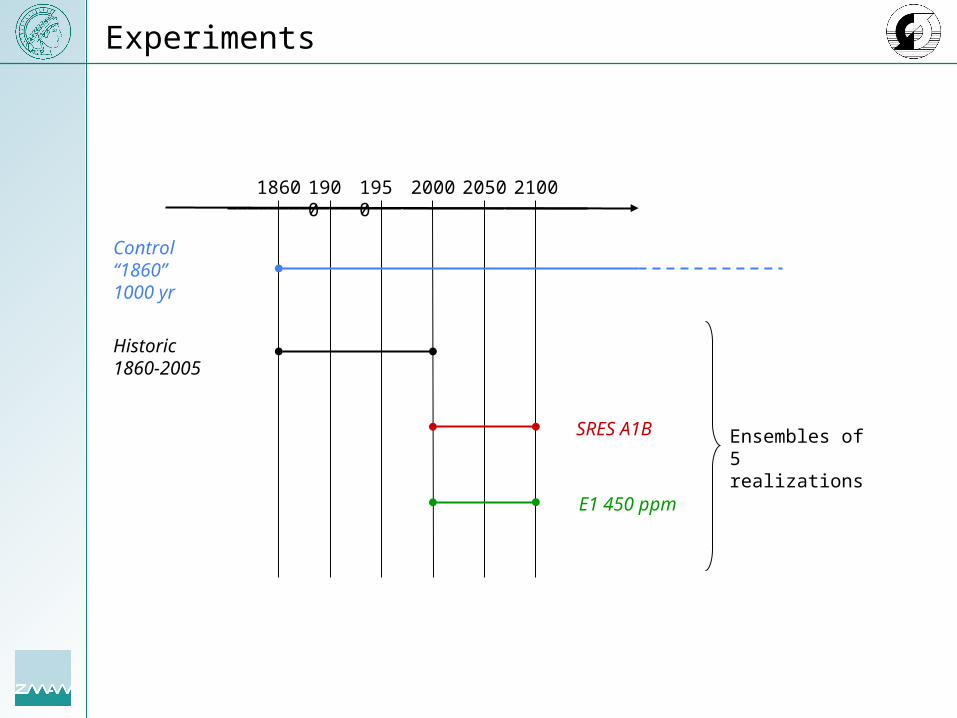
Experiments
E1 450 ppm
SRES A1B
1860 1900 1950 2000 2050 2100
Historic1860-2005
Control“1860”1000 yr
Ensembles of 5 realizations
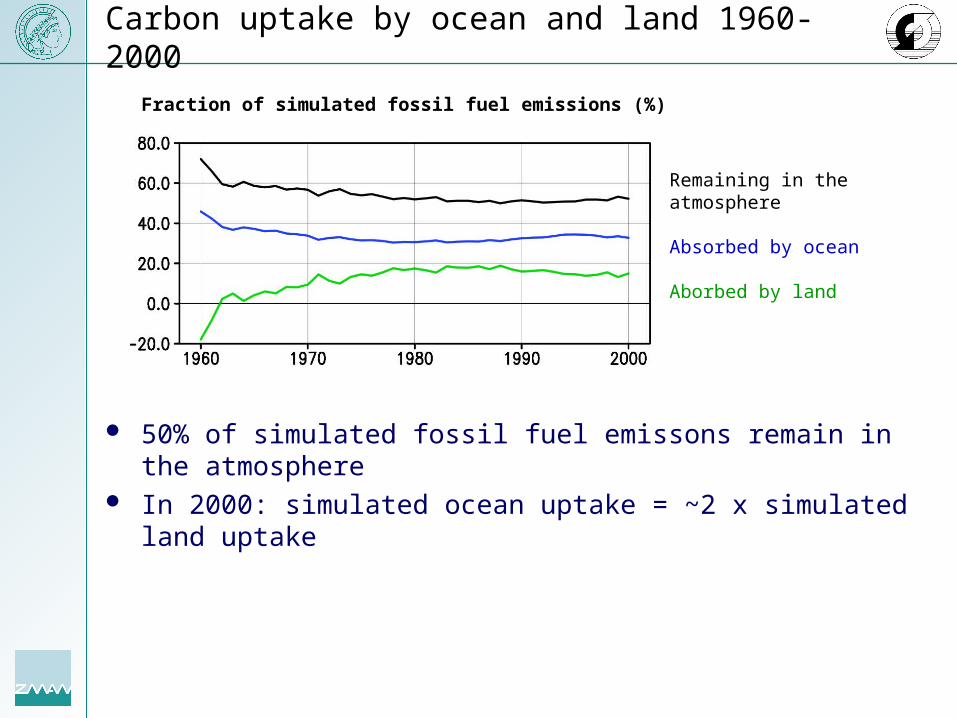
Carbon uptake by ocean and land 1960-2000
50% of simulated fossil fuel emissons remain in the atmosphere In 2000: simulated ocean uptake = ~2 x simulated land uptake
Remaining in the atmosphere
Absorbed by ocean
Aborbed by land
Fraction of simulated fossil fuel emissions (%)
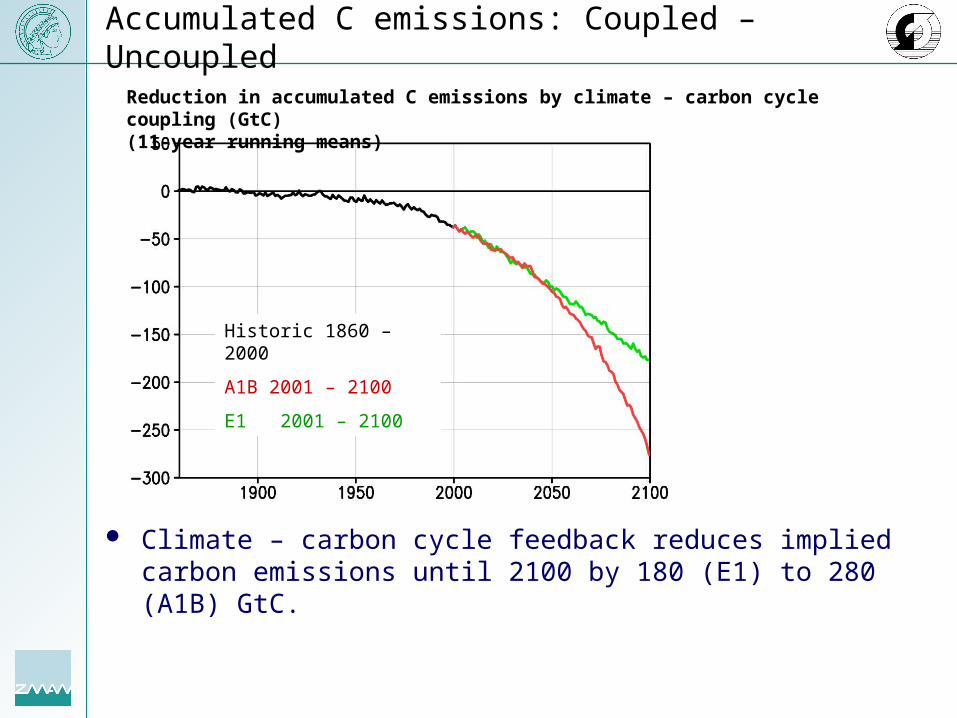
Accumulated C emissions: Coupled – Uncoupled
Climate – carbon cycle feedback reduces implied carbon emissions until 2100 by 180 (E1) to 280 (A1B) GtC.
Historic 1860 – 2000
A1B 2001 – 2100
E1 2001 – 2100
Reduction in accumulated C emissions by climate – carbon cycle coupling (GtC)(11-year running means)

Fig.12
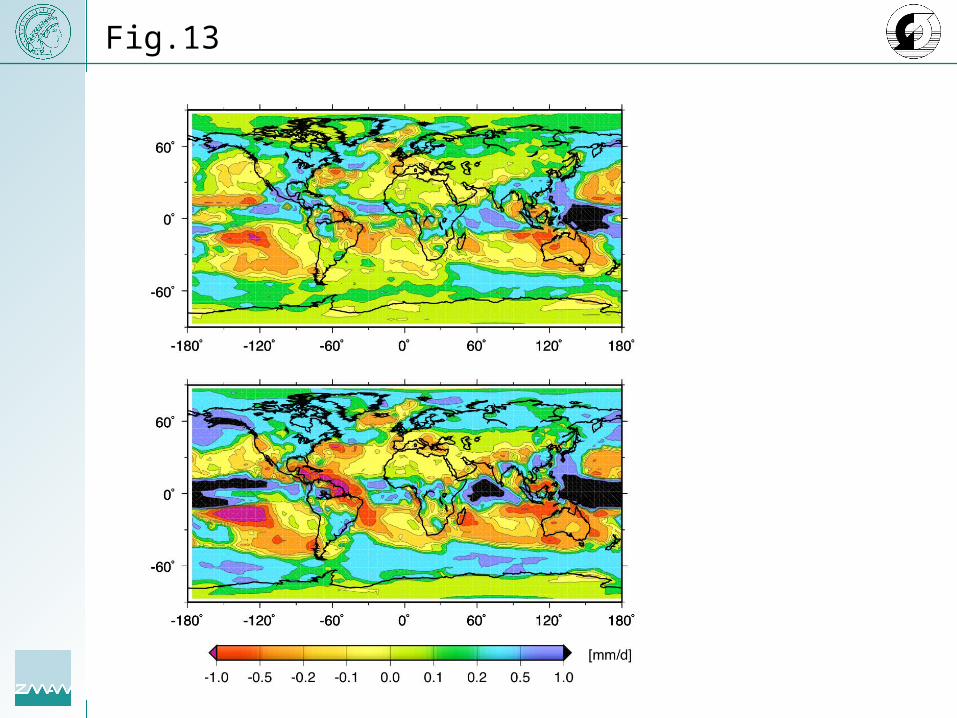
Fig.13

Surface C uptake: Coupled – uncoupled
Regions with negative differences take up less carbon under global warming conditions and contribute to a positive feedback between climate and carbon cycle.
Stabilization scenario E1 (2080 to 2100)
IPCC SRES scenario A1B (2080 to 2100)
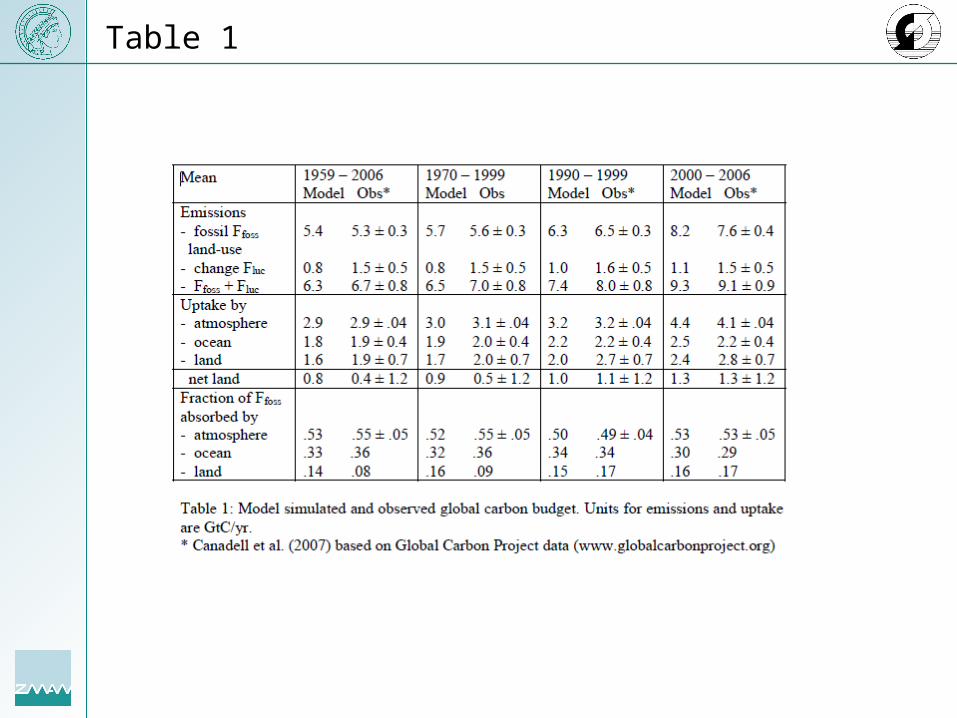
Table 1
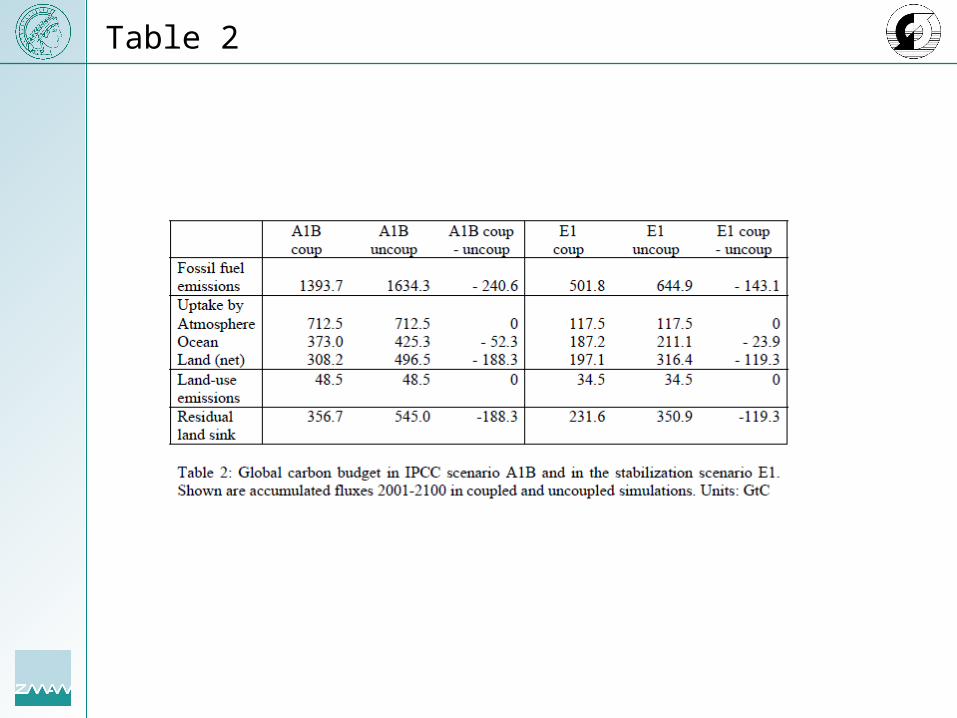
Table 2