call for storyboards! the 2014 quality & patient safety roadmap will feature keynote speakers,...
TRANSCRIPT

Call for Storyboards!
The 2014 Quality & Patient Safety Roadmap will feature keynote speakers, panelists and storyboard sessions focused on engaging patients and families in eliminating harm across the board.
Submit your harm across the board storyboard to share your organization’s experience in eliminating harm and be featured during the storyboard sessions at Roadmap! Details on how to complete the storyboard template and submission details are included in this slide deck.
Please contact [email protected] with any questions.

Eliminating Harm Across the Board (HAB) Template

Objectives
3
• Understand what the Eliminating HAB report is and how it is a helpful tool in improving care.
• Understand how to complete your Eliminating HAB report.
• Understand how to submit your Eliminating HAB report.
• Know who to contact if you have questions.

How is Eliminating HAB applicable to SLHQ?
4
The Patient

Your W(hat’s) I(n) I(t) F(or) M(e): WIIFM
5
• The Eliminating HAB report will: • Help shift your organizational culture; • Put a face on harm; • Tell a compelling story to support
change; • Promote transparency;• Engage patients and their families
and/or Patient and Family Advisory Council (PFAC) members; and
• Help you track your overall harm per discharge and identify the greatest opportunities for eliminating harm.

Eliminating HAB Storyboard Example
6

Sharing Your Eliminating HAB Storyboard at Roadmap
7
In 2013, Roadmap participants shared their
HAB storyboards with colleagues. In 2014, the
Roadmap HAB storyboards will focus on engaging patients and families in
eliminating harm.

The Eliminating HAB Template:
Eight key slides and tips for how to complete them.
8

Insert Hospital Name HereInsert Your Motto Here, e.g. “Our Bottom-line Line is Patient
Safety”Slide 1
Customize the motto
Insert a photo of your hospital and
logo here.
Insert a photo of your Safety Team,
including your CEO and PFA(s) here.
Insert a caption here, including the names of
your Safety Team, CEO and PFAs.
Insert a caption here, including the name of your hospital and the city and
state where you are located.
Customize the team info.

0.00000.01000.02000.03000.04000.05000.06000.07000.08000.09000.1000
Jan-
12
Feb-
12
Mar
-12
Apr
-12
May
-12
Jun-
12
Jul-1
2
Aug
-12
Sep-
12
Oct
-12
Nov
-12
Dec
-12
Jan-
13
Feb-
13
Mar
-13
Apr
-13
May
-13
Jun-
13
Jul-1
3
Aug
-13
Sep-
13
Oct
-13
Nov
-13
Dec
-13
Tota
l Har
m/D
isch
arge
Jan-12
Feb-12
Mar-12
Apr-12
May-12
Jun-12
Jul-12
Aug-12
Sep-12
Oct-12
Nov-12
Dec-12
Jan-13
Feb-13
Mar-13
Apr-13
May-13
Jun-13
Jul-13
Aug-13
Sep-13
Oct-13
Nov-13
Dec-13
Baseline 0.09 0.09 0.09 0.09 0.09 0.09 0.09 0.09 0.09 0.09 0.09 0.09 0.09 0.09 0.09 0.09 0.09 0.09 0.09 0.09 0.09 0.09 0.09 0.09
Hospital 0.06 0.07 0.04 0.08 0.02 0.03 0.02 0.04 0.03 0.01 0.01 0.02 0.01 0.01 0.02 0.00 0.01 0.00 0.01 0.00 0.01 0.00
Goal 0.04 0.04 0.04 0.04 0.04 0.04 0.04 0.04 0.04 0.04 0.04 0.04 0.04 0.04 0.04 0.04 0.04 0.04 0.04 0.04 0.04 0.04 0.04 0.04
Total Harm per Discharge
Insert a title for your “Total Harms per Discharge” run chart here
e.g., “Cut Harm Across the Board in ½”Customize the heading
Insert your total harm run chart
Slide 2

Insert a title for your “topic-specific” run chart here e.g., “2014 Breakthrough in
Reducing CAUTI: Journey to Zero”Customize the heading and slide based on which specific measure you want to highlight. Insert a
topic-specific run chart
0.0
20.0
40.0
60.0
80.0
100.0
120.0
Jan
-12
Feb
-12
Mar
-12
Ap
r-12
May
-12
Jun
-12
Jul-
12
Au
g-12
Sep
-12
Oct
-12
No
v-12
Dec
-12
Jan
-13
Feb
-13
Mar
-13
Ap
r-13
May
-13
Jun
-13
Jul-
13
Au
g-13
Sep
-13
Oct
-13
No
v-13
Dec
-13
CA
UTI
Rat
e/1,
000
Cat
het
er D
ays
Jan-12
Feb-12
Mar-12
Apr-12
May-12
Jun-12
Jul-12
Aug-12
Sep-12
Oct-12
Nov-12
Dec-12
Jan-13
Feb-13
Mar-13
Apr-13
May-13
Jun-13
Jul-13
Aug-13
Sep-13
Oct-13
Nov-13
Dec-13
Baseline 100. 100. 100. 100. 100. 100. 100. 100. 100. 100. 100. 100. 100. 100. 100. 100. 100. 100. 100. 100. 100. 100. 100. 100.
Hospital 105. 66.6 33.3 100. 83.3 45.4 0.00 0.00 52.6 0.00 0.00 52.6 0.00 0.00 52.6 0.00 52.6 0.00 0.00 0.00 0.00 0.00
Goal 60.0 60.0 60.0 60.0 60.0 60.0 60.0 60.0 60.0 60.0 60.0 60.0 60.0 60.0 60.0 60.0 60.0 60.0 60.0 60.0 60.0 60.0 60.0 60.0
Catheter Associated Urinary Tract Infections
Slide 3

AEAs Estimated annual number of patients at risk in each area Number of Opportunities
ADE # of discharges:
CAUTI # pts in IP units with catheter in place:
CLABSI # pts in IP units with central lines:
Falls # of discharges:
EED # of women with elective deliveries
OB # of women with deliveries:
HAPU # of discharges:
SSI # of inpatient surgeries:
VAE # of patients on a ventilator:
VTE # of discharges:
TOTAL Risk opportunities for harm across the board
Readmit. # of inpatients at risk of readmit:
Risk Profile: Areas of Risk We Are Committed To ControllingAnnual discharges: __________ AEA risk
opportunities/discharge: _______Customize the risk opportunities/discharge
Customize the annual discharges
Slide 4
Note: “AEA”
= Adverse
Event Areas
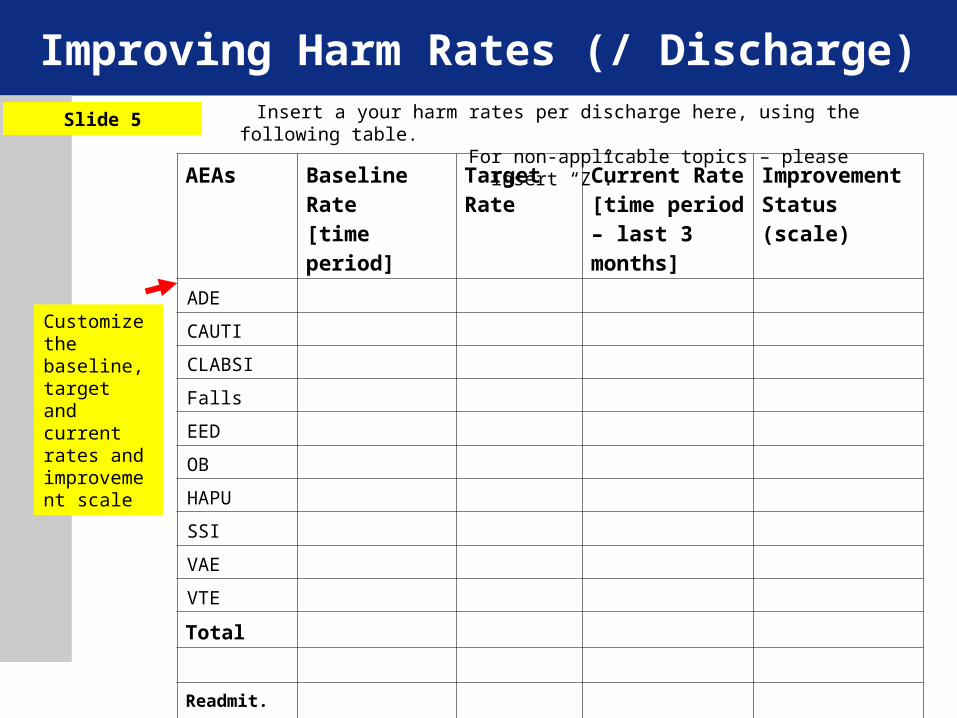
Improving Harm Rates (/ Discharge)
AEAs Baseline Rate[time period]
Target Rate
Current Rate[time period – last 3 months]
Improvement Status (scale)
ADE
CAUTI
CLABSI
Falls
EED
OB
HAPU
SSI
VAE
VTE
Total
Readmit.
Insert a your harm rates per discharge here, using the following table. For non-applicable
topics – please insert “Z”.
Customize the baseline, target and current rates and improvement scale
Slide 5

Hospital Risk Score Card
Our Safety Mandate
Annual Volume (Discharges)
Total risk: annual harm opportunities
Risks per patients (Total Opportunities)/Discharges)
Number of Risk Areas
Number of Risk Areas Applicable (0 – 11)
Number of Risk Areas Applicable & Adopted
Our Progress
Number of Areas with Major Improvement Opportunity
Number of Areas at Improvement Target
Number of Areas at IDEAL
Insert your risk score card here, using the following table:
Customize your score card
Slide 6
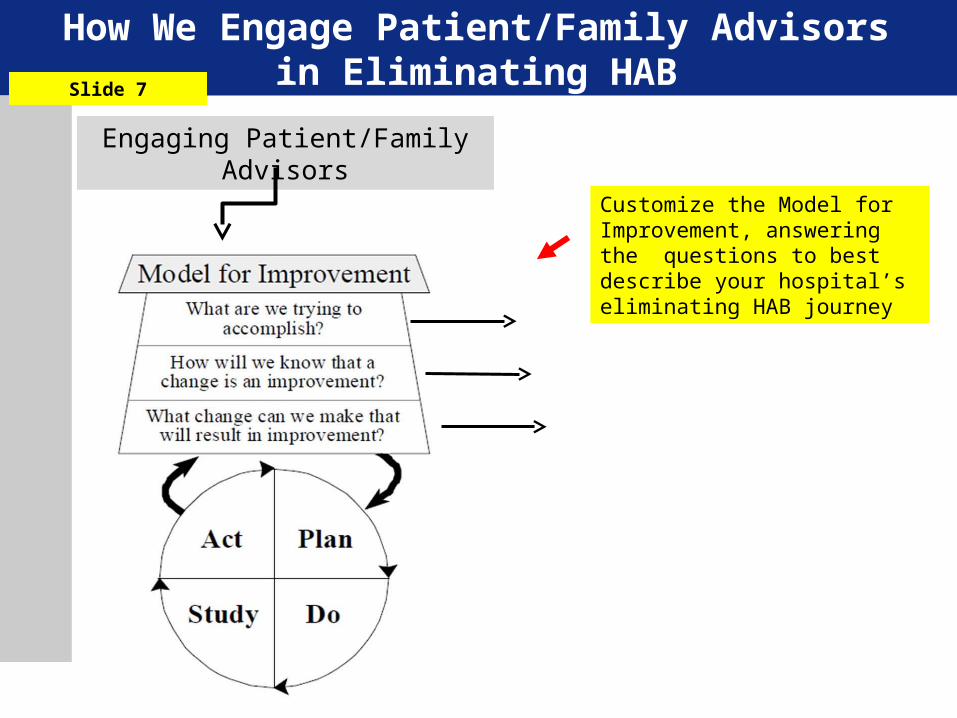
How We Engage Patient/Family Advisors in Eliminating HAB
Engaging Patient/Family Advisors
Customize the Model for Improvement, answering the questions to best describe your hospital’s eliminating HAB journey
Slide 7

Our Results and Pearls
Results: A concise description of what you achieved, as it relates to eliminating HAB and engaging PFAs.
Customize your responses
Slide 8
PFA Quote: Insert a PFA quote here about eliminating HAB.
Pearls: Bullet your biggest insights about what worked and how.
- Include what you tested and learned.- Include how you will advance this
topic over the next month (and beyond). - List the most important drivers of
safety that produced these results. Make this list succinct, high-level and clear.
- Include the PFA insights, thoughts and feedback

17
Eliminating HAB Template: Examples and
Tips

How we Incorporated a Patient/Family Advisor (PFA) into our Journey to
Eliminate HAB
18
Patient/Family Advisors Suggestions for reducing ADE
Slide 7 (EXAMPLE)
Reduce the incidence of preventable adverse drug
events14 ADEs/month to 8 ADEs/month
Have pictures of medications taken at the bedside for patients and
families

Our Results and Pearls
19
Results: Reduced ADE by 25% over 6 months. Slide 8 EXAMPLE
“ I always taped a pill on to the medication list for my father so he knew what he was taking. It was so meaningful to share this idea and to
see it help other patients”
Pearls: •Two patient/family advisors were on the ADE committee•They shared the various ways that they organized medications at home and suggested that providing patients with pictures of the pills they were taking in the hospital (since some looked different than what they were taking at home) would help patients and families to know what they were being given and why•At discharge patients received up to date medication lists that included pictures
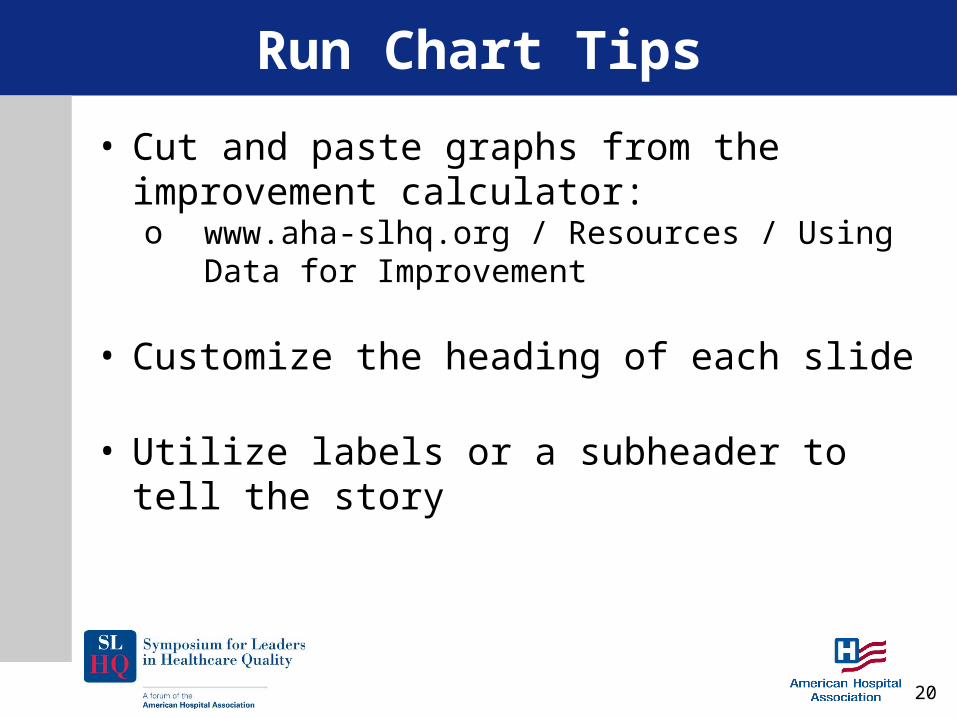
Run Chart Tips
20
• Cut and paste graphs from the improvement calculator:o www.aha-slhq.org / Resources / Using Data
for Improvement
• Customize the heading of each slide
• Utilize labels or a subheader to tell the story
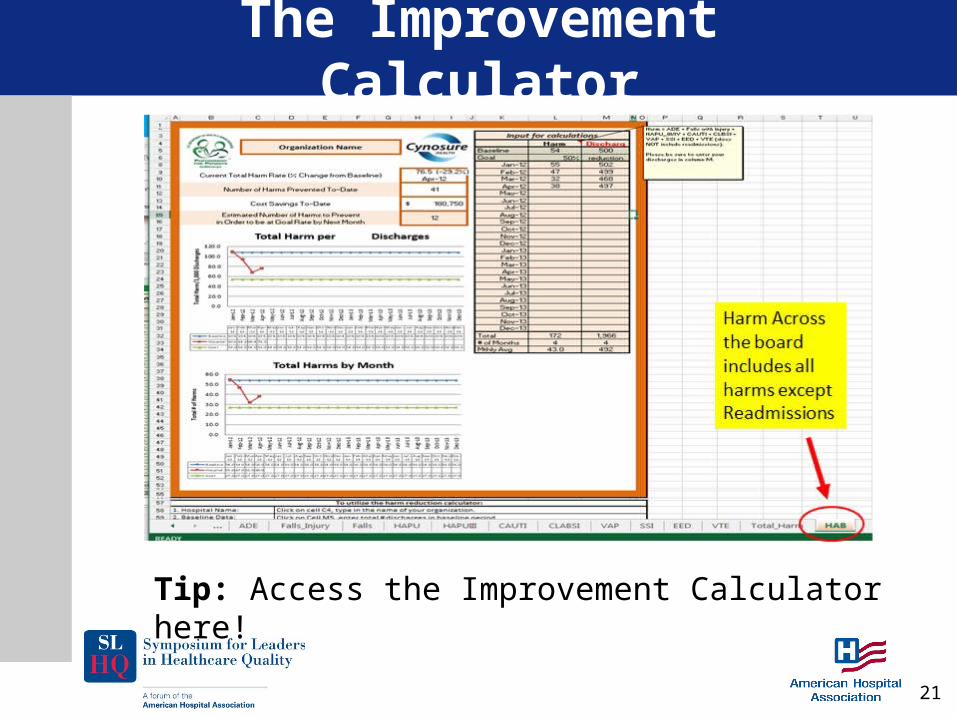
The Improvement Calculator
21
Tip: Access the Improvement Calculator here!

Risk Profile Tips
22
• These calculations only need to be completed once
• Use one year of data – using baseline
• For Patient Counts for CLABSI, CAUTI, VAEo Use charge master for # of
catheter trays ordered, or # of patients with ventilator charges, or divide your device days by average length of stay
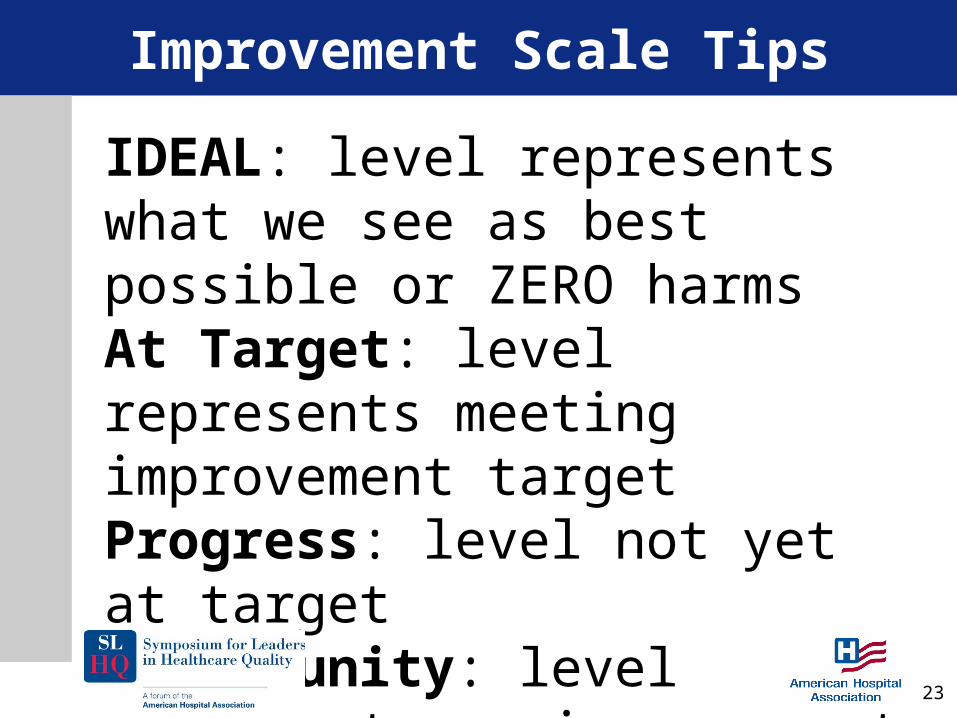
Improvement Scale Tips
23
IDEAL: level represents what we see as best possible or ZERO harms At Target: level represents meeting improvement target Progress: level not yet at target Opportunity: level represents an improvement opportunity

Hospital Risk Score Card Tips
24
• Our Safety Mandate: use #’s from Risk Profile
• Number of Risk Areas Applicable - includes Readmissions (the max. = 11)
• Our Progress: use Improvement Scale definitions from Improving AEAs per Discharge Slide
• Total Risks per patient: is calculated from total harm opportunities divided by total discharges per applicable risk areas, e.g. - if no vents. or births: 8

Pearl Tips
25
• Provide enough detail about the strategy or tactic so others can easily replicate
• Provide examples of key cultural change strategies. For example:o Transparency of datao Front line staff engagemento Senior management supporto Seamless transitionso Recognitiono Promoting a Culture of Safety
• Share learnings and ideas tested• Highlight how strategies be expanded and
spread

Submission Process
26
• We encourage you to submit your Eliminating HAB Report for the upcoming Quality & Safety Roadmap Meeting, as well as on our SLHQ Members LISTSERV®: [email protected]
• For more details - please contact us! See the following slide for contact information.

Questions? Contact Us!
Website: www.aha-slhq.org Email: [email protected]
LISTSERV®: [email protected]: (773) 270-3127
Office: 155 N. Wacker Dr., Ste. 400Chicago, IL 60606
Dr. Maulik Joshi: Senior Vice President, AHA and President, HRET ([email protected])
Charisse Coulombe, Vice President, HRET ([email protected])Jessica Blake, Senior Program Manager, HRET ([email protected])
Natalie Erb, Administrative Fellow, HRET ([email protected])
27