california’s market price referent: setting the bar for ... · pdf...
TRANSCRIPT

February 9, 2010 1
California’s Market Price Referent: Setting the Bar for
Renewables
ICEPAG 2010February 9, 2010
Costa Mesa, California
Lori Smith Schell, Ph.D.
TM

February 9, 2010 www.EmpoweredEnergy.com 2
Market Price Referent (“MPR”): Tool of RPS ImplementationRenewables Portfolio Standard (“RPS”)
Mandated 20% by 2010 (Senate Bill (“SB”)107, 9/26/2006)Targeted 33% by 2020 (Executive Order S-14-08, 11/17/2008)
California Public Utilities Commission (“CPUC”) DecisionsCPUC D.03-06-071
Order Initiating Implementation of the Senate Bill 1078 Renewables Portfolio Standard Program (6/19/2003)
Mandated 1% increase per year to reach 20% retail sales by 2017
CPUC D.04-06-015Opinion Adopting Market Price Referent Methodology (6/9/2004)
CPUC D.08-10-026Decision on Market Price Referent for the California Renewables Portfolio Standard (10/16/2008)

February 9, 2010 www.EmpoweredEnergy.com 3
MPR Proxy Plant: A Means to Apply Towards the End
The End: Establish market price referent (“MPR”) at or below which costs of long-term contracts with eligible renewable energy resources will be deemed reasonable and authorized in utility ratesThe Means: Define a “proxy plant” to model the long-term costs of fixed-price baseload electricity from a new natural gas-fired combined cycle generating facilityThe Application: Identify above-market costs of acquiring renewable resources and allocate funds to compensate
Compares NPV of contract price and MPR over contract termLimits RPS obligations of retail sellers to quantity that can beprocured with available fundingInitially, Supplemental Energy Payments (“SEPs”) awarded by the California Energy Commission (“CEC”), funded through Public Goods ChargeNow Above-Market Funds (“AMFs”) awarded by the CPUC

February 9, 2010 www.EmpoweredEnergy.com 4
MPR Cash Flow Model: Major Cost Categories
Solves for revenue needed to generate sufficient cash flow to cover all costs + provide required Internal Rate of ReturnUpdated Every YearMajor Cost Categories
Plant (Capital) CostsFixed CostsVariable CostsProperty TaxesInsuranceNatural Gas Fuel Costs

February 9, 2010 www.EmpoweredEnergy.com 5
I – MPR Proxy Plant:Financial Inputs
Debt50-70% of Plant (Capital) Costs6.5-8.03% Interest Rate20-Year Term
Return on Equity (%)20-Year Target
DepreciationTax Rates
Federal: 35%State: 8.84%Total Effective: 40.75%

February 9, 2010 www.EmpoweredEnergy.com 6
II – MPR Proxy Plant:Plant (Capital) Costs ($)
TurbinesBalance of PlantTransmission/Gas/Water InterconnectionsLandPermitting/SitingInterest During Construction/Financing CostEmissions Reduction Credits (“ERCs”)Initial Working CapitalInitial Spare PartsLocal Benefit & Mitigation CostsInsurance During Construction

February 9, 2010 www.EmpoweredEnergy.com 7
MPR Plant (Capital) Costs: Based on Actual GeneratorsCapital Costs
California natural gas combined cycle (“NGCC”) generating plants used as capital cost “go-by”
Palomar (SDG&E); as of 2005 MPR546 MW, San Diego County, Online 4/1/06
Cosumnes (SMUD); as of 2005 MPR500 MW (Phase 1), Sacramento County, Online 2/24/06
Colusa (PG&E); as of 2008 MPR660 MW, Colusa County, Estimated Online 10/1/10
Dry cooling assumed (+ $20 MM)Little room for attributing incremental benefits to renewables or distributed generation that requires any water use

February 9, 2010 www.EmpoweredEnergy.com 8
MPR Environmental Compliance Costs Depend on Geography
Colusa (PG&E)
Cosumnes (SMUD)
Palomar (SDG&E)
Data Source: CantorCO2e, 9/07-9/09 Market Quotes.

February 9, 2010 www.EmpoweredEnergy.com 9
III – MPR Proxy Plant:Fixed Costs ($/kW-yr)
Administrative & GeneralLaborOther O&MStation PowerTransmission O&MCapital Additions (Not Major Maintenance)Ongoing Spare PartsNegative Initial Working Capital
February 9, 2010 www.EmpoweredEnergy.com 10
IV – MPR Proxy Plant:Variable Costs ($/kWh)
Major MaintenanceWater/Consumables/Chemicals
Source of Fixed and Variable O&M Costs:CEC’s Report: “Comparative Costs of California Central Station Electricity Generation”
Updated every other yearIncludes fossil fuel, nuclear and renewable generationUsed to provides input to biannual Integrated Energy Policy Report

February 9, 2010 www.EmpoweredEnergy.com 11
MPR Proxy Plant: Cost Trends Over Time

February 9, 2010 www.EmpoweredEnergy.com 12
V – MPR Proxy Plant:Operational Inputs
Capacity and Capacity FactorHeat Rate (“HR”)
New and Clean (Btu/kWh, HHV)Annual Degradation Factor (Range: 1.69-3.50%)Average (Btu/kWh, HHV)
First Operational YearLosses (%)
Transformer Losses (0.50%)Losses to Load Center (1.50%)Not Location-Specific
Optimal location of renewables or distributed generation may avoid even greater losses

February 9, 2010 www.EmpoweredEnergy.com 13
Capacity Factor and Heat Rate: Clean & New vs. Average
HR
: B
tu/k
Wh
(HH
V) Capacity Factor
MPR:
“Economic” Capacity Factors

February 9, 2010 www.EmpoweredEnergy.com 14
VI – MPR Proxy Plant:Other Costs
Property Taxes1.20% of Plant (Capital) Costs
Insurance0.60% of Plant (Capital) Costs
Natural Gas Fuel CostsEmbedded 20-Year Forecast
Futures + FundamentalsLevelized Cost Basis
MPR Range (2004-2009): $6.02-$10.42/MMBtu

February 9, 2010 www.EmpoweredEnergy.com 15
Natural Gas Market Volatility Confounds Forecast Accuracy
$/M
MB
tu
= Annual Average

February 9, 2010 www.EmpoweredEnergy.com 16
MPR Natural Gas Forecast:Futures + Fundamentals
New York Mercantile Exchange (“NYMEX”) natural gas futures contract prices to end of trading horizon
Current trading horizon is 12 yearsSince 1990, NYMEX trading horizon has varied from 18 months to 12 years
Purchased & proprietary longer-term fundamental forecast used beyond NYMEX trading horizon
Trend NYMEX pricing to connect to 3 (unidentified) out of 4 longer-term fundamental forecasts
Cambridge Energy Research AssociatesGlobal InsightPIRA Energy GroupWood Mackenzie

February 9, 2010 www.EmpoweredEnergy.com 17
Non-Commodity Components Also Affect Natural Gas Forecast
$/M
MB
tu

February 9, 2010 www.EmpoweredEnergy.com 18
Embedded Natural Gas Price Depends on Forecast Timing
$/M
MB
tu

February 9, 2010 www.EmpoweredEnergy.com 19
Greenhouse Gas Compliance: Starts with AB 32* Implementation
$/to
nC
O2
AB 32 Implementation
Energy and Environmental Economics, Inc.
Synapse Energy Economics, Inc.
* AB32 = California Global Warming Solutions Act of 2006; to beimplemented by the California Air Resources Board (“CARB”).

February 9, 2010 www.EmpoweredEnergy.com 20
Adopted MPR, 10-Year Baseload Contract
$/kW
h

February 9, 2010 www.EmpoweredEnergy.com 21
Time-of-Delivery Adjustment Used to Value Product Slate2004 MPR: Separate MPR for baseload vs. peaking
Baseload MPR based on combined cycle gas turbinePeaking MPR based on combustion turbine (5x8 peaking product over 12 months)
Post-2004 MPR: Actual utility time-of-delivery (“TOD”) factors applied to baseload-only MPR to value different products
BaseloadPeakingAs-available

February 9, 2010 www.EmpoweredEnergy.com 22
TOD Factors Vary Widely by Utility, Season, and Hour
Hour Ending
TOD
Mul
tiplie
r

February 9, 2010 www.EmpoweredEnergy.com 23
Feed-In Tariff (“FIT”) Design Provides New MPR Applications
SB 32: Renewable FITFor eligible renewable generation ≤ 3 MW
Eases difficulties of bidding into RPS solicitationsAll-In MPR + Value for Other Attributes:
Environmental benefitsIncludes current and anticipated environmental compliance costs
Peak demand & congestion reduction benefitsExpedited interconnection if peak demand is offsetCPUC may establish additional value if peak demand is offset
Avoided transmission & distribution improvementsAdjusted for TODSpecific pricing formula not yet determined
Separate CPUC proceeding for renewable FIT up to 20 MW
February 9, 2010 www.EmpoweredEnergy.com 24
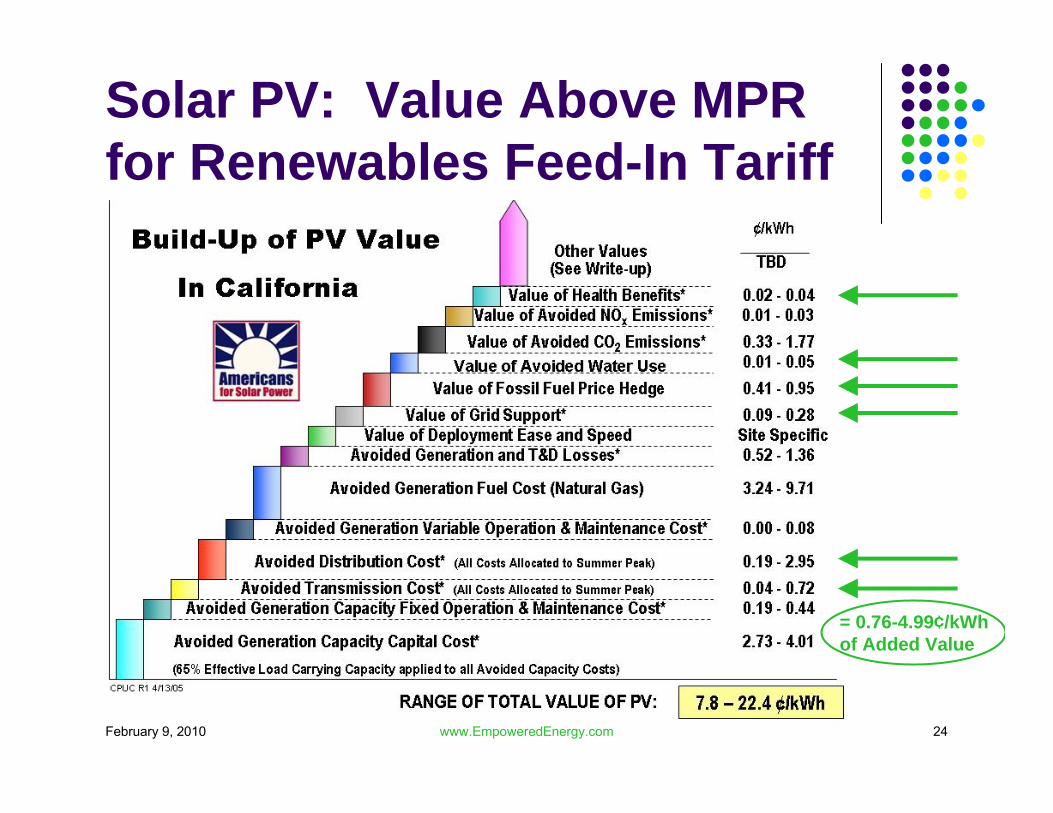
Solar PV: Value Above MPR for Renewables Feed-In Tariff
= 0.76-4.99¢/kWh of Added Value

February 9, 2010 www.EmpoweredEnergy.com 25
AB 1613: Combined Heat and Power (“CHP”) Feed-In TariffCHP Sized for Thermal Load, Exporting ≤ 20 MW
(1) Fixed Component of 2008 MPR (based on 10-year contract) minus GHG Compliance Costs
GHG Compliance Costs to be Paid by Purchaser(2) Monthly Natural Gas Index (@ 6,924 Btu/kWh, 2008 MPR HR) plus Cost of Local Distribution
Allows for efficient natural gas price hedgingKeeps most volatile component of MPR “fresh”
(3) 2008 MPR Variable O&M Cost ComponentSum of (1)-(3) Multiplied by Applicable TOD Factor10% Location Bonus Possible
CHP in areas with Local Resource Adequacy requirements (defined, transmission-constrained local areas)

February 9, 2010 www.EmpoweredEnergy.com 26
CHP FIT: Illustrative Calculation for FEB 2010 Contract Date
FEB 2010 NYMEX Settlement: $5.32/MMBtuBasis to CA Border: ($0.22/MMBtu)Local Distribution: $0.35/MMBtu
2010 MPR Fixed Component: $0.02230/kWh
2010 MPR Variable Component: $0.00451/kWh
CHP FIT = $0.02230/kWh + $0.03774/kWh + $0.00451/kWh = $0.0645/kWh*
NG Component ($/MMBtu): $5.32/MMBtu -$0.22/MMBtu + $0.35/MMBty = $5.45/MMBtuNG Component ($/kWh): $5.45/MMBtu x 6,924 Btu/kWh x 0.000001 MMBtu/Btu = $0.03774/kWh
+
+
* Prior to TOD Factor and Locational Adder

February 9, 2010 www.EmpoweredEnergy.com 27
Conclusions: MPR Provides Critical California Policy Link
Use of MPR expanding into new applicationsRenewables FIT
Recognizes incremental renewables value vs. MPRCHP FIT
Replaces embedded MPR natural gas forecast with monthly market index & site-specific delivery costsEnables natural gas price hedging and financing
Leverages existing in-depth MPR review processIncreasing transparency over time
Links related efforts of CPUC, CEC and CARB to benefit of California’s RPS & climate change efforts