california regional water quality control board los ... · california regional water quality...
TRANSCRIPT

Basin Plan 7-1 Total Maximum Daily LoadsUpdated December 2011
California Regional Water Quality Control Board
Los Angeles Region
Attachment to Resolution No. R11-013

Basin Plan 7-2 Total Maximum Daily LoadsUpdated September 20��

Basin Plan 7-� Total Maximum Daily LoadsUpdated September 20��
7TMDLs(TotalMaximumDailyLoads)Table of Contents
IntroductionLegal Basis and AuthorityTMDL ComponentsOrganization of Chapter
TMDL Summaries7-� San Gabriel River (East Fork) Trash TMDL7-2 Los Angeles River Watershed Trash TMDL 7-� Ballona Creek Trash TMDL 7-4 Santa Monica Bay Beaches Bacteria TMDL7-5 Marina del Rey Harbor Mothers’ Beach and Back Basins Bacteria TMDL7-6 Upper Santa Clara River Chloride TMDL 7-7 Calleguas Creek Nitrogen Compounds and Related Effects TMDL7-8 Los Angeles River Nitrogen Compounds and Related Effects TMDL 7-9 Santa Clara River Nitrogen Compounds TMDL7-�0 Malibu Creek and Lagoon Bacteria TMDL
7-�� Los Angeles Harbor Bacteria TMDL (Inner Cabrillo Beach and Main Ship Channel) 7-�2 Ballona Creek Metals TMDL 7-�� Los Angeles River and Tributaries Metals TMDL 7-�4 Ballona Creek Estuary Toxic Pollutants TMDL 7-�5 (Intentionally left blank) 7-�6 Calleguas Creek Watershed Toxicity TMDL 7-�7 Calleguas Creek Organochlorine Pesticides, Polychlorinated Biphenyls, and Siltation TMDL 7-�8 Marina del Rey Harbor Toxic Pollutants TMDL 7-�9 Calleguas Creek Watershed Metals and Selenium TMDL 7-20 (Intentionally left blank) 7-2� Ballona Creek, Ballona Estuary and Sepulveda Channel Bacteria TMDL 7-22 Calleguas Creek Watershed Salts TMDL 7-2� Lake Elizabeth, Munz Lake, and Lake Hughes Trash TMDL 7-24 Revolon Slough and Beardsley Wash Trash TMDL 7-25 �entura River Estuary Trash TMDL7-25 �entura River Estuary Trash TMDL 7-26 Machado Lake Trash TMDL 7-27 Legg Lake Trash TMDL7-27 Legg Lake Trash TMDL 7-28 Harbor Beaches of �entura County (Kiddie Beach and Hobie Beach) Bacteria TMDL 7-29 Machado Lake Nutrient TMDL 7-�0 Colorado Lagoon OC Pesticides, PCBs, Sediment Toxicity, PAHs, and Metals TMDL 7-�� Malibu Creek Watershed Trash TMDL 7-�2 (Intentionally left blank) 7-�� (Intentionally left blank) 7-�4 (Intentionally left blank) 7-�5 (Intentionally left blank) 7-�6 (Intentionally left blank) 7-�7 McGrath Lake PCBs, Pesticides and Sediment Toxicity TMDL

Basin Plan 7-4 Total Maximum Daily LoadsUpdated September 20��
List of Figures, Tables and Inserts
Tables
7-1 SanGabrielRiver(EastFork)TrashTMDLTMDLSummaries
7-2 LosAngelesRiverWatershedTrashTMDL 7-2.�. Los Angeles River Watershed Trash TMDL Elements7-2.�. Los Angeles River Watershed Trash TMDL ElementsLos Angeles River Watershed Trash TMDL Elements
7-2.2. Los Angeles River Watershed Trash TMDL Baseline Waste Load Allocations7-2.�. Los Angeles River Watershed Trash TMDL Implementation Schedule
7-3 BallonaCreekTrashTMDL7-�.� Ballona Creek Trash TMDL Elements7-�.2 Ballona Creek Trash TMDL Implementation Schedule7-3.3 BallonaCreekTrashTMDLSignificantDates
7-4 SantaMonicaBayBeachesBacteriaTMDLs 7-4.�. Santa Monica Bay Beaches Bacteria TMDL (Dry Weather Only): Elements
7-4.2a. Santa Monica Bay Beaches Bacteria TMDL (Dry Weather Only): Implementation Schedule
7-4.2b. Santa Monica Bay Beaches Bacteria TMDL (Dry Weather Only): Implementation Schedule
7-4.3. SantaMonicaBayBeachesBacteriaTMDL(DryWeatherOnly):SignificantDates 7-4.4. Santa Monica Bay Beaches Bacteria TMDL (Wet Weather Only): Elements
7-4.5. Santa Monica Bay Beaches Bacteria TMDL (Wet Weather Only): Final Allowable Wet-Weather Exceedance Days by Beach Location
7-4.6. Santa Monica Bay Beaches Bacteria TMDL (Wet Weather Only): Interim Compliance Targets by Jurisdictional Groups
7-4.7. SantaMonicaBayBeachesBacteriaTMDL(WetWeatherOnly):SignificantDates
7-5 MarinadelReyHarborMothers’BeachandBackBasinsBacteriaTMDL7-5.�. Marina del Rey Harbor Mothers’ Beach and Back Basins Bacteria TMDL: Elements7-5.2. Marina del Rey Harbor Mothers’ Beach and Back Basins Bacteria TMDL: Final Allowable
Exceedance Days by Sampling Location 7-5.3.MarinadelReyHarborMothers’BeachandBackBasinsBacteriaTMDL:Significant
Dates
7-6 UpperSantaClaraRiverChlorideTMDL7-6.�. Upper Santa Clara River Chloride TMDL: ElementsUpper Santa Clara River Chloride TMDL: Elements2-2.2. Upper Santa Clara River Chloride TMDL; Implementation Schedule
7-7 CalleguasCreekNitrogenCompoundsandRelatedEffectsTMDL7-7.�. Calleguas Creek Nitrogen Compounds and Related Effects TMDL: Elements7-7.2. Calleguas Creek Nitrogen Compounds and Related Effects TMDL: Implementation
Schedule
7-8 LosAngelesRiverNitrogenCompoundsandRelatedEffectsTMDL7-8.�. Los Angeles River Nitrogen Compounds and Related Effects TMDL: Elements7-8.2. Los Angeles River Nitrogen Compounds and Related Effects TMDL: Implementation
Schedule

Basin Plan 7-5 Total Maximum Daily LoadsUpdated September 20��
7-9 SantaClaraRiverNitrogenCompoundsTMDL7-9.�. Santa Clara River Nitrogen Compounds TMDL: Elements7-9.2. Santa Clara River Nitrogen Compounds TMDL: Implementation Schedule
7-10 MalibuCreekandLagoonBacteriaTMDL7-�0.� Malibu Creek and Lagoon Bacteria TMDL: Elements7-�0.2 Malibu Creek and Lagoon Bacteria TMDL: Final Annual Allowable Exceedance Days by
Sampling Location7-10.3MalibuCreekandLagoonbacteriaTMDL:SignificantDates
7-11 LosAngelesHarborBacteriaTMDL(InnerCabrilloBeachandMainShipChannel)7-��.�. Los Angeles Harbor Bacteria TMDL (Inner Cabrillo Beach and Main Ship Channel):
Elements7-��.2. Los Angeles Harbor Bacteria TMDL (Inner Cabrillo Beach and Main Ship Channel):
Final Allowable Exceedance Days by Sampling Location7-��.�. Los Angeles Harbor Bacteria TMDL (Inner Cabrillo Beach and Main Ship Channel)
SignificantDates
7-12 BallonaCreekMetalsTMDL7-�2.� Ballona Creek Metals TMDL: Elements7-�2-2. Ballona Creek Metals TMDL: Implementation Schedule
7-13 LosAngelesRiverandTributariesMetalsTMDL 7-��.� Los Angeles River and Tributaries Metals TMDL: Elements 7-��.2 Los Angeles River and Tributaries Metals TMDL: Implementation Schedule 7-��.� Los Angeles River and Tributaries Metals TMDL: Jurisdictional Groups
7-14 BallonaCreek EstuaryToxicPollutantsTMDL7-�4.� Ballona Creek Estuary Toxic Pollutants TMDL: Elements7-�4.2 Ballona Creek Estuary Toxic Pollutants TMDL: Implementation Schedule
7-16 CalleguasCreekWatershedToxicityTMDL7-�6.�. Calleguas Creek Watershed Toxicity TMDL: Elements7-�6.2. Calleguas Creek Watershed Toxicity TMDL: Implementation Schedule
7-17CalleguasCreekOrganochlorinePesticides,PolychlorinatedBiphenyls,andSiltationTMDL7-�7.�. Calleguas Creek OC Pesticides, PCBs and Siltation TMDL: Elements7-�7.2 Calleguas Creek OC Pesticides, PCBs, and Siltation TMDL:
Implementation Schedule
7-18 MarinadelReyHarborToxicPollutantsTMDL 7.�8.� Marina del Rey Harbor Toxic Pollutants TMDL: Elements 7.�8.2 Marina del Rey Harbor Toxic Pollutants TMDL: Implementation Schedule
7-19CalleguasCreekWatershedMetalsandSeleniumTMDL7-�9.�. Calleguas Creek Watershed Metals and Selenium TMDL: Elements7-�9.2. Calleguas Creek Watershed Metals and Selenium TMDL: Implementation Schedule

Basin Plan 7-6 Total Maximum Daily LoadsUpdated September 20��
7-21 BallonaCreek,BallonaEstuaryandSepulvedaChannelBacteriaTMDL7-2�.�. Ballona Creek, Ballona Estuary and Sepulveda Channel Bacteria TMDL: Elements7-2�.2a. Ballona Creek, Ballona Estuary and Sepulveda Channel Bacteria TMDL: Final
Allowable Exceedance Days by Reach7.2�.2b. Ballona Creek, Ballona Estuary and Sepulveda Channel Bacteria TMDL: WLAs
and LAs for tributaries to the Impaired Reaches.7-2�.�. Ballona Creek, Ballona Estuary and Sepulveda Channel Bacteria TMDL: SignificantDates
7-22 CalleguasCreekWatershedSaltsTMDL7-22.�. Calleguas Creek Watershed Salts TMDL: Elements7-22.2. Calleguas Creek Watershed Salts TMDL: Implementation Schedule
7-23 LakeElizabeth,MunzLake,andLakeHughesTrashTMDL 7-2�.�. Lake Elizabeth, Munz Lake, and Lake Hughes Trash TMDL: Elements
7-2�.2a. Lake Elizabeth, Munz Lake, and Lake Hughes Trash TMDL: Implementation Schedule – Point Sources
7-2�.2b. Lake Elizabeth, Munz Lake, and Lake Hughes Trash TMDL: Implementation Schedule – Minimum Frequency of Assessment and Collection Program
7-24 RevolonSloughandBeardsleyWashTrashTMDL 7-24.�. Revolon Slough and Beardsley Wash Trash TMDL: Elements
7-24.2a. Revolon Slough and Beardsley Wash Trash TMDL: Implementation Schedule – Point Sources
7-24.2b. Revolon Slough and Beardsley Wash Trash TMDL: Implementation Schedule – Minimum Frequency of Assessment and Collection Program
7-25 VenturaRiverEstuaryTrashTMDL 7-25.�. �entura River Estuary Trash TMDL: Elements7-25.�. �entura River Estuary Trash TMDL: Elements
7-25.2a. �entura River Estuary Trash TMDL: Implementation Schedule – Point Sources7-25.2b. �entura River Estuary Trash TMDL: Implementation Schedule – Minimum Frequency of Assessment and Collection Program
7-26 MachadoLakeTrashTMDL 7-26.�. Machado Lake Trash TMDL: ElementsMachado Lake Trash TMDL: Elements 7-26.2a. Machado Lake Trash TMDL: Implementation Schedule – Point Sources
7-26.2b. Machado Lake Trash TMDL: Implementation Schedule – Minimum Frequency of Assessment and Collection Program
7-27 LeggLakeTrashTMDL 7-27.�. Legg Lake Trash TMDL: Elements
7-27.2a. Legg Lake Trash TMDL: Implementation Schedule – Point Sources7-27.2b. Legg Lake Trash TMDL: Implementation Schedule – Minimum Frequency of
Assessment and Collection Program
7-28 HarborBeachesofVenturaCountyBacteriaTMDL7-28.�. Harbor Beaches of �entura County Bacteria TMDL: Elements7-28.2. Harbor Beaches of �entura County Bacteria TMDL: Final Allowable
Exceedance Days by Location7-28.�. Harbor Beaches of �entura County Bacteria TMDL: Implementation Table

Basin Plan 7-7 Total Maximum Daily LoadsUpdated September 20��
7-29 MachadoLakeEutrophic,Algae,Ammonia,andOdors(Nutrient)TMDL7-29.�. Machado Lake Eutrophic, Algae, Ammonia, and Odors (Nutrient) TMDL: Elements 7-29.2. Machado Lake Eutrophic, Algae, Ammonia, and Odors (Nutrient) TMDL: Implementation Schedule
7-30 ColoradoLagoonOCPesticides,PCBs,SedimentToxicity,PAHs,andMetalsTMDL7-�0.�. Colorado Lagoon OC Pesticides, PCBs, Sediment Toxicity, PAHs, and Metals TMDL:
Elements7-�0.2. Colorado Lagoon OC Pesticides, PCBs, Sediment Toxicity, PAHs, and Metals TMDL:
Implementation Schedule
7-31 MalibuCreekWatershedTrashTMDL7-��.� Malibu Creek Watershed Trash TMDL: Elements7-��.2a Malibu Creek Watershed Trash TMDL: Implementation Schedule – Point Sources7-��.2b Malibu Creek Watershed Trash TMDL: Implementation Schedule – Minimum Frequency of Assessment and Collection Program * - Nonpoint Sources
7-37 McGrathLakePCBs,PesticidesandSedimentToxicityTMDL7-�7.� McGrath Lake PCBs, Pesticides and Sediment Toxicity TMDL: Elements7-�7.2 McGrath Lake PCBs, Pesticides and Sediment Toxicity TMDL: Implementation Schedule

Basin Plan 7-8 Total Maximum Daily LoadsUpdated September 20��

Basin Plan 7-9 Total Maximum Daily LoadsUpdated September 20��
Introduction
Legal Basis and Authority
Section �0�(d)(�)(a) of the Clean Water Act (CWA) requires that “each state shall identify those waters withinitsboundariesforwhichtheeffluentlimitations…arenotstringentenoughtoimplementanywater quality standard applicable to such waters.” The CWA also requires states to establish a priority ranking for these waters. This list of prioritized impaired waterbodies is known as the �0�(d) list. The CWA then requires that Total Maximum Daily Loads (TMDLs) be established for waters on the �0�(d) list. On California’s �998 �0�(d) list, the Los Angeles Regional Water Quality Control Board (RWQCB) identified832waterbodyreachesaswaterqualityimpaired.Sincethislisting,theseimpairedreacheshave been consolidated into 92 “TMDL Analytical Units” in order to better manage and prioritize impaired watersheds for TMDL development.
A consent decree between the U.S. Environmental Protection Agency (USEPA), Heal the Bay, Inc. and BayKeeper, Inc. was approved on March 22, �999. This court order directs the USEPA to complete TMDLs for all impaired waters within �2 years. A schedule was established in the consent decree forthecompletionofthefirst29TMDLswithin7years.TheremainingTMDLswillbescheduledbyRegional Board staff within the �2-year period.
The elements of a TMDL are described in 40 CFR ��0.2 and ��0.7 and Section �0�(d) of the CWA, aswellasinUSEPAguidancedocuments(e.g.,USEPA,1991).ATMDLisdefinedas“thesumofthe individual waste load allocations for point sources and load allocations for nonpoint sources and natural background” (40 CFR ��0.2). Regulations further stipulate that TMDLs must be set at “levels necessary to attain and maintain the applicable narrative and numeric water quality standards with seasonal variations and a margin of safety that takes into account any lack of knowledge concerning therelationshipbetweeneffluentlimitationsandwaterquality”(40CFR130.7(c)(1)).Theregulationsin40CFR130.7alsostatethatTMDLsshalltakeintoaccountcriticalconditionsforstreamflow,loadingand water quality parameters.
Upon establishment of TMDLs by the State or USEPA, the State is required to incorporate the TMDLs along with appropriate implementation measures into the State Water Quality Management Plan (40 CFR ��0.6(c)(�), ��0.7). This Water Quality Control Plan for the Los Angeles Region (Basin Plan), and applicable statewide plans, serve as the State Water Quality Management Plans governing the watersheds under the jurisdiction of the RWQCB.
Before approval by USEPA or incorporation into the Basin Plan, TMDLs must be subject to public review (40 CFR ��0.7). Public review requirements for Basin Plan Amendments are described in Chapter � of this document.

Basin Plan 7-�0 Total Maximum Daily LoadsUpdated September 20��
TMDL Components
TMDLs include the following technical components, which provide the analytical basis for the TMDLs. • ProblemStatement:Adescriptionofthewaterbody/watershedsetting,beneficialuseimpairments,
and pollutants or stressors causing the impairment.• NumericTargets: For each stressor addressed in the TMDL, appropriate measurable indicators
and associated numeric targets based on numeric or narrative water quality standards, which expressthetargetordesiredconditionfortheexistingorpotentialbeneficialuses.
• SourceAnalysis: An assessment of relative contributions of pollutant or stressor sources to the waterbody and the extent of needed discharge reductions or controls.
• LoadingCapacity/SeasonalVariationsandCriticalConditions/LinkageAnalysis: The loading capacity is an estimate of the assimilative capacity of the waterbody for the pollutant of concern taking into account seasonal variations and critical conditions. The linkage analysis describes the analytical basis for concluding that the load allocations along with the margin of safety will not exceed the loading capacity of the waterbody.
• LoadAllocations/MarginofSafety: The allocation of allowable loads or load reductions among different sources, providing an adequate margin of safety. These allocations are usually expressed as waste load allocations for point sources, load allocations for nonpoint sources, and contributions from natural sources. The margin of safety takes into account any lack of knowledge concerning the relationshipbetweeneffluentlimitationsandwaterquality.Allocationscanbeexpressedintermsofmass loads or other appropriate measures. The TMDL equals the sum of the above allocations and the margin of safety and cannot exceed the loading capacity for the waterbody.
In addition to these technical components, TMDLs must include a public participation component, an implementation plan, and a monitoring plan. Before approval by USEPA or incorporation into the Basin Plan, TMDLs must be subject to public review (40 CFR ��0.7). Public review requirements for Basin Plan Amendments are described in Chapter � of this document. The implementation plan should include a description of best management practices, point source controls or other actions necessary to implement the TMDL as well as how and when the necessary controls will be accomplished and who is responsible for each measure. The monitoring plan is required to evaluate the effectiveness of the TMDL and should include a schedule for reviewing and revising, if necessary, the TMDL and associated implementation measures.
Organization of Chapter
As TMDLs are developed, this chapter (Chapter 7) of the Basin Plan will be amended to include summaries of each TMDL in chronological order of Board approval.

Basin Plan 7-�� Total Maximum Daily LoadsUpdated September 20��
7-1 San Gabriel River East Fork Trash TMDL
This TMDL was adopted by: The Regional Water Quality Control Board on October 28, 1999.
This TMDL was amended and adopted by: The Regional Water Quality Control Board on May 25, 2000.
This TMDL was approved by: The State Water Resources Control Board on June 15, 2000. TheOfficeofAdministrativeLawonSeptember8,2000. TheU.S.EnvironmentalProtectionAgencyonDecember14,2000.
TheeffectivedateofthisTMDLis:April17,2001.
The following table includes all the elements of this TMDL.
Table 7-1 TMDL SummariesWatershed Reach PollutantSan Gabriel River East Fork Trash
Element Derivation of Numbers
Problem Statement High recreational use of the river results in trash being deposited in and along the stream, posing a threat to water quality.
Water Quality Objective Watersshallnotcontainfloatingmaterials,includingsolids,liquids,foams, and scum, in concentrations that cause nuisance or adversely affectbeneficialuses.
Water shall not contain suspended or settable material in concentrations thatcausenuisanceoradverselyaffectbeneficialuses.
Numeric Target No trash in the river
Source Analysis Picnicking and camping are the primary sources of trash.
Responsible Party U.S. Forest Service
Load Allocations Zero trash discharged to the river.
Margin of Safety Implicit Margin of Safety based on conservative interpretation of narrative standard
Seasonal Variations and Critical Conditions
Peak recreational usage is June through September based on Forest Service,RegionalBoardandLosAngelesCountyDepartmentofPublicWorksfieldobservations.

Basin Plan 7-�2 Total Maximum Daily LoadsUpdated September 20��
Implementation Measures The USFS shall submit a “TMDL Implementation Plan” within 60 days of the effective date of this amendment. The Plan shall include a detailed discussion of litter control measures to be implemented. The TMDLspecifiesthatimplementationandmonitoringmustbeginbynolater than 90 days after the effective date of this amendment. The USFS mustdemonstratecompliancewiththeTMDL(numerictarget)byApril1, 2003. The Regional Board must approve any variations from this schedule.
Monitoring The USFS must conduct monitoring downstream of each of the four informal picnic areas referenced in the TMDL once per month during the peak use season (June-September.) Monitoring of each of the four informal picnic areas may be conducted every other month during the rest of the year. Two short-term surveys shall be conducted each year. One survey shall be conducted during a summer holiday weekend by setting up trash collection nets in the river over a period of four days (FridaythroughMonday).Awetseasonsurveyusingtrashcollectionnets over four days shall also be conducted.
*The complete administrative record for the TMDL is available for review upon request.

Basin Plan 7-�� Total Maximum Daily LoadsUpdated September 20��
7-2 Los Angeles River Watershed Trash TMDL
This TMDL was adopted by: The Regional Water Quality Control Board on September 19, 2001. This TMDL was approved by: The State Water Resources Control Board on February 19, 2002. TheOfficeofAdministrativeLawonJuly16,2002 TheU.S.EnvironmentalProtectionAgencyonAugust1,2002.
This TMDL was set aside by: The Regional Water Quality Control Board on June 8, 2006.
This TMDL was remanded by: The State Water Resources Control Board on July 19, 2006.
This TMDL was adopted by: TheRegionalWaterQualityControlBoardonAugust9,2007.
This TMDL was approved by: TheStateWaterResourcesControlBoardonApril15,2008. TheOfficeofAdministrativeLawonJuly1,2008. TheU.S.EnvironmentalProtectionAgencyonJuly24,2008.
The effective date of this TMDL is: September 23, 2008.
The following table includes all the elements of this TMDL.
Table 7-2.1. Los Angeles River Watershed Trash TMDL: Elements
Element Key Findings and Regulatory ProvisionsProblem Statement TrashintheLosAngelesRiveriscausingimpairmentofbeneficial
uses.Thefollowingdesignatedbeneficialusesareimpactedbytrash: water contact recreation (REC1); non-contact water recreation (REC2);warmfreshwaterhabitat(WARM);wildlifehabitat(WILD),estuarinehabitat(EST);marinehabitat(MAR);rareandthreatenedorendangeredspecies(RARE);migrationofaquaticorganisms(MIGR);spawning,reproductionandearlydevelopmentoffish(SPWN);commercialandsportfishing(COMM);shellfishharvesting(SHELL);wetland habitat (WET); and cold freshwater habitat (COLD).
Numeric Target (Interpretation of the numeric water quality objective, used to calculate the waste load allocations)
Zero trash in all waterbodies.
Source Analysis Stormwater discharge is the major source of trash in the river. Nonpoint sources, i.e., direct deposition of trash by people or wind into the water body,isademinimussourceoftrashloadingtotheLARiver.
Loading Capacity Zero

Basin Plan 7-�4 Total Maximum Daily LoadsUpdated September 20��
Element Key Findings and Regulatory ProvisionsWaste Load Allocations BaselineWasteLoadAllocationsforeachcityintheLosAngelesRiver
WatershedareasprovidedinTable7.2.2.TheTMDLrequiresphasedreductions over a period of 9 years, from existing baseline loads to zero (0). Phase II stormwater permittees (including educational institutions) alsohaveafinalwasteloadallocationofzero.Animplementationschedule for these permittees will be established once their stormwater permit has been developed.
Load Allocations TheloadallocationsfornonpointsourcetrashdischargestotheLARiverarezero.
Implementation This TMDL will be implemented through stormwater permits and via theauthorityvestedintheExecutiveOfficerbysection13267ofthePorter-CologneWaterQualityControlAct:(WaterCodesection13000et seq.).
Compliancewiththefinalwasteloadallocationmaybeachievedthroughafullcapturesystem.Afullcapturesystemisanydeviceorseries of devices that traps all particles retained by a 5 mm mesh screen andhasadesigntreatmentcapacityofnotlessthanthepeakflowrate(Q) resulting from a one-year, one-hour, storm in the subdrainage area. TheRationalEquationisusedtocomputethepeakflowrate:Q=C×I×A,whereQ=designflowrate(cubicfeetpersecond,cfs);C=runoffcoefficient(dimensionless);I=designrainfallintensity(inchesperhour,asdeterminedpertherainfallisohyetalmapinFigureA),andA=subdrainage area (acres). The isohyetal map may be updated annually bytheLosAngelesCountyhydrologisttoreflectadditionalraindatagatheredduringthepreviousyear.AnnualupdatespublishedbytheLosAngelesCountyDepartmentofPublicWorksareprospectivelyincorporated by reference into this TMDL and accompanying Basin Plan amendment.
TheExecutiveOfficerhasauthoritytocertify,asfull-capture,anytrash reduction system that meets the operating and performance requirements as described above.
To the extent nonpoint source implementation of load allocations is necessary, it will be accomplished, consistent with the Plan for Nonpoint Source Pollution Control Policy, with waste discharge requirements, waivers of waste discharge requirements, or any appropriate order, including a cleanup and abatement order, pursuant to e.g.,sections13263,13269,and/or13304.
Animplementationreport,outlininghowresponsibleagenciesintendtocomply with the TMDL, will be prepared six months after the effective date of the TMDL.
Margin of Safety “Zero discharge” is a conservative standard which contains an implicit margin of safety.
Seasonal Variations and Critical Conditions
Discharge of trash from the storm drain occurs primarily during or shortly after a rain event of greater than 0.25 inches.

Basin Plan 7-�5 Total Maximum Daily LoadsUpdated September 20��
Figure A
Figure A: Isohyethal Map of Rainfall Intensities in Portions of Los Angeles County
Basin Plan 7-�6 Total Maximum Daily LoadsUpdated September 20��
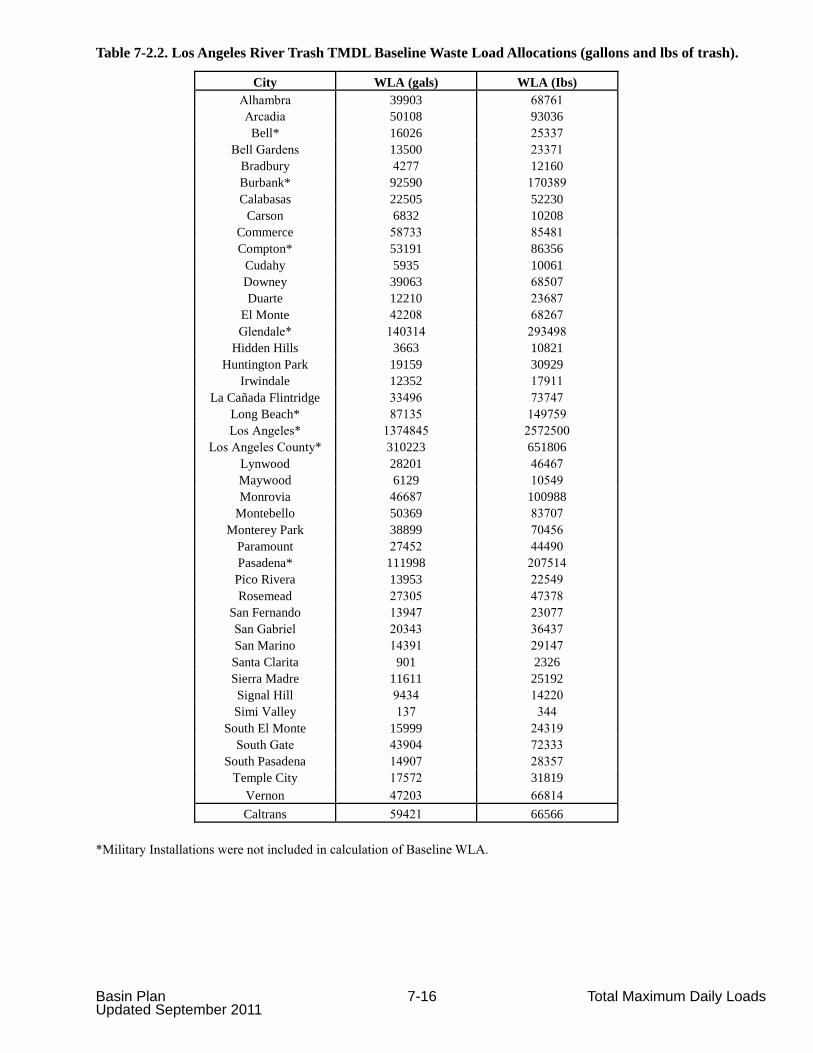
Table 7-2.2. Los Angeles River Trash TMDL Baseline Waste Load Allocations (gallons and lbs of trash).
City WLA (gals) WLA (Ibs) Alhambra 39903 68761 Arcadia 50108 93036
Bell* 16026 25337 BellGardens 13500 23371
Bradbury 4277 12160 Burbank* 92590 170389 Calabasas 22505 52230
Carson 6832 10208 Commerce 58733 85481 Compton* 53191 86356
Cudahy 5935 10061 Downey 39063 68507 Duarte 12210 23687
El Monte 42208 68267 Glendale* 140314 293498
Hidden Hills 3663 10821 Huntington Park 19159 30929
Irwindale 12352 17911 La Cañada Flintridge 33496 73747
Long Beach* 87135 149759 LosAngeles* 1374845 2572500
LosAngelesCounty* 310223 651806 Lynwood 28201 46467 Maywood 6129 10549 Monrovia 46687 100988
Montebello 50369 83707 Monterey Park 38899 70456
Paramount 27452 44490 Pasadena* 111998 207514 Pico Rivera 13953 22549 Rosemead 27305 47378
San Fernando 13947 23077 SanGabriel 20343 36437 San Marino 14391 29147 Santa Clarita 901 2326 Sierra Madre 11611 25192 Signal Hill 9434 14220 Simi Valley 137 344
South El Monte 15999 24319 SouthGate 43904 72333
South Pasadena 14907 28357 Temple City 17572 31819
Vernon 47203 66814 Caltrans 59421 66566
*MilitaryInstallationswerenotincludedincalculationofBaselineWLA.

Basin Plan 7-�7 Total Maximum Daily LoadsUpdated September 20��
Table 7.2.3. Los Angeles River Trash TMDL: Implementation Schedule.1 (Required percent reductions based on initial baseline wasteload allocation of each city)
End of Storm Year
Implementation WasteLoadAllocation Compliance Point
Sept 30, 2008
Implementation: Year 1
60%ofBaselineWasteLoadAllocationsfor the Municipal permittees; and Caltrans
Compliance is 60% of the baseline load
Sept 30, 2009
Implementation: Year 2
50%ofBaselineWasteLoadAllocationsfor the Municipal permittees; and Caltrans
Compliance is 55% of the baseline load calculated as a 2-year annual average
Sept 30, 2010
Implementation: Year 32
40%ofBaselineWasteLoadAllocationsfor the Municipal permittees; and Caltrans
Compliance is 50% of the baseline load calculated as a rolling 3-year annual
average
Sept 30, 2011
Implementation: Year4
30%ofBaselineWasteLoadAllocationsfor the Municipal permittees; and Caltrans
Complianceis40%ofthebaselineloadcalculated as a rolling 3-year annual
average
Sept 30, 2012
Implementation: Year 5
20%ofBaselineWasteLoadAllocationsfor the Municipal permittees; and Caltrans
Compliance is 30% of the baseline load calculated as a rolling 3-year annual
average
Sept 30, 2013
Implementation: Year 6
10%ofBaselineWasteLoadAllocationsfor the Municipal permittees; and Caltrans
Compliance is 20% of the baseline load calculated as a rolling 3-year annual
average
Sept 30, 2014
Implementation: Year7
0%ofBaselineWasteLoadAllocationsforthe Municipal permittees; and Caltrans
Compliance is 10% of the baseline load calculated as a rolling 3-year annual
average
Sept 30, 2015
Implementation: Year 8
0%ofBaselineWasteLoadAllocationsforthe Municipal permittees; and Caltrans
Compliance is 3.3% of the baseline load calculated as a rolling 3-year
annual average
Sept 30, 2016
Implementation: Year 9
0%ofBaselineWasteLoadAllocationsforthe Municipal permittees; and Caltrans
Compliance is 0% of the baseline load calculated as a rolling 3-year annual
average
1 “Notwithstanding the zero trash target and the baseline waste load allocations shown in Table 5, a Permittee will be deemedincompliancewiththeTrashTMDLinareasservedbyaFullCaptureSystemwithintheLosAngelesRiver Watershed.”2AsspecifiedinSectionVI.A.,theRegionalBoardwillreviewandreconsiderthefinalWasteLoadAllocationsoncea reduction of 50% has been achieved and sustained.

Basin Plan 7-�8 Total Maximum Daily LoadsUpdated September 20��

Basin Plan 7-�9 Total Maximum Daily LoadsUpdated September 20��
7-3 Ballona Creek Trash TMDL*
This TMDL was adopted by: The Regional Water Quality Control Board on September 19, 2001.
This TMDL was approved by: The State Water Resources Control Board on February 19, 2002. TheOfficeofAdministrativeLawonJuly18,2002. TheU.S.EnvironmentalProtectionAgencyonAugust1,2002.
This TMDL was amended and adopted by: TheRegionalWaterQualityControlBoardonMarch4,2004.
This amended TMDL was approved by: TheStateWaterResourcesControlBoardonSeptember30,2004. TheOfficeofAdministrativeLawonFebruary8,2005. [U.S.EnvironmentalProtectionAgencyapprovalnotrequiredforamendmenttoimplementationplan]
TheeffectivedateofthisTMDLis:August11,2005.
The following table presents the key elements of this TMDL.
Table 7-3.1 Ballona Creek: Trash TMDL ElementsElement Derivation of NumbersProblem Statement TrashinBallonaCreekiscausingimpairmentofbeneficialuses.The
followingdesignatedbeneficialusesareimpactedbytrash:watercontact recreation (REC1); non-contact water recreation (REC2); warm freshwaterhabitat(WARM);wildlifehabitat(WILD),estuarinehabitat(EST);marinehabitat(MAR);rareandthreatenedorendangeredspecies(RARE);migrationofaquaticorganisms(MIGR);spawning,reproductionandearlydevelopmentoffish(SPWN);commercialandsportfishing(COMM);shellfishharvesting(SHELL);wetlandhabitat(WET); and cold freshwater habitat (COLD).
Numeric Target
(Interpretation of the narrative water quality objective, used to calculate the load allocations)
Zero trash in the river.
Source Analysis Stormwater discharge is the major source of trash in the river.
Loading Capacity Zero.
Waste Load Allocations Phased reduction for a period of 10 years, from existing baseline load to zero.
Implementation This TMDL will be implemented through stormwater permits and via theauthorityvestedintheExecutiveOfficerbysection13267ofthePorter-CologneWaterQualityControlAct:WaterCodesection13000etseq.Compliancewiththefinalwasteloadallocationmaybeachievedthroughafullcapturesystem.Afullcapturesystemisanydeviceorseries of devices that traps all particles retained by a 5 mm mesh screen andhasadesigntreatmentcapacityofnotlessthanthepeakflowrate(Q) resulting from a one-year, one-hour, storm in the subdrainage area.

Basin Plan 7-20 Total Maximum Daily LoadsUpdated September 20��
Implementation (continued) Rationalequationisusedtocomputethepeakflowrate:Q=C× I × A,whereQ=designflowrate(cubicfeetpersecond,cfs);C=runoffcoefficient(dimensionless);I=designrainfallintensity(inchesperhour,asdeterminedpertherainfallisohyetalmapinFigureA),andA=subdrainage area (acres). The isohyetal map may be updated annually bytheLosAngelesCountyhydrologisttoreflectadditionalraindatagatheredduringthepreviousyear.AnnualupdatespublishedbytheLosAngelesCountyDepartmentofPublicWorksareprospectivelyincorporated by reference into this TMDL and accompanying Basin Plan amendment.
Margin of Safety “Zero discharge” is a conservative standard which contains an implicit margin of safety.
Seasonal Variations and Critical Conditions
Discharge of trash from the storm drain occurs primarily during or shortly after a rain event of greater than 0.25 inches.
*The complete administrative record for the TMDL is available for review upon request.

Basin Plan 7-2� Total Maximum Daily LoadsUpdated September 20��
Figure A
Basin Plan 7-22 Total Maximum Daily LoadsUpdated September 20��
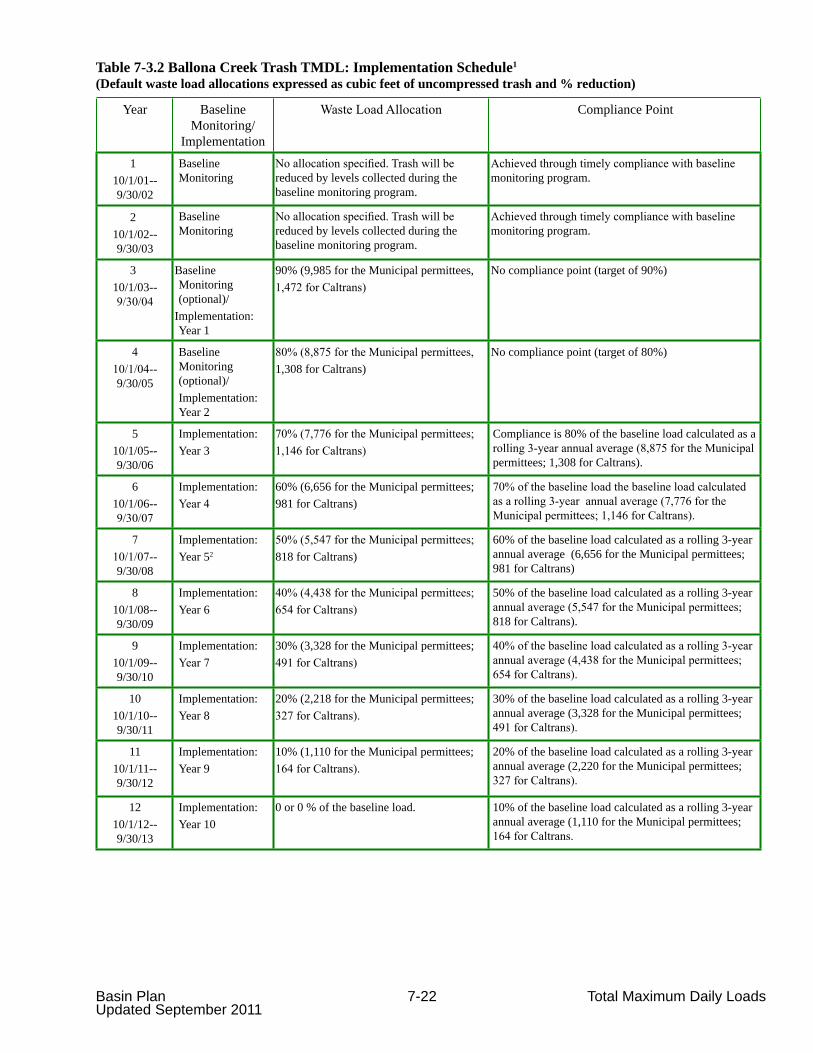
Table 7-3.2 Ballona Creek Trash TMDL: Implementation Schedule1
(Default waste load allocations expressed as cubic feet of uncompressed trash and % reduction)
Year Baseline Monitoring/
Implementation
WasteLoadAllocation Compliance Point
110/1/01--9/30/02
Baseline Monitoring
Noallocationspecified.Trashwillbereduced by levels collected during the baseline monitoring program.
Achievedthroughtimelycompliancewithbaselinemonitoring program.
210/1/02--9/30/03
Baseline Monitoring
Noallocationspecified.Trashwillbereduced by levels collected during the baseline monitoring program.
Achievedthroughtimelycompliancewithbaselinemonitoring program.
310/1/03--9/30/04
Baseline Monitoring (optional)/
Implementation: Year 1
90% (9,985 for the Municipal permittees,1,472forCaltrans)
No compliance point (target of 90%)
410/1/04--9/30/05
Baseline Monitoring (optional)/Implementation: Year 2
80%(8,875fortheMunicipalpermittees,1,308 for Caltrans)
No compliance point (target of 80%)
510/1/05--9/30/06
Implementation: Year 3
70%(7,776fortheMunicipalpermittees;1,146forCaltrans)
Compliance is 80% of the baseline load calculated as a rolling3-yearannualaverage(8,875fortheMunicipalpermittees; 1,308 for Caltrans).
610/1/06--9/30/07
Implementation: Year4
60% (6,656 for the Municipal permittees; 981 for Caltrans)
70%ofthebaselineloadthebaselineloadcalculatedasarolling3-yearannualaverage(7,776fortheMunicipalpermittees;1,146forCaltrans).
710/1/07--9/30/08
Implementation: Year 52
50%(5,547fortheMunicipalpermittees;818 for Caltrans)
60% of the baseline load calculated as a rolling 3-year annual average (6,656 for the Municipal permittees; 981 for Caltrans)
810/1/08--9/30/09
Implementation: Year 6
40%(4,438fortheMunicipalpermittees;654forCaltrans)
50% of the baseline load calculated as a rolling 3-year annualaverage(5,547fortheMunicipalpermittees;818 for Caltrans).
910/1/09--9/30/10
Implementation: Year7
30% (3,328 for the Municipal permittees; 491forCaltrans)
40%ofthebaselineloadcalculatedasarolling3-yearannualaverage(4,438fortheMunicipalpermittees;654forCaltrans).
1010/1/10--9/30/11
Implementation: Year 8
20% (2,218 for the Municipal permittees;327forCaltrans).
30% of the baseline load calculated as a rolling 3-year annual average (3,328 for the Municipal permittees; 491forCaltrans).
1110/1/11--9/30/12
Implementation: Year 9
10% (1,110 for the Municipal permittees; 164forCaltrans).
20% of the baseline load calculated as a rolling 3-year annual average (2,220 for the Municipal permittees; 327forCaltrans).
1210/1/12--9/30/13
Implementation: Year 10
0 or 0 % of the baseline load. 10% of the baseline load calculated as a rolling 3-year annual average (1,110 for the Municipal permittees; 164forCaltrans.

Basin Plan 7-2� Total Maximum Daily LoadsUpdated September 20��
1310/1/13--9/30/14
Implementation: Year 11
0 or 0 % of the baseline load. 3.3 % of the baseline load calculated as a rolling 3-year annualaverage(366fortheMunicipalpermittees,54for Caltrans).
1410/1/14--9/30/15
Implementation: Year 12
0 or 0 % of the baseline. 0 or 0 % of the baseline load.
1“NotwithstandingthezerotrashtargetandthedefaultwasteloadallocationsshowninTable7-3.2,aPermitteewillbe deemed in compliance with the Trash TMDL in areas served by a Full Capture System within the Ballona Creek and Estuary Watershed.”2TheRegionalBoardwillreviewandreconsiderthefinalWasteLoadAllocationsonceareductionof50%hasbeen achieved and sustained.

Basin Plan 7-24 Total Maximum Daily LoadsUpdated September 20��
Table 7-3.3. Ballona Creek Trash TMDL: Significant Dates
30daysafterreceiptoftheExecutiveOfficer’srequestasauthorizedbySection13267oftheWater Code.
Submit baseline monitoring plan(s).
120daysafterreceiptoftheExecutiveOfficer’srequestasauthorizedbySection13267oftheWater Code.
List of facilities that are outside of the permittee’s jurisdiction but drain to a portionof the permittee’s storm drain system, whichdischarges to Ballona Creek.
Within thefirst2yearsafterapprovalof thisbasin plan amendment; to be extended to 4years at the option of the permittees
Collection of baseline data.
72hoursaftereachrainevent Clean out of and measurement of trash retained.
Every 3 months during dry weather Clean out of and measurement of trash retained.

Basin Plan 7-25 Total Maximum Daily LoadsUpdated September 20��
7-4 Santa Monica Bay Beaches Bacteria TMDL (Dry Weather Only)*
This TMDL was adopted by: TheRegionalWaterQualityControlBoardonJanuary24,2002.
This TMDL was approved by: The State Water Resources Control Board on September 19, 2002. TheOfficeofAdministrativeLawonDecember9,2002. TheU.S.EnvironmentalProtectionAgencyonJune19,2003.
This TMDL was amended and adopted by: The Regional Water Quality Control Board on December 12, 2002.
This amended TMDL was approved by: The State Water Resources Control Board on March 19, 2003. TheOfficeofAdministrativeLawonMay20,2003. TheU.S.EnvironmentalProtectionAgencyonJune19,2003.
The effective date of this TMDL is: July 15, 2003.
The following table summarizes the key elements of this TMDL.
Table 7-4.1. Santa Monica Bay Beaches Bacteria TMDL (Dry Weather Only): ElementsElement Key Findings and Regulatory ProvisionsProblem Statement Elevated bacterial indicator densities are causing impairment of the
watercontactrecreation(REC-1)beneficialuseatmanySantaMonicaBay (SMB) beaches. Swimming in waters with elevated bacterial indicator densities has long been associated with adverse health effects. Specifically,localandnationalepidemiologicalstudiescompeltheconclusion that there is a causal relationship between adverse health effects and recreational water quality, as measured by bacterial indicator densities.
Numeric Target (Interpretation of the numeric water quality objective, used to calculate the waste load allocations)
The TMDL has a multi-part numeric target based on the bacteriological water quality objectives for marine water to protect the water contact recreation use. These targets are the most appropriate indicators of public health risk in recreational waters.
These bacteriological objectives are set forth in Chapter 3 of the Basin Plan, as amended by the Regional Board on October 25, 2001. The objectives are based on four bacterial indicators and include both geometric mean limits and single sample limits. The Basin Plan objectives are as follows:
1. Rolling30-dayGeometricMeanLimitsa. Total coliform density shall not exceed 1,000/100 ml. b. Fecal coliform density shall not exceed 200/100 ml.c. Enterococcus density shall not exceed 35/100 ml.
2. Single Sample Limitsa. Total coliform density shall not exceed 10,000/100 ml.b. Fecalcoliformdensityshallnotexceed400/100ml.c. Enterococcusdensityshallnotexceed104/100ml.d. Total coliform density shall not exceed 1,000/100 ml, if the
ratio of fecal-to-total coliform exceeds 0.1.

Basin Plan 7-26 Total Maximum Daily LoadsUpdated September 20��
Element Key Findings and Regulatory ProvisionsNumeric Target (Interpretation of the numeric water quality objective, used to calculate the waste load allocations)
The targets apply throughout the year. The compliance point for the targets is the wave wash1, where there is a freshwater outlet (i.e., storm drain or creek) to the beach, or at ankle depth at beaches without a freshwater outlet.
The geometric mean targets may not be exceeded at any time. For the single sample targets, each existing shoreline monitoring site is assigned an allowable number of exceedance days for two time periods (summer dryweatherandwinterdryweatherasdefinedinTable7-4.2a).(Aseparate amendment will address the allowable number of wet weather exceedance days.)
The allowable number of exceedance days is set such that (1) bacteriological water quality at any site is at least as good as at a designated reference site within the watershed and (2) there is no degradation of existing shoreline bacteriological water quality.
Source Analysis With the exception of isolated sewage spills, dry weather urban runoff conveyed by storm drains and creeks is the primary source of elevated bacterial indicator densities to SMB beaches during dry weather. Limited natural runoff and groundwater may also potentially contribute to elevated bacterial indicator densities during winter dry weather.Thisissupportedbythefindingthathistoricalmonitoringdatafrom the reference beach indicate no exceedances of the single sample targets during summer dry weather and on average only three percent exceedance during winter dry weather.
Loading Capacity Studies show that bacterial degradation and dilution during transport fromthewatershedtothebeachdonotsignificantlyaffectbacterialindicator densities at SMB beaches. Therefore, the loading capacity isdefinedintermsofbacterialindicatordensities,whichisthemostappropriate for addressing public health risk, and is equivalent to the numeric targets, listed above.
Waste Load Allocations Waste load allocations are expressed as the number of sample days at a shoreline monitoring site that may exceed the single sample targets identifiedunder“NumericTarget.”Wasteloadallocationsareexpressedas allowable exceedance days because the bacterial density and frequency of single sample exceedances are the most relevant to public health protection.
For each shoreline monitoring site and corresponding subwatershed, the allowable number of exceedance days is set for two time periods. These two periods are:
1. summerdryweather(April1toOctober31),and2. winter dry weather (November 1 to March 31).

Basin Plan 7-27 Total Maximum Daily LoadsUpdated September 20��
Element Key Findings and Regulatory ProvisionsWaste Load Allocations The allowable number of exceedance days for a shoreline monitoring
site for each time period is based on the lesser of two criteria (1) exceedance days in the designated reference system and (2) exceedance days based on historical bacteriological data at the monitoring site. This ensures that shoreline bacteriological water quality is at least as good as that of a largely undeveloped system and that there is no degradation of existing shoreline bacteriological water quality.2Allresponsiblejurisdictions and responsible agencies3 within a subwatershed are jointly responsible for complying with the allowable number of exceedance daysforeachassociatedshorelinemonitoringsiteidentifiedinTable7-4.2abelow.
The three Publicly Owned Treatment Works (POTWs)4 discharging to SantaMonicaBayareeachgivenindividualWLAsofzero(0)daysofexceedance during both summer dry weather and winter dry weather.
Implementation This TMDL will be implemented in two phases over a 6-year period. The regulatory mechanisms used to implement the TMDL will include primarilytheLosAngelesCountyMunicipalStormWaterNPDESPermit, the Caltrans Storm Water Permit, the three NPDES permits for thePOTWs,andtheauthorityvestedintheExecutiveOfficervia13267ofthePorter-CologneWaterQualityControlAct.
Within 3 years of the effective date of the TMDL, summer dry-weather allowable exceedance days and the rolling 30-day geometric mean targets must be achieved. Within 6 years of the effective date, winter dry-weather allowable exceedance days and the rolling 30-day geometric mean targets must be achieved.
Margin of Safety WLAsofzerodaysofexceedanceduringthesummerincludeanimplicitmarginofsafety.TheWLAsofamaximumofthreedaysofexceedance during winter dry weather include an implicit margin of safety because the maximum allowable days of exceedance are based on samples collected 50 yards downcurrent of the freshwater outlet at the reference beach. Findings from a bacterial dispersion study of selected freshwateroutletsshowthatthereistypicallysignificantdilutionbetween the freshwater outlet, the wave wash (the compliance point), and a point 50 yards downcurrent.

Basin Plan 7-28 Total Maximum Daily LoadsUpdated September 20��
Element Key Findings and Regulatory ProvisionsSeasonal Variations and Critical Conditions
Seasonal variations are addressed by developing separate waste load allocations for two time periods (summer dry weather and winter dry weather) based on public health concerns and observed natural background levels of exceedance of bacterial indicators.
The critical period for this dry weather bacteria TMDL is during winter months, when historic shoreline monitoring data for the reference beach indicate that the single sample bacteria objectives are exceeded on average 3% of the dry weather days sampled.
Note: The complete staff report for the TMDL is available for review upon request. 1Thewavewashisdefinedasthepointatwhichthestormdrainorcreekemptiesandtheeffluentfromthestormdrain initially mixes with the receiving ocean water.2 In order to fully protect public health, no exceedances are permitted at any shoreline monitoring location during summer dryweather(April1toOctober31).Inadditiontobeingconsistentwiththetwocriteria,wasteloadallocationsofzero(0) exceedance days are further supported by the fact that the California Department of Health Services has established minimum protective bacteriological standards – the same as the numeric targets in this TMDL – which, when exceeded duringtheperiodApril1toOctober31,resultinpostingabeachwithahealthhazardwarning(CaliforniaCodeofRegulations,title17,section7958).3 For the purposes of this TMDL, “responsible jurisdictions and responsible agencies” includes: (1) local agencies that are responsible for discharges from a publicly owned treatment works to the Santa Monica Bay watershed or directly to the Bay, (2) local agencies that are permittees or co-permittees on a municipal storm water permit, (3) local or state agencies thathavejurisdictionoverabeachadjacenttoSantaMonicaBay,and(4)theCaliforniaDepartmentofTransportation pursuant to its storm water permit.4HyperionWastewaterTreatmentPlant,JointWaterPollutionControlPlant,andTapiaWastewaterReclamationFacility.

Bas
in P
lan
7
-29
Tota
l Max
imum
Dai
ly L
oads
Upd
ated
Sep
tem
ber 2
0��
Com
plia
nce
Dea
dlin
e3
year
s afte
r effe
ctiv
e da
te6
year
s afte
r effe
ctiv
e da
teSu
mm
er D
ry W
eath
er^
Win
ter D
ry W
eath
er^*
Apr.1-Oct.31
Nov
. 1-M
ar. 3
1St
atio
n ID
Loca
tion
Nam
eSu
bwat
ersh
edD
aily
sam
plin
g (N
o. d
ays)
Wee
kly
sam
-pl
ing
(No.
day
s)D
aily
sam
plin
g (N
o. d
ays)
Wee
kly
sam
-pl
ing
(No.
day
s)CityofL
osAngeles,Environm
entalM
onitoringDivisionSites
S1Su
rfrid
er B
each
(bre
ach
poin
t) - d
aily
Mal
ibu
Can
yon
00
31
S2To
pang
a St
ate
Bea
chTo
pang
a C
anyo
n0
03
1S3
Pulg
a C
anyo
n st
orm
dra
in -
50 y
ards
eas
t (W
ill R
oger
s)Pu
lga
Can
yon
00
31
S4Sa
nta
Mon
ica
Can
yon,
Will
Rog
ers S
tate
Bea
chSa
nta
Mon
ica
Can
yon
00
31
S5Sa
nta
Mon
ica
Mun
icip
al P
ier -
50
yard
s sou
thea
stSa
nta
Mon
ica
00
31
S6Sa
nta
Mon
ica
Bea
ch a
t Pic
o/K
ente
r sto
rm d
rain
Sant
a M
onic
a0
03
1S7
AshlandAv.stormdrain-50yardsso
uth(Venice)
Sant
a M
onic
a0
03
1S8
VeniceCityBeachatW
indw
ardAv.-50yardsn
orth
Bal
lona
00
21
S10
Bal
lona
Cre
ek e
ntra
nce
- 50
yard
s sou
th (D
ockw
eile
r)D
ockw
eile
r0
03
1S1
1D
ockw
eile
r Sta
te B
each
at C
ulve
r Bl.
Doc
kwei
ler
00
31
S12
Impe
rial H
ighw
ay st
orm
dra
in -
50 y
ards
nor
th (D
ock-
wei
ler)
Doc
kwei
ler
00
21
S13
ManhattanStateBeachat40thStreet
Her
mos
a0
01
1S14
Man
hatta
n B
each
Pie
r - 5
0 ya
rds s
outh
Her
mos
a0
01
1S1
5H
erm
osa
Bea
ch P
ier -
50
yard
s sou
thH
erm
osa
00
21
S16
Red
ondo
Mun
icip
al P
ier -
50
yard
s sou
thR
edon
do0
03
1S17
RedondoStateBeachatAvenueI
Red
ondo
00
31
S18
Mal
aga
Cov
e, P
alos
Ver
des E
stat
es -
daily
Palo
s Ver
des
00
11
LosA
ngelesCountyDepartmentofH
ealthServicesS
ites
DH
S (0
10)
LeoCarilloBeach(R
EFER
ENCEBEA
CH)
ArroyoSequitCanyon
00
31
DH
S (0
09)
Nic
hola
s Bea
chN
icho
las C
anyo
n0
00
0D
HS
(010
a)B
road
Bea
chTr
anca
s Can
yon
00
31
DH
S (0
08)
Tran
cas B
each
ent
ranc
eTr
anca
s Can
yon
00
00
DHS(007)
Wes
twar
d B
each
, SE
end
Zum
a C
anyo
n0
00
0
Tabl
e 7-
4.2a
. Sa
nta
Mon
ica
Bay
Bea
ches
Bac
teri
a T
MD
L Im
plem
enta
tion
Sche
dule
(Dry
Wea
ther
Onl
y)A
llow
able
num
ber
of d
ays t
hat m
ay e
xcee
d A
ny S
ingl
e Sa
mpl
e B
acte
rial
Indi
cato
r Tar
get F
or E
xist
ing
Shor
elin
e M
onito
ring
Sta
tions

Bas
in P
lan
7
-�0
Tota
l Max
imum
Dai
ly L
oads
Upd
ated
Sep
tem
ber 2
0��
Com
plia
nce
Dea
dlin
e3
year
s afte
r effe
ctiv
e da
te6
year
s afte
r effe
ctiv
e da
teSu
mm
er D
ry W
eath
er^
Win
ter D
ry W
eath
er^*
Apr.1-Oct.31
Nov
. 1-M
ar. 3
1St
atio
n ID
Loca
tion
Nam
eSu
bwat
ersh
edD
aily
sam
plin
g (N
o. d
ays)
Wee
kly
sam
-pl
ing
(No.
day
s)D
aily
sam
plin
g (N
o. d
ays)
Wee
kly
sam
-pl
ing
(No.
day
s)D
HS
(006
)Pa
radi
se C
ove
Ram
irez
Can
yon
00
31
DH
S (0
05)
2661
0 La
tigo
Shor
e D
rive
Latig
o C
anyo
n0
03
1D
HS
(005
a)C
orra
l Bea
chLa
tigo
Can
yon
00
31
DHS(004)
Puer
co B
each
Cor
ral C
anyo
n0
03
1D
HS
(003
)M
alib
u Po
int,
Mal
ibu
Col
ony
Dr.
Mal
ibu
Can
yon
00
31
DH
S (0
03a)
Surf
rider
Bea
ch, M
alib
u, 5
0 yd
s. M
alib
u C
anyo
n0
03
1
DH
S (0
02)
Mal
ibu
Pier
Mal
ibu
Can
yon
00
31
DH
S (0
01a)
Las F
lore
s Bea
chLa
s Flo
res C
anyo
n0
03
1
DH
S (0
01)
Big
Roc
k B
each
PiedraGordaCanyon
00
31
DH
S (1
01)
17200PacificCoastHwy.
Sant
a Yne
z C
anyo
n0
03
1D
HS
(102
)BelAirBayClub,16801Pacific
Sant
a Yne
z C
anyo
n0
03
1D
HS
(103
)Te
mes
cal S
torm
Dra
inPu
lga
Can
yon
00
31
DH
S (104a)
San
Vic
ente
Blv
d. e
xten
ded
Sant
a M
onic
a0
03
1
DHS(104)
MontanaAve.StormDrain
Sant
a M
onic
a0
03
1D
HS
(105
)W
ilshi
re B
lvd.
, San
ta M
onic
aSa
nta
Mon
ica
00
31
DH
S (1
06)
Stra
nd S
treet
ext
ende
dSa
nta
Mon
ica
00
31
DH
S (1
06a)
AshlandStormDrain
Sant
a M
onic
a0
03
1
DHS(107)
VeniceCityBeachatB
rooksA
v.B
allo
na0
03
1D
HS
(108
)Ve
nice
Pie
r, Ve
nice
Bal
lona
00
31
DH
S (1
09)
Tops
ail S
treet
ext
ende
dB
allo
na0
03
1D
HS
(110
)W
orld
Way
ext
ende
dD
ockw
eile
r0
03
1D
HS
(111
)O
ppos
ite H
yper
ion
Plan
t, 1
mile
D
ockw
eile
r0
03
1D
HS
(112
)GrandAvenueextended
Doc
kwei
ler
00
31

Bas
in P
lan
7
-��
Tota
l Max
imum
Dai
ly L
oads
Upd
ated
Sep
tem
ber 2
0��
Com
plia
nce
Dea
dlin
e3
year
s afte
r effe
ctiv
e da
te6
year
s afte
r effe
ctiv
e da
teSu
mm
er D
ry W
eath
er^
Win
ter D
ry W
eath
er^*
Apr.1-Oct.31
Nov
. 1-M
ar. 3
1St
atio
n ID
Loca
tion
Nam
eSu
bwat
ersh
edD
aily
sam
plin
g (N
o. d
ays)
Wee
kly
sam
-pl
ing
(No.
day
s)D
aily
sam
plin
g (N
o. d
ays)
Wee
kly
sam
-pl
ing
(No.
day
s)D
HS
(113
)26
th S
treet
ext
ende
dH
erm
osa
00
00
DHS(114)
Her
ondo
Stre
et e
xten
ded
Her
mos
a0
03
1D
HS
(115
)To
paz
Stre
et e
xten
ded
Red
ondo
00
31
CountySanitationDistrictso
fLosAngelesCountySites
LACSD
1Lo
ng P
oint
Palo
s Ver
des
00
11
LACSD
2AbaloneCove
Palo
s Ver
des
00
00
LACSD
3Po
rtugu
ese
Ben
d C
ove
Palo
s Ver
des
00
11
LACSD
5R
oyal
Pal
ms
Palo
s Ver
des
00
11
LACSD
6WilderAnnex
Palo
s Ver
des
00
11
LACSD
7C
abril
lo B
each
, oce
ansi
dePa
los V
erde
s0
01
1LA
CS-
DM
CM
alag
a C
ove
Palo
s Ver
des
00
11
LACSD
BC
Blu
ff C
ove
Palo
s Ver
des
00
11
Notes:Theallowablenum
berofexceedancedaysduringwinterdryweatheriscalculatedbasedonthe10thpercentileyearintermso
fnon-raindaysattheLAXmeteoro
-lo
gica
l sta
tion.
The
num
ber o
f allo
wab
le e
xcee
danc
es d
urin
g w
inte
r dry
wea
ther
is b
ased
on
the
less
er o
f (1)
the
refe
renc
e sy
stem
or (
2) e
xist
ing
leve
ls o
f exc
eeda
nce
base
d on
his
toric
al
shor
elin
e da
ta.
^Dryweatherdaysaredefinedasthosewith<0.1inchofrainandthosedaysnotlessthan3daysafterarainday.R
aindaysaredefinedasthosewith>=0.1inchofrain.
*Are-openerisscheduledforfouryearsaftertheeffectivedateoftheTMDLinordertore-evaluatetheallowableexceedancedaysduringwinterdryweatherbasedon
addi
tiona
l mon
itorin
g da
ta.

Basin Plan 7-�2 Total Maximum Daily LoadsUpdated September 20��
Compliance Deadline3 years after effective date
6 years after effective date
Location Name Subwatershed
Summer Dry Weather (Apr.1-Oct.31)
Winter Dry Weather (Nov. 1-Mar. 31)*
City of Los Angeles, Environmental Monitoring Division SitesS1 Surfrider Beach (breach point) - daily Malibu Canyon 48 31S2 Topanga State Beach Topanga Canyon 10 8S3 Pulga Canyon storm drain - 50 yards east (Will
Rogers)Pulga Canyon 4 6
S4 Santa Monica Canyon, Will Rogers State Beach Santa Monica Canyon
36 7
S5 Santa Monica Municipal Pier - 50 yards south-east (Santa Monica)
Santa Monica 54 22
S6 Santa Monica Beach at Pico/Kenter storm drain (Santa Monica)
Santa Monica 15 20
S7 AshlandAv.stormdrain-50yardssouth(Ven-ice)
Santa Monica 16 6
S8 VeniceCityBeachatWindwardAv.-50yardsnorth
Ballona 3 0
S10 Ballona Creek entrance - 50 yards south (Dock-weiler)
Dockweiler 7 3
S11 Dockweiler State Beach at Culver Bl. Dockweiler 6 1S12 Imperial Highway storm drain - 50 yards north
(Dockweiler)Dockweiler 7 0
S13 ManhattanStateBeachat40thStreet Hermosa 1 0S14 Manhattan Beach Pier - 50 yards south Hermosa 1 0S15 Hermosa Beach Pier - 50 yards south Hermosa 2 0S16 Redondo Municipal Pier - 50 yards south Redondo 16 9S17 RedondoStateBeachatAvenueI Redondo 2 0S18 Malaga Cove, Palos Verdes Estates - daily Palos Verdes 1 0
Los Angeles County Department of Health Services SitesDHS (010)
LeoCarilloBeach(REFERENCEBEACH) ArroyoSequitCanyon
0 0
DHS (009)
Nicholas Beach Nicholas Canyon 7 0
DHS (010a)
Broad Beach Trancas Canyon 3 3
DHS (008)
Trancas Beach entrance Trancas Canyon 5 0
DHS (007)
Westward Beach, SE end Zuma Canyon 8 0
Table 7-4.2b. Santa Monica Bay Beaches Bacteria TMDL Implementation Schedule (Dry Weather Only) Required Reduction in Number of Days Exceeding Single Sample Bacterial Indicator Targets for Existing Shoreline Monitoring Stations

Basin Plan 7-�� Total Maximum Daily LoadsUpdated September 20��
Compliance Deadline3 years after effective date
6 years after effective date
Location Name Subwatershed
Summer Dry Weather (Apr.1-Oct.31)
Winter Dry Weather (Nov. 1-Mar. 31)*
DHS (006)
Paradise Cove Ramirez Canyon 16 9
DHS (005)
26610 Latigo Shore Drive Latigo Canyon 11 13
DHS (005a)
Corral Beach Latigo Canyon 3 5
DHS (004)
Puerco Beach Corral Canyon 0 7
DHS (003)
Malibu Point, Malibu Colony Dr. Malibu Canyon 23 6
DHS (003a)
Surfrider Beach, Malibu, 50 yds. Malibu Canyon 58 25
DHS (002)
Malibu Pier Malibu Canyon 42 14
DHS (001a)
Las Flores Beach Las Flores Canyon 18 7
DHS (001)
Big Rock Beach PiedraGordaCan-yon
32 20
DHS (101)
17200PacificCoastHwy. Santa Ynez Canyon 3 9
DHS (102)
BelAirBayClub,16801Pacific Santa Ynez Canyon 14 5
DHS (103)
Temescal Storm Drain Pulga Canyon 17 0
DHS (104a)
San Vicente Blvd. extended Santa Monica 7 0
DHS (104)
MontanaAve.StormDrain Santa Monica 7 0
DHS (105)
Wilshire Blvd., Santa Monica Santa Monica 15 4
DHS (106)
Strand Street extended Santa Monica 8 6
DHS (106a)
AshlandStormDrain Santa Monica 24 2
DHS (107)
VeniceCityBeachatBrooksAv. Ballona 3 10
DHS (108)
Venice Pier, Venice Ballona 4 0

Basin Plan 7-�4 Total Maximum Daily LoadsUpdated September 20��
Compliance Deadline3 years after effective date
6 years after effective date
Location Name Subwatershed
Summer Dry Weather (Apr.1-Oct.31)
Winter Dry Weather (Nov. 1-Mar. 31)*
DHS (109)
Topsail Street extended Ballona 11 0
DHS (110)
World Way extended Dockweiler 5 1
DHS (111)
Opposite Hyperion Plant, 1 mile Dockweiler 3 4
DHS (112)
GrandAvenueextended Dockweiler 8 5
DHS (113)
26th Street extended Hermosa 5 0
DHS (114)
Herondo Street extended Hermosa 5 1
DHS (115)
Topaz Street extended Redondo 8 12
County Sanitation Districts of Los Angeles County SitesLong Point Palos Verdes 1 0AbaloneCove Palos Verdes 1 0Portuguese Bend Cove Palos Verdes 1 0Royal Palms Palos Verdes 1 0WilderAnnex Palos Verdes 1 0Cabrillo Beach, oceanside Palos Verdes 1 0Malaga Cove Palos Verdes 2 0Bluff Cove Palos Verdes 0 0
*Are-openerisscheduledforfouryearsaftertheeffectivedateoftheTMDLinordertore-evaluatetheal-lowable exceedance days and necessary reductions during winter dry weather based on additional monitoring data.** Required reductions are based on the assumption of daily sampling.

Basin Plan 7-�5 Total Maximum Daily LoadsUpdated September 20��
Table 7-4.3. Santa Monica Bay Beaches Bacteria TMDL (Dry Weather Only): Significant DatesDate Action120 days after the effective date of the TMDL
Responsible jurisdictions and responsible agencies must submit coordinated shoreline monitoring plan(s), including a list of new sites or sites relocated to the wave wash at which time responsible jurisdictions and responsible agencies will select between daily and weekly shoreline sampling.
120 days after the effective date of the TMDL
Responsible jurisdictions and responsible agencies must identifyandprovidedocumentationon342potentialdischarges to Santa Monica Bay beaches listed in AppendixCoftheTMDLStaffReportdatedJanuary11,2002. Documentation must include a Report of Waste Discharge (ROWD) where necessary.
Responsible jurisdictions and responsible agencies must identify and provide documentation on potential dischargestotheAreaofSpecialBiologicalSignificance(ASBS)innorthernSantaMonicaBayfromLatigoPointto the County line.
CessationofthedischargesintotheASBSshallberequired in conformance with the California Ocean Plan.
4yearsaftereffectivedateofTMDL
Re-open TMDL to re-evaluate allowable winter dry weather exceedance days based on additional data on bacterial indicator densities in the wave wash, a re-evaluation of the reference system selected to set allowable exceedance levels, and a re-evaluation of the reference year used in the calculation of allowable exceedance days.
3 years after effective date of the TMDL
AchievecompliancewithallowableexceedancedaysassetforthinTable7-4.2aandrolling30-daygeometricmeantargetsduringsummerdryweather(April1toOctober 31).
6 years after effective date of the TMDL
AchievecompliancewithallowableexceedancedaysassetforthinTable7-4.2aandrolling30-daygeometricmean targets during winter dry weather (November 1 to March 31).

Basin Plan 7-�6 Total Maximum Daily LoadsUpdated September 20��

Basin Plan 7-�7 Total Maximum Daily LoadsUpdated September 20��
7-4 Santa Monica Bay Beaches Bacteria TMDL (Wet Weather Only)*
This TMDL was adopted by: The Regional Water Quality Control Board on December 12, 2002.
This TMDL was approved by: The State Water Resources Control Board on March 19, 2003. TheOfficeofAdministrativeLawonMay20,2003. TheU.S.EnvironmentalProtectionAgencyonJune19,2003.
The effective date of this TMDL is: July 15, 2003.
The following table summarizes the key elements of this TMDL.
Table 7-4.4. Santa Monica Bay Beaches Bacteria TMDL (Wet Weather Only): Elements
Element Key Findings and Regulatory ProvisionsProblem Statement Elevated bacterial indicator densities are causing impairment of the
watercontactrecreation(REC-1)beneficialuseatmanySantaMonicaBay (SMB) beaches. Swimming in waters with elevated bacterial indicator densities has long been associated with adverse health effects. Specifically,localandnationalepidemiologicalstudiescompeltheconclusion that there is a causal relationship between adverse health effects and recreational water quality, as measured by bacterial indicator densities.
Numeric Target(Interpretation of the numeric water quality objective, used to calculate the waste load allocations)
The TMDL has a multi-part numeric target based on the bacteriological water quality objectives for marine water to protect the water contact recreation (REC-1) use. These targets are the most appropriate indicators of public health risk in recreational waters.
These bacteriological objectives are set forth in Chapter 3 of the Basin Plan, as amended by the Regional Board on October 25, 2001. The objectives are based on four bacterial indicators and include both geometric mean limits and single sample limits. The Basin Plan objectives that serve as numeric targets for this TMDL are:
1. Rolling30-dayGeometricMeanLimitsa. Total coliform density shall not exceed 1,000/100 ml. b. Fecal coliform density shall not exceed 200/100 ml.c. Enterococcus density shall not exceed 35/100 ml.
2. Single Sample Limitsa. Total coliform density shall not exceed 10,000/100 ml.b. Fecalcoliformdensityshallnotexceed400/100ml.c. Enterococcusdensityshallnotexceed104/100ml.d. Total coliform density shall not exceed 1,000/100 ml, if the
ratio of fecal-to-total coliform exceeds 0.1.

Basin Plan 7-�8 Total Maximum Daily LoadsUpdated September 20��
Element Key Findings and Regulatory ProvisionsNumeric Target (continued)(Interpretation of the numeric water quality objective, used to calculate the waste load allocations)
These objectives are generally based on an acceptable health risk for marine recreational waters of 19 illnesses per 1,000 exposed individuals assetbytheUSEPA(USEPA,1986).Thetargetsapplythroughouttheyear.Thefinalcompliancepointforthetargetsisthewavewash1 where there is a freshwater outlet (i.e., publicly-owned storm drain or natural creek) to the beach, or at ankle depth at beaches without a freshwater outlet.
Implementation of the above bacteria objectives and the associated TMDL numeric targets is achieved using a ‘reference system/anti-degradationapproach’ratherthanthealternative‘naturalsourcesexclusionapproach’orstrictapplicationofthesinglesampleobjectives.AsrequiredbytheCWAandPorter-CologneWaterQualityControlAct,BasinPlansincludebeneficialusesofwaters,waterqualityobjectivesto protect those uses, an anti-degradation policy, collectively referred to as water quality standards, and other plans and policies necessary to implement water quality standards. This TMDL and its associated waste load allocations, which shall be incorporated into relevant permits, are thevehiclesforimplementationoftheRegion’sstandards.
The‘referencesystem/anti-degradationapproach’meansthatonthebasis of historical exceedance levels at existing shoreline monitoring locations, including a local reference beach within Santa Monica Bay, a certain number of daily exceedances of the single sample bacteria objectives are permitted. The allowable number of exceedance days is set such that (1) bacteriological water quality at any site is at least as good as at a designated reference site within the watershed and (2) there is no degradation of existing shoreline bacteriological water quality. This approach recognizes that there are natural sources of bacteria that may cause or contribute to exceedances of the single sample objectives and that it is not the intent of the Regional Board to require treatment or diversion of natural coastal creeks or to require treatment of natural sources of bacteria from undeveloped areas.
The geometric mean targets may not be exceeded at any time. The rolling 30-day geometric means will be calculated on each day. If weekly sampling is conducted, the weekly sample result will be assigned to the remaining days of the week in order to calculate the daily rolling 30-day geometric mean. For the single sample targets, each existing shoreline monitoring site is assigned an allowable number of exceedancedaysduringwetweather,definedasdayswith0.1inchofrainorgreaterandthethreedaysfollowingtherainevent.(Aseparateamendment incorporating the Santa Monica Bay Beaches Dry-Weather Bacteria TMDL addressed the allowable number of summer and winter dry-weather exceedance days.)

Basin Plan 7-�9 Total Maximum Daily LoadsUpdated September 20��
Element Key Findings and Regulatory ProvisionsSource Analysis With the exception of isolated sewage spills, storm water runoff
conveyed by storm drains and creeks is the primary source of elevated bacterial indicator densities to SMB beaches during wet weather. Because the bacterial indicators used as targets in the TMDL are not specifictohumansewage,stormwaterrunofffromundevelopedareas may also be a source of elevated bacterial indicator densities. For example, storm water runoff from natural areas may convey fecal matter from wildlife and birds or bacteria from soil. This is supported bythefindingthat,atthereferencebeach,theprobabilityofexceedanceof the single sample targets during wet weather is 0.22.
Loading Capacity Studies show that bacterial degradation and dilution during transport fromthewatershedtothebeachdonotsignificantlyaffectbacterialindicator densities at SMB beaches. Therefore, the loading capacity isdefinedintermsofbacterialindicatordensities,whichisthemostappropriate for addressing public health risk, and is equivalent to the numerictargets,listedabove.Asthenumerictargetsmustbemetinthe wave wash and throughout the day, no degradation allowance is provided.
Waste Load Allocations (for point sources)
Waste load allocations are expressed as the number of sample days at a shoreline monitoring site that may exceed the single sample targets identifiedunder“NumericTarget.”Wasteloadallocationsareexpressedas allowable exceedance days because the bacterial density and frequency of single sample exceedances are the most relevant to public health protection.
For each shoreline monitoring site and corresponding subwatershed, an allowable number of exceedance days is set for wet weather.
The allowable number of exceedance days for a shoreline monitoring site for each time period is based on the lesser of two criteria (1) exceedance days in the designated reference system and (2) exceedance days based on historical bacteriological data at the monitoring site. This ensures that shoreline bacteriological water quality is at least as good as that of a largely undeveloped system and that there is no degradation of existing shoreline bacteriological water quality.
Allresponsiblejurisdictionsandresponsibleagencies2 within a subwatershed are jointly responsible for complying with the allowable number of exceedance days for each associated shoreline monitoring siteidentifiedinTable7-4.5below.
The three Publicly Owned Treatment Works (POTWs), the City of Los Angeles’HyperionWastewaterTreatmentPlant,LosAngelesCountySanitationDistricts’JointWaterPollutionControlPlant,andtheLasVirgenesMunicipalWaterDistricts’TapiaWastewaterReclamationFacility, discharging to Santa Monica Bay are each given individual WLAsofzero(0)daysofexceedanceduringwetweather.

Basin Plan 7-40 Total Maximum Daily LoadsUpdated September 20��
Element Key Findings and Regulatory ProvisionsLoad Allocations (for nonpoint sources)
Because all storm water runoff to SMB beaches is regulated as a point source, load allocations of zero days of exceedance are set in this TMDL. If a nonpoint source is directly impacting shoreline bacteriological quality and causing an exceedance of the numeric target(s), the permittee(s) under the Municipal Storm Water NPDES Permits are not responsible through these permits. However, the jurisdiction or agency adjacent to the shoreline monitoring location may have further obligations as described under “Compliance Monitoring” below.
Implementation The regulatory mechanisms used to implement the TMDL will include primarilytheLosAngelesCountyMunicipalStormWaterNPDESPermit(MS4Permit),theCaltransStormWaterPermit,thethreeNPDES permits for the POTWs, the authority contained in sections 13267and13263oftheWaterCode,andregulationstobeadoptedpursuant to section 13291 of the Water Code. Each NPDES permit assigned a waste load allocation shall be reopened or amended at reissuance, in accordance with applicable laws, to incorporate the applicable waste load allocation(s) as a permit requirement.
The implementation schedule will be determined on the basis of the implementation plan(s), which must be submitted to the Regional Board by responsible jurisdictions and agencies within two years of theeffectivedateoftheTMDL(seeTable7-4.7).Afterconsideringtheimplementation plan(s), the Regional Board shall amend the TMDL at a public hearing and, in doing so, will adopt an individual implementation schedule for each jurisdictional group (described in paragraph 3 below) that is as short as possible taking into account the implementation approach being undertaken. Responsible jurisdictions and agencies must clearly demonstrate in the above-mentioned plan whether they intend to pursue an integrated water resources approach.3 If an integrated water resources approach is pursued, responsible jurisdictions and agencies may be allotted up to an 18-year implementation timeframe, based on a clear demonstration of the need for a longer schedule in the implementation plan, in recognition of the additional planning and time neededtoachievethemultiplebenefitsofthisapproach.Otherwise,atmost a 10-year implementation timeframe will be allotted, depending upon a clear demonstration of the time needed in the implementation plan.
The subwatersheds associated with each beach monitoring location may include multiple responsible jurisdictions and responsible agencies.Therefore,a“primaryjurisdiction,”definedasthejurisdictioncomprisinggreaterthanfiftypercentofthesubwatershedlandarea,isidentifiedforeachsubwatershed(seeTable7-4.6).4 Seven primary jurisdictionsareidentifiedwithintheSantaMonicaBaywatershed,each with a group of associated subwatersheds and beach monitoring locations.Theseareidentifiedas“jurisdictionalgroups”(seeTable7-4.6).

Basin Plan 7-4� Total Maximum Daily LoadsUpdated September 20��
Element Key Findings and Regulatory ProvisionsImplementation (continued) The primary jurisdiction of each “jurisdictional group” shall be
responsible for submitting the implementation plan described above, which will determine the implementation timeframe for thesubwatershed.Ajurisdictionalgroupmaychangeitsprimaryjurisdiction by submitting a joint, written request, submitted by the current primary jurisdiction and the proposed primary jurisdiction, totheExecutiveOfficerrequestingareassignmentofprimaryresponsibility. Two jurisdictional groups may also choose to change the assignment of monitoring locations between the two groups by submitting a joint, written request, submitted by the current primary jurisdiction and the proposed primary jurisdiction, to the Executive Officerrequestingareassignmentofthemonitoringlocation.
If an integrated water resources approach is pursued, the jurisdictional group(s) must achieve a 10% cumulative percentage reduction from the total exceedance-day reduction required for the group of beach monitoring locations within 6 years, a 25% reduction within 10 years, and a 50% reduction within 15 years of the effective date of the TMDL. These interim milestones for the jurisdictional group(s) will be re-evaluated, considering planning, engineering and construction tasks, based on the written implementation plan submitted to the Regional BoardtwoyearsaftertheeffectivedateoftheTMDL(seeTable7-4.7).
If an integrated water resources approach is not pursued, the jurisdictional group(s) must achieve a 25% cumulative percentage reduction from the total exceedance-day reduction required for the group of beach monitoring locations within 6 years, and a 50% reduction within 8 years of the effective date of the TMDL (see Table 7-4.7).
For those beach monitoring locations subject to the antidegradation provision, there shall be no increase in exceedance days during the implementation period above that estimated for the beach monitoring locationinthecriticalyearasidentifiedinTable7-4.5.
Thefinalimplementationtargetsintermsofallowablewet-weatherexceedance days must be achieved at each individual beach location nolaterthan18yearsaftertheTMDL’seffectivedateifanintegratedwater resources approach is pursued, or no later than 10 years after the TMDL’seffectivedateifanintegratedwaterresourcesapproachisnotpursued. In addition, the geometric mean targets must be achieved for each individual beach location no later than 18 years or 10 years after the effective date, respectively, depending on whether a integrated water resources approach is pursued or not.

Basin Plan 7-42 Total Maximum Daily LoadsUpdated September 20��
Element Key Findings and Regulatory ProvisionsMargin of Safety The TMDL is set at levels that are exactly equivalent to the applicable
water quality standards along with the proposed reference system/antidegradation implementation procedure.
Animplicitmarginofsafetyisincludedinthesupportingwaterqualitymodel by assuming no dilution between the storm drain and the wave wash, the point of compliance. This is a conservative assumption since studies have shown that there is a high degree of variability in the amount of dilution between the storm drain and wave wash temporally, spatially and among indicators, ranging from 100% to 0%.
Seasonal Variations and Critical Conditions
Seasonal variations are addressed by developing separate waste load allocations for three time periods (wet weather, summer dry weather and winter dry weather) based on public health concerns and observed natural background levels of exceedance of bacterial indicators. (The two dry-weather periods are addressed in the Santa Monica Bay Beaches Dry-Weather Bacteria TMDL.)
The critical condition for this bacteria TMDL is wet weather generally, when historic shoreline monitoring data for the reference beach indicate that the single sample bacteria objectives are exceeded on 22%ofthewet-weatherdayssampled.Tomorespecificallyidentifya critical condition within wet weather in order to set the allowable exceedancedaysshowninTables7-4.5and7-4.6,the90th percentile ‘stormyear’5 in terms of wet days is used as the reference year. Selecting the 90th percentile year avoids a situation where the reference beach is frequently out of compliance. It is expected that because responsible jurisdictions and agencies will be planning for this ‘worst-case’scenario,therewillbefewerexceedancedaysthanthemaximumallowed in drier years. Conversely, in the 10% of wetter years, it is expected that there may be more than the allowable number of exceedance days.
Compliance Monitoring ResponsiblejurisdictionsandagenciesasdefinedinFootnote2shallconduct daily or systematic weekly sampling in the wave wash at all major drains6 and creeks or at existing monitoring stations at beaches without storm drains or freshwater outlets to determine compliance.7Atall locations, samples shall be taken at ankle depth and on an incoming wave.Atlocationswherethereisafreshwateroutlet,duringwetweather, samples should be taken as close as possible to the wave wash, and no further away than 10 meters down current of the storm drain or outlet.8Atlocationswherethereisafreshwateroutlet,samplesshallbetakenwhenthefreshwateroutletisflowingintothesurfzone.

Basin Plan 7-4� Total Maximum Daily LoadsUpdated September 20��
Element Key Findings and Regulatory ProvisionsCompliance Monitoring (continued)
If the number of exceedance days is greater than the allowable number of exceedance days for any jurisdictional group at the interim implementation milestones the responsible jurisdictions and agencies shall be considered out-of-compliance with the TMDL. If the number of exceedance days exceeds the allowable number of exceedance days foratargetbeachatthefinalimplementationdeadline,theresponsiblejurisdictions and agencies within the contributing subwatershed shall be considered out-of-compliance with the TMDL. Responsible jurisdictions or agencies shall not be deemed out of compliance with the TMDL if the investigation described in the paragraph below demonstrates that bacterial sources originating within the jurisdiction of the responsible agency have not caused or contributed to the exceedance.
If a single sample shows the discharge or contributing area to be out of compliance, the Regional Board may require, through permit requirementsortheauthoritycontainedinWaterCodesection13267,daily sampling in the wave wash or at the existing open shoreline monitoring location (if it is not already) until all single sample events meet bacteria water quality objectives. Furthermore, if a beach location is out-of-compliance as determined in the previous paragraph, the Regional Board shall require responsible agencies to initiate an investigation, which at a minimum shall include daily sampling in the wave wash or at the existing open shoreline monitoring location until all single sample events meet bacteria water quality objectives. If bacteriological water quality objectives are exceeded in any three weeks of a four-week period when weekly sampling is performed, or, forareaswheretestingisdonemorethanonceaweek,75%oftestingdays produce an exceedence of bacteria water quality objectives, the responsible agencies shall conduct a source investigation of the subwatershed(s) pursuant to protocols established under Water Code 13178.

Basin Plan 7-44 Total Maximum Daily LoadsUpdated September 20��
Element Key Findings and Regulatory ProvisionsCompliance Monitoring (continued)
If a beach location without a freshwater outlet is out-of-compliance or if the outlet is diverted or being treated, the adjacent municipality, County agency(s), or State or federal agency(s) shall be responsible forconductingtheinvestigationandshallsubmititsfindingstotheRegional Board to facilitate the Regional Board exercising further authority to regulate the source of the exceedance in conformance with thePorter-CologneWaterQualityControlAct.
Note: The complete staff report for the TMDL is available for review upon request.
1Thewavewashisdefinedasthepointatwhichthestormdrainorcreekemptiesandtheeffluentfromthestormdrain initially mixes with the receiving ocean water.2ForthepurposesofthisTMDL,“responsiblejurisdictionsandresponsibleagencies”aredefinedas:(1)localagenciesthat are responsible for discharges from a publicly owned treatment works to the Santa Monica Bay watershed or directly to the Bay, (2) local agencies that are permittees or co-permittees on a municipal storm water permit, (3) local or state agencies thathavejurisdictionoverabeachadjacenttoSantaMonicaBay,and(4)theCaliforniaDepartmentofTransportation pursuant to its storm water permit.3Anintegratedwaterresourcesapproachisonethattakesaholisticviewofregionalwaterresourcesmanagementby integrating planning for future wastewater, storm water, recycled water, and potable water needs and systems; focuses on beneficialre-useofstormwater,includinggroundwaterinfiltration,atmultiplepointsthroughoutawatershed;andaddressesmultiplepollutantsforwhichSantaMonicaBayoritswatershedarelistedontheCWAsection303(d)Listas impaired. Because an integrated water resources approach will address multiple pollutants, responsible jurisdictions can recognize cost-savings because capital expenses for the integrated approach will implement several TMDLs that address pollutantsinstormwater.AnintegratedwaterresourcesapproachshallnotonlyprovidewaterqualitybenefitstothepeopleoftheLosAngelesRegion,butitisalsoanticipatedthatanintegratedapproachwillincorporateandenhanceother public goals. These may include, but are not limited to, water supply, recycling and storage; environmental justice; parks, greenways and open space; and active and passive recreational and environmental education opportunities.4PrimaryjurisdictionsarenotdefinedfortheBallonaCreeksubwatershedortheMalibuCreeksubwatershed,sinceseparate bacteria TMDLs are being developed for these subwatersheds.5ForpurposesofthisTMDL,a‘stormyear’meansNovember1toOctober31.The90th percentile storm year was 1993 with 75wetdaysattheLAXmeteorologicalstation.6Majordrainsarethosethatarepubliclyownedandhavemeasurableflowtothebeachduringdryweather.7Thefrequencyofsampling(i.e.,dailyversusweekly)willbeatthediscretionoftheimplementingagencies.However,the number of sample days that may exceed the objectives will be scaled accordingly.8 Safety considerations during wet weather may preclude taking a sample in the wave wash.

Basin Plan 7-45 Total Maximum Daily LoadsUpdated September 20��
Table7-4.5.FinalAllowableWet-WeatherExceedanceDaysbyBeachLocation
Beach Monitoring LocationEstimated no. of wet weather exceedance days in critical year (90th percentile)*
Final allowable no. of wet weather exceedance days (daily sampling)*
DHS 010 - Leo Carrillo Beach, at 35000 PCH 17 17
DHS 009 - Nicholas Beach- 100 feet west of lifeguard tower 14 14
DHS 010a - Broad Beach 15 15
DHS 008 - Trancas Beach entrance, 50 yards east of Trancas Bridge 19 17
DHS 007 - Westward Beach, east of Zuma Creek 17 17
DHS 006 - Paradise Cove, adjacent to west side of Pier 23 17
DHS 005 - Latigo Canyon Creek entrance 33 17
DHS 005a - Corral State Beach 17 17
DHS 001a - Las Flores Beach 29 17
DHS 001 - Big Rock Beach, at 19900 PCH 30 17
DHS 003 - Malibu Point 18 17
DHS 003a - Surfrider Beach (second point)- weekly 45 17
S1 - Surfrider Beach (breach point)- daily 47 17
DHS 002 - Malibu Pier- 50 yards east 45 17
S2 - Topanga State Beach 26 17
DHS 101 - PCH and Sunset Bl.- 400 yards east 25 17
DHS 102 - 16801 Pacific Coast Highway, Bel Air Bay Club (chain fence) 28 17
S3 - Pulga Canyon storm drain- 50 yards east 23 17
DHS 103 - Will Rogers State Beach- Temescal Canyon (25 yrds. so. of drain) 31 17
S4 - Santa Monica Canyon, Will Rogers State Beach 25 17
DHS 104a - Santa Monica Beach at San Vicente Bl. 34 17
DHS 104 - Santa Monica at Montana Av. (25 yrds. so. of drain) 31 17
DHS 105 - Santa Monica at Arizona (in front of the drain) 31 17
S5 - Santa Monica Municipal Pier- 50 yards southeast 35 17
S6 - Santa Monica Beach at Pico/Kenter storm drain 42 17
DHS 106 - Santa Monica Beach at Strand St. (in front of the restrooms) 36 17
DHS 106a - Ashland Av. storm drain- 50 yards north 39 17
S7 - Ashland Av. storm drain- 50 yards south 22 17
DHS 107 - Venice City Beach at Brooks Av. (in front of the drain) 40 17
S8 - Venice City Beach at Windward Av.- 50 yards north 13 13
DHS 108 - Venice Fishing Pier- 50 yards south 17 17
DHS 109 - Venice City Beach at Topsail St. 38 17
S11 - Dockweiler State Beach at Culver Bl. 23 17
DHS 110 - Dockweiler State Beach- south of D&W jetty 30 17
S12 - Imperial HWY storm drain- 50 yards north 17 17
DHS 111 - Hyperion Treatment Plant One Mile Outfall 18 17
DHS 112 - Dockweiler State Beach at Grand Av. (in front of the drain) 25 17
S10 - Ballona Creek entrance- 50 yards south 34 17
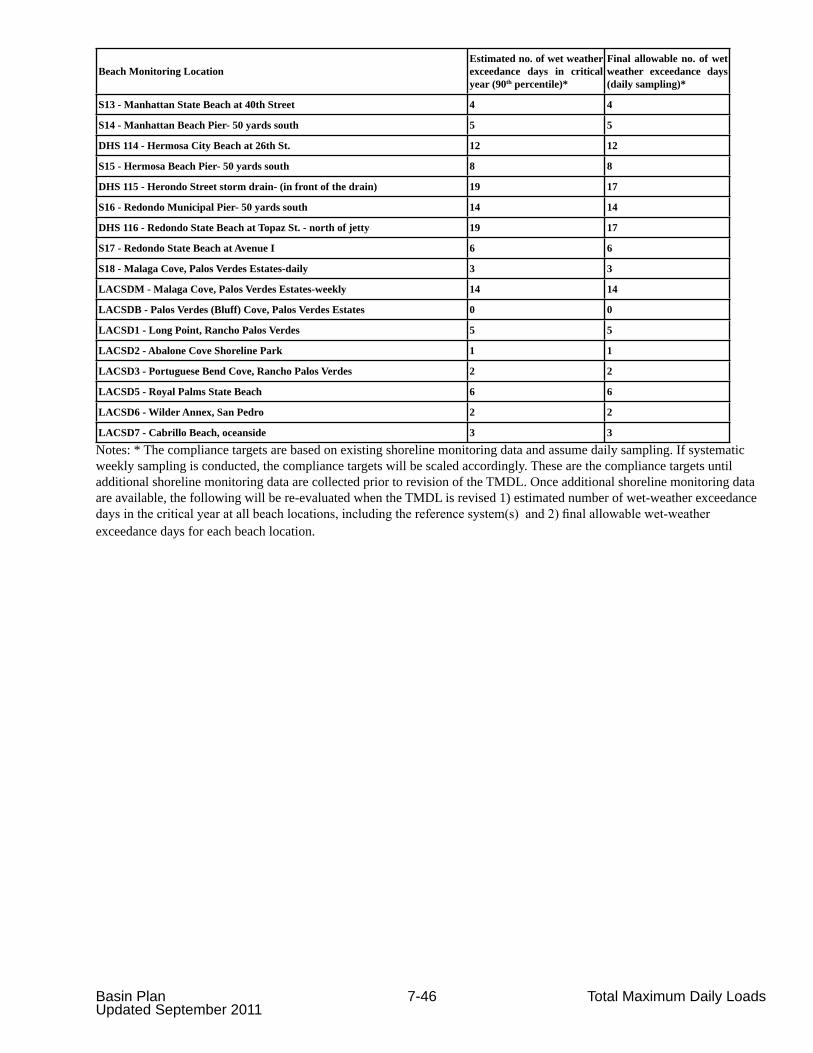
Basin Plan 7-46 Total Maximum Daily LoadsUpdated September 20��
Beach Monitoring LocationEstimated no. of wet weather exceedance days in critical year (90th percentile)*
Final allowable no. of wet weather exceedance days (daily sampling)*
S13 - Manhattan State Beach at 40th Street 4 4
S14 - Manhattan Beach Pier- 50 yards south 5 5
DHS 114 - Hermosa City Beach at 26th St. 12 12
S15 - Hermosa Beach Pier- 50 yards south 8 8
DHS 115 - Herondo Street storm drain- (in front of the drain) 19 17
S16 - Redondo Municipal Pier- 50 yards south 14 14
DHS 116 - Redondo State Beach at Topaz St. - north of jetty 19 17
S17 - Redondo State Beach at Avenue I 6 6
S18 - Malaga Cove, Palos Verdes Estates-daily 3 3
LACSDM - Malaga Cove, Palos Verdes Estates-weekly 14 14
LACSDB - Palos Verdes (Bluff) Cove, Palos Verdes Estates 0 0
LACSD1 - Long Point, Rancho Palos Verdes 5 5
LACSD2 - Abalone Cove Shoreline Park 1 1
LACSD3 - Portuguese Bend Cove, Rancho Palos Verdes 2 2
LACSD5 - Royal Palms State Beach 6 6
LACSD6 - Wilder Annex, San Pedro 2 2
LACSD7 - Cabrillo Beach, oceanside 3 3
Notes: * The compliance targets are based on existing shoreline monitoring data and assume daily sampling. If systematic weekly sampling is conducted, the compliance targets will be scaled accordingly. These are the compliance targets until additional shoreline monitoring data are collected prior to revision of the TMDL. Once additional shoreline monitoring data are available, the following will be re-evaluated when the TMDL is revised 1) estimated number of wet-weather exceedance daysinthecriticalyearatallbeachlocations,includingthereferencesystem(s)and2)finalallowablewet-weatherexceedance days for each beach location.

Bas
in P
lan
7
-47
Tota
l Max
imum
Dai
ly L
oads
Upd
ated
Sep
tem
ber 2
0��
Tabl
e 7-
4.6.
Inte
rim
Com
plia
nce
Targ
ets b
y Ju
risd
ictio
nal G
roup
Juri
sdic
tion
Gro
upPr
imar
y Ju
risd
ictio
nA
dditi
onal
Res
pons
ible
Ju
risd
ictio
ns &
Age
ncie
sSu
bwat
ersh
ed(s
)M
onito
ring
Site
(s)*
**
Inte
rim
Com
plia
nce
Targ
ets a
s Max
imum
A
llow
able
Exc
eeda
nce
Day
s dur
ing
Wet
W
eath
er*, **
10%
R
educ
tion
Mile
ston
e
25%
R
educ
tion
Mile
ston
e
50%
R
educ
tion
Mile
ston
e
1CountyofLosAngeles
Cal
trans
Mal
ibu
CityofL
osAngeles(Topanga
only
)C
alab
asas
(Top
anga
onl
y)
ArroyoSequit
DH
S 01
022
121
2197
Car
bon
Can
yon
none
Cor
ral C
anyo
nD
HS
005a
Enci
nal C
anyo
nD
HS
010a
#
Esco
ndid
o C
anyo
nno
ne
Las F
lore
s Can
yon
DH
S 00
1a
Latig
o C
anyo
nD
HS
005
LosA
lisosCanyon
none
Pena
Can
yon
none
PiedraGordaCanyon
DH
S 00
1
Ram
irez
Can
yon
DH
S 00
6
Sols
tice
Can
yon
none
Topa
nga
Can
yon
S2
Tran
cas C
anyo
nD
HS
008
Tuna
Can
yon
none
Zum
a C
anyo
nDHS007

Bas
in P
lan
7
-48
Tota
l Max
imum
Dai
ly L
oads
Upd
ated
Sep
tem
ber 2
0��
Juri
sdic
tion
Gro
upPr
imar
y Ju
risd
ictio
nA
dditi
onal
Res
pons
ible
Ju
risd
ictio
ns &
Age
ncie
sSu
bwat
ersh
ed(s
)M
onito
ring
Site
(s)*
**
Inte
rim
Com
plia
nce
Targ
ets a
s Max
imum
A
llow
able
Exc
eeda
nce
Day
s dur
ing
Wet
W
eath
er*, **
10%
R
educ
tion
Mile
ston
e
25%
R
educ
tion
Mile
ston
e
50%
R
educ
tion
Mile
ston
e
2CityofL
osAngeles
Cal
trans
CountyofLosAngeles
El S
egun
do (D
W o
nly)
Man
hatta
n B
each
(DW
onl
y)C
ulve
r City
(MD
R o
nly)
Sant
a M
onic
a
Cas
tlero
ckno
ne342
324
294
Doc
kwei
ler
S11,
DH
S 11
0, S
12,
DH
S 11
1, D
HS
112
Mar
ina
del R
eyDHS107,S8# ,
DH
S 10
8, D
HS
109
Pulg
a C
anyo
nS3
, DH
S 10
3
Sant
a M
onic
a C
anyo
nS4
Sant
a Yne
z C
anyo
nD
HS
101,
DH
S 10
2
3Sa
nta
Mon
ica
Cal
trans
CityofL
osAngeles
CountyofLosAngeles
Sant
a M
onic
aDHS104a,D
HS104,
DH
S 10
5, S
5, S
6, D
HS
106,DHS106a,S7
257
237
203
4M
alib
uC
altra
nsCountyofLosAngeles
Nic
hola
s Can
yon
DH
S 00
9#14
1414
5M
anha
ttan
Bea
chC
altra
nsEl
Seg
undo
Her
mos
a B
each
Red
ondo
Bea
ch
Her
mos
aS1
3# ,S14# ,
DHS114# ,
S15#
2929
29

Bas
in P
lan
7
-49
Tota
l Max
imum
Dai
ly L
oads
Upd
ated
Sep
tem
ber 2
0��
Juri
sdic
tion
Gro
upPr
imar
y Ju
risd
ictio
nA
dditi
onal
Res
pons
ible
Ju
risd
ictio
ns &
Age
ncie
sSu
bwat
ersh
ed(s
)M
onito
ring
Site
(s)*
**
Inte
rim
Com
plia
nce
Targ
ets a
s Max
imum
A
llow
able
Exc
eeda
nce
Day
s dur
ing
Wet
W
eath
er*, **
10%
R
educ
tion
Mile
ston
e
25%
R
educ
tion
Mile
ston
e
50%
R
educ
tion
Mile
ston
e
6R
edon
do B
each
Cal
trans
Her
mos
a B
each
Man
hatta
n B
each
Torr
ance
CountyofLosAngeles
Red
ondo
DH
S 11
5, S
16# ,
DH
S 116,S17
#58
5756
7R
anch
o Pa
los V
erde
sC
altra
nsCityofL
osAngeles
Palo
s Ver
des E
stat
esR
edon
do B
each
Rol
ling
Hill
sR
ollin
g H
ills E
stat
esTo
rran
ceCountyofLosAngeles
Palo
s Ver
des P
enin
sula
S18# ,
LACSD
M# ,
LACSD
B# ,LA
CSD
1# , LA
CSD
2# ,LA
CSD
3# , LA
CSD
5# ,LA
CSD
6# , LA
CSD
7#
3636
36
Not
es: *
Inte
rim m
ilest
ones
will
be
re-c
alcu
late
d du
ring
the
revi
sion
of t
he T
MD
L ba
sed
on sh
orel
ine
mon
itorin
g da
ta c
olle
cted
from
the
wav
e w
ash
and
a re
-eva
luat
ion
of th
e m
ost a
ppro
pria
te re
fere
nce
syst
em a
nd re
fere
nce
year
. Fur
ther
mor
e, if
an
inte
grat
ed w
ater
reso
urce
s app
roac
h is
pur
sued
, as d
emon
stra
ted
by th
e im
plem
enta
tion
plan
s to
be su
bmitt
ed to
the
Reg
iona
l Boa
rd b
y th
e pr
imar
y ju
risdi
ctio
ns w
ithin
two
year
s of t
he e
ffect
ive
date
of t
he T
MD
L, th
e in
terim
mile
ston
es w
ill b
e re
-eva
luat
ed
on th
e ba
sis o
f the
impl
emen
tatio
n pl
an, c
onsi
derin
g pl
anni
ng, e
ngin
eerin
g an
d co
nstru
ctio
n ta
sks.
**In
terim
mile
ston
es fo
r the
Mal
ibu
and
Bal
lona
shor
elin
e m
onito
ring
locationswillbeidentifiedinsu
bsequentbacteriaTMDLstobedevelopedforthesetw
owatersheds.***M
onitoringsitesarethoselocationscurrentlymonitoredby
theCityofL
osAngeles,C
ountySanitationDistrictso
fLosAngelesCounty,andtheLosA
ngelesCountyDepartmentofH
ealthServicesatthetimeofadoptionbythe
Reg
iona
l Boa
rd. T
his l
ist d
oes n
ot p
recl
ude
the
esta
blis
hmen
t of a
dditi
onal
mon
itorin
g st
atio
ns. F
or th
ose
subw
ater
shed
s with
out a
n ex
istin
g sh
orel
ine
mon
itorin
g si
te,
responsiblejurisdictionsandagenciesm
ustestablishashorelinemonitoringsiteifthereismeasurableflowfrom
acreekorpubliclyownedstormdraintothebeachduring
dry
wea
ther
. # F
or th
ose
beac
h m
onito
ring
loca
tions
subj
ect t
o th
e an
tideg
rada
tion
prov
isio
n, th
ere
shal
l be
no in
crea
se in
exc
eeda
nce
days
dur
ing
the
impl
emen
tatio
n periodabovethatestimatedforthebeachmonitoringlocationinthecriticalyearasidentifiedinTable7-4.5.
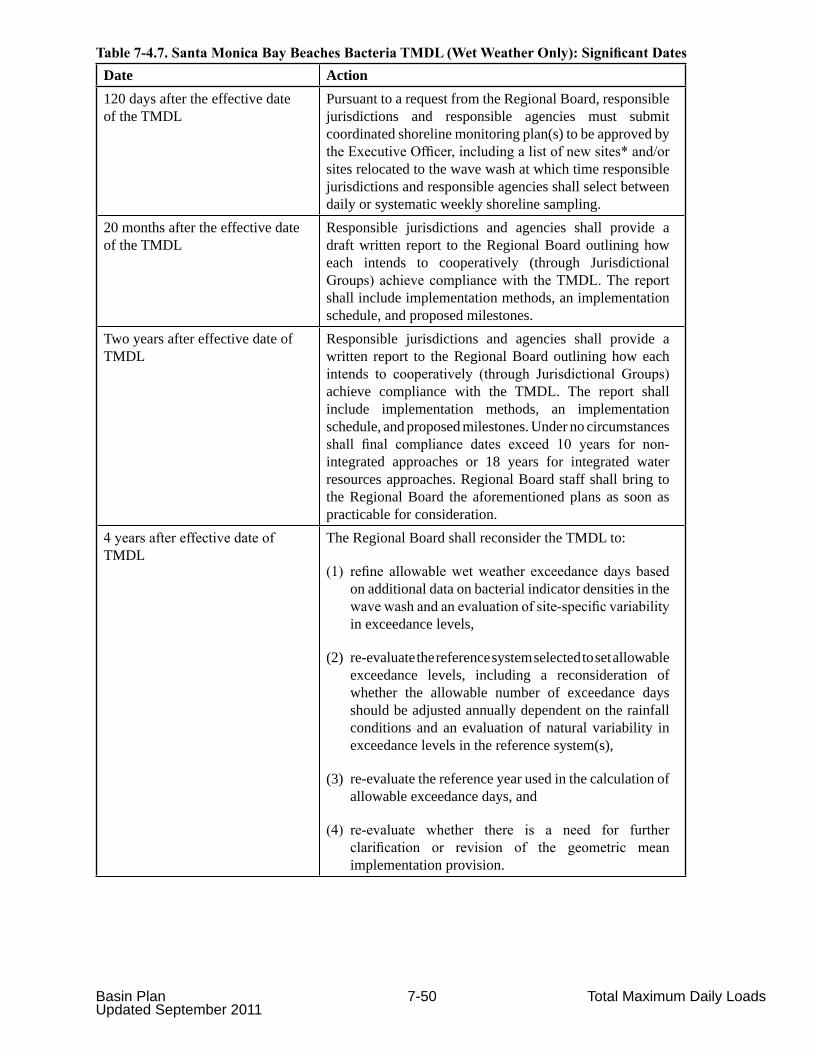
Basin Plan 7-50 Total Maximum Daily LoadsUpdated September 20��
Table 7-4.7. Santa Monica Bay Beaches Bacteria TMDL (Wet Weather Only): Significant DatesDate Action120 days after the effective date of the TMDL
Pursuant to a request from the Regional Board, responsible jurisdictions and responsible agencies must submit coordinated shoreline monitoring plan(s) to be approved by theExecutiveOfficer,includingalistofnewsites*and/orsites relocated to the wave wash at which time responsible jurisdictions and responsible agencies shall select between daily or systematic weekly shoreline sampling.
20 months after the effective date of the TMDL
Responsible jurisdictions and agencies shall provide a draft written report to the Regional Board outlining how each intends to cooperatively (through Jurisdictional Groups)achievecompliancewith theTMDL.The reportshall include implementation methods, an implementation schedule, and proposed milestones.
Two years after effective date of TMDL
Responsible jurisdictions and agencies shall provide a written report to the Regional Board outlining how each intends to cooperatively (through Jurisdictional Groups)achieve compliance with the TMDL. The report shall include implementation methods, an implementation schedule, and proposed milestones. Under no circumstances shall final compliance dates exceed 10 years for non-integrated approaches or 18 years for integrated water resources approaches. Regional Board staff shall bring to the Regional Board the aforementioned plans as soon as practicable for consideration.
4yearsaftereffectivedateofTMDL
The Regional Board shall reconsider the TMDL to:
(1) refine allowablewetweather exceedance days basedon additional data on bacterial indicator densities in the wavewashandanevaluationofsite-specificvariabilityin exceedance levels,
(2) re-evaluate the reference system selected to set allowable exceedance levels, including a reconsideration of whether the allowable number of exceedance days should be adjusted annually dependent on the rainfall conditions and an evaluation of natural variability in exceedance levels in the reference system(s),
(3) re-evaluate the reference year used in the calculation of allowable exceedance days, and
(4) re-evaluate whether there is a need for furtherclarification or revision of the geometric meanimplementation provision.

Basin Plan 7-5� Total Maximum Daily LoadsUpdated September 20��
Date ActionSignificant Dates for Responsible Jurisdictions and Agencies Not Pursuing an Integrated
Water Resources Approach6 years after effective date of the TMDL
Each defined jurisdictional group must achieve a 25%cumulative percentage reduction from the total exceedance-day reductions required for that jurisdictional group as identifiedinTable7-4.6.
8 years after effective date of the TMDL
Each defined jurisdictional group must achieve a 50%cumulative percentage reduction from the total exceedance-day reductions required for that jurisdictional group as identifiedinTable7-4.6.
10 years after effective date of the TMDL
Final implementation targets in terms of allowable wet-weather exceedance days must be achieved at each individualbeachas identified inTable7-4.5. Inaddition,the geometric mean targets must be achieved for each individual beach location.
Significant Dates for Responsible Jurisdictions and Agencies Pursuing an Integrated Water Resources Approach to Implementation
6 years after effective date of the TMDL
Each defined jurisdictional group must achieve a 10%cumulative percentage reduction from the total exceedance-day reductions required for that jurisdictional group as identifiedinTable7-4.6.
10 years after effective date of the TMDL
Each defined jurisdictional group must achieve a 25%cumulative percentage reduction from the total exceedance-day reductions required for that jurisdictional group as identifiedinTable7-4.6.
15 years after effective date of the TMDL
Each defined jurisdictional group must achieve a 50%cumulative percentage reduction from the total exceedance-day reductions required for that jurisdictional group as identifiedinTable7-4.6.
18 years after effective date of the TMDL
Final implementation targets in terms of allowable wet-weather exceedance days must be achieved at each individualbeachas identified inTable7-4.5. Inaddition,the geometric mean targets must be achieved for each individual beach location.
Notes: *For those subwatersheds without an existing shoreline monitoring site, responsible jurisdictions and agencies must establishashorelinemonitoringsiteifthereismeasurableflowfromacreekorpubliclyownedstormdraintothebeachduringdry weather.

Basin Plan 7-52 Total Maximum Daily LoadsUpdated September 20��

Basin Plan 7-5� Total Maximum Daily LoadsUpdated September 20��
7-5 Marina del Rey Harbor Mothers’ Beach and Back Basins Bacteria TMDL
This TMDL was adopted by: TheRegionalWaterQualityControlBoardonAugust7,2003.
This TMDL was approved by: The State Water Resources Control Board on November 19, 2003. TheOfficeofAdministrativeLawonJanuary30,2004. TheU.S.EnvironmentalProtectionAgencyonMarch18,2004.
TheeffectivedateofthisTMDLis:March18,2004
The following table includes the elements of this TMDL.
Table 7-5.1. Marina del Rey Harbor Mothers’ Beach and Back Basins Bacteria TMDL: ElementsElement Key Findings and Regulatory ProvisionsProblem Statement Elevated bacterial indicator densities are causing impairment of the
watercontactrecreation(REC-1)beneficialuseatMarinadelReyHarbor(MdRH)Mothers’Beachandbackbasins.Swimminginmarine waters with elevated bacterial indicator densities has long been associatedwithadversehealtheffects.Specifically,localandnationalepidemiological studies compel the conclusion that there is a causal relationship between adverse health effects and recreational water quality, as measured by bacterial indicator densities.
Numeric Target (Interpretation of the numeric water quality objective, used to calculate the waste load allocations)
The TMDL has a multi-part numeric target based on the bacteriological water quality objectives for marine water to protect the water contact recreation use. These targets are the most appropriate indicators of public health risk in recreational waters.
These bacteriological objectives are set forth in Chapter 3 of the Basin Plan.1 The objectives are based on four bacterial indicators and include both geometric mean limits and single sample limits. The Basin Plan objectives that serve as the numeric targets for this TMDL are:1.Rolling30-dayGeometricMeanLimitsa. Total coliform density shall not exceed 1,000/100 ml.b. Fecal coliform density shall not exceed 200/100 ml.c. Enterococcus density shall not exceed 35/100 ml.
2. Single Sample Limitsa. Total coliform density shall not exceed 10,000/100 ml.b. Fecalcoliformdensityshallnotexceed400/100ml.c. Enterococcusdensityshallnotexceed104/100ml.d. Total coliform density shall not exceed 1,000/100 ml, if the
ratio of fecal-to-total coliform exceeds 0.1.

Basin Plan 7-54 Total Maximum Daily LoadsUpdated September 20��
Element Key Findings and Regulatory ProvisionsNumeric Target (continued)(Interpretation of the numeric water quality objective, used to calculate the waste load allocations)
These objectives are generally based on an acceptable health risk for marine recreational waters of 19 illnesses per 1,000 exposed individualsassetbytheUSEPA(USEPA,1986).Thetargetsapplythroughouttheyear.Thefinalcompliancepointforthetargetsisthepointatwhichtheeffluentfromastormdraininitiallymixeswiththe receiving water where there is a freshwater outlet (i.e., publicly-owned storm drain) to the beach, or at ankle depth at beaches without a freshwater outlet, and at surface and depth throughout the Harbor. For Mothers’Beachthetargetswillapplyatexistingornewmonitoringsites, with samples taken at ankle depth. For Basins D, E, and F the targets will also apply at existing or new monitoring sites with samples collected at surface and at depth.
Implementation of the above bacteria objectives and the associated TMDL numeric targets is achieved using a ‘reference system/anti-degradationapproach’ratherthanthealternative‘naturalsourcesexclusionapproachsubjecttoantidegradationpolicies’orstrictapplicationofthesinglesampleobjectives.AsrequiredbytheCWAandPorter-CologneWaterQualityControlAct,BasinPlansincludebeneficialusesofwaters,waterqualityobjectivestoprotectthoseuses, an anti-degradation policy, collectively referred to as water quality standards, and other plans and policies necessary to implement water quality standards. This TMDL and its associated waste load allocations, which shall be incorporated into relevant permits, and loadallocationsarethevehiclesforimplementationoftheRegion’sstandards.
The‘referencesystem/anti-degradationapproach’meansthatonthebasis of historical exceedance levels at existing monitoring locations, including a local reference beach within Santa Monica Bay, a certain number of daily exceedances of the single sample bacteria objectives are permitted. The allowable number of exceedance days is set such that (1) bacteriological water quality at any site is at least as good as at a designated reference site within the watershed and (2) there is no degradation of existing bacteriological water quality. This approach recognizes that there are natural sources of bacteria that may cause or contribute to exceedances of the single sample objectives and that it is not the intent of the Regional Board to require treatment or diversion of natural coastal creeks or to require treatment of natural sources of bacteria from undeveloped areas.
The geometric mean targets may not be exceeded at any time. The rolling 30-day geometric means will be calculated on each day. If weekly sampling is conducted, the weekly sample result will be assigned to the remaining days of the week in order to calculate the daily rolling 30-day geometric mean. For the single sample targets, each existing monitoring site is assigned an allowable number of exceedancedaysforthreetimeperiods(1)summerdry-weather(April1 to October 31), (2) winter dry-weather (November 1 to March 31), and(3)wet-weather(definedasdayswith0.1inchofrainorgreaterand the three days following the rain event.)

Basin Plan 7-55 Total Maximum Daily LoadsUpdated September 20��
Element Key Findings and Regulatory ProvisionsSource Analysis Dry-weather urban runoff and storm water conveyed by storm drains
are the primary sources of elevated bacterial indicator densities to MdRHMothers’Beachandbackbasinsduringdryandwet-weather.AsofDecember2002,thereweresevendischargerslocatedwithinthe Marina del Rey watershed. These dischargers were issued general NPDES permits, general industrial and/or general construction storm water permits. The bacteria loads associated with these discharges are largely unknown, since most do not monitor for bacteria. However, thesedischargesarenotexpectedtobeasignificantsourceofbacteria.PotentialnonpointsourcesofbacterialcontaminationatMothers’Beach and the back basins of MdRH include marina activities such as waste disposal from boats, boat deck and slip washing, swimmer “wash-off”, restaurant washouts and natural sources from birds, waterfowl and other wildlife. The bacteria loads associated with these nonpoint sources are unknown.
Loading Capacity Studies show that bacterial degradation and dilution during transport fromthewatershedtothereceivingwaterdonotsignificantlyaffectbacterialindicatordensities.Therefore,theloadingcapacityisdefinedin terms of bacterial indicator densities, which is the most appropriate for addressing public health risk, and is equivalent to the numeric targets,listedabove.Asthenumerictargetsmustbemetatthepointwheretheeffluentfromstormdrainsinitiallymixeswiththereceivingwater and back basins throughout the day, no degradation or dilution allowance is provided.
Waste Load Allocations (for point sources)
TheLosAngelesCountyMS4andCalTransstormwaterpermitteesandco-permitteesareassignedwasteloadallocations(WLAs)expressed as the number of daily or weekly sample days that may exceedthesinglesampletargetsidentifiedunder“NumericTarget”ata monitoring site. Waste load allocations are expressed as allowable exceedance days because the bacterial density and frequency of single sample exceedances are the most relevant to public health protection.
The allowable number of exceedance days for a monitoring site for each time period is based on the lesser of two criteria (1) exceedance days in the designated reference system and (2) exceedance days based on historical bacteriological data at the monitoring site. This ensures that bacteriological water quality is at least as good as that of a largely undeveloped system and that there is no degradation of existing water quality.
For each monitoring site, allowable exceedance days are set on an annual basis as well as for three time periods. These three periods are:1. summerdry-weather(April1toOctober31)2. winter dry-weather (November 1 to March 31) 3. wet-weatherdays(definedasdaysof0.1inchofrainormoreplus
three days following the rain event).
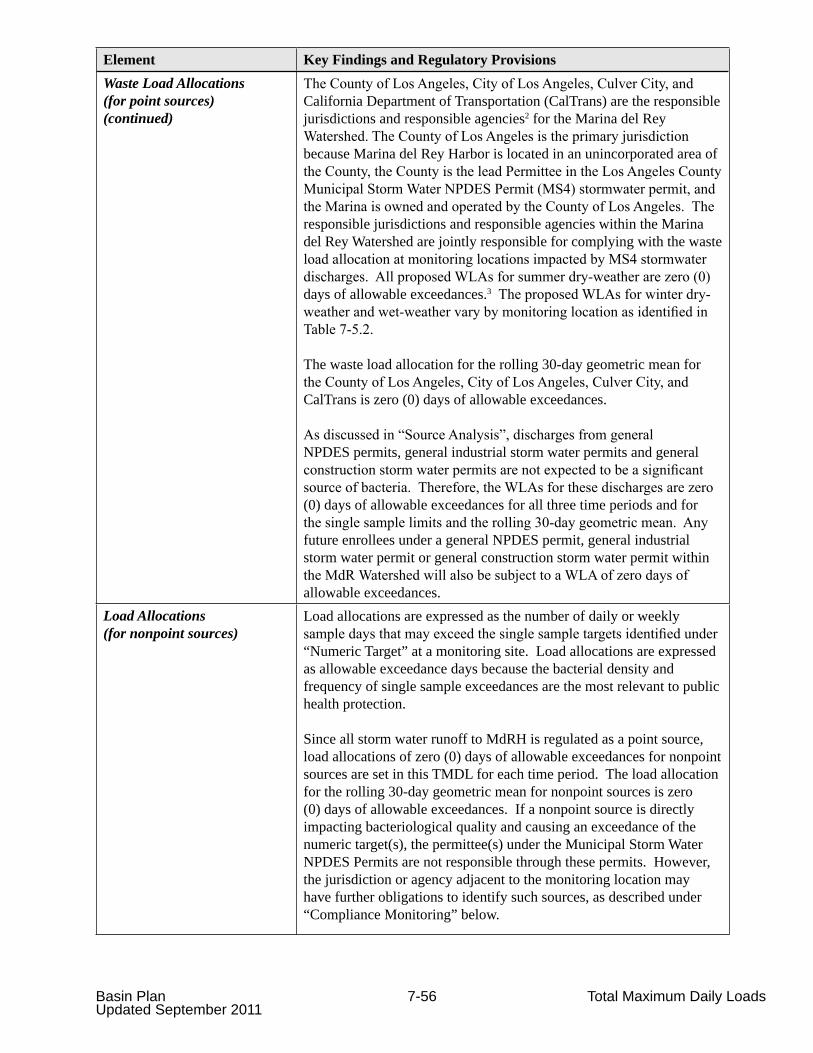
Basin Plan 7-56 Total Maximum Daily LoadsUpdated September 20��
Element Key Findings and Regulatory ProvisionsWaste Load Allocations (for point sources)(continued)
TheCountyofLosAngeles,CityofLosAngeles,CulverCity,andCalifornia Department of Transportation (CalTrans) are the responsible jurisdictions and responsible agencies2 for the Marina del Rey Watershed.TheCountyofLosAngelesistheprimaryjurisdictionbecause Marina del Rey Harbor is located in an unincorporated area of theCounty,theCountyistheleadPermitteeintheLosAngelesCountyMunicipalStormWaterNPDESPermit(MS4)stormwaterpermit,andtheMarinaisownedandoperatedbytheCountyofLosAngeles.Theresponsible jurisdictions and responsible agencies within the Marina del Rey Watershed are jointly responsible for complying with the waste loadallocationatmonitoringlocationsimpactedbyMS4stormwaterdischarges.AllproposedWLAsforsummerdry-weatherarezero(0)days of allowable exceedances.3TheproposedWLAsforwinterdry-weatherandwet-weathervarybymonitoringlocationasidentifiedinTable7-5.2.
The waste load allocation for the rolling 30-day geometric mean for theCountyofLosAngeles,CityofLosAngeles,CulverCity,andCalTrans is zero (0) days of allowable exceedances.
Asdiscussedin“SourceAnalysis”,dischargesfromgeneralNPDES permits, general industrial storm water permits and general constructionstormwaterpermitsarenotexpectedtobeasignificantsourceofbacteria.Therefore,theWLAsforthesedischargesarezero(0) days of allowable exceedances for all three time periods and for thesinglesamplelimitsandtherolling30-daygeometricmean.Anyfuture enrollees under a general NPDES permit, general industrial storm water permit or general construction storm water permit within theMdRWatershedwillalsobesubjecttoaWLAofzerodaysofallowable exceedances.
Load Allocations (for nonpoint sources)
Load allocations are expressed as the number of daily or weekly sampledaysthatmayexceedthesinglesampletargetsidentifiedunder“Numeric Target” at a monitoring site. Load allocations are expressed as allowable exceedance days because the bacterial density and frequency of single sample exceedances are the most relevant to public health protection.
Since all storm water runoff to MdRH is regulated as a point source, load allocations of zero (0) days of allowable exceedances for nonpoint sources are set in this TMDL for each time period. The load allocation for the rolling 30-day geometric mean for nonpoint sources is zero (0) days of allowable exceedances. If a nonpoint source is directly impacting bacteriological quality and causing an exceedance of the numeric target(s), the permittee(s) under the Municipal Storm Water NPDES Permits are not responsible through these permits. However, the jurisdiction or agency adjacent to the monitoring location may have further obligations to identify such sources, as described under “Compliance Monitoring” below.

Basin Plan 7-57 Total Maximum Daily LoadsUpdated September 20��
Element Key Findings and Regulatory ProvisionsImplementation The regulatory mechanisms used to implement the TMDL will include
theLosAngelesCountyMunicipalStormWaterNPDESPermit(MS4),theCalTransStormWaterPermit,generalNPDESpermits,general industrial storm water permits, general construction storm water permits, and the authority contained in Sections 13263 and 13267oftheWaterCode.EachNPDESpermitassignedaWLAshallbe reopened or amended at reissuance, in accordance with applicable laws,toincorporatetheapplicableWLAsasapermitrequirement.Load allocations for nonpoint sources will be implemented within the context of this TMDL.
This TMDL will be implemented in three phases over a ten-year period (seeTable7-5.3),unlessanIntegratedWaterResourcesApproachis implemented (in which case compliance must be achieved in the shortest time possible but not to exceed 18 years from the effective date of the Santa Monica Bay Beaches Bacteria TMDL). Within three years of the effective date of the TMDL, there shall be no allowable exceedances of the single sample limits at any location during summer dry-weather(April1toOctober31)orwinterdry-weather(November1 to March 31) and the rolling 30-day geometric mean targets must beachieved.TheExecutiveOfficeroftheRegionalBoardmayextendthecompliancedatenomorethanoneyearifhefindsthatthereisinsufficientcapacityinthesewerlinebetweenMarinadelReyand the Hyperion Treatment Plant. Within ten years of the effective date of the TMDL, compliance with the allowable number of wet-weather exceedance days and rolling 30-day geometric mean targets mustbeachieved,unlessanIntegratedWaterResourcesApproachis implemented (in which case compliance must be achieved in the shortest time possible but not to exceed 18 years from the effective date of the Santa Monica Bay Beaches Bacteria TMDL).
For those monitoring locations subject to the antidegradation provision, there shall be no increase in exceedance days during the implementation period above the estimated days for the monitoring locationinthecriticalyearasidentifiedinTable7-5.2.
The responsible jurisdictions and the responsible agencies must submit areporttotheExecutiveOfficerbyJuly30,2005(seeTable7-5.3)describing how they intend to comply with the dry-weather and wet-weatherWLAs.Astheprimaryjurisdiction,theCountyofLosAngelesis responsible for submitting the implementation plan report described above.Inaddition,theCountyofLosAngelesDepartmentofBeachesand Harbor must submit a report detailing its efforts to prohibit dischargesfromboatsintheHarbor(seeTable7-5.3).

Basin Plan 7-58 Total Maximum Daily LoadsUpdated September 20��
Element Key Findings and Regulatory ProvisionsImplementation (continued) The Marina del Rey Harbor jurisdictional unit may change its primary
jurisdiction by submitting a joint, written request, submitted by the current primary jurisdiction and the proposed primary jurisdiction, totheExecutiveOfficerrequestingreassignmentofprimaryresponsibility.
The Regional Board intends to reconsider this TMDL, consistent with the scheduled reconsideraton of the Santa Monica Bay (SMB) beaches TMDLs. The SMB beaches TMDLs are scheduled to be reconsidered in four years to re-evaluate the allowable winter dry-weather and wet-weather exceedance days based on additional data on bacterial indicator densities in the wave wash; to re-evaluate the reference system selected to set allowable exceedance levels; to re-evaluate the reference year used in the calculation of allowable exceedance days, and to re-evaluate the need for revision of the geometric mean implementation provision.
The Regional Board intends to conduct a similar review of this TMDLwithin4yearsaftertheeffectivedate.Inaddition,ifasuitablereference watershed that is representative of an enclosed harbor has not been found by this time, the Regional Board may consider implementing a ‘natural source exclusion approach subject to antidegradationpolicies’totheMarinadelReyHarborinlieuofthe‘referencewatershed/antidegradationapproach’.
Margin of Safety Amarginofsafetyhasbeenimplicitlyincludedthroughseveralconservative assumptions, such as the assumption that no dilution takesplacebetweenthestormdrainandwheretheeffluentinitiallymixes with the receiving water, and that bacterial degradation rates are not fast enough to affect bacteria densities in the receiving water. In addition, an explicit margin of safety has been incorporated, as the load allocations will allow exceedances of the single sample targets no more than 5% of the time on an annual basis, based on the cumulative allocations proposed for dry and wet weather. Currently, the Regional Board concludes that there is water quality impairment if more than 10% of samples at a site exceed the single sample bacteria objectives annually.
Seasonal Variations and Critical Conditions
Seasonal variations are addressed by developing separate waste load allocations for three time periods (summer dry-weather, winter-dry weather, and wet-weather) based on public health concerns and observed natural background levels of exceedance of bacterial indicators.
The critical condition for bacteria loading is during wet weather, when historic monitoring data for MdRH and the reference beach indicate greater exceedance probabilities of the single sample bacteria objectives then during dry-weather.

Basin Plan 7-59 Total Maximum Daily LoadsUpdated September 20��
Element Key Findings and Regulatory ProvisionsSeasonal Variations and Critical Conditions (continued)
Tomorespecificallyidentifyacriticalconditionwithinwet-weather,inordertosettheallowableexceedancedaysshowninTable7-5.2,the 90thpercentile‘stormyear’4 in terms of wet days5 is used as the reference year. Selecting the 90th percentile year avoids a situation where the reference system is frequently out of compliance. It is expected that because responsible jurisdictions and agencies will be planningforthis‘worst-case’scenario,therewillbefewerexceedancedays than the maximum allowed in drier years. Conversely, in the 10% of wetter years, it is expected that there may be more than the allowable number of exceedance days.
Compliance Monitoring Responsible jurisdictions and agencies shall conduct daily or systematic weekly sampling at the initial point of mixing with the receiving water at all major drains6, at existing monitoring stations and at other designated monitoring stations to determine compliance.7 ForMothers’Beachthetargetswillalsoapplyatexistingornewmonitoring sites, with samples taken at ankle depth. For Basins D, E, and F the targets will also apply at existing or new monitoring sites with samples collected at surface and at depth. Samples collected at ankledepthshallbetakenonanincomingwave.Atlocationswherethere is a freshwater outlet, during wet weather, samples should be taken as close as possible to the initial point of mixing with the receiving water, and no further away than 10 meters down current of the storm drain or outlet.8Atlocationswherethereisafreshwateroutlet,samplesshallbetakenwhenthefreshwateroutletisflowinginto the surf zone.9
If the number of exceedance days is greater than the allowable number of exceedance days, the responsible jurisdictions and agencies shall be considered out of compliance with the TMDL. Responsible jurisdictions or agencies shall not be deemed out of compliance with the TMDL if the investigation described in the paragraph below demonstrates that bacterial sources originating within the jurisdiction of the responsible agency have not caused or contributed to the exceedance.
If a single sample shows the discharge or contributing area to be out of compliance, the Regional Board may require, through permit requirementsortheauthoritycontainedinWaterCodeSection13267,dailysamplingwheretheeffluentfromthestormdraininitiallymixeswith the receiving water or at the existing monitoring location (if it is not already) until all single sample events meet bacteria water quality objectives. Furthermore, if a location is out-of-compliance as determined in the previous paragraph, the Regional Board shall require responsible agencies to initiate an investigation, which at a minimum shallincludedailysamplingwheretheeffluentfromthestormdraininitially mixes with the receiving water or at the existing monitoring location until all single sample events meet bacteria water quality objectives.

Basin Plan 7-60 Total Maximum Daily LoadsUpdated September 20��
Element Key Findings and Regulatory ProvisionsCompliance Monitoring(continued)
If bacteriological water quality objectives are exceeded in any three weeks of a four-week period when weekly sampling is performed, or, forareaswheretestingisdonemorethanonceaweek,75%oftestingdays produce an exceedance of bacteria water quality objectives, the responsible agencies shall conduct a source investigation of the subwatershed(s) pursuant to protocols established under Water CodeSection13178.Responsiblejurisdictionsmaywishtoconductcompliance monitoring at key jurisdictional boundaries as part of this effort. If a location without a freshwater outlet is out-of-compliance or if the outlet is diverted or being treated, the adjacent municipality, County agency(s), or State or federal agency(s) shall be responsible forconductingtheinvestigationandshallsubmititsfindingstotheRegional Board to facilitate the Regional Board exercising further authority to regulate the source of the exceedance in conformance with the Water Code.
In addition, the MdR responsible jurisdictions and responsible agencies are required to conduct a study to determine the relative bacterial loading from sources including but not limited to storm drains, boats, birds, and other nonpoint sources.. Once this study is completed in threeyears,theRegionalBoardwilladjusttheWLAs,ifappropriate,based on the study, during the scheduled review of this TMDL.
Note: The complete staff report for the TMDL is available for review upon request.
1 The bacteriological objectives were revised by a Basin Plan amendment adopted by the Regional Board on October 25, 2001, and subsequentlyapprovedbytheStateWaterResourcesControlBoard,theOfficeofAdministrativeLawandfinallybyU.S.EPAonSeptember 25, 2002.2ForthepurposesofthisTMDL,“responsiblejurisdictionsandresponsibleagencies”aredefinedas(1)localagenciesthatarepermitteesorco-permitteesonamunicipalstormwaterpermit,(2)localorstateagenciesthathavejurisdictionoverMothers’Beachorthebackbasins of MdRH, and (3) the California Department of Transportation pursuant to its storm water permit.3Inordertofullyprotectpublichealth,noexceedancesarepermittedatanymonitoringlocationduringsummerdry-weather(April1to October 31). In addition to being consistent with the two criteria, waste load allocations of zero (0) days of allowable exceedances are further supported by the fact that the California Department of Health Services has established minimum protective bacteriological standards–thesameasthenumerictargetsinthisTMDL–which,whenexceededduringtheperiodApril1toOctober31,resultinpostingabeachwithahealthhazardwarning(CaliforniaCodeofRegulations,Title17,Section7958).4ForpurposesofthisTMDL,a‘stormyear’meansNovember1toOctober31.The90thpercentilestormyearwas1993with75wetdaysattheLAXmeteorologicalstation.5Awetdayisdefinedasadaywithrainfallof0.1inchormoreplusthe3daysfollowingtherainevent.6Majordrainsarethosethatarepubliclyownedandhavemeasurableflowtothebeachduringdryweather.7Thefrequencyofsampling(i.e.,dailyversusweekly)willbeatthediscretionoftheimplementingagencies.However,thenumberofsampledaysthatmayexceedtheobjectiveswillbescaledbysolvingforthevariable“X”inthefollowingequation:(Numberofwet-weatherdaysordry-weatherdaysin1993/365days=X/52weeks),wherethenumberofwet-weatherdaysanddry-weatherdaysarebasedonthehistoricalrainfallrecordattheLosAngelesInternationalAirportalsoknownas“LAX”.8 Safety considerations during wet weather may preclude taking a sample at the initial point of mixing with the receiving water.9Atsomefreshwateroutletsandstormdrains,duringhightideconditions,thetidepushesthefreshwaterdischargebackintothedrain.Asaresult,samplingundertheseconditionsisnotrepresentativeofwaterqualityconditionswhenthedrainisflowingintothesurfzone.Thetideheightatwhichthissituationoccurswillvarywiththesize,slopeandconfigurationofthedrainandthebeach.Responsibleagenciesmustensurethatsamplesarecollectedonlywhendrainsareflowingintothesurfzone,notwhenthedischargeispushedbackintothedrain. Responsible agencies must submit a coordinated monitoring plan within 120 days of the effective date of the TMDL, in which this assurance should be included.

Bas
in P
lan
7
-6�
Tota
l Max
imum
Dai
ly L
oads
Upd
ated
Sep
tem
ber 2
0��
Tabl
e 7-
5.2.
Mar
ina
del R
ey H
arbo
r M
othe
rs’ B
each
and
Bac
k B
asin
s Bac
teri
a T
MD
L: F
inal
Allo
wab
le E
xcee
danc
e
Day
s by
Sam
plin
g L
ocat
ion
Com
plia
nce
Dea
dlin
e3
year
s aft
er e
ffec
tive
date
13
year
s aft
er e
ffec
tive
date
110
yea
rs a
fter
eff
ectiv
e da
te2
Sum
mer
Dry
Wea
ther
^W
inte
r Dry
Wea
ther
^*
Wet
Wea
ther
^*
April1-O
ctober31
Nov
embe
r 1 –
Mar
ch 3
1N
ovem
ber 1
- O
ctob
er 3
1
Stat
ion
IDLo
catio
n N
ame
Dai
ly sa
mpl
ing
(No.
day
s)W
eekl
y sa
mpl
ing
(No.
day
s)D
aily
sam
plin
g (N
o. d
ays)
Wee
kly
sam
plin
g (N
o. d
ays)
Dai
ly sa
mpl
ing
(No.
day
s)W
eekl
y sa
mpl
ing
(No.
day
s)
HY
P (S
9)Mothers’B
each,atL
ifeguardTower
00
31
173
DH
S (1
09a)
Mothers’B
each,atPlaygroundArea
00
31
173
DH
S (1
09b)
Mothers’B
each,betweenLifeguardTowerandBoatD
ock
00
31
173
DH
S (1
09c)
LosA
ngelesCountyFireDock-endofm
ainchannel
00
31
173
DH
B (M
DR
-8)Mothers’B
each,nearfi
rstslipso
utsidesw
imarea
00
31
173
DH
B (M
DR
-18
)Mothers’B
each,20meterso
ffofthewheelchairramp
00
00
153
DH
B (M
DR
-19
)Mothers’B
each,endofw
heelchairramp
00
31
173
DH
B (M
DR
-9)
Bas
in F
, inn
erm
ost e
nd0
03
18
1
DH
B (M
DR
-11
)En
d of
Mai
n C
hann
el0
03
117
3
DH
B (M
DR
-10
)B
asin
E, n
ear c
ente
r of b
asin
00
31
173
DH
B (M
DR
-20
)B
asin
E, i
n fr
ont o
f Tid
egat
e fr
om O
xfor
d B
asin
00
31
173
Not
es: T
he n
umbe
r of a
llow
able
exc
eeda
nces
is b
ased
on
the
less
er o
f (1)
the
refe
renc
e sy
stem
or (
2) e
xist
ing
leve
ls o
f exc
eeda
nce
base
d on
his
toric
al m
onito
ring
data
.Theallowablenum
berofexceedancedaysduringwinterdry-weatheriscalculatedbasedonthe10thpercentilestormyearintermso
fdrydaysattheLAXmeteorologicalstation
Theallowablenum
berofexceedancedaysduringwet-weatheriscalculatedbasedonthe90thpercentilestormyearintermso
fwetdaysattheLAXmeteorologicalstation.
1 TheExecutiveOfficeroftheRegionalB
oardmayextendthecompliancedatebynomorethanoneyearifhefindsthatthereisinsufficientcapacityintheexistingsewerlinefrom
MarinadelR
eytotheHyperion
Tre
atm
ent P
lant
.2 IfanIntegratedWaterResourcesApproachisim
plem
ented,thecomplianceperiodmustbetheshortesttimepossiblebutnottoexceed18yearsfrom
theeffectivedateoftheSantaM
onicaBayBeachesBacteria
Wet
-Wea
ther
TM
DL.
^Adrydayisdefinedasanon-wetday.Awetdayisdefinedasadaywitha0.1-inchorm
oreofrainandthethreedaysfollowingtherainevent.
*ArevisionoftheTMDLisscheduledforfouryearsaftertheeffectivedateoftheSantaM
onicaBayBeachesTMDLsinordertore-evaluatetheallowableexceedancedaysduringwinterdry-weatherandwet-
wea
ther
bas
ed o
n ad
ditio
nal m
onito
ring
data
and
the
resu
lts o
f the
stud
y of
rela
tive
load
ing
from
sour
ces i
nclu
ding
but
not
lim
ited
to st
orm
dra
ins,
boat
s, bi
rds a
nd o
ther
non
poin
t sou
rces
.

Basin Plan 7-62 Total Maximum Daily LoadsUpdated September 20��
Table 7-5.3. Marina del Rey Harbor Mothers’ Beach and Back Basins Bacteria TMDL: Significant Dates
Date Action120 days after the effective date of the TMDL
Responsible jurisdictions and responsible agencies shall submit coordinated monitoring plan(s) to be approved by the Executive Officer.Themonitoringplansshallincludingalistofnewsites*and/orsitesrelocatedtoincludethepointwheretheeffluentfromthe storm drain initially mixes with the receiving water, at least threelocationsoffofMothers’Beach,andatleastonelocationineachoftheotherMarinadelReyBasins(i.e.,BasinsA,B,C,E,F,G,andH). The plan shall includetheresponsiblejurisdictions’andresponsibleagencies’recommendedsamplingfrequencyateachlocation.
TheLosAngelesCountyDepartmentofBeachesandHarborsshallprovide a written report to the Regional Board detailing efforts to control discharges from boats, including but not limited to the number of live-aboards and the number of pump-outs per month.
The responsible jurisdictions and the responsible agencies must identify and provide documentation on small drains discharging to Mothers’BeachandtheMarinadelReyHarbor.Documentationmust include a report of waste discharge where necessary.
March 30, 2005 (Draft Report)
July 30, 2005 (Final Report)
Responsible jurisdictions and responsible agencies shall provide a written report to the Regional Board outlining how each intends to cooperatively achieve compliance with the dry-weather and wet-weatherTMDLWasteLoadAllocations.Thereportshallinclude implementation methods, an implementation schedule, and proposed milestones.
3 years after effective date of the TMDL
Responsible jurisdictions and responsible agencies shall provide to the Regional Board results of the study conducted to determine the relative bacterial loading from sources including but not limited to storm drains, boats, birds and other nonpoint sources at the Oxford FloodControlBasin,Mothers’Beach,andtheHarbor
3 years after effective date of the TMDL
AchievecompliancewiththeallowableexceedancedaysassetforthinTable7-5.2androlling30-daygeometricmeantargetsduringsummerdry-weather(April1toOctober31)andwinterdryweather(November1toMarch31).TheExecutiveOfficeroftheRegional Board may extend the compliance date by no more than oneyearifhefindsthatthereisinsufficientcapacityintheexistingsewer line from Marina del Rey to the Hyperion Treatment Plant.
4yearsaftereffectivedateofthe TMDL
The Regional Board shall reconsider this TMDL to:
(1) refineallowablewinterdry-weatherandwet-weatherexceedance days based on additional data on bacterial indicatordensities,anevaluationofsite-specificvariabilityin exceedance levels, and the results of the study of relative bacterial loading from sources including but not limited to storm drains, boats, birds, and other nonpoint sources,

Basin Plan 7-6� Total Maximum Daily LoadsUpdated September 20��
Date Action4yearsaftereffectivedateofthe TMDL (continued)
(2) re-evaluate the reference system selected to set allowable exceedance levels, including a reconsideration of whether the allowable number of exceedance days should be adjusted annually dependent on the rainfall conditions and an evaluation of natural variability in exceedance levels in the reference system(s), and if an appropriate reference system cannot be identifiedforthisenclosedharbor,evaluateusingthe‘naturalsourcesexclusionapproachsubjecttoantidegradationpolicies’ratherthanthe‘referencesystem/antidegradation’approach,
(3) re-evaluate the reference year used in the calculation of allowable exceedance days, and
(4) re-evaluatewhetherthereisaneedforfurtherclarificationorrevision of the geometric mean implementation provision.
10 years after effective date of the TMDL or, if an Integrated WaterResourcesApproachisimplemented, in the shortest time possible but not to exceed 18 years from the effective date of the Santa Monica Bay Beaches Bacteria Wet-Weather TMDL
AchievecompliancewiththeallowableexceedancedaysassetforthinTable7-5.2androlling30-daygeometricmeantargetsduring wet-weather.
* For those areas of the marina without an existing monitoring site, responsible jurisdictions and responsible agencies must establishamonitoringsiteifthereismeasurableflowfromapubliclyownedstormdraintothebasinduringdryweather.

Basin Plan 7-64 Total Maximum Daily LoadsUpdated September 20��

Basin Plan 7-65 Total Maximum Daily LoadsUpdated September 20��
7-6 Upper Santa Clara River Chloride TMDL
ThisTMDLwasadoptedby:TheRegionalWaterQualityControlBoardonOctober24,2002.This TMDL was remanded by: The State Water Resources Control Board on February 19, 2003This TMDL was adopted by: The Regional Water Quality Control Board on July 10, 2003.
This TMDL was revised and adopted by: TheRegionalWaterQualityControlBoardonMay6,2004.This TMDL was approved by: TheStateWaterResourceControlBoardonJuly22,2004 TheOfficeofAdministrativeLawonNovember15,2004 TheU.S.EnvironmentalProtectionAgencyonApril28,2005
This TMDL was revised and adopted by: TheRegionalWaterQualityControlBoardonAugust3,2006.This TMDL was approved by: TheStateWaterResourceControlBoardonMay22,2007. TheOfficeofAdministrativeLawonJuly3,2007.
This TMDL was revised and adopted by: The Regional Water Quality Control Board on December 11, 2008.This TMDL was approved by: The State Water Resource Control Board on October 20, 2009. TheOfficeofAdministrativeLawonJanuary26,2010. TheU.S.EnvironmentalProtectionAgencyonApril6,2010.
TheeffectivedateofthisTMDLis:April6,2010.
Table 7-6.1. Upper Santa Clara River Chloride TMDL: Elements
ElementTable 7-6.1. Upper Santa Clara River Chloride TMDL: Elements
Santa Clara River ChlorideProblem Statement
Elevated chloride concentrations are causing impairments of the water quality objective inReach 5 (EPA303(d) listReach 7) andReach 6 (EPA303(d) listReach 8) of the Santa Clara River (SCR). These reaches are on the 1998 and 2002 CleanWaterAct(CWA)303(d)listsofimpairedwaterbodiesasimpairedduetochloride.Theobjectivesforthesereachesweresettoprotectallbeneficialuses;agriculturalbeneficialuseshavebeendetermined tobemost sensitive,andnotcurrentlyattainedat thedownstreamendofReach5(EPA303(d)listReach7)andReach6(EPA303(d)listReach8)intheUpperSantaClaraRiver(USCR).Irrigation of salt sensitive crops such as avocados, strawberries, and nursery crops with water containing elevated levels of chloride results in reduced crop yields. Chloride levels in groundwater in Piru Basin underlying the reach downstream of Reach 5 are also rising.
Numeric Target(Interpretation of the numeric water quality objective, used to calculate the load allocations)
Numerictargetsareequivalenttoconditionalsitespecificobjectives(SSOs)that are based on technical studies regarding chloride levels which protect salt sensitive crops and endangered and threatened species, chloride source identification,andthemagnitudeofassimilativecapacityintheupperreachesof the Santa Clara River and underlying groundwater basin. The TMDL special study,LiteratureReviewEvaluation,showsthatthemostsensitivebeneficialuses can be supported with rolling averaging periods as shown in the tables below.

Basin Plan 7-66 Total Maximum Daily LoadsUpdated September 20��
ElementTable 7-6.1. Upper Santa Clara River Chloride TMDL: Elements
Santa Clara River ChlorideNumeric Target (continued)(Interpretation of the numeric water quality objective, used to calculate the load allocations)
1. Conditional Surface Water SSOsTheconditionalSSOsforchlorideinthesurfacewaterofReaches4B,5,and6shall apply and supersede the existing water quality objectives of 100 mg/L only when chloride load reductions and/or chloride export projects are in operation by theSCVSDaccordingtotheimplementationsectioninTable7-6.1.ConditionalsurfacewaterSSOsforReaches4B,5,and6oftheSantaClaraRiverarelistedas follows:
Reach Conditional SSO for Chloride (mg/L)
Rolling Averaging Period
6 150 12-month5 150 12-month4B 117 3-month
4BCriticalConditions 130a 3-monthb
a. TheconditionalSSOforchlorideinReach4Bundercriticalconditionshall apply only if the following conditions and implementation requirements are met:
1. Water supply chloride concentrations measured in Castaic Lake are ≥80mg/L.
2. The Santa Clarita Valley Sanitation District (SCVSD) shall provide supplemental water to salt-sensitive agricultural uses that are irrigatedwithsurfacewaterduringperiodswhenReach4Bsurfacewaterexceeds117mg/L.
3. ByMay4,2020,the10-yearcumulativenetchlorideloadingabove117mg/L(CNCl117)
itoReach4BoftheSCR,calculatedannually,from the SCVSD Water Reclamation Plants (WRPs) shall be zero or less.
i CNCl117=Cl(Above117) – Cl(Below117) – Cl(Export Ews)
Where:Cl(Above117) =[WRPClLoad1/Reach4BClLoad2]*[Reach4BClLoad>117
3]Cl(Below117) =[WRPClLoad1/Reach4BClLoad2]*[Reach4BClLoad<=117
4]Cl(Export EWs) =ClLoadRemovedbyExtractionWells
1 WRP Cl Load is determined as the monthly average Cl concentration multiplied by themonthlyaverageflowmeasuredattheValenciaWRP.
2 Reach4BClLoadisdeterminedasthemonthlyaverageClconcentrationatSCVSDReceivingWaterStationRFmultipliedbythemonthlyaverageflowmeasuredatUSGSGaugingStation11109000(LasBrisasBridge).
3 Reach4BClLoad>117meansthecalculatedClloadtoReach4BwhenmonthlyaverageClconcentrationinReach4Bisabove117mg/L.
4Reach4BClLoad<=117meansthecalculatedClloadtoReach4BwhenmonthlyaverageClconcentrationinReach4Bisbeloworequalto117mg/L.

Basin Plan 7-67 Total Maximum Daily LoadsUpdated September 20��
ElementTable 7-6.1. Upper Santa Clara River Chloride TMDL: Elements
Santa Clara River ChlorideNumeric Target (continued)(Interpretation of the numeric water quality objective, used to calculate the load allocations)
4.ThechiefengineeroftheSCVSDsignsunderpenaltyofperjuryandsubmitstotheLosAngelesRegionalWaterQualityControlBoard(RegionalBoard)aletterdocumentingthefulfillmentofconditions1, 2, and 3.
b. The averaging period for the critical condition SSO may be reconsidered basedonresultsofchloridetrendmonitoringaftertheconditionalWLAsofthis TMDL are implemented.
2.ConditionalSSOsforGroundwater
Conditional groundwater SSOs are listed as follows:Groundwater Basin Conditional
Groundwater SSO for Chloride (mg/L)
Rolling Averaging Period
Santa Clara--Bouquet & San Francisquito Canyons
150 12-month
Castaic Valley 150 12-monthLower area east of Piru Creek a
150 12-month
a This objective only applies to the San Pedro formation. Existing objective of 200 mg/L applies to shallow alluvium layer above San Pedro formation.
The conditional SSOs for chloride in the groundwater in Santa Clara--Bouquet & San Francisquito Canyons, Castaic Valley and the lower area east of Piru Creek (San Pedro Formation) shall apply and supersede the existing groundwater quality objectives only when chloride load reductions and/or chloride export projects are in operation by the SCVSD according to the implementation section inTable7-6.1.
Source Analysis The principal source of chloride into Reaches 5 and 6 of the Santa Clara River is discharges from the Saugus WRP and Valencia WRP, which are estimated tocontribute70%ofthechlorideloadinReaches5and6.Thesesourcesofchloride accumulate and degrade groundwater in the lower area east of Piru Creek in the basin.
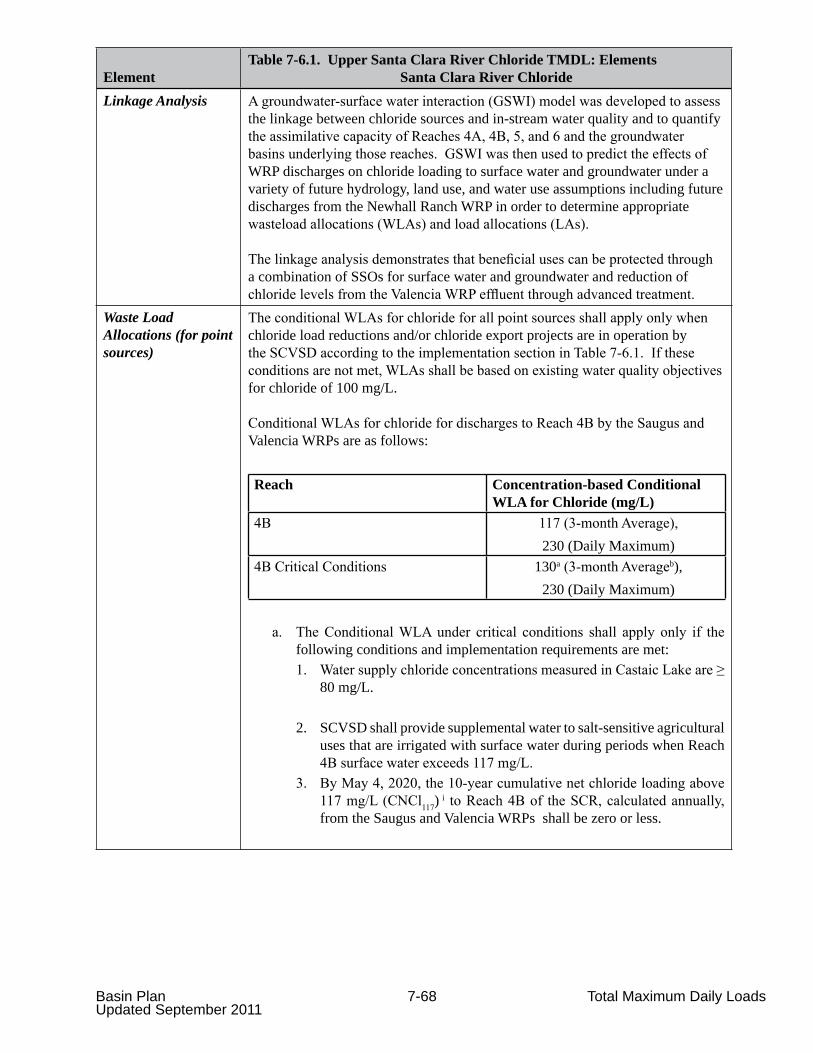
Basin Plan 7-68 Total Maximum Daily LoadsUpdated September 20��
ElementTable 7-6.1. Upper Santa Clara River Chloride TMDL: Elements
Santa Clara River ChlorideLinkage Analysis Agroundwater-surfacewaterinteraction(GSWI)modelwasdevelopedtoassess
the linkage between chloride sources and in-stream water quality and to quantify theassimilativecapacityofReaches4A,4B,5,and6andthegroundwaterbasinsunderlyingthosereaches.GSWIwasthenusedtopredicttheeffectsofWRP discharges on chloride loading to surface water and groundwater under a variety of future hydrology, land use, and water use assumptions including future discharges from the Newhall Ranch WRP in order to determine appropriate wasteloadallocations(WLAs)andloadallocations(LAs).
Thelinkageanalysisdemonstratesthatbeneficialusescanbeprotectedthrougha combination of SSOs for surface water and groundwater and reduction of chloridelevelsfromtheValenciaWRPeffluentthroughadvancedtreatment.
Waste Load Allocations (for point sources)
TheconditionalWLAsforchlorideforallpointsourcesshallapplyonlywhenchloride load reductions and/or chloride export projects are in operation by theSCVSDaccordingtotheimplementationsectioninTable7-6.1.Iftheseconditionsarenotmet,WLAsshallbebasedonexistingwaterqualityobjectivesfor chloride of 100 mg/L.
ConditionalWLAsforchloridefordischargestoReach4BbytheSaugusandValencia WRPs are as follows:
Reach Concentration-based Conditional WLA for Chloride (mg/L)
4B 117(3-monthAverage),230 (Daily Maximum)
4BCriticalConditions 130a(3-monthAverageb),230 (Daily Maximum)
a. TheConditionalWLAunder critical conditions shall apply only if thefollowing conditions and implementation requirements are met:1. WatersupplychlorideconcentrationsmeasuredinCastaicLakeare≥
80 mg/L.
2. SCVSD shall provide supplemental water to salt-sensitive agricultural uses that are irrigated with surface water during periods when Reach 4Bsurfacewaterexceeds117mg/L.
3. ByMay4,2020,the10-yearcumulativenetchlorideloadingabove117mg/L(CNCl117)
i toReach4Bof theSCR,calculatedannually,from the Saugus and Valencia WRPs shall be zero or less.

Basin Plan 7-69 Total Maximum Daily LoadsUpdated September 20��
ElementTable 7-6.1. Upper Santa Clara River Chloride TMDL: Elements
Santa Clara River ChlorideWaste Load Allocations (for point sources) (continued)
i CNCl117=Cl(Above117) – Cl(Below117) – Cl(Export Ews)
Where:
Cl(Above117) = [WRP Cl Load1/Reach 4B Cl Load2] * [Reach 4B ClLoad>117
3]
Cl(Below117) = [WRP Cl Load1/Reach 4B Cl Load2] * [Reach 4B ClLoad<=117
4]
Cl(Export EWs) =ClLoadRemovedbyExtractionWells1 WRP Cl Load is determined as the monthly average Cl concentration multiplied by themonthlyaverageflowmeasuredattheValenciaWRP.2 Reach4BClLoadisdeterminedasthemonthlyaverageClconcentrationatSCVSDReceivingWater StationRFmultiplied by themonthly average flowmeasured atUSGSGaugingStation11109000(LasBrisasBridge).3 Reach4BClLoad>117meansthecalculatedClloadtoReach4BwhenmonthlyaverageClconcentrationinReach4Bisabove117mg/L.4Reach4BClLoad<=117meansthecalculatedClloadtoReach4BwhenmonthlyaverageClconcentrationinReach4Bisbeloworequalto117mg/L.
4. ThechiefengineeroftheSCVSDsignsunderpenaltyofperjuryandsubmitstotheRegionalBoardaletterdocumentingthefulfillmentofconditions 1, 2, and 3.
b. TheaveragingperiodforthecriticalconditionWLAmaybereconsideredbasedonresultsofchloridetrendmonitoringaftertheconditionalWLAsof this TMDL are implemented.
DischargestoReaches5and6bytheSaugusandValenciaWRPswillhavefinalconcentration-based and mass-based conditionalWLAs for chloride based onconditional SSOs as follows:
WRP Concentration-based Conditional WLA for
Chloride (mg/L)
Mass-based Conditional WLA for Chloride
(pounds/day)Saugus 150(12-monthAverage),
230 (Daily Maximum)QDesign*150mg/L*8.34(12-monthAverage)
Valencia 150(12-monthAverage),230 (Daily Maximum)
QDesign*150mg/L*8.34–AFRO(12-monthAverage)
Where Qdesign is the design capacity of WRPs in units of million gallons per day (MGD),AFRO is the chloride mass loading adjustment factor for operation of reverse osmosis (RO) facilities, where:

Basin Plan 7-70 Total Maximum Daily LoadsUpdated September 20��
ElementTable 7-6.1. Upper Santa Clara River Chloride TMDL: Elements
Santa Clara River ChlorideWaste Load Allocations (for point sources)(continued)
IfROfacilitiesareoperatedat≥50%CapacityFactora in preceding 12 months
AFRO =0
IfROfacilitiesareoperatedat<50%CapacityFactorb in preceding 12 months
AFRO =(50%CapacityFactor–%ROCapacity)*ChlorideLoadROc
a CapacityFactorisbasedon3MGDofrecycledwatertreatedwithRO,90%ofthetime.b IfoperationofROfacilitiesat<50%ratedcapacityistheresultofconditionsthatareoutsidethecontrolofSCVSD,thenunderthediscretionoftheExecutiveOfficeroftheRegionalBoard,theAFRO may be set to 0.c ChlorideloadreductionisbasedonoperationofaROtreatmentplanttreating3MGDofrecycledwaterwithchlorideconcentrationof50mg/L+WaterSupplyChloride.Assumesoperational capacity factor of 90% and RO membrane chloride rejection rate of 95%. Determination of chloride load based on the following:
ChlorideLoadRO=90%x[(QRO x CWRP x8.34)xr]x(30Days/Month)
Where: QRO=3MGDofrecycledwatertreatedwithROCWRP=Chlorideconcentrationinwatersupply+50mg/Lr=%ReverseOsmosischloriderejection(95%or0.95)8.34= Conversionfactor(ppd/(mg/L*MGD))
ThefinalWLAsforTDSandsulfateareequaltoexistingsurfacewaterandgroundwater quality objectives for TDS and sulfate in Tables 3-8 and 3-10 of the BasinPlan.TheRegionalBoardmayrevisethefinalWLAsbasedonreviewof trend monitoring data as detailed in the monitoring section of this Basin Plan amendment.
OtherminorNPDESdischarges(asdefinedinTable4-1oftheBasinPlan)receiveconditionalWLAs.TheconditionalWLAforthesepointsourcesisasfollows:
Reach Concentration-based Conditional WLA for Chloride (mg/L)
6 150(12-monthAverage),230 (Daily Maximum)
5 150(12-monthAverage),230 (Daily Maximum)
4B 117(3-monthAverage),230 (Daily Maximum)
OthermajorNPDESdischarges(asdefinedinTable4-1oftheBasinPlan)receiveWLAsequalto100mg/L.TheRegionalBoardmayconsiderassigningconditionalWLAstoothermajordischargersbasedonananalysisofthedownstream increase in net chloride loading to surface water and groundwater as aresultofimplementationofconditionalWLAs.
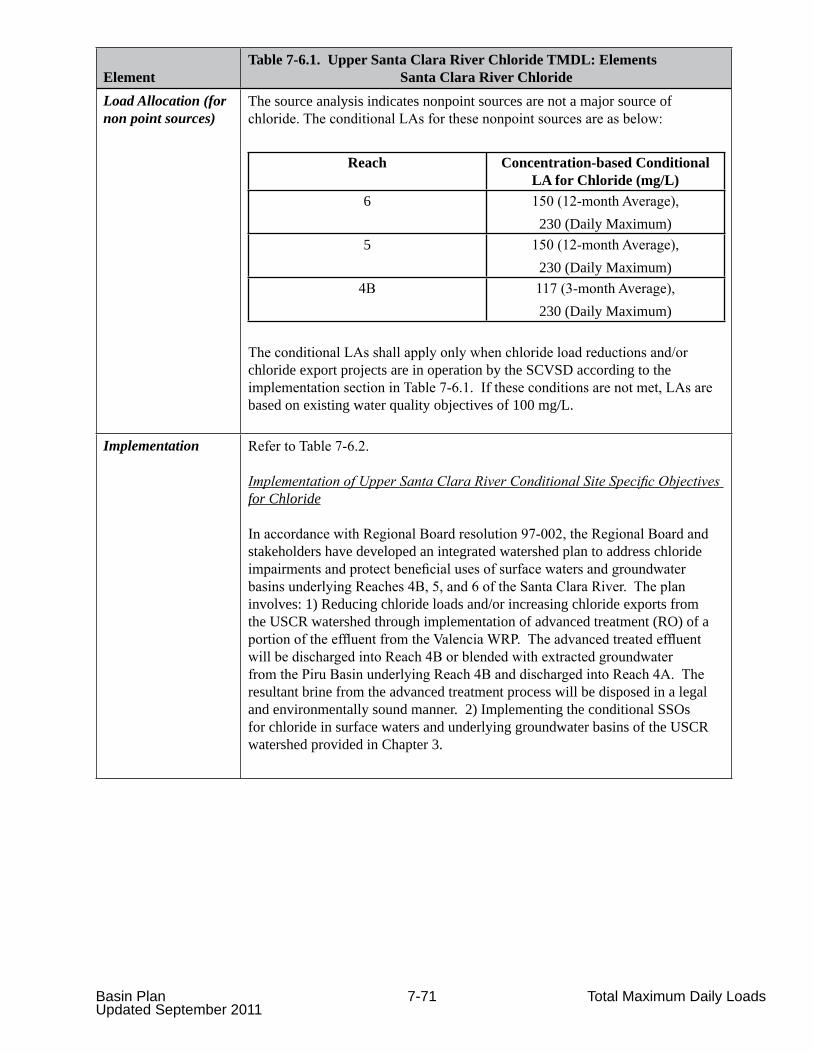
Basin Plan 7-7� Total Maximum Daily LoadsUpdated September 20��
ElementTable 7-6.1. Upper Santa Clara River Chloride TMDL: Elements
Santa Clara River ChlorideLoad Allocation (for non point sources)
The source analysis indicates nonpoint sources are not a major source of chloride.TheconditionalLAsforthesenonpointsourcesareasbelow:
Reach Concentration-based Conditional LA for Chloride (mg/L)
6 150(12-monthAverage),230 (Daily Maximum)
5 150(12-monthAverage),230 (Daily Maximum)
4B 117(3-monthAverage),230 (Daily Maximum)
TheconditionalLAsshallapplyonlywhenchlorideloadreductionsand/orchloride export projects are in operation by the SCVSD according to the implementationsectioninTable7-6.1.Iftheseconditionsarenotmet,LAsarebased on existing water quality objectives of 100 mg/L.
Implementation RefertoTable7-6.2.
Implementation of Upper Santa Clara River Conditional Site Specific Objectives for Chloride
InaccordancewithRegionalBoardresolution97-002,theRegionalBoardandstakeholders have developed an integrated watershed plan to address chloride impairmentsandprotectbeneficialusesofsurfacewatersandgroundwaterbasinsunderlyingReaches4B,5,and6oftheSantaClaraRiver.Theplaninvolves: 1) Reducing chloride loads and/or increasing chloride exports from the USCR watershed through implementation of advanced treatment (RO) of a portionoftheeffluentfromtheValenciaWRP.TheadvancedtreatedeffluentwillbedischargedintoReach4BorblendedwithextractedgroundwaterfromthePiruBasinunderlyingReach4BanddischargedintoReach4A.Theresultant brine from the advanced treatment process will be disposed in a legal and environmentally sound manner. 2) Implementing the conditional SSOs for chloride in surface waters and underlying groundwater basins of the USCR watershed provided in Chapter 3.

Basin Plan 7-72 Total Maximum Daily LoadsUpdated September 20��
ElementTable 7-6.1. Upper Santa Clara River Chloride TMDL: Elements
Santa Clara River ChlorideImplementation (continued)
The watershed chloride reduction plan will be implemented through NPDES permits for the Valencia WRP and a new NPDES permit for discharge into Reach 4A.TheconditionalSSOsforchlorideintheUSCRwatershedshallapplyand supersede the regional water quality objectives only when chloride load reductions and/or chloride export projects are in operation and reduce chloride loading in accordance with the following table:
Water Supply Chloride1 Chloride Load Reductions2
40mg/L 58,000 lbs per month50 mg/L 64,000lbspermonth60 mg/L 71,000lbspermonth70mg/L 77,000lbspermonth80 mg/L 83,000 lbs per month90 mg/L 90,000 lbs per month100 mg/L 96,000 lbs per month
1 Based on measured chloride of the State Water Project (SWP) water stored in Castaic Lake.2 Chloride load reduction is based on operation of a RO treatment plant treating 3 MGDofrecycledwaterwithchlorideconcentrationof50mg/L+WaterSupplyChloride.Assumesoperationalcapacityfactorof90%andROmembranechloride rejection rate of 95%. Determination of chloride load based on the following:
ChlorideLoad=90%x[(QRO x CWRP x8.34)xr]x(30Days/Month)
where r = %chloriderejection(95%)QRO = 3MGDofrecycledwatertreatedwithROCWRP = SWPCl+50mg/L
Conditional WLAs
ConditionalWLAsfortheSaugusandValenciaWRPswillbeimplementedthrougheffluentlimits,receivingwaterlimitsandmonitoringrequirementsinNPDESpermits.ConditionalWLAsforReach4Bwillbeimplementedasreceivingwaterlimits.ConditionalWLAsforReaches5and6willbeimplementedaseffluentlimits.
The implementation plan proposes that during the period of TMDL implementation,compliancefortheWRPs’effluentlimitswillbeevaluatedinaccordancewithinterimWLAs.

Basin Plan 7-7� Total Maximum Daily LoadsUpdated September 20��
ElementTable 7-6.1. Upper Santa Clara River Chloride TMDL: Elements
Santa Clara River ChlorideImplementation (continued)
Saugus WRP: TheinterimWLAforchlorideisequaltotheinterimlimitforchloridespecifiedinorderNo.R4-04-004.TheinterimWLAforTDSis1000mg/Lasanannualaverage.The interimWLAfor sulfate is450mg/Lasanannualaverage.These interimWLAs shall apply as interim end-of-pipe effluent limits, interim groundwaterlimits, and interim limits in the Non-NPDES WDR for recycled water uses from the Saugus WRP instead of existing water quality objectives.
Valencia WRP: TheinterimWLAforchlorideisequaltotheinterimlimitforchloridespecifiedinorderNo.R4-04-004.TheinterimWLAforTDSis1000mg/Lasanannualaverage.TheinterimWLAforsulfateis450mg/Lasanannualaverage. TheseinterimWLAs shall apply as interim end-of-pipe effluent limits, interim groundwaterlimits, and interim limits in the Non-NPDES WDR for recycled water uses from the Valencia WRP instead of existing water quality objectives.
Other Major NPDES Permits (including Newhall Ranch WRP):
TheRegionalBoardmayconsiderassigningconditionalWLAsforothermajorNPDES permits, including the Newhall Ranch WRP, pending implementation of a chloride mass removal quantity that is proportional to mass based chloride removal required for the Valencia WRP.
Supplemental Water released to Reach 6 of Santa Clara River:In order to accommodate the discharge of supplemental water to Reach 6, interim WLAsareprovided for sulfateof450mg/LandTDSof1000mg/Lasannualaverages.ThefinalWLAsareequal totheexistingwaterqualityobjectivesforsulfate and TDS in Table 3-8 of the Basin Plan. The Regional Board may revise the finalWLAbasedonreviewoftrendmonitoringdataasdetailedinthemonitoringsection of this Basin Plan amendment.
Monitoring NPDES monitoring: NPDES Permittees will conduct chloride, TDS, and sulfate monitoring to ensure that water quality objectives are being met.
Trend monitoring: The SCVSD will submit a monitoring plan to conduct chloride, TDS, and sulfate trend monitoring to ensure that the goal of chloride export in the watershed is being achieved, water quality objectives are being met, and downstream groundwater and surface water quality is not degraded due to implementation of compliance measures. The SCVSD monitoring plan shall include plans to monitor chloride, TDS, and sulfate in groundwater and identify representativewellstobeapprovedbytheRegionalBoardExecutiveOfficerinthe following locations: (a) Shallow alluvium layer in east Piru Basin, (b) San Pedro Formation in east Piru Basin, and (c) groundwater basins under Reaches 5 and 6, which shall be equivalent or greater than existing groundwater monitoring required by NPDES permits for Saugus and Valencia WRPs. The monitoring plan shall also include a plan for chloride, TDS, and sulfate trend monitoring for surface waterforReaches4B,5and6.Themonitoringplanshallincludeplanstomonitorchloride, TDS, and sulfate at a minimum of once per quarter for groundwater and at a minimum of once per month for surface water.

Basin Plan 7-74 Total Maximum Daily LoadsUpdated September 20��
ElementTable 7-6.1. Upper Santa Clara River Chloride TMDL: Elements
Santa Clara River ChlorideMonitoring (continued)
The plan should propose a monitoring schedule that extends beyond the completion date of this TMDL to evaluate impacts of compliance measures to downstream groundwater and surface water quality. This TMDL shall be reconsidered if chloride, TDS, and sulfate trend monitoring indicates degradation of groundwater or surface water due to implementation of compliance measures.
Trendmonitoring:TheReach4APermitteewillsubmitamonitoringplantoconductchloride, TDS, and sulfate trend monitoring to ensure that the goal of chloride export in the watershed is being achieved, water quality objectives are being met, and downstream groundwater and surface water quality is not degraded due to implementation of compliance measures. The Reach 4A permittee monitoringplan shall include plans to monitor chloride, TDS, and sulfate in groundwater and identify representative wells to be approved by the Regional Board Executive Officerinthefollowinglocations(a)FillmoreBasin,and(b)SantaPaulaBasin.The monitoring plan shall also include a plan for chloride, TDS, and sulfate trendmonitoringforsurfacewater forReaches3and4A.Themonitoringplanshould include plans to monitor chloride, TDS, and sulfate at a minimum of once per quarter for groundwater and at a minimum of once per month for surface water. The plan should propose a monitoring schedule that shall extend beyond the completion date of this TMDL to evaluate impacts of compliance measures to downstream groundwater and surface water quality. This TMDL shall be reconsidered if chloride, TDS, and sulfate trend monitoring indicates degradation of groundwater or surface water due to implementation of compliance measures.
Margin of Safety Animplicitmarginofsafetyisincorporatedthroughconservativemodelassumptions and chloride mass balance analysis. The model is an integrated groundwater surface water model which shows that chloride discharged from the WRPs accumulates in the east Piru Basin. Further mass balance analysis shows that the chloride mass removed from the Piru Basin exceeds the chloride loaded into the Piru Basin from implementation of the conditional SSOs.
Seasonal Variations and Critical Conditions
Duringdryweatherconditions,lesssurfaceflowisavailabletodiluteeffluentdischarge, groundwater pumping rates for agricultural purposes are higher, groundwater discharge is lower, poorer quality groundwater may be drawn into the aquifer, and evapotranspiration effects are greater than in wet weather conditions.Duringdrought,reducedsurfaceflowandincreasedgroundwaterextraction continues through several seasons with greater impacts on groundwater resources and discharges. Dry and critically dry periods affecting theSacramentoandSanJoaquinRiverValleysreducefresh-waterflowintothe Sacramento-San Joaquin Delta and result in higher than normal chloride concentrations in the State Water Project supply within the California aqueduct system. These increased chloride levels are transferred to the upper Santa Clara River.ThiscriticalconditionisdefinedaswhenwatersupplyconcentrationsmeasuredinCastaicLakeare≥80mg/L.
ThesecriticalconditionswereincludedintheGSWImodeltodetermineappropriate allocations and implementation scenarios for the TMDL.

Basin Plan 7-75 Total Maximum Daily LoadsUpdated September 20��
Table 7-6.2. Upper Santa Clara River Chloride TMDL ImplementationImplementation Tasks
Completion Date
1. AlternateWaterSupplya) Should(1)thein-riverconcentrationatBlueCut,theReach4Bboundary,
exceedtheconditionalSSOof117mg/L,measuredforthepurposesofthis TMDL as a rolling three-month average, (2) each agricultural diverter provide records of the diversion dates and amounts to the Regional Board and Santa Clarita Valley County Sanitation Districts of LosAngelesCounty (SCVSD) for at least 2 years afterMay4, 2005 and (3) eachagricultural diverter provides photographic evidence that diverted water is applied to avocado, strawberry or other chloride sensitive crop and evidence of a water right to divert, then the SCVSD will be responsible for providing an alternative water supply, negotiating the delivery of alternative water by a third party, or providing fiscal remediation tobequantified innegotiationsbetween theSCVSDand theagriculturaldiverter at the direction of the Regional Water Quality Control Board until such time as the in-river chloride concentrations do not exceed the conditional SSO.
b) Should the instream concentration exceed 230 mg/L more than two times inthethreeyearperiod,thedischargeridentifiedbytheRegionalBoardExecutiveOfficer shall be required to submit, within ninety days ofa requestby theRegionalBoardExecutiveOfficer, aworkplan foranaccelerated schedule to reduce chloride discharges.
05/04/2005
2. Progress reports will be submitted by the SCVSD to Regional Board staff on asemiannualbasisfromMay4,2005fortasks4,6,and7,andonanannualbasis for Tasks 5 and 11.
Progressreportswillbesubmittedby theReach4APermittee toRegionalBoard staff on an annual basis for Task 12.
Semiannually and annually
3. Chloride Source Identification/Reduction, Pollution Prevention and PublicOutreach Plan: Sixmonths afterMay 4, 2005, the SCVSDwill submit aplan to the Regional Board that addresses measures taken and planned to be taken to quantify and control sources of chloride, including, but not limited to: execute community-wide outreach programs, which were developed based on the pilot outreach efforts conducted by the SCVSD, assess potential incentive/disincentive programs for residential self-regenerating water softeners, and other measures that may be effective in controlling chloride. The SCVSD shall develop and implement the source reduction/pollution prevention and public outreach program, and report results annually thereafter to the Regional Board. Chloride sources from imported water supplies will be assessed. The assessment will include conditions of drought and low rainfall, and will analyze the alternatives for reducing this source.
11/04/2005

Basin Plan 7-76 Total Maximum Daily LoadsUpdated September 20��
Table 7-6.2. Upper Santa Clara River Chloride TMDL ImplementationImplementation Tasks
Completion Date
4. The SCVSDwill convene a technical advisory committee or committees(TAC(s))incooperationwiththeRegionalBoardtoreviewliteraturedevelopa methodology for assessment, and provide recommendations with detailed timelines and task descriptions to support any needed changes to the time schedule for evaluation of appropriate chloride threshold for Task 6. The Regional Board, at a public hearing will re-evaluate the schedule for Task 6andsubsequentlinkedtasksbasedoninputfromtheTAC(s),alongwithRegional Board staff analysis and assessment consistent with state and federal law, as to the types of studies needed and the time needed to conduct the necessaryscientificstudies todetermine theappropriatechloride thresholdfor the protection of salt sensitive agricultural uses, and will take action to amendthescheduleifthereissufficienttechnicaljustification.
05/04/2006
5. Groundwater/Surface Water Interaction Model: The SCVSD will solicitproposals, collect data, develop a model in cooperation with the Regional Board, obtain peer review, and report results. The impact of source waters and reclaimed water plans on achieving the water quality objective and protecting beneficialuses, including impactsonunderlyinggroundwaterquality,willalsobeassessedandspecificrecommendationsformanagementdevelopedfor Regional Board consideration. The purpose of the modeling and sampling effort is to determine the interaction between surface water and groundwater as it may affect the loading of chloride from groundwater and its linkage to surface water quality.
11/20/2007
6. EvaluationofAppropriateChlorideThresholdfortheProtectionofSensitiveAgriculturalSupplyUseandEndangeredSpeciesProtection:TheSCVSDwill prepare and submit a report on endangered species protection thresholds. The SCVSD will also prepare and submit a report presenting the results of the evaluation of chloride thresholds for salt sensitive agricultural uses, which shall consider the impact of drought and low rainfall conditions and the associated increase in imported water concentrations on downstream crops utilizing the result of Task 5.
11/20/2007
7. DevelopSSOforChlorideforSensitiveAgriculture:TheSCVSDwillsolicitproposals and develop technical analyses upon which the Regional Board may base a Basin Plan amendment.
8. DevelopAnti-DegradationAnalysis forRevisionofChlorideObjectivebySSO: The SCVSD will solicit proposals and develop draft anti-degradation analysis for Regional Board consideration.
9. Develop a pre-planning report on conceptual compliance measures to meet differenthypotheticalfinalconditionalwasteloadallocations.TheSCVSDshall solicit proposals and develop and submit a report to the Regional Board thatidentifiespotentialchloridecontrolmeasuresandcostsbasedondifferenthypothetical scenarios for chloride SSOs and final conditional wasteloadallocations.
02/20/2008

Basin Plan 7-77 Total Maximum Daily LoadsUpdated September 20��
Table 7-6.2. Upper Santa Clara River Chloride TMDL ImplementationImplementation Tasks
Completion Date
10. a)PreparationandConsiderationofaBasinPlanAmendment(BPA)torevise the chloride objective by the Regional Board.
b)EvaluationofAlternativeWaterSuppliesforAgriculturalBeneficialUses: The SCVSD will quantify water needs, identify alternative water supplies, evaluate necessary facilities, and report results, including the long-term application of this remedy.
c)Analysis of Feasible Compliance Measures to Meet Final ConditionalWasteloadAllocationsforProposedChlorideObjective. TheSCVSDwillassess and report on feasible implementation actions to meet the chloride objective established pursuant to Task 10a).
d) Reconsideration of and action taken on the Chloride TMDL and Final ConditionalWasteloadAllocationsfor theUpperSantaClaraRiverby theRegional Board.
12/11/2008
11. Trend monitoring: The SCVSD will submit a monitoring plan to conduct chloride, TDS, and sulfate trend monitoring to ensure that the goal of chloride export in the watershed is being achieved, water quality objectives are being met, and downstream groundwater and surface water quality is not degraded due to implementation of compliance measures. The SCVSD monitoring plan shall include plans to monitor chloride, TDS, and sulfate in groundwater and identify representative wells to be approved by the RegionalBoardExecutiveOfficer,inthefollowinglocations:(a)Shallowalluvium layer in east Piru Basin, (b) San Pedro Formation in east Piru Basin, and (c) groundwater basins under Reaches 5 and 6, which shall be equivalent or greater than existing groundwater monitoring required by NPDES permits for Saugus and Valencia WRPs. The monitoring plan shall also include a plan for chloride, TDS, and sulfate trend monitoring forsurfacewaterforReaches4B,5and6.Themonitoringplanshallinclude plans to monitor chloride, TDS, and sulfate at a minimum of once per quarter for groundwater and at a minimum of once per month for surface water. The plan should propose a monitoring schedule that extends beyond the completion date of this TMDL to evaluate impacts of compliance measures to downstream groundwater and surface water quality. This TMDL shall be reconsidered if chloride, TDS, and sulfate trend monitoring indicates degradation of groundwater or surface water due to implementation of compliance measures.
05/04/2009

Basin Plan 7-78 Total Maximum Daily LoadsUpdated September 20��
Table 7-6.2. Upper Santa Clara River Chloride TMDL ImplementationImplementation Tasks
Completion Date
12.Trendmonitoring:TheReach4APermitteewillsubmitamonitoringplanto conduct chloride, TDS, and sulfate trend monitoring to ensure that the goal of chloride export in the watershed is being achieved, water quality objectives are being met, and downstream groundwater and surface water quality is not degraded due to implementation of compliance measures. TheReach4Apermitteemonitoringplanshallincludeplanstomonitorchloride, TDS, and sulfate in groundwater and identify representative wells tobeapprovedbytheRegionalBoardExecutiveOfficerinthefollowinglocations (a) Fillmore Basin, and (b) Santa Paula Basin. The monitoring plan shall also include a plan for chloride, TDS, and sulfate trend monitoringforsurfacewaterforReaches3and4A.Themonitoringplanshould include plans to monitor chloride, TDS, and sulfate at a minimum of once per quarter for groundwater and at a minimum of once per month for surface water. The plan should propose a monitoring schedule that shall extend beyond the completion date of this TMDL to evaluate impacts of compliance measures to downstream groundwater and surface water quality. This TMDL shall be reconsidered if chloride, TDS, and sulfate trend monitoring indicates degradation of groundwater or surface water due to implementation of compliance measures.
Submitted with permit application
13. Begin monitoring per approved SVCSD monitoring plan completed in Task 11.
One year after ExecutiveOfficerapproval of Task 11 monitoring plan for SCVSD
14.BeginmonitoringperapprovedReach4APermitteemonitoringplan. One year after ExecutiveOfficerapproval of Task 12 monitoring plan for Reach4APermittee

Basin Plan 7-79 Total Maximum Daily LoadsUpdated September 20��
Table 7-6.2. Upper Santa Clara River Chloride TMDL ImplementationImplementation Tasks
Completion Date
15. a) Implementation of Compliance Measures, Planning: The SCVSD shall submit a report of planning activities which include but are not limited to: (1) identifying lead state/federal agencies; (2) administering a competitive bid process for the selection of EIR/EIS and Engineering Consultants; (3) Development of Preliminary Planning and Feasibility Analyses;(4) Submittal of Project Notice of Preparation/Notice of Intent; (5)Preparation of Draft Wastewater Facilities Plan and Programmatic EIR; (6) AdministrationofPublicReviewandCommentPeriods;(7)Developmentof Final Wastewater Facilities Plan and Programmatic EIR and incorporation andresponsetocomments;(8)Administrationoffinalpublicreviewandcertificationprocess;and(9)FilingaNoticeofDeterminationandRecordof Decision.
b) Implementation of Compliance Measures, Planning: The SCVSD shall provide a schedule of related tasks and subtasks related to Task 15a), and provide semi-annual progress reports on progress of planning activities, thereafter, until completion of Final Wastewater Facilities Plan and Programmatic EIR.
05/04/2010
05/04/2010
16. The Regional Board staff will re-evaluate the schedule to implement control measuresneededtomeetfinalconditionalWLAsadoptedpursuanttoTask10d)andthescheduleforTask17.TheRegionalBoard,atapublicmeetingwillconsiderextending thecompletiondateofTask17andreconsider theschedule to implement control measures to meet final conditionalWLAsadoptedpursuanttoTask10d).TheSCVSDwillprovidethejustificationfortheneedforanextensiontotheRegionalBoardExecutiveOfficeratleast6months in advance of the deadline for this task.
05/04/2011

Basin Plan 7-80 Total Maximum Daily LoadsUpdated September 20��
Table 7-6.2. Upper Santa Clara River Chloride TMDL ImplementationImplementation Tasks
Completion Date
17. a) Implementation of Compliance Measures, Complete EnvironmentalImpact Report: The SCVSD shall complete a Wastewater Facilities Plan and Programmatic Environmental Impact Report for facilities to comply with finaleffluentpermitlimitsforchloride.
b) Implementation of Compliance Measures, Engineering Design: The SCVSD will begin the engineering design of the recommended project wastewater facilities.
c) Implementation of Compliance Measures, Engineering Design: The SCVSD will provide a design schedule of related tasks and sub-tasks, and provide semi-annual progress reports on progress of design activities, thereafter, until completion of Final Design. In addition the SCVSD will provide a construction schedule of related tasks and sub-tasks, and provide semi-annual progress reports on progress of construction activities, thereafter, until completion of recommended project wastewater facilities.
d) Implementation of Compliance Measures, Construction: The SCVSD shall have applied and received all appropriate permits and have completed construction of the recommended project wastewater facilities.
e) Implementation of Compliance Measures, Start-Up: The SCVSD shall havecompletedstart-up,testingandcertificationoftherecommendedprojectwastewater facilities.
05/04/2011
05/04/2011
05/04/2012
11/04/2014
05/04/2015
18.TheRegionalBoardExecutiveOfficermayconsiderconditionalSSOsforTDSandsulfateforReaches4B,5,and6basedonresultsofgroundwater-surface water interaction studies on accumulation of TDS and sulfate in groundwater, potential impacts to beneficial uses, and an anti-degradationanalysis.
05/04/2012
19. The Regional Board staff will re-evaluate the schedule to implement control measuresneededtomeetfinalconditionalWLAsadoptedpursuanttoTask10d)andthescheduleforTask17.TheRegionalBoard,atapublicmeetingwillconsiderextending thecompletionofTask17andreconsider thescheduletoimplementcontrolmeasurestomeetfinalconditionalWLAsadoptedforchloridepursuanttoTask10d).TheSCVSDwillprovidethejustificationfortheneedforanextensiontotheRegionalBoardExecutiveOfficeratleast6months in advance of the deadline for this task. The Regional Board will also considerconditionalSSOsandfinalconditionalWLAsforTDSandsulfatebased on results of Task 18.
11/04/2014

Basin Plan 7-8� Total Maximum Daily LoadsUpdated September 20��
Table 7-6.2. Upper Santa Clara River Chloride TMDL ImplementationImplementation Tasks
Completion Date
20.TheinterimWLAsforchlorideshallremainineffectfornomorethan10yearsafterMay4,2005.ConditionalSSOforchloride in theUSCRshallbeachieved.FinalconditionalWLAsforchlorideinReaches4B,5,and6shall apply by May 5, 2015. The Regional Board may consider extending the completion date of this task as necessary to account for events beyond the control of the SCVSD.
05/04/2015
21.TheinterimWLAsforTDSandsulfatecontainedin thisBPA(ResolutionNo.R4-2008-012)shallbeimplementednosoonerthanMay4,2005,andshallremainineffectuntilMay4,2015.FinalWLAsshallapplybyMay5,2015unlessconditionalSSOsandfinalconditionalWLAsforTDSandsulfate are adopted as described in Task 19.
05/04/2015

Basin Plan 7-82 Total Maximum Daily LoadsUpdated September 20��

Basin Plan 7-8� Total Maximum Daily LoadsUpdated September 20��
7-7 Calleguas Creek Nitrogen Compounds and Related Effects TMDL
This TMDL was adopted by: TheRegionalWaterQualityControlBoardonOctober24,2002.
This TMDL was approved by: The State Water Resources Control Board on March 19, 2003. TheOfficeofAdministrativeLawonJune5,2003. TheU.S.EnvironmentalProtectionAgencyonJune20,2003.
This TMDL was revised and adopted by: The Regional Water Quality Control Board on September 11, 2008.
This TMDL was re-approved by: The State Water Resources Control Board on June 16, 2009. TheOfficeofAdministrativeLawonOctober5,2009. TheU.S.EnvironmentalProtectionAgencyonOctober15,2009.
The effective date of this TMDL is: October 15, 2009.
TheelementsoftheTMDLarepresentedinTable7-7.1andtheImplementationPlaninTable7-7.2
Table 7-7.1. Calleguas Creek Nitrogen Compounds and Related Effects TMDL: Elements
Element Calleguas Creek Nitrogen Compound and Related Effects
Problem Statement
Elevated nitrogen concentrations (ammonia, nitrite and nitrate) are causing impairmentsofthewarmwaterfishandwildlifehabitat,andgroundwaterrechargebeneficialusesofCalleguasCreek.Nitriteandnitratecontributetoeutrophiceffectssuchaslowdissolvedoxygenandalgaegrowth.Ammoniacontributestotoxicity.

Basin Plan 7-84 Total Maximum Daily LoadsUpdated September 20��
Element Calleguas Creek Nitrogen Compound and Related Effects
Numeric Target (Interpretation of the numeric water quality objective, used to calculate the load allocations)
Numeric targets for this TMDL are listed as follows:
1. TotalAmmoniaasNitrogen(NH3-N) NH3-N concentration (mg/L)
One-hour Thirty-day Reach average average _______________________________________________________________________• Mugu Lagoon 8.1 2.9 • CalleguasCreek,South5.52.4• CalleguasCreek,North8.43.0• RevlonSlough5.72.9• BeardsleyChannel5.72.9• ArroyoLasPosas8.12.6• ArroyoSimi4.72.4• Tapo Canyon 3.9 1.9 • ConejoCreek(ConfluencewithCalleguas9.53.5
Creek to Santa Rosa Rd.)• ConejoCreek(SantaRosaRoad8.43.4
to Thousand Oaks City Limit)• ConejoCreek,HillCanyonReach8.43.1• ConejoCreek,NorthFork3.21.7• ArroyoConejo(SouthForkConejoCreek)5.13.4• ArroyoSantaRosa5.72.4
2. Nitrate and nitrite as nitrogen (NO3-N and NO2-N)Constituent Concentration (mg/L)
_______________________________________________________________________• NO3-N 10• NO2-N 1• NO3-N + NO2-N 10
Numeric targets to address narrative objectives required to protect warm freshwater and wildlife habitat are intended to implement the narrative objectives and may be revised based on the results of monitoring and special studies conducted pursuant to the implementation plan.
Source Analysis The principal sources of nitrogen into Calleguas Creek are discharges from the POTWs in the watershed and runoff from agricultural activities in the watershed.
Linkage Analysis Linkage between nitrogen sources and the in-stream water quality was established through a mass continuity model based on an evaluation of recent hydrodynamic and water quality data.
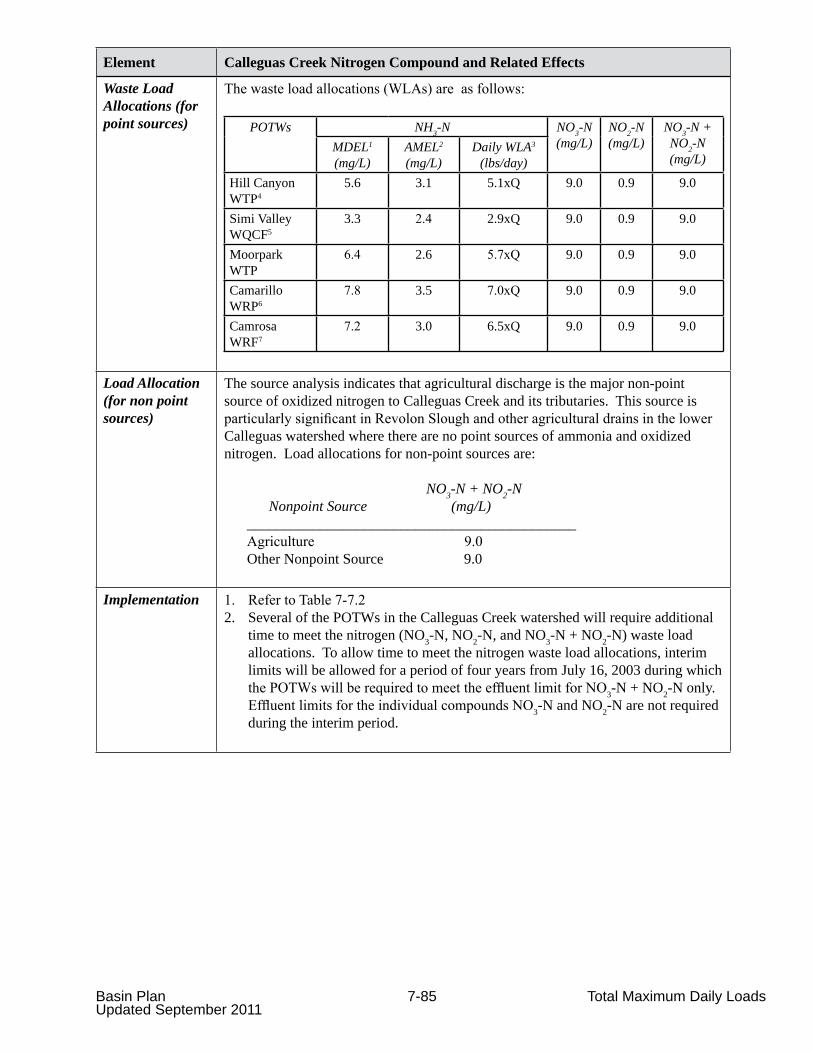
Basin Plan 7-85 Total Maximum Daily LoadsUpdated September 20��
Element Calleguas Creek Nitrogen Compound and Related Effects
Waste Load Allocations (for point sources)
Thewasteloadallocations(WLAs)areasfollows:
POTWs NH3-N NO3-N (mg/L)
NO2-N (mg/L)
NO3-N + NO2-N (mg/L)
MDEL1 (mg/L)
AMEL2 (mg/L)
Daily WLA3 (lbs/day)
Hill Canyon WTP4
5.6 3.1 5.1xQ 9.0 0.9 9.0
Simi Valley WQCF5
3.3 2.4 2.9xQ 9.0 0.9 9.0
Moorpark WTP
6.4 2.6 5.7xQ 9.0 0.9 9.0
Camarillo WRP6
7.8 3.5 7.0xQ 9.0 0.9 9.0
Camrosa WRF7
7.2 3.0 6.5xQ 9.0 0.9 9.0
Load Allocation (for non point sources)
The source analysis indicates that agricultural discharge is the major non-point source of oxidized nitrogen to Calleguas Creek and its tributaries. This source is particularlysignificantinRevolonSloughandotheragriculturaldrainsinthelowerCalleguas watershed where there are no point sources of ammonia and oxidized nitrogen. Load allocations for non-point sources are:
NO3-N + NO2-N Nonpoint Source (mg/L) _____________________________________________Agriculture9.0Other Nonpoint Source 9.0
Implementation 1. RefertoTable7-7.22. Several of the POTWs in the Calleguas Creek watershed will require additional
time to meet the nitrogen (NO3-N, NO2-N, and NO3-N + NO2-N) waste load allocations. To allow time to meet the nitrogen waste load allocations, interim limits will be allowed for a period of four years from July 16, 2003 during which thePOTWswillberequiredtomeettheeffluentlimitforNO3-N + NO2-N only. EffluentlimitsfortheindividualcompoundsNO3-N and NO2-N are not required during the interim period.

Basin Plan 7-86 Total Maximum Daily LoadsUpdated September 20��
Element Calleguas Creek Nitrogen Compound and Related Effects
Implementation (continued)
Interim Limits* for NO3-N + NO2-N
Monthly Average Daily Maximum POTWs (mg/L) (mg/L)_______________________________________________________________________• Hill Canyon WTP 36.03 38.32• SimiValleyWQCF31.6032.17• Moorpark WTP 31.5 32.01• CamarilloWRP36.2337.75
*The monthly average and daily maximum interim limits are based on the 95th and 99th percentilesofeffluentperformancedatareportedintheCalleguasCreekCharacterizationStudy
3. The waste load allocations for ammonia will be applicable on July 16, 2003. Interim limits for ammonia will be applicable for no more than 2 years starting fromOctober24,2002forPOTWsthatarenotabletoachieveimmediatecompliance with the assigned waste load allocations. The interim limits for ammonia may be established at the discretion of the Regional Board when a POTW’sNPDESpermitisreissued.
Margin of Safety Animplicitmarginofsafetyisincorporatedthroughconservativemodelassumptions and statistical analysis. In addition, an explicit margin of safety is incorporated by reserving 10% of the load, calculated on a concentration basis, from allocationtoPOTWeffluentsources.
Seasonal Variations and Critical Conditions
AlowflowcriticalconditionisidentifiedforthisTMDLbasedonareviewofflowdataforthepasttwentyyears.Thisflowconditionwasidentifiedbecauselessassimilativecapacityisavailabletodiluteeffluentdischarge.
1Maximumdailyeffluentlimitation2Averagemonthlyeffluentlimitation3QrepresentsthePOTWeffluentflowatthetimethewaterqualitymeasurementiscollectedandaconversionfactortolb/daybasedontheunitsofmeasurementfortheeffluentflow.4WastewaterTreatmentPlant5 Water Quality Control Facility6 Water Reclamation Plant7WaterReclamationFacility

Basin Plan 7-87 Total Maximum Daily LoadsUpdated September 20��
Table 7-7.2. Calleguas Creek Nitrogen Compounds and Related Effects TMDL Implementation Schedule
IMPLEMENTATIONTASkS,MILESTONESANDPROVISIONS*
COMPLETIONDATE
1.2.3.
WLAforammoniaapplytoPOTWs.Interim Limits for NO3-N + NO2-N apply to POTWs.Formation of Nonpoint Source BMP Evaluation Committee.
July 16, 2003
4.
5.
Submittal of Non point Source Monitoring Workplan by Calleguas Creek Watershed Management Plan – Water Resources/Water Quality (CCWMP) Subcommittee. This monitoring is to evaluate nutrient loadings associated with agricultural drainage and other nonpoint sources. The monitoring program will include both dry and wet weather discharges from agricultural, urban and open space sources. In addition, groundwater discharge to Calleguas Creek will also be analyzed for nutrients to determine the magnitude of theseloadingandtheneedforloadallocations.Akeyobjective of these special studies will be to determine the effectiveness of agricultural BMPs in reducing nutrientloadings.Consequently,flowandanalyticaldata for nutrients will be required to estimate loadings from nonpoint sources.Submittal of Watershed Monitoring Workplan by CCWMP Subcommittee. In addition to the analytical parametersandflowdatarequirements,thewatershedmonitoring program will establish sampling locations from which representative samples can be obtained, including all listed tributaries. Monitoring results will becomparedtothenumericinstreamtargetsidentifiedin this TMDL to determine the effectiveness of the TMDL. Data on the extent and distribution of algal mats, scum and odors will be included in the watershed monitoring program. The data will be used to provide furtherverificationofthemodelandrefinetheTMDLto address nutrient effects as appropriate.
July16,2004

Basin Plan 7-88 Total Maximum Daily LoadsUpdated September 20��
IMPLEMENTATIONTASkS,MILESTONESANDPROVISIONS*
COMPLETIONDATE
6. Submittal of Special Studies Workplan by CCWMP Subcommittee. These special studies include:
Monitoring of minor point sources for nutrients to confirmassumptionsthattheloadingsfromthesesources are minor;
Monitoring of greenhouse discharges and runoff to assess loadings from these sources;
Monitoring of groundwater extraction and discharges intheArroyoSantaRosasubwatershedandotherareasthatmayaddsignificantnutrientloadingstoCalleguasCreek; and
Additionalstudiesofthetypeandextentofalgaeimpairment in Calleguas Creek and Mugu Lagoon.
July16,2004
7.
8.
9.
Complete Special Studies for minor sources, greenhouses, and groundwater loadings. Completion of ammonia Water Effect Ratio (WER) studies.Complete planning and preparation for construction of TMDL remedies to reduce non-point source nitrogen loads.
July 16, 2006
10. Interim Limits for NO3-N + NO2-NexpireandWLAsfor NO3-N, NO2-N, NO3-N + NO2-N apply to POTWs.
July16,2007
11. Complete Special Studies for algae impairments of Calleguas Creek, its tributaries and Mugu Lagoon.
July 16, 2008
12. Regional Board consideration of revised water quality objectives for nitrogen compounds based on monitoring data, special studies, and ammonia WER, if appropriate.
July 16, 2009
13. Final achievement of ammonia and oxidized nitrogen standards.
July 16, 2010
∗TheCCWMPSubcommitteehasofferedtocompletetasks4through9and11.IntheeventtheCCWMPSubcommitteefails to timely complete these tasks, the Regional Board will consider whether to amend this Implementation Plan to assign tasks to responsible dischargers in the regulatory approach. The Regional Board also reserves its right to take any other appropriateactionsincluding,butnotlimitedto,exercisingitsauthoritiesunderWaterCodesection13267.

Basin Plan 7-89 Total Maximum Daily LoadsUpdated September 20��
7-8 Los Angeles River Nitrogen Compounds and Related Effects TMDL
This TMDL was adopted by:The Regional Water Quality Control Board on July 10, 2003.
This TMDL was approved by: The State Water Resources Control Board on November 19, 2003.TheOfficeofAdministrativeLawonFebruary27,2004.TheU.S.EnvironmentalProtectionAgencyonMarch18,2004.
This TMDL was amended and adopted by:TheRegionalWaterQualityControlBoardonDecember4,2003.
This amended TMDL was approved by: TheStateWaterResourcesControlBoardonMarch24,2004.TheOfficeofAdministrativeLawonSeptember27,2004.
[U.S.EnvironmentalProtectionAgencyapprovalnotrequiredforamendmenttoImplementationPlan]
TheeffectivedateofthisTMDLis:September27,2004.
Table 7-8.1. Los Angeles River Nitrogen Compounds and Related Effects TMDL: ElementsElement Los Angeles River Nitrogen Compounds and Related Effects TMDLProblem Statement ReachesoftheLosAngelesRiveranditstributarieswerelistedasimpairedfor
nitrogen compounds (ammonia, nitrate, and nitrate) and related effects such as algae, pH, odor, and scum on the 2002 303(d) list. These reaches were listed because numeric and narrative water quality objectives for nitrogen compounds and related effects were exceeded, thereby impairing warm, freshwater, and wildlife habitats, andrecreationbeneficialuses.
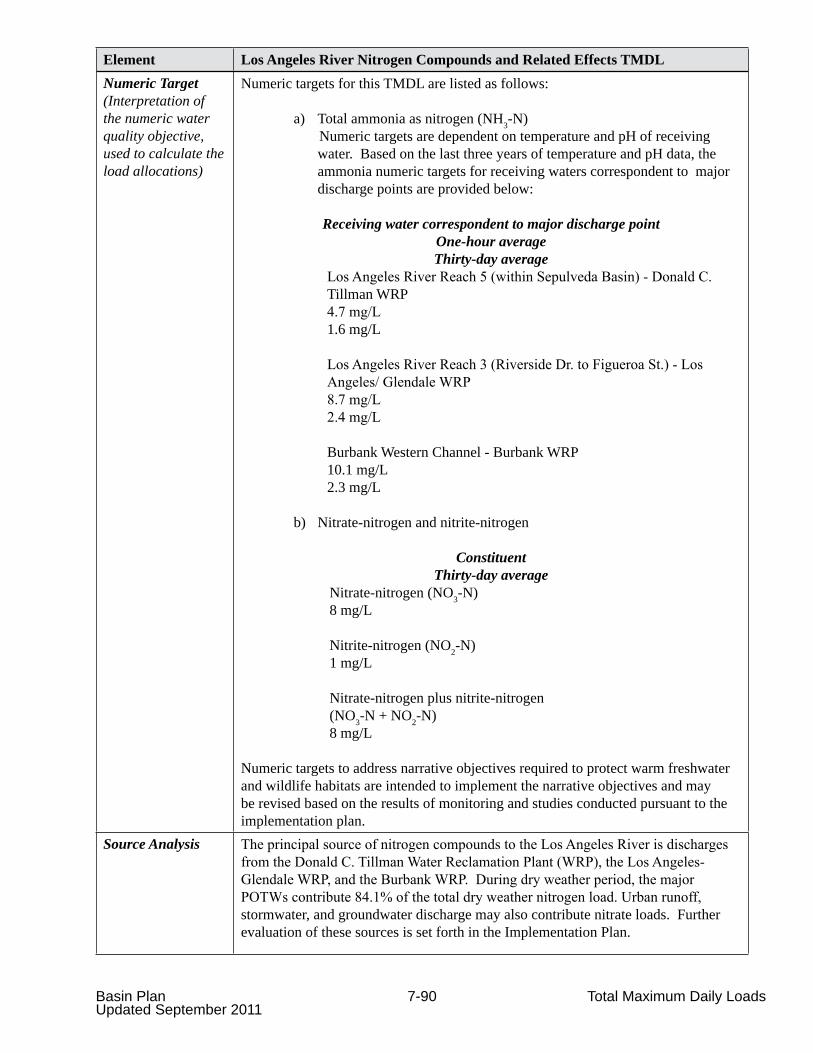
Basin Plan 7-90 Total Maximum Daily LoadsUpdated September 20��
Element Los Angeles River Nitrogen Compounds and Related Effects TMDLNumeric Target (Interpretation of the numeric water quality objective, used to calculate the load allocations)
Numeric targets for this TMDL are listed as follows:
a) Total ammonia as nitrogen (NH3-N) Numeric targets are dependent on temperature and pH of receiving
water. Based on the last three years of temperature and pH data, the ammonia numeric targets for receiving waters correspondent to major discharge points are provided below:
Receiving water correspondent to major discharge pointOne-hour average Thirty-day average
LosAngelesRiverReach5(withinSepulvedaBasin)-DonaldC.Tillman WRP4.7mg/L1.6 mg/L
LosAngelesRiverReach3(RiversideDr.toFigueroaSt.)-LosAngeles/GlendaleWRP8.7mg/L2.4mg/L
Burbank Western Channel - Burbank WRP10.1 mg/L2.3 mg/L
b) Nitrate-nitrogen and nitrite-nitrogen
ConstituentThirty-day average
Nitrate-nitrogen (NO3-N)8 mg/L
Nitrite-nitrogen (NO2-N)1 mg/L
Nitrate-nitrogen plus nitrite-nitrogen(NO3-N + NO2-N)8 mg/L
Numeric targets to address narrative objectives required to protect warm freshwater and wildlife habitats are intended to implement the narrative objectives and may be revised based on the results of monitoring and studies conducted pursuant to the implementation plan.
Source Analysis TheprincipalsourceofnitrogencompoundstotheLosAngelesRiverisdischargesfromtheDonaldC.TillmanWaterReclamationPlant(WRP),theLosAngeles-GlendaleWRP,andtheBurbankWRP.Duringdryweatherperiod,themajorPOTWscontribute84.1%ofthetotaldryweathernitrogenload.Urbanrunoff,stormwater, and groundwater discharge may also contribute nitrate loads. Further evaluation of these sources is set forth in the Implementation Plan.

Basin Plan 7-9� Total Maximum Daily LoadsUpdated September 20��
Element Los Angeles River Nitrogen Compounds and Related Effects TMDLLinkage Analysis Linkage between nutrient sources and the instream water quality was established
through hydrodynamic and water quality models. The Environmental Fluid Dynamics Code 1-D was used to model the hydrodynamic characteristics of the LosAngelesRiverandtheWaterQualityAnalysisSimulationProgramwasusedtomodelwaterquality.Additionalstudieswereconductedtodeveloptheresidencetime and determine the nutrient uptake rates by algae.
Wasteload Allocations (for point sources)
1. Major point sources:
a) Total ammonia as nitrogen (NH3-N):
POTWOne-hour average WLAThirty-day average WLA
Donald C. Tillman WRP4.2mg/L1.4mg/L
LosAngeles-GlendaleWRP7.8mg/L2.2 mg/L
Burbank WRP9.1 mg/L2.1 mg/L
b) Nitrate-nitrogen (NO3-N), nitrite-nitrogen (NO2-N), and Nitrate-nitrogen plus nitrite-nitrogen (NO3-N + NO2-N):
ConstituentThirty-day average WLA*
NO3-N7.2mg/L
NO2-N0.9 mg/L
NO3-N + NO2-N7.2mg/L
*Receiving water monitoring is required on a weekly basis to ensure compliance with the water quality objective.

Basin Plan 7-92 Total Maximum Daily LoadsUpdated September 20��
Element Los Angeles River Nitrogen Compounds and Related Effects TMDLWaste Load Allocations (for point sources)(continued)
2. Minor point sources:
Waste loads are allocated to minor point sources enrolled under NPDES or WDR permits including but not limited to Tapia WRP, Whittier Narrows WRP,LosAngelesZooWRP,industrialandconstructionstormwater,andmunicipal storm water and urban runoff from municipal separate storm sewersystems(MS4s):
a) Ammoniawasteloadallocations(WLAs)forminorpointsourcesarelisted below by receiving waters:
Water BodyOne-hour average WLAThirty-day average WLA
LosAngelesRiveraboveLosAngeles-GlendaleWRP(LAG)4.7mg/L1.6 mg/L
LosAngelesRiverbelowLAG8.7mg/L2.4mg/L
LosAngelesTributaries10.1 mg/L2.3 mg/L
b) WLAsfornitrate-nitrogen,nitrite-nitrogen,andnitrate-nitrogenplusnitrite-nitrogen for minor discharges are listed below:
ConstituentThirty-day average WLA
NO3-N8.0 mg/L
NO2-N1.0 mg/L
NO3-N + NO2-N8.0 mg/L
Load Allocation (for nonpoint sources)
TheSourceAssessmentindicatesthatnitrogenloadsfromnonpointsourcesare negligible compared to loading from point sources and their contribution is adequately accounted for in the margin of safety. Consequently, load allocations will not be developed unless it is determined they are necessary after load reductions are effectedthroughimplementationofthewasteloadallocations.Additionalmonitoringis included in the implementation plan to verify the nitrogen nonpoint source contributions.

Basin Plan 7-9� Total Maximum Daily LoadsUpdated September 20��
Element Los Angeles River Nitrogen Compounds and Related Effects TMDLImplementation 1. RefertoTable7-8.2
2. The Implementation Plan includes upgrades to the WRPs discharging to Los AngelesRiverforremovalofammonia,nitrate,andnitrite.Atthediscretionof the Regional Board, the following interim limits for ammonia, and nitrate plus nitrite will be allowed for major point sources for a period not to exceed 3.5yearsfromMarch23,2004.EffluentlimitsfortheindividualcompoundsNO3-N, and NO2-N are not required during the interim period.
Interim Limits for NH3-N and NO3-N + NO2-N
Total ammonia as NitrogenPOTW
Daily Maximum*Monthly Average*
Donald C. Tillman WRP24.7mg/L20.5 mg/L
LosAngeles-GlendaleWRP24.2mg/L18.8 mg/L
Burbank WRP24.1mg/L22.7mg/L
*The monthly average and daily maximum interim limits are based on the 95th and99thpercentilesofeffluentperformancedatareportedbydischargers.
Nitrite-nitrogen + Nitrate-nitrogenMonthly Average
8.0 mg/L
The Implementation Plan also includes additional studies to evaluate the effectiveness of nitrogen reductions on related effects such as algae growth, odors andscum.Ammoniaandnitratereductionswillberegulatedthrougheffluentlimitsprescribed in NPDES permits.
Margin of Safety Anexplicitmarginofsafetyof10%oftheammonia,nitrate,nitriteandnitrate+nitrite loads is allocated to address uncertainty in the sources and linkage analyses. In addition, an implicit margin of safety is incorporated through conservative model assumptions and statistical analysis.
Seasonal Variations and Critical Conditions
ThecriticalconditionidentifiedforthisTMDLisbasedonlowflowcondition.Thedriest six months of the year are the most critical condition for nutrients because less surfaceflowisavailabletodiluteeffluentdischarge.

Basin Plan 7-94 Total Maximum Daily LoadsUpdated September 20��
Implementation Tasks Completion Date1. ApplyinterimlimitsforNH3-N and NO3-N + NO2-N to major Publicly
Owned Treatment Works (POTWs).2. ApplyWasteLoadAllocations(WLAs)tominorpointsource
dischargersandMS4permittees.3. Begin to include monitoring for nitrogen compounds in NPDES permits
for minor NPDES dischargers above 0.1 mgd as permits are renewed.
03/23/2004
4. SubmittalofaMonitoringWorkPlanbyMS4permitteestoestimatenitrogen loadings associated with runoff loads from the storm drain systemforapprovalbytheExecutiveOfficeroftheRegionalBoard.The Work Plan will include monitoring for ammonia, nitrate, and nitrite. TheWorkPlanmayincludeaphasedapproachwhereinthefirstphaseisbased on monitoring from the existing mass emission station in the Los AngelesRiver.Theresultswillbeusedtocalibratethelinkageanalysis.
The Work Plan will also contain protocol and a schedule for implementing additional monitoring if necessary. The Work Plan willalsoproposetriggersforconductingsourceidentificationandimplementingBMPs,ifnecessary.SourceidentificationandBMPswillbeinaccordancewiththerequirementsofMS4permits.
03/23/2005
5. Submittal of a Workplan by major NPDES permittees to evaluate the effectiveness of nitrogen reductions on removing impairments from algaeodors,scums,andpHforapprovalbytheExecutiveOfficerofthe Regional Board. The monitoring program will include instream monitoringofalgae,foam,scum,pH,andodorsintheLosAngelesRiver.Inaddition,groundwaterdischargetoLosAngelesRiverwillalsobe analyzed for nutrients to determine the magnitude of these loadings and the need for load allocations. The Workplan will include protocol andscheduleforrefiningnumerictargetsfornitrogencompoundsandrelatedeffectssuchasexcessivealgaeintheLosAngelesRiver.TheWorkplanwillalsocontainprotocolandascheduleforidentificationoflimiting nutrients.
03/23/2005
6. SubmissionofaspecialstudiesWorkplanbytheCityofLosAngelestoevaluatesite-specificobjectivesforammonia,nitrate,andnitrite,including the following issues: pH and temperature distribution downstream of the D.C. Tillman WRP to determine the point of complianceforammonia,establishmentofammoniaWLAsbasedonseasonality.
03/23/2005
7. SubmissionofallresultsfromTask6,andresultsfromwatereffectsratio study for ammonia which has been performed by the City of Los Angeles.
No later than 09/23/2006
Table 7-8.2. Los Angeles River Nitrogen Compounds and Related Effects TMDL:Implementation Schedule

Basin Plan 7-95 Total Maximum Daily LoadsUpdated September 20��
Implementation Tasks Completion Date8. RegionalBoardconsiderssite-specificobjectivesforammonia,nitrate,
nitrite and nitrite + nitrate and revision of wasteload allocations based onresultsfromTasks6and7.TheRegionalBoardwillconsiderfactors such as seasonal variation, averaging periods, and water effects ratioswhendeterminingwhetheritisappropriatetoadoptsite-specificobjectivesforammonia.IfasitespecificobjectiveisadoptedbytheRegional Board, and approved by relevant approving agencies, this TMDLwillneedtoberevised,readopted,andreapprovedtoreflecttherevised water quality objectives.
Nolaterthan09/23/2007
9. Interimlimitsforammoniaandnitrate+nitriteexpireandWLAsforammonia, nitrate, nitrite, and nitrate + nitrite apply to major point sources.
09/23/2007
10. Complete evaluation of monitoring for nutrient effects and determine need for revising wasteload allocations, including but not limited to establishingnewWLAsforothernutrientandrelatedeffectssuchasalgal growth
03/23/2008
11. Regional Board considers results of Tasks 5 and 10 and revises or establishesWLAsasappropriate.
03/23/2009

Basin Plan 7-96 Total Maximum Daily LoadsUpdated September 20��


Basin Plan 7-�04 Total Maximum Daily LoadsUpdated September 20��

Basin Plan 7-�05 Total Maximum Daily LoadsUpdated September 20��
7-10 Malibu Creek and Lagoon Bacteria TMDL
This TMDL was adopted by: TheRegionalWaterQualityControlBoardonDecember13,2004.
This TMDL was approved by: The State Water Resources Control Board on September 22, 2005. TheOfficeofAdministrativeLawonDecember1,2005. TheU.S.EnvironmentalProtectionAgencyonJanuary10,2006.
TheeffectivedateofthisTMDLis:January24,2006.
The following table includes the elements of this TMDL.
Table 7-10.1. Malibu Creek and Lagoon Bacteria TMDL: ElementsTMDL Element Key Findings and Regulatory Provisions
Problem Statement Elevated bacterial indicator densities are causing impairment of the water contactrecreation(REC-1)beneficialuseatMalibuCreek,Lagoon,andadjacent beach. Swimming in waters with elevated bacterial indicator densities haslongbeenassociatedwithadversehealtheffects.Specifically,localandnational epidemiological studies compel the conclusion that there is a causal relationship between adverse health effects and recreational water quality, as measured by bacterial indicator densities.
Numeric Target (Interpretation of the numeric water quality objective, used to calculate the waste load allocations)
The TMDL has a multi-part numeric target based on the bacteriological water quality objectives for marine and fresh water to protect the water contact recreation use. These targets are the most appropriate indicators of public health risk in recreational waters.
These bacteriological objectives are set forth in Chapter 3 of the Basin Plan.1 The objectives are based on four bacterial indicators and include both geometric mean limits and single sample limits. The Basin Plan objectives that serve as the numeric targets for this TMDL are:
In Marine Waters Designated for Water Contact Recreation (REC-1)
1.GeometricMeanLimitsa. Total coliform density shall not exceed 1,000/100 ml. b. Fecal coliform density shall not exceed 200/100 ml.c. Enterococcus density shall not exceed 35/100 ml.
2. Single Sample Limitsa. Total coliform density shall not exceed 10,000/100 ml.b.Fecalcoliformdensityshallnotexceed400/100ml.c.Enterococcusdensityshallnotexceed104/100ml.d. Total coliform density shall not exceed 1,000/100 ml, if the
ratio of fecal-to-total coliform exceeds 0.1.

Basin Plan 7-�06 Total Maximum Daily LoadsUpdated September 20��
TMDL Element Key Findings and Regulatory Provisions
Numeric Target (continued)(Interpretation of the numeric water quality objective, used to calculate the waste load allocations)
In Fresh Waters Designated for Water Contact Recreation (REC-1)
1.GeometricMeanLimitsa. E. coli density shall not exceed 126/100 ml.b. Fecal coliform density shall not exceed 200/100 ml.
2. Single Sample Limitsa. E. coli density shall not exceed 235/100 ml.b.Fecalcoliformdensityshallnotexceed400/100ml.
These objectives are generally based on an acceptable health risk for marine recreational waters of 19 illnesses per 1,000 exposed individuals as set by theUSEPA(USEPA,1986).Thetargetsapplythroughouttheyear.Thefinalcompliancepointforthetargetsisthepointatwhichtheeffluentfromadischarge initially mixes with the receiving water.
Implementation of the above bacteria objectives and the associated TMDL numeric targets is achieved using a ‘reference system/anti-degradation approach’ratherthanthealternative‘naturalsourcesexclusionapproach’orstrictapplicationofthesinglesampleobjectives.AsrequiredbytheCWAandPorter-CologneWaterQualityControlAct,BasinPlansincludebeneficialusesof waters, water quality objectives to protect those uses, an anti-degradation policy, collectively referred to as water quality standards, and other plans and policies necessary to implement water quality standards. The ‘reference system/anti-degradationapproach’meansthatonthebasisofhistoricalexceedance levels at existing monitoring locations, including a local reference beach within Santa Monica Bay, a certain number of daily exceedances of the single sample bacteria objectives are permitted. The allowable number of exceedance days is set such that (1) bacteriological water quality at any site is at least as good as at a designated reference site within the watershed and (2) there is no degradation of existing bacteriological water quality. This approach recognizes that there are natural sources of bacteria that may cause or contribute to exceedances of the single sample objectives and that it is not the intent of the Regional Board to require treatment or diversion of natural coastal creeks or to require treatment of natural sources of bacteria from undeveloped areas.
The geometric mean targets may not be exceeded at any time. The rolling 30-day geometric means will be calculated on each day. If weekly sampling is conducted, the weekly sample result will be assigned to the remaining days of the week in order to calculate the daily rolling 30-day geometric mean. For the single sample targets, each existing monitoring site is assigned an allowable number of exceedance days for three time periods (1) summer dry-weather (April1toOctober31),(2)winterdry-weather(November1toMarch31),and(3)wet-weather(definedasdayswith0.1inchofrainorgreaterandthethree days following the rain event.)
Source Analysis Fecal coliform bacteria may be introduced from a variety of sources including storm water runoff, dry-weather runoff, onsite wastewater treatment systems, andanimalwastes.Aninventoryofpossiblepointandnonpointsourcesof fecal coliform bacteria to the waterbody was compiled, and both simple methods and computer modeling were used to estimate bacteria loads for those sources. Source inventories were used in the analysis to identify all potential sources within the Malibu Creek watershed, modeling was used to identify the potential delivery of pathogens into the creeks and the lagoon.
Basin Plan 7-�07 Total Maximum Daily LoadsUpdated September 20��
TMDL Element Key Findings and Regulatory Provisions
Loading Capacity Theloadingcapacityisdefinedintermsofbacterialindicatordensities,whichis the most appropriate for addressing public health risk, and is equivalent tothenumerictargets,listedabove.Asthenumerictargetsmustbemetatthepointwheretheeffluentfromstormdrainsorotherdischargeinitiallymixes with the receiving water throughout the day, no degradation or dilution allowance is provided.
Waste Load Allocations (for point sources)
WasteLoadAllocations(WLAs)areexpressedasthenumberofdailyor weekly sample days that may exceed the single sample limits or 30-daygeometricmeanlimitsasidentifiedunder“NumericTarget.”WLAsareexpressedasallowableexceedancedaysbecausethebacterial density and frequency of single sample exceedances are the most relevant to public health protection.
Zero days of exceedance are allowed for the 30-day geometric mean limits. The allowable days of exceedance for the single sample limits differ depending on season, dry weather or wet-weather, and by samplinglocationsasdescribedinTable7-10.2.
The allowable number of exceedance days for a monitoring site for each time period is based on the lesser of two criteria (1) exceedance days in the designated reference system and (2) exceedance days based on historical bacteriological data at the monitoring site. This ensures that bacteriological water quality is at least as good as that of a largely undeveloped system and that there is no degradation of existing water quality. However, existing data indicates that the number of exceedance days for all locations assessed in this TMDL were greater than the allowable exceedance days (i.e., number of exceedance days greater than the number at the reference sites).
For each monitoring site, allowable exceedance days are set on an annual basis as well as for three time periods. These three periods are:1.summerdry-weather(April1toOctober31)2. winter dry-weather (November 1 to March 31)3. wet-weather(definedasdaysof0.1inchofrainormoreplusthree
days following the rain event).
The responsible jurisdictions and responsible agencies are the County ofLosAngeles,CountyofVentura,thecitiesofMalibu,Calabasas,AgouraHills,HiddenHills,SimiValley,WestlakeVillage,andThousand Oaks; Caltrans, and the California Department of Parks and Recreation.The responsible jurisdictions and responsible agencies include the permittees and co-permittees of the municipal storm water (MS4)permitsforLosAngelesCountyandVenturaCounty,andCaltrans. The storm water permittees are individually responsible for the discharges from their municipal separate storm sewer systems to Malibu Creek, Malibu Lagoon or tributaries thereto.

Basin Plan 7-�08 Total Maximum Daily LoadsUpdated September 20��
TMDL Element Key Findings and Regulatory Provisions
Waste Load Allocations (for point sources)(continued)
The California Department of Parks and Recreation (State Parks), as the owner of the Malibu Lagoon and Malibu Creek State Park, is the responsible agency for these properties. However, since the reference watershed approach used in developing this TMDL is intended to make allowances for natural sources, State Parks is only responsible for: conducting a study of bacteria loadings from birds in the Malibu Lagoon, water quality monitoring, and compliance with load allocations applicable to anthropogenic sources on State Park property (e.g., onsite wastewater treatment systems). The Santa Monica Mountains Conservancy and the National Park Service as the owner of natural parkland also are responsible for water quality monitoring and compliance with load allocations resulting from anthropogenic sources (e.g.,onsite wastewater treatment systems) from lands under their jurisdiction.
Asdiscussedin“SourceAnalysis”,dischargesfromTapiaWWRFandeffluentirrigation,andgeneralconstructionstormwaterpermitsarenotexpectedtobeasignificantsourceofbacteria.Therefore,theWLAsfor these discharges are zero (0) days of allowable exceedances for all three time periods and for the single sample limits and the rolling 30-day geometric mean.
Load Allocations (for nonpoint sources)
LoadAllocations(LA)areexpressedasthenumberofdailyorweeklysampledays that may exceed the single sample limits or 30-day geometric mean limitsasidentifiedunder“NumericTarget.”LAsareexpressedasallowableexceedance days because the bacterial density and frequency of single sample exceedances are the most relevant to public health protection.
Zero days of exceedance are allowed for the 30-day geometric mean limits. The allowable days of exceedance for the single sample limits differ depending on season, dry weather or wet-weather, and by sampling locations as described inTable7-10.2.
The allowable number of exceedance days for a monitoring site for each time period is based on the lesser of two criteria (1) exceedance days in the designated reference system and (2) exceedance days based on historical bacteriological data at the monitoring site. This ensures that bacteriological water quality is at least as good as that of a largely undeveloped system and that there is no degradation of existing water quality. However, existing data indicates that the number of exceedance days for all locations assessed in this TMDL were greater than the allowable exceedance days.
For each monitoring site, allowable exceedance days are set on an annual basis as well as for three time periods. These three periods are:1.summerdry-weather(April1toOctober31)2. winter dry-weather (November 1 to March 31)3.wet-weather(definedasdaysof0.1inchofrainormoreplusthreedays following the rain event).
Onsitewastewatertreatmentsystemswereidentifiedasthemajornonpointanthropogenic source within the watershed. The responsible agencies are the county and city health departments and/or other local agencies that oversee installation and operation of on-site wastewater treatment systems. However, owners of on-site wastewater treatment systems are responsible for actual discharges.

Basin Plan 7-�09 Total Maximum Daily LoadsUpdated September 20��
TMDL Element Key Findings and Regulatory Provisions
Implementation The regulatory mechanisms to implement the TMDL may include, but arenotlimitedtotheLosAngelesCountyMunicipalStormWaterNPDESPermit(MS4),VenturaCountyMunicipalStormWaterNPDESPermit,the Caltrans Storm Water Permit, waste discharge requirements (WDRs), MOUs, revised MOUs, general NPDES permits, general industrial storm water permits, general construction storm water permits, and the authority containedinSections13225,13263and13267oftheWaterCode.EachNPDESpermitassignedaWLAshallbereopenedoramendedatreissuance,inaccordancewithapplicablelaws,toincorporatetheapplicableWLAsasapermit requirement. This TMDL will be implemented in three phases over a ten-yearperiodasoutlinedinTable7-10.3.Withinthreeyearsoftheeffectivedate of the TMDL, compliance with the allowable number of summer dry-weather exceedance days and the rolling 30-day geometric mean targets must be achieved. In response to a written request from the responsible jurisdiction orresponsibleagencysubjecttoconditionsdescribedinTable7-10.3,theExecutiveOfficeroftheRegionalBoardmayextendthecompliancedateforthe summer dry-weather allocations from 3 to up to six years from the effective date of this TMDL Within six years of the effective date of the TMDL, compliance with the allowable number of winter dry-weather exceedance days and the rolling 30-day geometric mean targets must be achieved.Within ten years of the effective date of the TMDL, compliance with the allowable number of wet-weather exceedance days and rolling 30-day geometric mean targets must be achieved.
To be consistent with the Santa Monica Bay (SMB) Beaches TMDLs, the Regional Board intends to reconsider this TMDL in coordination with the reconsideration of the SMB Beaches TMDLs. The SMB Beaches TMDLs arescheduledtobereviewedinJuly2007(fouryearsfromtheeffectivedateof the SMB Beaches TMDLs). The review will include a possible revision to the allowable winter dry-weather and wet-weather exceedance days based on additional data on bacterial indicator densities in the wave wash; to re-evaluate the reference system selected to set allowable exceedance levels; and to re-evaluate the reference year used in the calculation of allowable exceedance days. In addition, the method for applying the 30-day geometric mean limit also will be reviewed. The Malibu Creek Bacteria TMDL is scheduled to be reconsidered in three years from the effective date, which is expected to approximately coincide with the reassessment required under the SMB Beaches TMDLs.
Margin of Safety Amarginofsafetyhasbeenimplicitlyincludedthroughthefollowingconservative assumptions. • The watershed loadings were based on the 90th percentile year for
rain (1993) based on the number of wet weather days. This should provide conservatively high runoff from different land uses for sources of storm water loads
• The watershed loadings were also based on a very dry rain year (1994).Thisensurescompliancewiththenumerictargetduringlowflowswhensepticsystemsanddryurbanrunoffloadsarethemajorbacterial sources.

Basin Plan 7-��0 Total Maximum Daily LoadsUpdated September 20��
TMDL Element Key Findings and Regulatory Provisions
Margin of Safety (continued) • The TMDL was based on meeting the fecal 30-day geometric mean target of 200 MPN/ 100 ml, which for these watersheds was estimated to be more stringent level than the allowable exceedance of the single sample standard. This approach also provides assurance that the E. coli single sample standard will not be exceed.
• The load reductions established in this TMDL were based on reduction requiredduringthetwodifferentcriticalyearconditions.Awetyearwhen storm loads are high, and a more typical dry year when base flowsandassimilativecapacityislow.Thisaddsamarginofsafetyfor more typical years.
In addition, an explicit margin of safety has been incorporated, as the load allocations will allow exceedances of the single sample targets no more than 5% of the time on an annual basis, based on the cumulative allocations proposed for dry and wet weather. Currently, the Regional Board concludes that there is water quality impairment if more than 10% of samples at a site exceed the single sample bacteria objectives annually.
Seasonal Variations and Critical Conditions
Seasonal variations are addressed by developing separate waste load allocations for three time periods (summer dry-weather, winter-dry weather, and wet-weather) based on public health concerns and observed natural background levels of exceedance of bacterial indicators.
To establish the critical condition for the wet days, we used rain data from 1993.BasedondatafromtheRegionalBoard’sSantaMonicaBayTMDLthisrepresentsthe90thpercentilerainyearbasedonraindatafrom1947to2000.To further evaluate the critical conditions, we modeled a representative dry year.Thedry-yearcriticalconditionwasbasedon1994,whichwasthe50th percentileyearintermsofdryweatherdaysfortheperiodof1947-2000.
Compliance Monitoring Responsible jurisdictions and agencies shall submit a compliance monitoring plantotheExecutiveOfficeroftheRegionalBoardforapproval.Thecompliance monitoring plan shall specify sampling frequency (daily or weekly) and sampling locations and that will serve as compliance points. This compliance monitoring program is to determine the effectiveness of the TMDL and not to determine compliance with individual load or wasteload allocations for purposes of enforcement.
If the number of exceedance days is greater than the allowable number of exceedance days the water body segment shall be considered out-of-compliance with the TMDL. Responsible jurisdictions or agencies shall not be required to initiate an investigation detailed in the next paragraph if a demonstration is made that bacterial sources originating within the jurisdiction of the responsible agency have not caused or contributed to the exceedance.
If a single sample shows the discharge or contributing area to be out of compliance, the Regional Board may require, through permit requirements or theauthoritycontainedinWaterCodesection13267,dailysamplingatthedownstream location (if it is not already) until all single sample events meet bacteria water quality objectives. Furthermore, if a creek location is out of compliance as determined in the previous paragraph, the Regional Board shall require responsible agencies to initiate an investigation, which at a minimum shall include daily sampling in the target receiving waterbody reach or at the existing monitoring location until all single sample events meet bacteria water quality objectives.

Basin Plan 7-��� Total Maximum Daily LoadsUpdated September 20��
TMDL Element Key Findings and Regulatory Provisions
Compliance Monitoring (continued)
TheCountyofLosAngeles,CountyofVentura,andmunicipalitieswithintheMalibu Creek watershed, Caltrans, and the California Department of Parks and Recreation are strongly encouraged to pool efforts and coordinate with other appropriate monitoring agencies in order to meet the challenges posed by this TMDL by developing cooperative compliance monitoring programs.
Note: The complete staff report for the TMDL is available for review upon request.
1 The bacteriological objectives were revised by a Basin Plan amendment adopted by the Regional Board on October 25, 2001,andsubsequentlyapprovedbytheStateWaterResourcesControlBoard,theOfficeofAdministrativeLawandfinallybyU.S.EPAonSeptember25,2002.

Bas
in P
lan
7
-��2
To
tal M
axim
um D
aily
Loa
dsU
pdat
ed S
epte
mbe
r 20�
�
Tabl
e 7-
10.2
. Mal
ibu
Cre
ek a
nd L
agoo
n B
acte
ria
TM
DL
: Fin
al A
nnua
l Allo
wab
le E
xcee
danc
e D
ays f
or S
ingl
e Sa
mpl
e L
imits
by
Sam
plin
g L
ocat
ion
Com
plia
nce
Dea
dlin
e 3
* ye
ars a
fter
eff
ectiv
e da
te6
year
s aft
er e
ffec
tive
date
10 y
ears
aft
er e
ffec
tive
date
Sum
mer
Dry
Wea
ther
^W
inte
r Dry
Wea
ther
^**
Wet
Wea
ther
^**
April1–October31
Nov
embe
r 1 -
Mar
ch 3
1N
ovem
ber 1
- O
ctob
er 3
1
Stat
ion
IDLo
catio
n N
ame
Dai
ly
sam
plin
g (N
o.
days
)
Wee
kly
sam
plin
g (N
o.
days
)
Dai
ly
sam
plin
g (N
o. d
ays)
Wee
kly
sam
plin
g (N
o.
days
)
Dai
ly
sam
plin
g (N
o. d
ays)
Wee
kly
sam
plin
g (N
o.
days
)
LARWQCB
Triu
nfo
Cre
ek0
03
117
3
LARWQCB
Low
er L
as V
irgen
es C
reek
00
31
173
LARWQCB
Low
er M
edea
Cre
ek0
03
117
3
LVM
WD
(R-9
)U
pper
Mal
ibu
Cre
ek, a
bove
Las
Virg
enes
Cre
ek
00
31
173
LVM
WD
(R-2
)M
iddl
e M
alib
u C
reek
, bel
ow T
apia
dis
char
ge 0
010
03
117
3
LVM
WD
(R-3
)Lo
wer
Mal
ibu
Cre
ek, 3
mi b
elow
Tap
ia0
03
117
3
LVMWD(R
-4)
Mal
ibu
Lago
on, a
bove
PC
H0
03
117
3
LVM
WD
(R-1
1)M
alib
u La
goon
, bel
ow P
CH
00
31
173
----
--OthersamplingstationsasidentifiedintheCom
pliance
Mon
itorin
g Pl
an a
s app
rove
d by
the
Exec
utiv
e Officerincludingatleastonesamplingstationineach
subw
ater
shed
, and
are
as w
here
freq
uent
REC
-1 u
se is
kn
own
to o
ccur
.
00
31
173
Notes
: The
numb
er of
allow
able
exce
edan
ces i
s bas
ed on
the l
esse
r of (
1) th
e refe
renc
e sys
tem or
(2) e
xistin
g lev
els of
exce
edan
ce ba
sed o
n hist
orica
l mon
itorin
g data
.Th
e allo
wable
numb
er of
exce
edan
ce da
ys du
ring w
inter
dry-w
eathe
r is ca
lculat
ed ba
sed o
n the
10th
perce
ntile
storm
year
in te
rms o
f dry
days
at th
e LAX
mete
orolo
gical
statio
nTh
e allo
wable
numb
er of
exce
edan
ce da
ys du
ring w
et-we
ather
is ca
lculat
ed ba
sed o
n the
90th
perce
ntile
storm
year
in te
rms o
f wet
days
at th
e LAX
mete
orolo
gical
statio
n.^ A
dry d
ay is
defin
ed as
a no
n-we
t day
. A w
et da
y is d
efine
d as a
day w
ith a
0.1-in
ch or
mor
e of r
ain an
d the
thre
e day
s foll
owing
the r
ain ev
ent.
* The
comp
lianc
e date
may
be ex
tende
d by t
he E
xecu
tive O
fficer
to up
to 6
year
s fro
m the
effec
tive d
ate.
* *A
revis
ion of
the T
MDL i
s sch
edule
d for
four
year
s afte
r the
effec
tive d
ate of
the S
anta
Monic
a Bay
Bea
ches
TMD
Ls in
orde
r to r
e-ev
aluate
the a
llowa
ble ex
ceed
ance
days
durin
g wint
er dr
y-wea
ther a
nd w
et-we
ather
base
d on a
dditio
nal
monit
oring
data
and t
he re
sults
of th
e stud
y of r
elativ
e loa
ding f
rom
storm
drain
s ver
sus b
irds.
Basin Plan 7-��� Total Maximum Daily LoadsUpdated September 20��
Table 7-10.3. Malibu Creek and Lagoon Bacteria TMDL: Significant DatesDate Action120 days after the effective date of this TMDL
Responsible jurisdictions and responsible agencies must submit a comprehensive bacteria water quality monitoring plan for the Malibu Creek Watershed to the Executive OfficeroftheRegionalBoard.TheplanmustbeapprovedbytheExecutiveOfficerbeforethemonitoringdatacanbe considered during the implementation of the TMDL. In developingthe13267order,theEOwillconsidercostsinrelationtotheneedfordata.Withrespecttobenefitstobegained,theTMDLstaffreportdemonstratesthesignificantimpairment and bacteria loading. Further documenting success or failure in achieving waste load allocations will benefittheresponsibleagenciesandallrecreationalwaterusers.
The purpose of the plan is to better characterize existing water quality as compared to water quality at the reference watershed,-and ultimately, to serve as a compliance monitoring plan. The plan must provide for analyses of all applicable bacteria indicators for which the Basin Plan has established objectives including E. coli. For fresh water and enterococcus for marine water. The plan must also include samplinglocationsthatarespecifiedinTable7-10.2,atleast one location in each subwatershed, and areas where frequent REC-1 use is known to occur. However, this is not to imply that a mixing zone has been applied; water quality objectives apply throughout the watershed—not just at the sampling locations.
1 year after effective date of this TMDL
1. Responsible jurisdictions and responsible agencies shall provide a written report to the Regional Board outlining how each intends to cooperatively achieve compliance with the TMDL. The report shall include implementation methods, an implementation schedule, andproposedmilestones.Specifically,theplanmustinclude a comprehensive description of all steps to be taken to meet the 3-year summer dry weather compliance schedule, including but not limited to a detailed timeline for all category of bacteria sources under their jurisdictions including but not limited to nuisanceflows,urbanstormwater,on-sitewastewatertreatment systems, runoff from homeless encampments, horse facilities, and agricultural runoff.

Basin Plan 7-��4 Total Maximum Daily LoadsUpdated September 20��
Date Action1 year after effective date of this TMDL (continued)
2. If the responsible jurisdiction or agency is requesting an extension of the summer dry-weather compliance schedule, the plan must include a description of all local ordinances necessary to implement the detailed workplan and assurances that such ordinances have been adopted before the request for an extension is granted.
3. Local agencies regulating on-site wastewater treatment systems shall provide a written report to the Regional Board’sExecutiveOfficerdetailingtherationaleandcriteria used to identify high-risk areas where on-site systems have a potential to impact surface waters in the Malibu Creek watershed. Local agencies may use the approaches outlined below in (a) and (b), or an alternative approach as approved by the Executive Officer.(a) Responsible agencies may screen for high-risk
areas by establishing a monitoring program to determine if discharges from OWTS have impacted or are impacting water quality in Malibu Creek and/oritstributaries.Asurfacewatermonitoringprogram demonstration must include monitoring locations upstream and downstream of the discharge, as well as a location at mid-stream (or at the approximate point of discharge to the surface water) of single or clustered OWTS. Surface water sampling frequency will be weekly for bacteria indicatorsandmonthlyfornutrients.Asuccessfuldemonstrationwillshownostatisticallysignificantincrease in bacteria levels in the downstream sampling location(s).
(b) Responsibleagenciesmaydefinetheboundariesof high-risk or contributing areas or identify individual OWTS that are contributing to bacteria water quality impairments through groundwater monitoring or through hydrogeologic modeling as described below:(1) Groundwatermonitoringmustinclude
monitoring in a well no greater than 50-feet hydraulically downgradient from the furthermost extent of the disposal area, or property line of the discharger, whichever is less.Ataminimum,samplingfrequencyfor

Basin Plan 7-��5 Total Maximum Daily LoadsUpdated September 20��
Date Action1 year after effective date of this TMDL (continued)
groundwater monitoring will be quarterly. The number, location and construction details of all monitoring wells are subject to approval of the ExecutiveOfficer.
(2) Responsible agencies may use a risk assessment approach, which uses hydrogeologicmodelingtodefinetheboundaries of the high-risk and contributing areas.AworkplanfortheriskassessmentstudymustbeapprovedbytheExecutiveOfficerofthe Regional Board.
4. OWTSlocatedinhigh-riskareasaresubjecttosystemupgrades as necessary to demonstrate compliance withapplicableeffluentlimitsand/orreceivingwaterobjectives.
5. If a responsible jurisdiction or agency is requesting an extension to the wet-weather compliance schedule, the plan must include a description of the integrated water resources (IRP) approach to be implemented, identificationofpotentialmarketsforwaterre-use,an estimate of the percentage of collected stormwater thatcanbere-used,identificationofnewlocalordinances that will be required, a description of new infrastructure required, a list of potential adverse environmental impacts that may result from the IRP,andaworkplanandschedulewithsignificantmilestonesidentified.Compliancewiththewet-weatherallocations shall be as soon as possible but under no circumstances shall it exceed 10 years for non-
integrated approaches or extend beyond July 15, 2021 for an integrated approach. The Regional Board staff will bring to the Regional Board the aforementioned plans for consideration of extension of the wet-weather compliance date as soon as possible.
2 years after the effective date of this TMDL
The California Department of Parks and Recreation shall providetheRegionalBoardExecutiveOfficer,areportquantifying the bacteria loading from birds to the Malibu Lagoon.
TheRegionalBoard’sExecutiveOfficershallrequirethe responsible jurisdictions and responsible agencies to provide the Regional Board with a reference watershed study.Thestudyshallbedesignedtocollectsufficientinformation to establish a defensible reference condition for the Malibu Creek and Lagoon watershed.

Basin Plan 7-��6 Total Maximum Daily LoadsUpdated September 20��
Date Action3 years after effective date of this TMDL**
** May be extended to up to 6 years from the effective date of this TMDL
AchievecompliancewiththeapplicableLoadAllocationsandWasteLoadAllocations,asexpressedintermsofallowable days of exceedances of the single sample bacteria limits and the 30-day geometric mean limit during summerdry-weather(April1toOctober31).Inresponseto a written request from a responsible jurisdiction or responsibleagency,theExecutiveOfficeroftheRegionalBoard may extend the compliance date for the summer dry-weather allocations from 3 years to up to 6 years from theeffectivedateofthisTMDL.TheExecutiveOfficer’sdecision to extend the summer dry-weather compliance date must be based on supporting documentation to justify the extension, including a detailed work plan, budget and contractual or other commitments by the responsible jurisdiction or responsible agency.
3 years after effective date of this TMDL
The Regional Board shall reconsider this TMDL to:
(1) Consider a natural source exclusion for bacteria loadings from birds in the Malibu Lagoon if all anthropogenic sources to the Lagoon have been controlled.
(2) Reassess the allowable winter dry-weather and wet-weather exceedances days based on additional data on bacterial indicator densities, and an evaluation of site-specificvariabilityinexceedancelevelstodeterminewhether existing water quality is better than water quality at the reference watershed,
(3) Reassess the allowable winter dry-weather and wet-weather exceedance days based on a re-evaluation of the selected reference watershed and consideration of other reference watersheds that may better represent reaches of the Malibu Creek and Lagoon.
(4) Considerwhethertheallowablewinterdry-weatherand wet-weather exceedance days should be adjusted annually dependent on the rainfall conditions and an evaluation of natural variability in exceedance levels in the reference system(s),
(5) Re-evaluate the reference year used in the calculation of allowable exceedance days, and
(6) Re-evaluate whether there is a need for further clarificationorrevisionofthegeometricmeanimplementation provision.
6 years after the effective date of this TMDL
AchievecompliancewiththeapplicableLoadAllocationsandWasteLoadAllocations,expressedasallowableexceedance days during winter dry weather (November 1-March 31) single sample limits and the rolling 30-day geometric mean limit.

Basin Plan 7-��7 Total Maximum Daily LoadsUpdated September 20��
Date Action10 years after the effective date of this TMDL
** May be extended up to July 15, 2021.
Achievecompliancewiththewet-weatherLoadAllocationsandWasteLoadAllocations(expressedasallowableexceedancedays for wet weather and compliance with the rolling 30-day geometric mean limit.)
The Regional Board may extend the wet-weather compliance dateuptoJuly15,2021attheRegionalBoard’sdiscretion,byadopting a subsequent Basin Plan amendment that complies with applicable law.

Basin Plan 7-��8 Total Maximum Daily LoadsUpdated September 20��

Basin Plan 7-��9 Total Maximum Daily LoadsUpdated September 20��
7-11 Los Angeles Harbor Bacteria TMDL - Inner Cabrillo Beach and Main Ship Channel
This TMDL was adopted by: TheRegionalWaterQualityControlBoardonJuly1,2004.
This TMDL was approved by: TheStateWaterResourcesControlBoardonOctober21,2004. TheOfficeofAdministrativeLawonJanuary5,2005. TheU.S.EnvironmentalProtectionAgencyonMarch1,2005.
The effective date of this TMDL is: March 10, 2005.
The following table includes the elements of this TMDL.
Table 7-11.1. Los Angeles Harbor Bacteria TMDL (Inner Cabrillo Beach and Main Ship Channel): Elements
Element Key Findings and Regulatory ProvisionsProblem Statement Elevated bacterial indicator densities are causing impairment of the
watercontactrecreation(REC-1)beneficialuseofInnerCabrilloBeachand the potential REC-1 uses of the Main Ship Channel in the Los AngelesHarbor.Swimminginmarinewaterswithelevatedbacterialindicator densities has long been associated with adverse health effects. Specifically,localandnationalepidemiologicalstudiescompeltheconclusion that there is a causal relationship between adverse health effects and recreational water quality, as measured by bacterial indicator densities.
Numeric Target (Interpretation of the numeric water quality objective, used to calculate the waste load allocations)
The TMDL has a multi-part numeric target based on the bacteriological water quality objectives for marine waters to protect the water contact recreation use. These targets are the most appropriate indicators of public health risk in recreational waters.
These bacteriological objectives are set forth in Chapter 3 of the Basin Plan.1 The objectives are based on four bacterial indicators and include both geometric mean limits and single sample limits. The Basin Plan objectives that serve as the numeric targets for this TMDL are:
1.Rolling30-dayGeometricMeanLimitsa. Total coliform density shall not exceed 1,000/100 ml.b. Fecal coliform density shall not exceed 200/100 ml.c. Enterococcus density shall not exceed 35/100 ml.
2. Single Sample Limitsa. Total coliform density shall not exceed 10,000/100 ml.b. Fecalcoliformdensityshallnotexceed400/100ml.c. Enterococcusdensityshallnotexceed104/100ml.d. Total coliform density shall not exceed 1,000/100 ml, if the
ratio of fecal-to-total coliform exceeds 0.1.

Basin Plan 7-�20 Total Maximum Daily LoadsUpdated September 20��
Element Key Findings and Regulatory ProvisionsNumeric Target (Interpretation of the numeric water quality objective, used to calculate the waste load allocations)(continued)
These objectives are generally based on an acceptable health risk for marine recreational waters of 19 illnesses per 1,000 exposed individuals assetbytheUSEPA.ForCabrilloBeach,thetargetswillapplyatexisting monitoring sites, with samples taken at ankle depth as they are now. For the Main Ship Channel, the targets will apply at existing or newmonitoringsiteswithsamplescollectedatthesurface.AnynewmonitoringsitesmustbeapprovedbytheExecutiveOfficer.Thesetargets apply during both dry and wet weather, since there is water contact recreation throughout the year, including during wet weather.
Implementation of the above bacteria objectives and the associated TMDL numeric targets is achieved using a ‘reference system/anti-degradationapproach’ratherthanthealternative‘naturalsourcesexclusionapproachsubjecttoantidegradationpolicies’orstrictapplicationofthesinglesampleobjectives.AsrequiredbytheCWAandPorter-CologneWaterQualityControlAct,BasinPlansincludebeneficialusesofwaters,waterqualityobjectivestoprotectthoseuses,and an anti-degradation policy, collectively referred to as water quality standards, and other plans and policies necessary to implement water quality standards. This TMDL and its associated waste load allocations, which shall be incorporated into relevant permits, and load allocations arethevehiclesforimplementationoftheRegion’sstandards.
The‘referencesystem/anti-degradationapproach’meansthatonthebasis of historical exceedance levels at existing monitoring locations, including a local reference beach within Santa Monica Bay, a certain number of daily exceedances of the single sample bacteria objectives are permitted. The allowable number of exceedance days is set such that (1) bacteriological water quality at any site is at least as good as at a designated reference site within the watershed and (2) there is no degradation of existing bacteriological water quality. This approach recognizes that there are natural sources of bacteria that may cause or contribute to exceedances of the single sample objectives and that it is not the intent of the Regional Board to require treatment or diversion of natural coastal creeks or to require treatment of natural sources of bacteria from undeveloped areas.
The geometric mean targets may not be exceeded at any time. The rolling 30-day geometric means will be calculated on each day. For the single sample targets, each existing monitoring site is assigned an allowable number of exceedance days for three time periods (1) summerdry-weather(April1toOctober31),(2)winterdry-weather(November1toMarch31),and(3)wet-weather(definedasdayswith0.1 inch of rain or greater and the three days following the rain event.)

Basin Plan 7-�2� Total Maximum Daily LoadsUpdated September 20��
Element Key Findings and Regulatory ProvisionsSource Analysis Dry-weather urban runoff and storm water conveyed by storm drains
are major sources of elevated bacterial indicator densities to Inner Cabrillo Beach and the Main Ship Channel during dry and wet-weather. AsofMarch2004,thereare15activeindividualand15activegeneral,NPDESpermitsfordischargestotheInnerorOuterLosAngelesHarbor including the Terminal Island Treatment Plant. While the fecalcoliformcountsinthewastewaterfieldindicateacontributionofbacteria to the Harbor by the Terminal Treatment Plant, the wastewater fieldissufficientlydilutedandthebacterialdensitiesaresomuchlowerin the Harbor than the high bacterial densities and exceedences at the sites at Cabrillo Beach and in the Main Ship Channel that it appears that theTreatmentPlantisnotasignificantsourceofbacteriatotheBeachor to the Ship Channel.
Potential nonpoint sources of bacterial contamination at Inner Cabrillo Beach and Main Ship Channel include marina activities such as waste disposal from boats, boat deck and slip washing, swimmer “wash-off”, restaurant washouts and natural sources from birds, waterfowl and other wildlife. The bacteria loads associated with these nonpoint sources are notwellquantified.However,bacterialcontaminationatthebeachisconcentrated in the shallow (ankle depth) waters more than even waters a few feet away (at knee or chest depth). This supports the contention that high bacterial densities may be largely from the beach, itself.
Loading Capacity Studies(forexample,Haile,R.W.,Witte,J.S.1997.Addendumto“Anepidemiological study of possible adverse health effects of swimming in Santa Monica Bay.” Santa Monica Bay Restoration Project) show that bacterial degradation and dilution during transport from the watershedtothereceivingwaterdonotsignificantlyaffectbacterialindicatordensities.Therefore,theloadingcapacityisdefinedinterms of bacterial indicator densities, which is the most appropriate for addressing public health risk, and is equivalent to the numeric targets,listedabove.Asthenumerictargetsmustbemetatthepointwheretheeffluentfromstormdrainsorothersourcesinitiallymixwith the receiving water throughout the day, no degradation or dilution allowance is provided.
Waste Load Allocations (for point sources)
Waste load allocations are expressed as allowable exceedance days because the bacterial density and frequency of single sample exceedances are the most relevant to public health protection.
The allowable number of exceedance days for a monitoring site for each time period is based on the lesser of two criteria (1) exceedance days in the designated reference system and (2) exceedance days based on historical bacteriological data at the monitoring site. This ensures that bacteriological water quality is at least as good as that of a largely undeveloped system and that there is no degradation of existing water quality.
For each monitoring site, allowable exceedance days are set on an annual basis as well as for three time periods. These three periods are:

Basin Plan 7-�22 Total Maximum Daily LoadsUpdated September 20��
Element Key Findings and Regulatory ProvisionsWaste Load Allocations (for point sources)(continued)
1. summerdry-weather(April1toOctober31)2. winter dry-weather (November 1 to March 31) 3. wet-weatherdays(definedasdaysof0.1inchofrainormoreplus
three days following the rain event).
FortheMSCandtheInnerHarbor,theCityofLosAngelesandtheCountyofLosAngelesaretheresponsibleagencies2. The City of Los AngelesistheprimaryjurisdictionbecauseInnerCabrilloBeachandMainShipChannelarelocatedentirelyintheCityofLosAngeles.TheLosAngelesHarborisownedandoperatedbytheCity.
AllproposedWLAsforsummer,dry-weather,singlesamplebacterialdensities in the MSC or the Inner Harbor are zero (0) days of allowable exceedances.3TheproposedWLAsforsinglesamplewinterdry-weatherandwet-weatherforthemonitoringlocationHW07isasshowninTable7-11.2.WLAsforstormdrainsintheInnerHarborforsummer, dry-weather, single sample bacterial densities are also zero (0) days of allowable exceedances. The waste load allocation for the rolling 30-day geometric mean during any time period or monitoring site in MSC or the Inner Harbor is zero (0) days of allowable exceedances.
Discharges from general NPDES permits, general industrial storm water permits and general construction storm water permits are not expectedtobeasignificantsourceofbacteria.Therefore,theWLAsfor these discharges are zero (0) days of allowable exceedances for all three time periods and for the single sample limits and the rolling 30-daygeometricmean.AnyfutureenrolleesunderageneralNPDESpermit, general industrial storm water permit or general construction stormwaterpermitwithintheWatershedwillalsobesubjecttoaWLAof zero days of allowable exceedances.
ForInnerCabrilloBeach,theCityofLosAngelesistheresponsibleagency.
FortheSouthernareaofInnerCabrilloBeach,theproposedWLAsfor summer, dry-weather, winter dry-weather and wet-weather single sample bacterial densities at the ICB swimming beach are zero (0) days of allowable exceedances. Further study of the storm drains on thenorthpartofICBmayleadtotheestablishmentofWLAsforsinglesample winter dry-weather and wet-weather for these storm drains.
The waste load allocation for the rolling 30-day geometric mean during any time period or monitoring site at ICB is zero (0) days of allowable exceedances.

Basin Plan 7-�2� Total Maximum Daily LoadsUpdated September 20��
Element Key Findings and Regulatory ProvisionsLoad Allocations (for nonpoint sources)
Load allocations are expressed as allowable exceedance days because the bacterial density and frequency of single sample exceedances are the most relevant to public health protection.
AllproposedLAsforsummer,dry-weather,winterdry-weatherandwet-weather, single sample bacterial densities in the MSC are zero (0) days of allowable exceedances The load allocation for the rolling 30-day geometric mean during any time period or monitoring site in MSC or the Inner Harbor is zero (0) days of allowable exceedances.
AllproposedLAsforsummer,dry-weather,singlesamplebacterialdensities at the ICB swimming beach are zero (0) days of allowable exceedances.TheproposedLAsforsinglesamplewinterdry-weatherand wet-weather for the monitoring locations CB1 and CB2 are as showninTable7-11.2.FurtherstudyofthethenorthpartofICBmayleadtotheestablishmentofLAsforthisarea.
The waste load allocation for the rolling 30-day geometric mean during any time period or monitoring site at ICB is zero (0) days of allowable exceedances.
Implementation The regulatory mechanisms used to implement the TMDL will include theLosAngelesCountyMunicipalStormWaterNPDESPermit(MS4),generalandindividualNPDESpermits,generalindustrialstorm water permits, general construction storm water permits, and the authoritycontainedinSections13263and13267oftheWaterCode.EachNPDESpermitassignedaWLAshallbereopenedoramendedat reissuance, in accordance with applicable laws, to incorporate theapplicableWLAsasapermitrequirement.Loadallocationsfornonpoint sources will be implemented within the context of this TMDL.
ThisTMDLwillbeimplementedinthreephasesoverafive-yearperiod(seeTable7-11.3.WithinfiveyearsoftheeffectivedateoftheTMDL,there shall be no allowable exceedances of the single sample limits at anylocationduringsummerdry-weather(April1toOctober31)orwinter dry-weather s (November 1 to March 31) and the rolling 30-daygeometricmeantargetsmustbeachieved.Withinfiveyearsoftheeffective date of the TMDL, compliance with the allowable number of wet-weather exceedance days and rolling 30-day geometric mean targets must be achieved.

Basin Plan 7-�24 Total Maximum Daily LoadsUpdated September 20��
Element Key Findings and Regulatory ProvisionsImplementation (continued) For those monitoring locations subject to the antidegradation provision
(HW07,wetweather),thereshallbenoincreaseinexceedancedaysduring the implementation period above the estimated days for the monitoringlocationinthecriticalyearasidentifiedinTable7-11.2.
The Regional Board intends to reconsider this TMDL, consistent with the scheduled reconsideraton of the Santa Monica Bay (SMB) beaches TMDLs. The SMB beaches TMDLs are scheduled to be reconsidered in four years to re-evaluate the allowable winter dry-weather and wet-weather exceedance days based on additional data on bacterial indicator densities in the wave wash; to re-evaluate the reference system selected to set allowable exceedance levels; to re-evaluate the reference year used in the calculation of allowable exceedance days, and to re-evaluate the need for revision of the geometric mean implementation provision.
The Regional Board intends to conduct a similar review of this TMDL within4yearsaftertheeffectivedate.Inaddition,ifasuitablereferencewatershed that is representative of an enclosed harbor has not been found by this time, the Regional Board may consider implementing a ‘natural source exclusion approach subject to antidegradation policies’ to theLosAngelesHarborinlieuofthe‘referencewatershed/antidegradationapproach’.
Margin of Safety Amarginofsafetyhasbeenimplicitlyincludedthroughseveralconservative assumptions, such as the assumption that no dilution takes placebetweentheon-shoresourcesandwheretheeffluentinitiallymixes with the receiving water, and that bacterial degradation rates are not fast enough to affect bacteria densities in the receiving water. In addition, an explicit margin of safety has been incorporated, as the load allocations will allow exceedances of the single sample targets no more than 5% of the time on an annual basis, based on the cumulative allocations proposed for dry and wet weather. Currently, the Regional Board concludes that there is water quality impairment if more than 10% of samples at a site exceed the single sample bacteria objectives annually.
Seasonal Variations and Critical Conditions
Seasonal variations are addressed by developing separate waste load allocations for three time periods (summer dry-weather, winter-dry weather, and wet-weather) based on public health concerns and observed natural background levels of exceedance of bacterial indicators.
The critical condition for bacteria loading is during wet weather, when historicmonitoringdataforLosAngelesHaborandthereferencebeachindicate greater exceedance probabilities of the single sample bacteria objectivesthenduringdry-weather.Tomorespecificallyidentifyacritical condition within wet-weather, in order to set the allowable exceedancedaysshowninTable7-11.2,the90th percentile ‘storm year’4 in terms of wet days5 is used as the reference year.
Basin Plan 7-�25 Total Maximum Daily LoadsUpdated September 20��
Element Key Findings and Regulatory ProvisionsSeasonal Variations and Critical Conditions (continued)
Selecting the 90th percentile year avoids a situation where the reference system is frequently out of compliance. It is expected that because responsible jurisdictions and agencies will be planning for this ‘worst-case’scenario,therewillbefewerexceedancedaysthanthemaximumallowed in drier years. Conversely, in the 10% of wetter years, it is expected that there may be more than the allowable number of exceedance days.
Compliance Monitoring TheCityofLosAngeleswillcontinuetomonitoratsitesCB1,CB2andHW07asrequiredbyTerminalIslandTreatmentPlantNPDESPermit.Thispermitisscheduledtoberevisedin2004andwillconsiderthisTMDL.Additionalmonitoringsitesmaybeaddedbyresponsibleparties as necessary and the compliance monitoring requirment may be moved to another permit if determined to be more appropriate by the Regional Board.
AspecialstudyshallbeconductedbytheCityofLosAnglesinthe North area of Inner Cabrillo Beach to assess water quality and compliance with the standards in this TMDL. The special study of the North portion of Inner Cabrillo Beach can include details to support development of a Natural Sources Exclusion in this area if it is found that natural sources such as birds are the sources of bacterial impairment of the northern area of Inner Cabrillo Beach.
BeachmonitoringsiteswillbetakenincompliancewithAB411andtheSouthernCaliforniaBeachWaterQualityWorkingGroupprocedures.Open water sampling sites will be taken at the surface.
AspecialstudyshallbeconductedbytheCountyofLosAngelesandCityofLosAngelestoassesswaterqualityandcompliancewiththestandards in this TMDL in the MSC. The schedules for special studies areshowninTable7-11.3.
Note: The complete staff report for the TMDL is available for review upon request.
1 The bacteriological objectives were revised by a Basin Plan amendment adopted by the Regional Board on October 25, 2001, and subsequentlyapprovedbytheStateWaterResourcesControlBoard,theOfficeofAdministrativeLawandfinallybyU.S.EPAonSeptember25, 2002.2ForthepurposesofthisTMDL,“responsiblejurisdictionsandresponsibleagencies”aredefinedas(1)localorstateagenciesthathavejurisdictionoverLosAngelesHarborincludingInnerCabrilloBeachandMainShipChannel,(2)localagenciesthatarepermitteesorco-permittees on a municipal storm water permit.3Inordertofullyprotectpublichealth,noexceedancesarepermittedatanymonitoringlocationduringsummerdry-weather(April1toOctober 31). In addition to being consistent with the two criteria, waste load allocations of zero (0) days of allowable exceedances are further supported by the fact that the California Department of Health Services has established minimum protective bacteriological standards – the sameasthenumerictargetsinthisTMDL–which,whenexceededduringtheperiodApril1toOctober31,resultinpostingabeachwithahealthhazardwarning(CaliforniaCodeofRegulations,Title17,Section7958).4ForpurposesofthisTMDL,a‘stormyear’meansNovember1toOctober31.The90thpercentilestormyearwas1993with75wetdaysattheLAXmeteorologicalstation.5Awetdayisdefinedasadaywithrainfallof0.1inchormoreplusthe3daysfollowingtherainevent.

Bas
in P
lan
7
-�26
To
tal M
axim
um D
aily
Loa
dsU
pdat
ed S
epte
mbe
r 20�
�
Tabl
e 7-
11.2
Los
Ang
eles
Har
bor
Bac
teri
a T
MD
L: F
inal
Allo
wab
le E
xcee
danc
e D
ays b
y Sa
mpl
ing
Loc
atio
n
Com
plia
nce
Dea
dlin
e5
year
saf
tere
ffect
ive
date
5yea
rsa
ftere
ffect
ive
date
5ye
ars
afte
reffe
ctiv
eda
te2
Summ
er D
ry W
eathe
r ^W
inter
Dry
Wea
ther ^
*W
et W
eathe
r ^*
April
1 - O
ctobe
r 31
Nove
mber
1 – M
arch
31No
vemb
er 1
- Octo
ber 3
1St
ation
IDLo
catio
n Nam
eDa
ily sa
mplin
g (N
o. da
ys)
Wee
kly sa
mplin
g (N
o. da
ys)
Daily
samp
ling
(No.
days
)W
eekly
samp
ling
(No.
days
)Da
ily sa
mplin
g (N
o. da
ys)
Wee
kly sa
mplin
g (N
o. da
ys)
CB
1;
CB
2Inn
er C
abrill
o Bea
ch0
03 (
LA)
1 (LA
)17
(LA)
3 (LA
)
HW
07Ma
in Sh
ip Ch
anne
l0
03 (
WLA
)1 (
WLA
)15
** (W
LA)
3** (
WLA
)
Not
es: T
he n
umbe
r of a
llow
able
exc
eeda
nces
is b
ased
on
the
less
er o
f (1)
the
refe
renc
e sy
stem
or (
2) e
xist
ing
leve
ls o
f exc
eeda
nce
base
d on
his
toric
al m
onito
ring
data
.Theallowablenum
berofexceedancedaysduringwinterdry-weatheriscalculatedbasedonthe10thpercentilestormyearintermso
fdrydaysattheLAXmeteorologicalstation
Theallowablenum
berofexceedancedaysduringwet-weatheriscalculatedbasedonthe90thpercentilestormyearintermso
fwetdaysattheLAXmeteorologicalstation.
^Adrydayisdefinedasanon-wetday.Awetdayisdefinedasadaywitha0.1-inchorm
oreofrainandthethreedaysfollowingtherainevent.
*ArevisionoftheTMDLisscheduledforfouryearsaftertheeffectivedateoftheLosAngelesHarborT
MDLinordertore-evaluatetheallowableexceedancedaysduring
win
ter d
ry-w
eath
er a
nd w
et-w
eath
er b
ased
on
addi
tiona
l mon
itorin
g da
ta a
nd th
e re
sults
of t
he st
udy
of re
lativ
e lo
adin
g fr
om so
urce
s inc
ludi
ng b
ut n
ot li
mite
d to
stor
m d
rain
s, bo
ats,
bird
s and
oth
er n
onpo
int s
ourc
es.
**TheMainShipChannel(H
W07)isalreadymeetingtheallowableexceedancedaysforw
etweatherandissu
bjecttotheantidegradationprovision;thereshallbenoincreasein
exce
edan
ce d
ays d
urin
g th
e im
plem
enta
tion
perio
d ab
ove
that
est
imat
ed fo
r the
mon
itorin
g lo
catio
n in
the
criti
cal y
ear (
15 d
ays/
daily
sam
plin
g, 3
day
s/w
eekl
y sa
mpl
ing)
.

Basin Plan 7-�27 Total Maximum Daily LoadsUpdated September 20��
Table 7-11.3 Los Angeles Harbor Bacteria TMDL (Inner Cabrillo Beach & Main Ship Channel): Significant Dates
Implementation Action Responsible Party Date
Implementation (ICB): Implement additional simple Best Management Practices at ICB including additional trash pickup and educational signage. (Tier 1)
• CityofLosAngeles Six months after Effective Date of TMDL.
Implementation (ICB): Submit Work Plan to Implement Best Management Practices and Source Control at ICB forExecutiveOfficerApprovalincluding,butnotlimitedto storm drain repair and reroute; inspect and repair gravity sewer line; implement sand cleaning; repair bird exclusion structure; additional education and signage. (Tier 1)
• CityofLosAngeles Six months after Effective Date of TMDL
Special Studies (ICB): Submit work plan to assess water quality in the northern area of Inner Cabrillo Beach for ExecutiveOfficerapprovalincludingaplantomonitornorthern ICB and assess the discharge from storm drains into the Saltwater Marsh (Tier 2).
• CityofLosAngeles Six months after Effective Date of TMDL.
Special Studies (MSC): Submit work plan to assess water qualityintheInnerHarborforExecutiveOfficerapprovalincluding a plan to monitor in proximity to selected storm drains. (Tier 2).
• CityofLosAngeles• CountyofLosAngeles
Six months after Effective Date of TMDL.
Implementation (ICB): Submit work plan for Tier 2 BMPsforExecutiveOfficerapproval,includingbutnotlimited to alteration of bird exclusion structure, control of sources from cat population, and sand management. (Tier 2)
• CityofLosAngeles Six months after Effective Date of TMDL
Implementation (ICB): Complete implementation of SourceControlandBMPsatICBasidentifiedinworkplan including, but not limited to storm drain repair and reroute; inspection and repair gravity sewer line; trash disposal, sand cleanup; and repair bird exclusion structure. (Tier 1)
• CityofLosAngeles Twelve months after Effective Date of TMDL
Compliance(ICB):AfterimplementationofTier1and2actions, submit results of monitoring to determine degree of compliance with allowable exceedance days. (Tier 3)
• CityofLosAngeles Two years after Effective Date of TMDL
Implementation (MSC): Based on the results of the MSC special studies and compliance evaluation, submit Work PlanforExecutiveOfficerapprovalforsourcecontrolordiversion of storm drains that are found to be sources of bacterial loading to the MSC.
• CityofLosAngeles• CountyofLosAngeles
Two-1/2 years after Effective Date of TMDL
Implementation (ICB): If compliance is not achieved at the southern portion of Inner Cabrillo Beach, provide reporttobeapprovedbytheExecutiveOfficerofTierIII actions, to include but not be limited to, nearshore circulation or treatment of shallow water improvements, with a time schedule to attain water quality objectives. (Tier 3)
• CityofLosAngeles Three years after Effective Date of TMDL

Basin Plan 7-�28 Total Maximum Daily LoadsUpdated September 20��
Regional Board shall reconsider this TMDL to:a) refineallowableexceedancedaysbasedonadditional
data on bacterial indicator densities b) re-evaluate the reference system selected to
set allowable exceedance levels, including a reconsideration of whether the allowable number of exceedance days should be adjusted annually dependant on the rainfall conditions and an evaluation of natural variability in the reference system(s), and if an appropriate reference system cannotbeidentifiedforthisenclosedharbor,evaluateusing the ‘natural sources exclusion approach subject toantidegradationpolicies’ratherthanthe‘referencesystem/antidegradation’approach,
c) re-evaluate the reference year used in the calculation of allowable exceedance days, and
d) Re-evaluate whether there is a need for further clarificationorrevisionofthegeometricmeanimplementation provision.
e) Evaluate the feasibility of a natural sources exclusion for the non-swimming portion of ICB
f) Re-evaluate the implementation schedule.
• Regional Board Four years after Effective Date of TMDL, or at the time of reconsideration of the Santa Monica Beaches Bacteria
Final Compliance (MSC):Withinfiveyearsofthe effective date of the TMDL, there shall be no exceedances in excess of the numbers in Table 6-3 and 6-4ofthesinglesamplelimitsatanylocationduringsummerdry-weather(April1toOctober31)orwinterdry-weather (November 1 to March 31) and the rolling 30-day geometric mean targets must be achieved.
• CityofLosAngeles• CountyofLosAngeles
Five years after Effective Date of TMDL
Implementation(ICB):Alltier3remediestobecompletedwithinfiveyearsoftheEffectiveDateoftheTMDL. (Tier 3)
• CityofLosAngeles Five years after Effective Date of TMDL
Final Compliance (ICB):Withinfiveyearsoftheeffective date of the TMDL, there shall be no allowable exceedances of the single sample limits at any location duringanyoftheperiods(Tables6-3,6-4and6-5)and the rolling 30-day geometric mean targets must be achieved.
• CityofLosAngeles Five years after the Effective Date of the TMDL

Basin Plan 7-�29 Total Maximum Daily LoadsUpdated September 20��
7-12 Ballona Creek Metals TMDL
This TMDL was adopted by: TheRegionalWaterQualityControlBoardonJuly7,2005
This TMDL was approved by: The State Water Resources Control Board on October 20, 2005. TheOfficeofAdministrativeLawonDecember9,2005. TheU.S.EnvironmentalProtectionAgencyonDecember22,2005.
This TMDL was voided and set aside on: May 6, 2009.
This TMDL was re-adopted by: TheRegionalWaterQualityControlBoardonSeptember6,2007.
This amended TMDL was approved by: TheStateWaterResourcesControlBoardonJune17,2008. TheOfficeofAdministrativeLawonOctober6,2008. TheU.S.EnvironmentalProtectionAgencyonOctober29,2008.
The effective date of this TMDL is: October 29, 2008.
The following tables include the elements of this TMDL.
Table 7-12.1. Ballona Creek Metals TMDL: ElementsElement Key Findings and Regulatory ProvisionsProblem Statement BallonaCreekisonCleanWaterActSection303(d)listofimpaired
waterbodies for dissolved copper, dissolved lead, total selenium, and dissolved zinc and Sepulveda Canyon Channel is 303(d) listed for lead. The metals subject to this TMDL are toxic pollutants, and the existingwaterqualityobjectivesforthemetalsreflectnationalpolicythat the discharge of toxic pollutants in toxic amounts be prohibited. When one of the metals subject to this TMDL is present at levels exceeding the existing numeric objectives, then the receiving water is toxic.Thefollowingdesignatedbeneficialusesareimpairedbythesemetals: water contact recreation (REC1); non-contact water recreation (REC2);warmfreshwaterhabitat(WARM);estuarinehabitat(EST);marinehabitat(MAR);wildlifehabitat(WILD);rareandthreatenedorendangeredspecies(RARE);migrationofaquaticorganisms(MIGR);reproductionandearlydevelopmentoffish(SPWN);commercialandsportfishing(COMM);andshellfishharvesting(SHELL).
TMDLs are developed for reaches on the 303(d) list and metal allocations are developed for tributaries that drain to impaired reaches. This TMDL address dry- and wet-weather discharges of copper, lead, selenium and zinc in Ballona Creek and Sepulveda Canyon Channel.
Numeric Target (Interpretation of the narrative and numeric water quality objective, used to calculate the load allocations)
Numeric water quality targets are based on the numeric water quality standards established for metals by the California Toxics Rule (CTR). The targets are expressed in terms of total recoverable metals. There are separate numeric targets for dry and wet weather because hardness valuesandflowconditionsinBallonaCreekandSepulvedaCanyonChannel vary between dry and wet weather. The dry-weather targets applytodayswhenthemaximumdailyflowinBallonaCreekislessthan40cubicfeetpersecond(cfs).Thewet-weathertargetsapplytodayswhenthemaximumdailyflowinBallonaCreekisequaltoorgreaterthan40cfs.

Basin Plan 7-��0 Total Maximum Daily LoadsUpdated September 20��
Element Key Findings and Regulatory ProvisionsNumeric Target (Interpretation of the narrative and numeric water quality objective, used to calculate the load allocations)(continued)
Dry Weather
The dry-weather targets are based on the chronic CTR criteria. The copper, lead and zinc targets are dependent on hardness to adjust for site-specificconditionsandrequireconversionfactorstoconvertbetween dissolved and total recoverable metals. These targets are based on the 50th percentile hardness value of 300 mg/L and the CTR default conversion factors. The conversion factor for lead is hardness dependent, which is also based on a hardness of 300 mg/L. The dry-weather target for selenium is independent of hardness and expressed as total recoverable metals.
Dry-weather numeric targets (µg total recoverable metals/L) Dissolved Conversion Factor Total Recoverable
Copper 23 0.96 24Lead 8.1 0.631 13Selenium 5Zinc 300 0.986 304
Wet Weather
The wet-weather targets for copper, lead and zinc are based on the acute CTR criteria and the 50thpercentilehardnessvalueof77mg/Lforstorm water collected at Sawtelle Boulevard. Conversion factors for copper and zinc are based on a regression of dissolved metal values to total metal values collected at Sawtelle. The CTR default conversion factorbasedonahardnessvalueof77mg/Lisusedforlead.Thewet-weather target for selenium is independent of hardness and expressed as total recoverable metals.
Wet-weather numeric targets (µg total recoverable metals/L) Dissolved Conversion Factor Total Recoverable
Copper 11 0.62 18Lead 49 0.829 59Selenium 5Zinc 94 0.79 119
Source Analysis Therearesignificantdifferenceinthesourcesofcopper,lead,seleniumand zinc loadings during dry weather and wet weather. During dry weather, most of the metals loadings are in the dissolved form. Storm drains convey a large percentage of the metals loadings during dry weatherbecausealthoughtheirflowsaretypicallylow,concentrationsof metals in urban runoff may be quite high. During dry years, dry-weather loadings account for 25-35% of the annual metals loadings. AdditionalsourcesofdryweatherflowandmetalsloadingincludegroundwaterdischargeandflowsfromotherpermittedNPDESdischarges within the watershed.
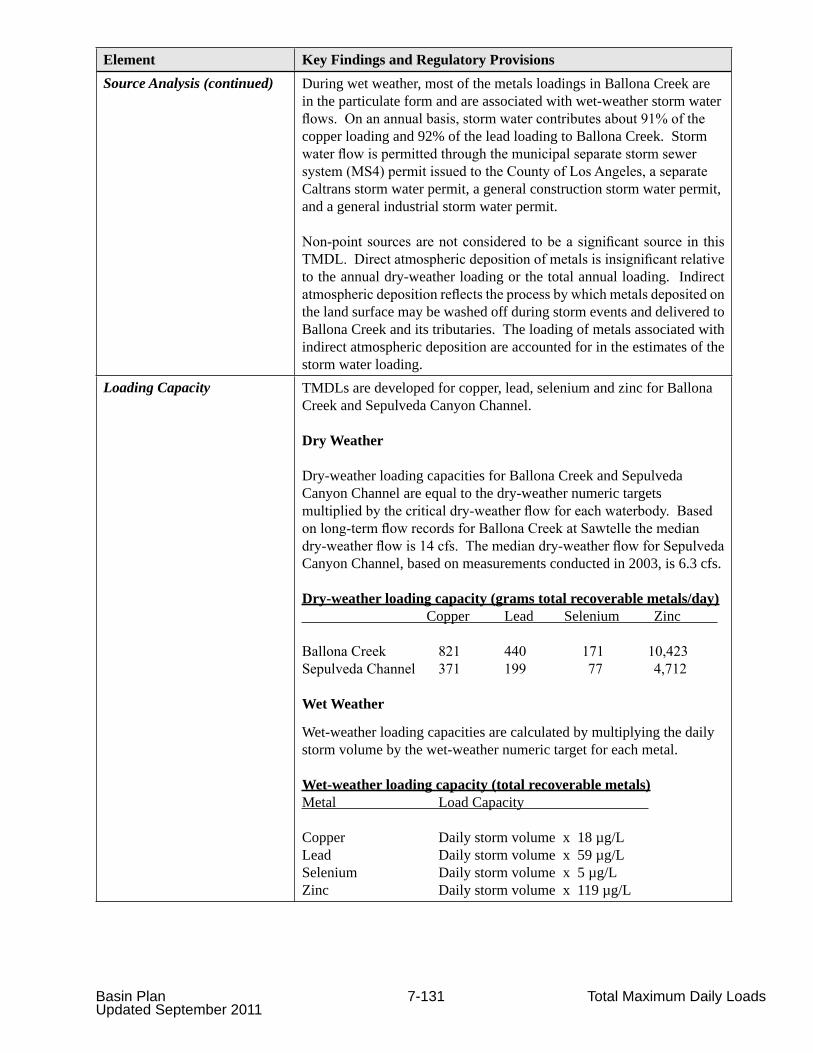
Basin Plan 7-��� Total Maximum Daily LoadsUpdated September 20��
Element Key Findings and Regulatory ProvisionsSource Analysis (continued) During wet weather, most of the metals loadings in Ballona Creek are
in the particulate form and are associated with wet-weather storm water flows.Onanannualbasis,stormwatercontributesabout91%ofthecopper loading and 92% of the lead loading to Ballona Creek. Storm waterflowispermittedthroughthemunicipalseparatestormsewersystem(MS4)permitissuedtotheCountyofLosAngeles,aseparateCaltrans storm water permit, a general construction storm water permit, and a general industrial storm water permit.
Non-pointsourcesarenotconsideredtobeasignificantsource in thisTMDL.Directatmosphericdepositionofmetalsisinsignificantrelativeto the annual dry-weather loading or the total annual loading. Indirect atmosphericdepositionreflectstheprocessbywhichmetalsdepositedonthe land surface may be washed off during storm events and delivered to Ballona Creek and its tributaries. The loading of metals associated with indirect atmospheric deposition are accounted for in the estimates of the storm water loading.
Loading Capacity TMDLs are developed for copper, lead, selenium and zinc for Ballona Creek and Sepulveda Canyon Channel.
Dry Weather
Dry-weather loading capacities for Ballona Creek and Sepulveda Canyon Channel are equal to the dry-weather numeric targets multipliedbythecriticaldry-weatherflowforeachwaterbody.Basedonlong-termflowrecordsforBallonaCreekatSawtellethemediandry-weatherflowis14cfs.Themediandry-weatherflowforSepulvedaCanyon Channel, based on measurements conducted in 2003, is 6.3 cfs.
Dry-weather loading capacity (grams total recoverable metals/day) Copper Lead Selenium Zinc
BallonaCreek 821 440 171 10,423SepulvedaChannel 371 199 77 4,712
Wet Weather
Wet-weather loading capacities are calculated by multiplying the daily storm volume by the wet-weather numeric target for each metal.
Wet-weather loading capacity (total recoverable metals)Metal Load Capacity
Copper Daily storm volume x 18 µg/LLead Daily storm volume x 59 µg/LSelenium Daily storm volume x 5 µg/LZinc Daily storm volume x 119 µg/L

Basin Plan 7-��2 Total Maximum Daily LoadsUpdated September 20��
Element Key Findings and Regulatory ProvisionsLoad Allocations (for nonpoint sources)
Loadallocations(LA)areassignedtonon-pointsourcesforBallonaCreek and Sepulveda Canyon Channel.
Dry Weather
Dry-weather load allocations for copper, lead and zinc are developed for direct atmospheric deposition. The mass-based load allocations are equal to the ratio of the length of each segment over the total length multiplied by the estimates of direct atmospheric loading for Ballona Creek(3.5g/dayforcopper,2.3g/dayforlead,and11.7k/dayforzinc).
Dry-weather direct air deposition LAs (total recoverable metals) Copper (g/day) Lead (g/day) Zinc (g/day)
BallonaCreek 2.0 1.4 6.8Sepulveda Channel 0.3 0.2 0.9
Wet Weather
Wet-weather load allocations for copper, lead, selenium and zinc are developed for direct atmospheric deposition. The mass-based load allocations for direct atmospheric deposition are equal to the percent area of surface water (0.6%) multiplied by the total loading capacity.
Wet-weather direct air deposition LAs (total recoverable metals)
LoadAllocation(grams/day)Copper 1.05E-07xDailystormvolume(L)Lead 3.54E-07xDailystormvolume(L)Selenium 3.00E-08 x Daily storm volume (L)Zinc 7.14E-07xDailystormvolume(L)
Waste Load Allocations (for point sources)
Wasteloadallocations(WLA)areassignedtopointsourcesforBallonaCreekandSepulvedaCanyonChannel.Agroupedmass-basedwasteload allocation is developed for the storm water permittees (Los AngelesCountyMS4,Caltrans,GeneralConstructionandGeneralIndustrial) by subtracting the load allocation from the total loading capacity. Concentration-based waste load allocations are developed for other point sources in the watershed.
Dry Weather
Dry-weather waste load allocation for storm water is equal to the dry-weathercriticalflowmultipliedbythedry-weathernumerictargetminus the load allocation for direct atmospheric deposition.
Dry-weather Storm Water WLAs (grams total recoverable metals/day) Copper Lead Selenium Zinc
BallonaCreek 818.9 438.6 171 10,416.2SepulvedaChannel 370.7 198.8 77 4,711.1

Basin Plan 7-��� Total Maximum Daily LoadsUpdated September 20��
Element Key Findings and Regulatory ProvisionsWaste Load Allocations (for point sources)(continued)
Awasteloadallocationofzeroisassignedtoallgeneralconstructionand industrial storm water permits during dry weather. Therefore, the stormwaterwasteloadallocationsareapportionedbetweentheMS4permittees and Caltrans, based on an areal weighting approach.
Dry-weather Storm Water WLAs Apportioned between Storm Water Permits (grams total recoverable metals/day) Copper Lead Selenium Zinc
Ballona Creek MS4permittees 807.7 432.6 169 10,273.1 Caltrans 11.2 6.0 2 143.1Sepulveda Channel MS4Permittees 365.6 196.1 76 4646.4 Caltrans 5.1 2.7 164.7
Concentration-based dry-weather waste load allocations are assigned to the minor NPDES permits and general non-storm water NPDES permitsthatdischargetoBallonaCreekoritstributaries.Anyfutureminor NPDES permits or enrollees under a general non-storm water NPDES permit will also be subject to the concentration-based waste load allocations.
Dry-weather WLAs for other permits (total recoverable metals) Copper (µg/L) Lead (µg/L) Selenium (µg/L) Zinc (µg/L) 24 13 5304
Wet Weather
Wet-weather waste load allocation for storm water is equal to the total loading capacity minus the load allocation for direct atmospheric deposition. Wet-weather waste load allocations for the grouped storm water permittees apply to all reaches and tributaries.
Wet-weather Storm Water WLAs (total recoverable metals) Waste Load Allocation (grams/day)
Copper 1.79E-05xDailystormvolume(L)Lead 5.87E-05xDailystormvolume(L)Selenium 4.97E-06xDailystormvolume(L)Zinc 1.18E-04xDailystormvolume(L)
The storm water waste load allocations are apportioned between the MS4permittees,Caltrans,thegeneralconstructionandthegeneralindustrial storm water permits based on an areal weighting approach.

Basin Plan 7-��4 Total Maximum Daily LoadsUpdated September 20��
Element Key Findings and Regulatory ProvisionsWaste Load Allocations (for point sources)(continued)
Wet-weather Storm Water WLAs Apportioned Between Storm Water Permits (total recoverable metals) Waste Load Allocation (grams/day)
Copper MS4Permittees 1.70E-05xDailystormvolume(L) Caltrans 2.37E-07xDailystormvolume(L) GeneralConstruction 4.94E-07xDailystormvolume(L) GeneralIndustrial 1.24E-07xDailystormvolume(L)Lead MS4Permittees 5.58E-05xDailystormvolume(L) Caltrans 7.78E-07xDailystormvolume(L) GeneralConstruction 1.62E-06xDailystormvolume(L) GeneralIndustrial 4.06E-07xDailystormvolume(L)Selenium MS4Permittees 4.73E-06xDailystormvolume(L) Caltrans 6.59E-08 x Daily storm volume (L) GeneralConstruction 1.37E-07xDailystormvolume(L) GeneralIndustrial 3.44E-08xDailystormvolume(L)Zinc MS4Permittees 1.13E-04xDailystormvolume(L) Caltrans 1.57E-06xDailystormvolume(L)GeneralConstruction 3.27E-06xDailystormvolume(L)
GeneralIndustrial 8.19E-07xDailystormvolume(L)
Each storm water permittee enrolled under the general construction or industrial storm water permits will receive an individual waste load allocation on a per acre basis, based on the acreage of their facility.
Individual per Acre WLAs for General Construction or Industrial Storm Water Permittees (total recoverable metals) Waste Load Allocation (grams/day/acre)
Copper 2.20E-10 x Daily storm volume (L)Lead 7.20E-10xDailystormvolume(L)Selenium 6.10E-11 x Daily storm volume (L)Zinc 1.45E-09xDailystormvolume(L)
Concentration-based wet-weather waste load allocations are assigned to the minor NPDES permits and general non-storm water NPDES permitsthatdischargetoBallonaCreekoritstributaries.Anyfutureminor NPDES permits or enrollees under a general non-storm waterNPDES permit will also be subject to the concentration-based waste load allocations.
Wet-weather WLAs for other permits (total recoverable metals) Copper (µg/L) Lead (µg/L) Selenium (µg/L) Zinc (µg/L) 18 59 5 119

Basin Plan 7-��5 Total Maximum Daily LoadsUpdated September 20��
Element Key Findings and Regulatory ProvisionsMargin of Safety There is an implicit margin of safety through the use of conservative
values for the conversion from total recoverable metals to the dissolved fraction during dry and wet weather. In addition, the TMDL includes a margin of safety by evaluating dry-weather and wet-weather conditions separately and assigning allocations based on two disparate critical conditions.
Implementation The regulatory mechanisms used to implement the TMDL will include theLosAngelesCountyMunicipalStormWaterNPDESPermit(MS4),the State of California Department of Transportation (Caltrans) Storm Water Permit, minor NPDES permits, general NPDES permits, general industrial storm water NPDES permits, and general construction storm water NPDES permits. Nonpoint sources will be regulated through the authority contained in Sections 13263 and 13269 of the Water Code,inconformancewiththeStateWaterResourcesControlBoard’sNonpointSourceImplementationandEnforcementPolicy(May2004).EachNPDESpermitassignedaWLAshallbereopenedoramendedat re-issuance, in accordance with applicable laws, to incorporate the applicableWLAsasapermitrequirement.
The Regional Board shall reconsider this TMDL by January 11, 2011 basedonadditionaldataobtainedfromspecialstudies.Table7-12.2presents the implementation schedule for the responsible permittees.
Minor NPDES Permits and General Non-Storm Water NPDES Permits:
Permit writers may translate applicable waste load allocations into effluentlimitsfortheminorandgeneralNPDESpermitsbyapplyingtheeffluentlimitationproceduresinSection1.4oftheStateWaterResourcesControlBoard’sPolicyforImplementationofToxicsStandards for Inland Surface Waters, Enclosed Bays, and Estuaries of California (2000) or other applicable engineering practices authorized under federal regulations. Compliance schedules may be established in individual NPDES permits, allowing up to 5 years within a permit cycle to achieve compliance. Compliance schedules may not be establishedingeneralNPDESpermits.Adischargerthatcannotcomplyimmediatelywitheffluentlimitationsspecifiedtomeetwasteload allocations will be required to apply for an individual permit, in order to, demonstrate the need for a compliance schedule.
Permittees that hold individual NPDES permits and solely discharge storm water may be allowed (at Regional Board discretion) compliance schedulesuptoJanuary11,2016toachievecompliancewithfinalWLAs.
General Industrial Storm Water Permits:
TheRegionalBoardwilldevelopawatershedspecificgeneralindustrialstorm water permit to incorporate waste load allocations.

Basin Plan 7-��6 Total Maximum Daily LoadsUpdated September 20��
Element Key Findings and Regulatory ProvisionsImplementation (continued) Dry-weather Implementation
Non-stormwaterflowsauthorizedbyOrderNo.97-03DWQ,oranysuccessor order, are exempt from the dry-weather waste load allocation equaltozero.Instead,theseauthorizednon-stormwaterflowsshallmeet the concentration-based waste load allocations assigned to the other NPDES Permits. The dry-weather waste load allocation equal tozeroappliestounauthorizednon-stormwaterflows,whichareprohibitedbyOrderNo.97-03DWQ.
It is anticipated that the dry-weather waste load allocations will be implemented by requiring improved best management practices (BMPs) toeliminatethedischargeofnon-stormwaterflows.However,thepermitwritersmustprovideadequatejustificationanddocumentationtodemonstratethatspecifiedBMPsareexpectedtoresultinattainmentofthe numeric waste load allocations.
Wet-weather Implementation
The general industrial storm water permittees are allowed interim wet-weather concentration-based waste load allocations based on benchmarkscontainedinEPA’sStormWaterMulti-sectorGeneralPermitforIndustrialActivities.Theinterimwasteloadallocationsapply to all industry sectors until no later than January 11, 2016.
Interim Wet-Weather WLAs for General Industrial Storm Water Permittees (total recoverable metals) Copper (µg/L) Lead (µg/L) Selenium (µg/L) Zinc (µg/L) 63.6 81.6 238.5 117
Until January 11, 2011, interim waste load allocations will not be interpreted as enforceable permit conditions. If monitoring demonstrates that interim waste load allocations are being exceeded, the permittee shall evaluate existing and potential BMPs, including structural BMPs, and implement any necessary BMP improvements. It is anticipated that monitoring results and any necessary BMP improvements would occur as part of an annual reporting process. AfterJanuary11,2011,interimwasteloadallocationsshallbetranslated into enforceable permit conditions. Compliance with permit conditions may be demonstrated through the installation, maintenance, and monitoring of Regional Board-approved BMPs. If this method of compliance is chosen, permit writers must provide adequate justificationanddocumentationtodemonstratethatBMPsareexpectedto result in attainment of interim waste load allocations.

Basin Plan 7-��7 Total Maximum Daily LoadsUpdated September 20��
Element Key Findings and Regulatory ProvisionsImplementation (continued) Thegeneralindustrialstormwaterpermitsshallachievefinalwet-
weather waste load allocations no later than January 11, 2016, which shallbeexpressedasNPDESwaterquality-basedeffluentlimitations.Effluentlimitationsmaybeexpressedaspermitconditions,suchastheinstallation, maintenance, and monitoring of Regional Board-approved BMPsifadequatejustificationanddocumentationdemonstratethatBMPs are expected to result in attainment of waste load allocations.
General Construction Storm Water Permits:
Waste load allocations will be incorporated into the State Board general permituponrenewalorintoawatershed-specificgeneralpermitdeveloped by the Regional Board.
Dry-weather Implementation
Non-stormwaterflowsauthorizedbytheGeneralPermitforStormWaterDischargesAssociatedwithConstructionActivity(WaterQualityOrder No. 99-08 DWQ), or any successor order, are exempt from the dry-weather waste load allocation equal to zero as long as they comply withtheprovisionsofsectionsC.3andA.9oftheOrderNo.99-08DWQ, which state that these authorized non-storm discharges shall be (1) infeasible to eliminate (2) comply with BMPs as described in the Storm Water Pollution Prevention Plan prepared by the permittee, and (3) not cause or contribute to a violation of water quality standards, or comparable provisions in any successor order. Unauthorized non-storm waterflowsarealreadyprohibitedbyOrderNo.99-08DWQ.
Wet-weather Implementation
By January 11, 2013, the construction industry will submit the results of BMP effectiveness studies to determine BMPs that will achievecompliancewiththefinalwasteloadallocationsassignedtoconstruction storm water permittees. Regional Board staff will bring the recommended BMPs before the Regional Board for consideration byJanuary11,2014.GeneralconstructionstormwaterpermitteeswillbeconsideredincompliancewithfinalwasteloadallocationsiftheyimplementtheseRegionalBoardapprovedBMPs.Allpermitteesmust implement the approved BMPs by January 11, 2015. If no effectiveness studies are conducted and no BMPs are approved by theRegionalBoardbyJanuary11,2014,eachgeneralconstructionstormwaterpermitholderwillbesubjecttosite-specificBMPsandmonitoringrequirementstodemonstratecompliancewithfinalwasteload allocations.

Basin Plan 7-��8 Total Maximum Daily LoadsUpdated September 20��
Element Key Findings and Regulatory ProvisionsImplementation (continued) MS4 and Caltrans Storm Water Permits:
TheCountyofLosAngeles,CityofLosAngeles,BeverlyHills,CulverCity, Inglewood, Santa Monica, and West Hollywood are jointly responsible for meeting the mass-based waste load allocations for the MS4permittees. Caltrans is responsibleformeeting theirmass-basedwasteloadallocations,however,theymaychoosetoworkwiththeMS4permittees. The primary jurisdiction for the Ballona Creek watershed is theCityofLosAngeles.
ApplicableCTRlimitsarebeingmetmostofthetimeduringdryweather,with episodic exceedances. Due to the expense of obtaining accurate flowmeasurementsrequiredforcalculating loads,concentration-basedpermit limits may apply during dry weather. These concentration-based limits would be equal to the dry-weather concentration-based waste load allocations assigned to the other NPDES permits.
Each municipality and permittee will be required to meet the storm water waste load allocation at the designated TMDL effectiveness monitoring points. A phased implementation approach, using a combination ofnon-structural and structural BMPs may be used to achieve compliance with the stormwater waste load allocations. The administrative record andthefactsheetsfortheMS4andCaltransstormwaterpermitsmustprovidereasonableassurancethattheBMPsselectedwillbesufficienttoimplement the waste load allocations.
The implementation schedule for the MS4 and Caltrans permitteesconsists of a phased approach, with compliance to be achieved in prescribed percentages of the watershed, with total compliance to be achieved within 15 years.
Seasonal Variations and Critical Conditions
Seasonal variations are addressed by developing separate waste load allocations for dry weather and wet weather.
Basedonlong-termflowrecords,dry-weatherflowsinBallonaCreekareestimatedtobe14cubicfeetpersecond(cfs).Since,thisflowhasbeenveryconsistent,14cfsisusedtodefinethecriticaldry-weatherflowforBallonaCreekatSawtelleBoulevard(upstreamofSepulvedaCanyonChannel).Therearenohistoricflowrecordstodeterminetheaveragelong-termflowsforSepulvedaCanyonChannel.Therefore,inthe absence of historical records the 2003 dry-weather characterization studymeasurementsareassumedreasonableestimatesofflowforthischannel.Thecriticaldry-weatherflowforSepulvedaCanyonChannelisdefinedastheaverageflowof6.3cfs.
Wet-weather allocations are developed using the load-duration curve concept. The total wet-weather waste load allocation varies by storm, therefore,giventhisvariabilityinstormwaterflows,nojustificationwasfound for selecting a particular sized storm as the critical condition.

Basin Plan 7-��9 Total Maximum Daily LoadsUpdated September 20��
Element Key Findings and Regulatory ProvisionsMonitoring Effective monitoring will be required to assess the condition of the
Ballona Creek and to assess the on-going effectiveness of efforts by dischargers to reduce metals loading to Ballona Creek. Special studies may also be appropriate to provide further information about new data, neworalternativesources,andrevisedscientificassumptions. BelowtheRegionalBoardidentifiesthevariousgoalsofmonitoringeffortsandstudies. The programs, reports, and studies will be developed in response tosubsequentordersissuedbytheExecutiveOfficer.
Ambient monitoring
Anambientmonitoringprogramisnecessarytoassesswaterqualitythroughout Ballona Creek and its tributaries and the progress being madetoremovethemetalsimpairments.TheMS4andCaltransstormwater NPDES permittees are jointly responsible for implementing the ambient monitoring program. The responsible agencies shall analyze samples for total recoverable metals and dissolved metals, including cadmium and silver, and hardness once a month at each monitoring location. The reported detection limits shall be lower than the hardness adjusted CTR criteria to determine if water quality objectives are being met. There are three ambient monitoring locations.
Ambient Monitoring Locations Waterbody Location BallonaCreek AtSawtelleBoulevardSepulvedaChannel JustAbovetheConfluencewithBallonaCreekBallonaCreek AtInglewoodBoulevard
TMDL Effectiveness Monitoring
TheMS4andCaltransstormwaterNPDESpermitteesarejointlyresponsible for assessing the progress in reducing pollutant loads toachievetheTMDL.TheMS4andCaltransstormwaterNPDESpermitteesarerequiredtosubmitforapprovaloftheExecutiveOfficera coordinated monitoring plan that will demonstrate the effectiveness of the phased implementation schedule for this TMDL, which requires attainment of the applicable waste load allocations in prescribed percentages of the watershed over a 15-year period. The monitoring locationsspecifiedfortheambientmonitoringprogrammaybeusedasthe effectiveness monitoring locations.

Basin Plan 7-�40 Total Maximum Daily LoadsUpdated September 20��
Element Key Findings and Regulatory ProvisionsMonitoring TheMS4andCaltransstormwaterNPDESpermitteeswillbefound
to be effectively meeting the dry-weather waste load allocations if thein-streampollutantconcentrationsorloadatthefirstdownstreammonitoring location is equal to or less than the corresponding concentration-orload-basedwasteloadallocation.Alternatively,effectiveness of the TMDL may be assessed at the storm drain outlet based on the concentration-based waste load allocation for the receiving water. For storm drains that discharge to other storm drains, the waste load allocation will be based on the waste load allocation for the ultimate receiving water for that storm drain system.
TheMS4andCaltransstormwaterNPDESpermitteeswillbefoundto be effectively meeting the wet-weather waste load allocations if the loading at the most downstream monitoring location is equal to or less then the wet-weather waste load allocation. Compliance with individual general construction and industrial storm water permittees will be based on monitoring of discharges at the property boundary. Compliance may be assessed based on concentration and/or load allocations.
The general storm water permits shall contain a model monitoring and reportingprogramtoevaluateBMPeffectiveness.Apermitteeenrolledunder the general permits shall have the choice of conducting individual monitoring based on the model program or participating in a group monitoringeffort.MS4permitteesareencouragedtotaketheleadingroup monitoring efforts for industrial facilities under their jurisdiction because compliance with waste load allocations by these facilities will inmanycasestranslatetoreductionsinmetalsloadstotheMS4system.
Special studiesTheimplementationschedule,Table7-12.2,allowstimeforspecialstudiesthatmayservetorefinetheestimateofloadingcapacity,waste load and/or load allocations, and other studies that may serve to optimize implementation efforts. The Regional Board will re-consider theTMDLbyJanuary11,2011inlightofthefindingsofthesestudies.
Studies may include:• Refinementofhydrologicandwaterqualitymodel• Additionalsourceassessment• Refinementofpotencyfactorscorrelationbetweentotalsuspended
solids and metals loadings during dry and wet weather• Correlation between short-term rainfall intensity and metals
loadings for use in sizing in-line structural BMPs• Correlation between storm volume and total recoverable metals
loading for use in sizing storm water retention facilities• Refinedestimatesofmetalspartitioningcoefficients,conversion
factors,andsite-specifictoxicity.• Evaluation of potential contribution of aerial deposition and sources
of aerial deposition.

Basin Plan 7-�4� Total Maximum Daily LoadsUpdated September 20��
Table 7-12.2. Ballona Creek Metals TMDL: Implementation ScheduleDate ActionJanuary 11, 2006 Regional Board permit writers shall incorporate the waste load
allocations into the NPDES permits. Waste load allocations will be implemented through NPDES permit limits in accordance with the implementation schedule contained herein, at the time of permit issuance or re-issuance.
January 11, 2010 Responsible jurisdictions and agencies shall provide to the Regional Board results of the special studies.
January 11, 2011 The Regional Board shall reconsider this TMDL to re-evaluate the waste load allocations and the implementation schedule.
MINOR NPDES PERMITS AND GENERAL NON-STORM WATER NPDES PERMITSUpon permit issuance or renewal
The non-storm water NPDES permittees shall achieve the waste load allocations, which shall be expressed as NPDES water quality-based effluent limitations specified in accordancewithfederal regulations and state policy on water quality control. ComplianceschedulesmayallowuptofiveyearsinindividualNPDES permits to meet permit requirements. Compliance schedules may not be established in general NPDES permits. Permittees that hold individual NPDES permits and solely discharge storm water may be allowed (at Regional Board discretion) compliance schedules up to January 11, 2016 to achievecompliancewithfinalWLAs.
GENERAL INDUSTRIAL STORM WATER PERMITSUpon permit issuance or renewal
The general industrial storm water NPDES permittees shall achieve dry-weather waste load allocations, which shall be expressed as NPDES water quality-based effluent limitationsspecifiedinaccordancewithfederalregulationsandstatepolicyonwaterqualitycontrol.Effluentlimitationsmaybeexpressedas permit conditions, such as the installation, maintenance, and monitoring of Regional Board-approved BMPs. Permittees shall begin to install and test BMPs to meet the interim wet-weather WLAs.BMPeffectivenessmonitoringwillbeimplementedtodetermine progress in achieving interim wet-weather waste load allocations.
January 11, 2011 The general industrial storm water NPDES permittees shall achieve the interim wet-weather waste load allocations, which shall be expressed as NPDES water quality-based effluentlimitations specified in accordance with federal regulationsand statepolicyonwaterquality control. Effluent limitationsmay be expressed as permit conditions, such as the installation, maintenance, and monitoring of Regional Board-approved BMPs. Permittees shall begin an iterative BMP process including BMP effectivenessmonitoringtoachievecompliancewithfinalwet-weatherWLAs.

Basin Plan 7-�42 Total Maximum Daily LoadsUpdated September 20��
Date ActionJanuary 11, 2016 The general industrial storm water NPDES permittees shall
achievethefinalwet-weatherwasteloadallocations,whichshallbeexpressedasNPDESwaterquality-basedeffluentlimitationsspecifiedinaccordancewithfederalregulationsandstatepolicyonwaterqualitycontrol.Effluentlimitationsmaybeexpressedas permit conditions, such as the installation, maintenance, and monitoring of Regional Board-approved BMPs.
GENERAL CONSTRUCTION STORM WATER PERMITSUpon permit issuance, renewal, or re-opener
Non-storm water flows not authorized by Order No. 99-08DWQ, or any successor order, shall achieve dry-weather waste load allocations of zero. Waste load allocations shall be expressed asNPDESwater quality-based effluent limitationsspecifiedinaccordancewithfederalregulationsandstatepolicyonwaterqualitycontrol.Effluentlimitationsmaybeexpressedas permit conditions, such as the installation, maintenance, and monitoring of Regional Board-approved BMPs.
January 11, 2013 The construction industry will submit the results of wet-weather BMP effectiveness studies to the Regional Board for consideration. In the event that no effectiveness studies are conducted and no BMPs areapproved,permitteesshallbesubjecttosite-specificBMPsandmonitoring to demonstrate BMP effectiveness.
January11,2014 The Regional Board will consider results of the wet-weather BMP effectiveness studies and consider approval of BMPs.
January 11, 2015 AllgeneralconstructionstormwaterpermitteesshallimplementRegional Board-approved BMPs.
MS4 AND CALTRANS STORM WATER PERMITSJanuary11,2007 In response to an order issued by the Executive Officer, the
MS4andCaltransstormwaterNPDESpermitteesmustsubmita coordinated monitoring plan, to be approved by the Executive Officer, which includes both ambient monitoring and TMDLeffectiveness monitoring. Once the coordinated monitoring plan isapprovedbytheExecutiveOfficerambientmonitoringshallcommence within 6 months.
January 11, 2010 (Draft Report)
July 11, 2010 (Final Report)
MS4andCaltransstormwaterNPDESpermitteesshallprovideawritten report to the Regional Board outlining the drainage areas to be address and how these areas will achieve compliance with the waste load allocations. The report shall include implementation methods, an implementation schedule, proposed milestones, and any applicable revisions to the TMDL effectiveness monitoring plan.
January 11, 2012 The MS4 and Caltrans storm water NPDES permittees shalldemonstrate that 50% of the total drainage area served by the MS4systemiseffectivelymeeting thedry-weatherwaste loadallocations and 25% of the total drainage area served by the MS4systemiseffectivelymeetingthewet-weatherwasteloadallocations.

Basin Plan 7-�4� Total Maximum Daily LoadsUpdated September 20��
Date ActionJanuary11,2014 The MS4 and Caltrans storm water NPDES permittees shall
demonstrate that 75%of the total drainagearea servedby theMS4systemiseffectivelymeeting thedry-weatherwaste loadallocations.
January 11, 2016 The MS4 and Caltrans storm water NPDES permittees shalldemonstrate that 100% of the total drainage area served by the MS4systemiseffectivelymeeting thedry-weatherwaste loadallocations and 50% of the total drainage area served by the MS4systemiseffectivelymeetingthewet-weatherwasteloadallocations.
January 11, 2021 The MS4 and Caltrans storm water NPDES permittees shalldemonstrate that 100% of the total drainage area served by the MS4 system is effectively meeting both the dry-weather andwet-weather waste load allocations.

Basin Plan 7-�44 Total Maximum Daily LoadsUpdated September 20��

Basin Plan 7-�45 Total Maximum Daily LoadsUpdated September 20��
7-13 Los Angeles River and Tributaries Metals TMDL
This TMDL was adopted by: The Regional Water Quality Control Board on June 2, 2005.
This TMDL was approved by: The State Water Resources Control Board on October 20, 2005. OfficeofAdministrativeLawonDecember9,2005. TheU.S.EnvironmentalProtectionAgencyonDecember22,2005.
This TMDL was voided and set aside on: May 6, 2009.
This TMDL was re-adopted byTheRegionalWaterQualityControlBoardonSeptember6,2007.
This TMDL was approved by:TheStateWaterResourcesControlBoardonJune17,2008.TheOfficeofAdministrativeLawonOctober14,2008.TheU.S.EnvironmentalProtectionAgencyonOctober29,2008.
This TMDL was revised and adopted byThe Regional Water Quality Control Board on May 6, 2010.
This TMDL revision was approved by:TheStateWaterResourcesControlBoardonApril19,2011.TheOfficeofAdministrativeLawonJuly27,2011.TheU.S.EnvironmentalProtectionAgencyonTBD.
The effective date of this TMDL is: October 29, 2008.
The following table includes the elements of this TMDL.

Basin Plan 7-�46 Total Maximum Daily LoadsUpdated September 20��
Table 7-13.1 Los Angeles River and Tributaries Metals TMDL: ElementsElement Key Findings and Regulatory ProvisionsProblem Statement SegmentsoftheLosAngelesRiveranditstributariesareontheClean
WaterActsection303(d)listofimpairedwaterbodiesforcopper,cadmium, lead, zinc, aluminum and selenium. The metals subject to this TMDL are toxic pollutants, and the existing water quality objectives for themetalsreflectnationalpolicythatthedischargeoftoxicpollutantsin toxic amounts be prohibited. When one of the metals subject to this TMDL is present at levels exceeding the existing numeric objectives, thenthereceivingwateristoxic.ThebeneficialusesimpairedbymetalsintheLosAngelesRiveranditstributariesarethoseassociatedwith aquatic life and water supply, including wildlife habitat, rare, threatened or endangered species, warm freshwater habitat, wetlands, and groundwater recharge. TMDLs are developed for reaches on the 303(d) list and for reaches where recent data indicate additional impairments.AddressingtheimpairingmetalsthroughouttheLosAngelesRiverwatershedwillensurethatthemetalsdonotcontributeto an impairment elsewhere in the watershed. Metals allocations are therefore developed for upstream reaches and tributaries that drain to impaired reaches.
These TMDLs address wet- and dry-weather discharges of copper, lead, zinc and selenium and wet-weather discharges of cadmium. Impairments related to cadmium only occur during wet weather. Impairments related to selenium are confined to Reach 6 and its tributaries. Dry-weatherimpairments related to zinc only occur in Rio Hondo Reach 1. The aluminum listing was based on water quality objectives set to support the municipalwatersupplybeneficialuse(MUN).MUNisaconditionaluseintheLosAngelesRiverwatershed.TheUnitedStatesEnvironmentalProtectionAgency(USEPA)hasdeterminedthatTMDLsarenotrequiredfor impairments of conditional uses.

Basin Plan 7-�47 Total Maximum Daily LoadsUpdated September 20��
Element Key Findings and Regulatory ProvisionsNumeric Target (Interpretation of the numeric water quality objective, used to calculate the waste load allocations)
Numeric water quality targets are based on the numeric water quality criteria established by the California Toxics Rule (CTR). The targets are expressed in terms of total recoverable metals. There are separate targetsfordryandwetweatherbecausehardnessvaluesandflowconditionsintheLosAngelesRiverandtributariesvarybetweendryand wet weather. The dry-weather targets apply to days when the maximumdailyflowintheRiverislessthan500cfs.Thewet-weathertargetsapplytodayswhenthemaximumdailyflowintheRiverisequal to or greater than 500 cfs.
The dry-weather targets for copper and lead are based on chronic CTR criteria. The dry-weather targets for zinc are based on acute CTR criteria. Copper, lead and zinc targets are dependent on hardness and a water effects ratio (WER), which are both factors built into the CTR criteriatoadjustforsitespecificconditions,andconversionfactorstoconvert between dissolved and total recoverable metals. Copper and lead targets are based on 50th percentile hardness values. Zinc targets are based on 10thpercentilehardnessvalues.Site-specificcopperconversion factors are applied immediately downstream of the Tillman andLA-Glendalewaterreclamationplants(WRP).CTRdefaultconversion factors are used for copper, lead, and zinc in all other cases. The dry-weather target for selenium is independent of hardness or conversion factors.
Dry-weather conversion factors:DefaultBelowTillmanWRPBelowLA-GlendaleWRPCopper0.960.740.80 Lead0.79Zinc 0.61
Dry-weather numeric targets (µg total recoverable metals/L) Cu Pb Zn SeReach 5, 6 and Bell Creek WER1 x 30 WER1 x 19 5 Reach4WER2 x 26 WER1 x 10Reach 3 aboveLA-GlendaleWRP and Verdugo WER2 x 23 WER1 x 12Reach 3 below LA-GlendaleWRPWER2 x 26 WER1 x 12Burbank Western Channel (above WRP) WER2 x 26 WER1x14Burbank Western Channel (below WRP) WER2 x 19 WER1 x 9.1Reach 2 andArroyoSecoWER2 x 22 WER1 x 11 Reach 1 WER2 x 23 WER1 x 12Compton Creek WER1 x 19 WER1 x 8.9Rio Hondo Reach 1 WER1 x 13 WER1 x 5.0 WER1 x 131Monrovia Canyon WER1 x 8.21 WER(s)haveadefaultvalueof1.0unlesssite-specificWER(s)areapproved.2 The WER for this constituent in this reach is 3.96.

Basin Plan 7-�48 Total Maximum Daily LoadsUpdated September 20��
Element Key Findings and Regulatory ProvisionsNumeric Target (continued)(Interpretation of the numeric water quality objective, used to calculate the waste load allocations)
The wet-weather targets for cadmium, copper, lead and zinc are based on acute CTR criteria and the 50th percentile hardness values for storm water collected at the Wardlow gage station, multiplied by a WER. Conversion factors for copper, lead and zinc are based on a regression of dissolved metals values to total recoverable metals values collected at Wardlow. The CTR default conversion factor is applied to cadmium. The wet-weather target for selenium is independent of hardness or conversion factors.
Wet-weather conversion factors:Cadmium 0.94Copper 0.65Lead 0.82Zinc 0.61
Wet-weather numeric targets (µg total recoverable metals/L) Cd Cu Pb Zn Se WER1 x 3.1 WER2x17WER1 x 62 WER1 x 159 51 WER(s)haveadefaultvalueof1.0unlesssite-specificWER(s)areapproved. 2 The WER for this constituent is 3.96.
Source Analysis Therearesignificantdifferencesinthesourcesofmetalsloadingsduring dry weather and wet weather. During dry weather, most of the metals loadings are in the dissolved form. The three major publicly owned treatment works (POTWs) that discharge to the river (Tillman WRP,LA-GlendaleWRP,andBurbankWRP)constitutethemajorityoftheflowandmetalsloadingsduringdryweather.Thestormdrainsalso contribute a large percentage of the loadings during dry weather becausealthoughtheirflowsaretypicallylow,concentrationsofmetalsin urban runoff may be quite high. The remaining portion of the dry weatherflowandmetalsloadingsrepresentsacombinationoftributaryflows,groundwaterdischarge,andflowsfromotherpermittedNPDESdischarges within the watershed.
During wet weather, most of the metals loadings are in the particulate formandareassociatedwithwet-weatherstormwaterflow.Onanannualbasis,stormwatercontributesabout40%ofthecadmiumloading, 80% of the copper loading, 95% of the lead loading and 90% ofthezincloading.Thisstormwaterflowispermittedthroughtwomunicipalseparatestormsewersystem(MS4)permits,aseparateCaltransMS4permit,ageneralconstructionstormwaterpermitandageneral industrial storm water permit.
Nonpoint sources of metals may include tributaries that drain the open space areas of the watershed. Direct atmospheric deposition of metals on the river is also a small source. Indirect atmospheric deposition on the land surface that is washed off during storms is a larger source, which is accounted for in the estimates of storm water loadings.
The sources of selenium appear to be related to natural levels of selenium in soils in the upper watershed. Separate studies are underway to evaluate whether selenium levels represent a “natural condition” for this watershed.

Basin Plan 7-�49 Total Maximum Daily LoadsUpdated September 20��
Element Key Findings and Regulatory ProvisionsLoading Capacity Dry Weather
Dry-weather TMDLs are developed for the following pollutant waterbody combinations (allocations are developed for upstream reaches and tributaries to meet TMDLs in downstream reaches):
• CopperfortheLosAngelesRiverReaches1,2,3,4,and5,BurbankChannel, Compton Creek, Tujunga Wash, Rio Hondo Reach 1.
• LeadfortheLosAngelesRiverReaches1,2,3,4,and5,BurbankChannel, Rio Hondo Reach 1, Compton Creek, Monrovia Canyon Creek.
• Zinc for Rio Hondo Reach 1. • SeleniumforReach6,AlisoCreek,DryCanyonCreek,McCoy
Canyon Creek.
Fordryweather,loadingcapacitiesareequaltoreach-specificnumerictargetsmultipliedbyreach-specificcriticaldry-weatherflows.Summingthecriticalflowsforeachreachandtributary,thecriticalflowfortheentireriveris203cfs,whichisequaltothecombineddesignflowofthethreePOTWs(169cfs)plusthemedianflowfromthestormdrainsandtributaries(34cfs).ThemedianstormdrainandtributaryflowisequaltothemedianflowatWardlow(145cfs)minustheexistingmedianPOTWflow(111cfs).Thedry-weatherloadingcapacitiesforeachimpairedreachincludethecriticalflowsfor upstream reaches. The dry-weather loading capacity for Reach 5 includesflowsfromReach6andBellCreek,thedry-weatherloadingcapacityforReach3includesflowsfromVerdugoWash,andthedry-weatherloadingcapacityforReach2includesflowsfromArroyoSeco.
Dry-weather loading capacity (total recoverable metals)
Critical Cu Pb Zn Flow (cfs) (kg/day) (kg/day) (kg/day)LARiverReach58.74WER1 x 0.65 WER1 x 0.39LARiverReach4129.13WER2 x 8.1 WER1 x 3.2LARiverReach339.14WER2 x 2.3 WER1 x 1.01LARiverReach24.44WER2 x 0.16 WER1x0.084LARiverReach12.58WER2x0.14WER1x0.075Tujunga Wash 0.15 WER1x0.007WER1 x 0.0035BurbankChannel17.3WER2 x 0.80 WER1 x 0.39Rio Hondo Reach 1 0.50 WER1x 0.015 WER1x0.0061 WER1x0.16Compton Creek 0.90 WER1x0.041WER1 x 0.0201 WER(s)haveadefaultvalueof1.0unlesssite-specificWER(s)areapproved.2 The WER for this constituent in this reach is 3.96.
No dry-weather loading capacities are calculated for lead in Monrovia Canyon Creek or selenium in Reach 6 or its tributaries. Concentration-based allocations are assigned for these metals in these reaches.

Basin Plan 7-�50 Total Maximum Daily LoadsUpdated September 20��
Element Key Findings and Regulatory ProvisionsLoading Capacity (continued) Wet Weather
Wet-weather TMDLs are calculated for cadmium, copper, lead, and zincinReach1.Allocationsaredevelopedforallupstreamreachesandtributaries to meet these TMDLs.Wet-weather loading capacities are calculated by multiplying daily storm volumes by the wet-weather numeric target for each metal. The resultingcurvesidentifytheloadallowanceforagivenflow.
Wet-weather loading capacity (total recoverable metals)Metal Load Duration Curve (kg/day)Cadmium Daily storm volume x WER1 x 3.1 µg/L Copper Daily storm volume x WER2x17µg/LLead Daily storm volume x WER1 x 62 µg/L Zinc Daily storm volume x WER1 x 159 µg/L1 WER(s)haveadefaultvalueof1.0unlesssite-specificWER(s)areapproved. 2 The WER for this constituent is 3.96.
Load Allocations (for nonpoint sources)
Dry Weather
Dry-weathernonpointsourceloadallocations(LAs)forcopperandlead apply to open space and direct atmospheric deposition to the river. Dry-weatheropenspaceloadallocationsareequaltothecriticalflowfor the upper portion of tributaries that drain open space, multiplied by the numeric targets for these tributaries.
Open space dry-weather LAs (total recoverable metals)
Critical Flow Cu (kg/day) Pb (kg/day)Tujunga Wash 0.12 WER1 x 0.0056 WER1 x 0.0028ArroyoSeco 0.33 WER1 x 0.018 WER1 x 0.0091 WER(s)haveadefaultvalueof1.0unlesssite-specificWER(s)areapproved.
Load allocations for direct atmospheric deposition to the entire river are obtained from previous studies (3 kg/year for copper, 2 kg/year for lead and 10 kg/year for zinc.) Loads are allocated to each reach and tributary based on their length. The ratio of the length of each river segment to the total length of the river is multiplied by the estimates of direct atmospheric loading to the entire river.
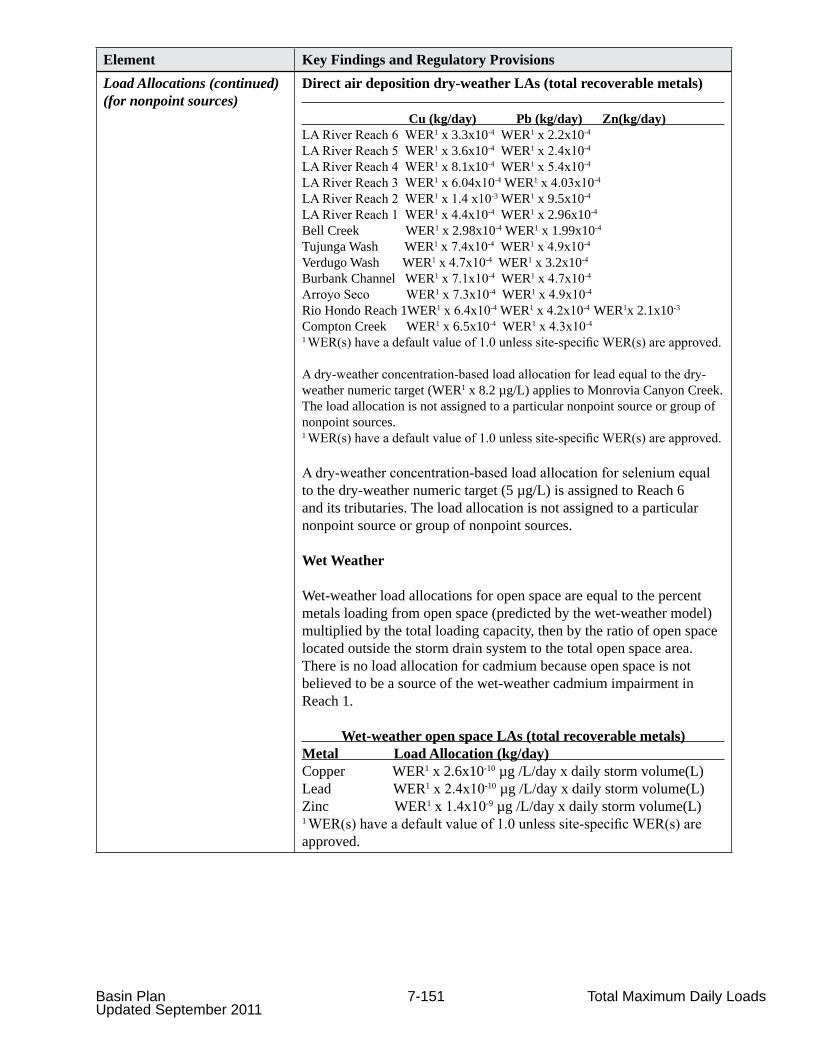
Basin Plan 7-�5� Total Maximum Daily LoadsUpdated September 20��
Element Key Findings and Regulatory ProvisionsLoad Allocations (continued)(for nonpoint sources)
Direct air deposition dry-weather LAs (total recoverable metals)
Cu (kg/day) Pb (kg/day) Zn(kg/day)LARiverReach6WER1 x 3.3x10-4 WER1 x 2.2x10-4
LARiverReach5WER1 x 3.6x10-4 WER1x2.4x10-4LARiverReach4WER1 x 8.1x10-4 WER1x5.4x10-4LARiverReach3WER1x6.04x10-4 WER1x4.03x10-4LARiverReach2WER1x1.4x10-3 WER1 x 9.5x10-4
LARiverReach1WER1x4.4x10-4 WER1 x 2.96x10-4
Bell Creek WER1 x 2.98x10-4 WER1 x 1.99x10-4
Tujunga Wash WER1x7.4x10-4 WER1x4.9x10-4Verdugo Wash WER1x4.7x10-4 WER1 x 3.2x10-4
Burbank Channel WER1x7.1x10-4 WER1x4.7x10-4ArroyoSecoWER1x7.3x10-4 WER1x4.9x10-4Rio Hondo Reach 1WER1x6.4x10-4 WER1x4.2x10-4WER1x 2.1x10-3
Compton Creek WER1 x 6.5x10-4 WER1x4.3x10-41 WER(s)haveadefaultvalueof1.0unlesssite-specificWER(s)areapproved.
Adry-weatherconcentration-basedloadallocationforleadequaltothedry-weather numeric target (WER1 x 8.2 µg/L) applies to Monrovia Canyon Creek. The load allocation is not assigned to a particular nonpoint source or group of nonpoint sources.1 WER(s)haveadefaultvalueof1.0unlesssite-specificWER(s)areapproved.
Adry-weatherconcentration-basedloadallocationforseleniumequalto the dry-weather numeric target (5 µg/L) is assigned to Reach 6 and its tributaries. The load allocation is not assigned to a particular nonpoint source or group of nonpoint sources.
Wet Weather
Wet-weather load allocations for open space are equal to the percent metals loading from open space (predicted by the wet-weather model) multiplied by the total loading capacity, then by the ratio of open space located outside the storm drain system to the total open space area. There is no load allocation for cadmium because open space is not believed to be a source of the wet-weather cadmium impairment in Reach 1.
Wet-weather open space LAs (total recoverable metals)Metal Load Allocation (kg/day)Copper WER1 x 2.6x10-10 µg /L/day x daily storm volume(L)Lead WER1x2.4x10-10 µg /L/day x daily storm volume(L)Zinc WER1x1.4x10-9 µg /L/day x daily storm volume(L)1 WER(s)haveadefaultvalueof1.0unlesssite-specificWER(s)areapproved.

Basin Plan 7-�52 Total Maximum Daily LoadsUpdated September 20��
Element Key Findings and Regulatory ProvisionsLoad Allocations (continued)(for nonpoint sources)
Wet-weather load allocations for direct atmospheric deposition are equal to the percent area of the watershed comprised by surface water (0.2%) multiplied by the total loading capacity.
Wet-weather direct air deposition LAs (total recoverable metals)Metal Load Allocation (kg/day)Cadmium WER1 x 6.2x10-10 µg /L/day x daily storm volume(L)Copper WER1x3.4x10-10 µg /L/day x daily storm volume(L)Lead WER1 x 1.2x10-10 µg /L/day x daily storm volume(L)Zinc WER1 x 3.2x10-9 µg /L/day x daily storm volume(L)1 WER(s)haveadefaultvalueof1.0unlesssite-specificWER(s)areapproved.
Awet-weatherconcentration-basedloadallocationforseleniumequalto the dry-weather numeric target (5 µg/L) is assigned to Reach 6 and its tributaries. The load allocation is not assigned to a particular nonpoint source or group of nonpoint sources.
Waste Load Allocations (for point sources)
Dry Weather
Dry-weatherpointsourcewasteloadallocations(WLAs)applytothethreePOTWs(Tillman,Glendale,andBurbank).Agroupedwasteloadallocationappliestothestormwaterpermitees(LosAngelesCountyMS4,LongBeachMS4,Caltrans,GeneralIndustrialandGeneralConstruction), which is calculated by subtracting load allocations (and waste load allocations for reaches with POTWs) from the total loading capacity. Concentration-based waste load allocations are developed for other point sources in the watershed.
Mass- and concentration-based waste load allocations for Tillman, LosAngeles-GlendaleandBurbankWRPsaredevelopedtomeetthedry-weathertargetsforcopperandleadinReach4,Reach3andtheBurbank Western Channel, respectively.
POTW dry-weather WLAs (total recoverable metals): Cu PbTillman Concentration-based (µg/L) WER2 x 26 WER1 x 10Mass-based (kg/day) WER2x7.8WER1 x 3.03GlendaleConcentration-based (µg/L) WER2 x 26 WER1 x 12Mass-based (kg/day) WER2 x 2.0 WER1 x 0.88BurbankConcentration-based (µg/L) WER2 x 19 WER1 x 9.1Mass-based (kg/day) WER2x0.64WER1 x 0.311 WER(s)haveadefaultvalueof1.0unlesssite-specificWER(s)areapproved.2TheWERforthisconstituentis3.96.RegardlessoftheWER,effluentlimitationsshallensurethateffluentconcentrationsandmassdischargesdonotexceedthelevels ofwater quality that can be attained by performance of this facility’streatment technologies existing at the time of permit issuance, reissuance, or modification.

Basin Plan 7-�5� Total Maximum Daily LoadsUpdated September 20��
Element Key Findings and Regulatory ProvisionsWaste Load Allocations (continued)(for point sources)
Dry-weather waste load allocations for storm water are equal to storm drainflows(criticalflowsminusmedianPOTWflowsminusmedianopenspaceflows)multipliedbyreach-specificnumerictargets,minusthe contribution from direct air deposition.
Storm water dry-weather WLAs (total recoverable metals) Critical Flow Cu Pb Zn (cfs) (kg/day) (kg/day) (kg/day)LARiverReach67.20WER1 x 0.53 WER1 x 0.33 LARiverReach50.75WER1 x 0.05 WER1 x 0.03 LARiverReach45.13WER1 x 0.32 WER1 x 0.12 LARiverReach34.84WER1 x 0.06 WER1 x 0.03 LARiverReach23.86WER1 x 0.13 WER1x0.07LARiverReach12.58WER1x0.14WER1x0.07BellCreek0.79WER1 x 0.06 WER1x0.04Tujunga Wash 0.03 WER1 x 0.001 WER1 x 0.0002 Burbank Channel 3.3 WER1 x 0.15 WER1x0.07Verdugo Wash 3.3 WER1 x 0.18 WER1 x 0.10 ArroyoSeco0.25WER1 x 0.01 WER1 x 0.01 Rio Hondo Reach 1 0.50 WER1x 0.01 WER1x0.006 WER1x 0.16Compton Creek 0.90 WER1x0.04WER1 x 0.02 1 WER(s)haveadefaultvalueof1.0unlesssite-specificWER(s)areapproved.
Azerowasteloadallocationisassignedtoallindustrialandconstruction storm water permittees during dry weather. The remaining wasteloadallocationsaresharedbytheMS4permitteesandCaltrans. Other NPDES Permits
Concentration-based dry-weather waste load allocations apply to the other NPDES permits* that discharge to the reaches and tributaries in the following table.
* “Other NPDES permits” refers to minor NPDES permits, general non-storm water NDPES permits, and major permits other than the Tillman,LA-Glendale,andBurbankPOTWs.
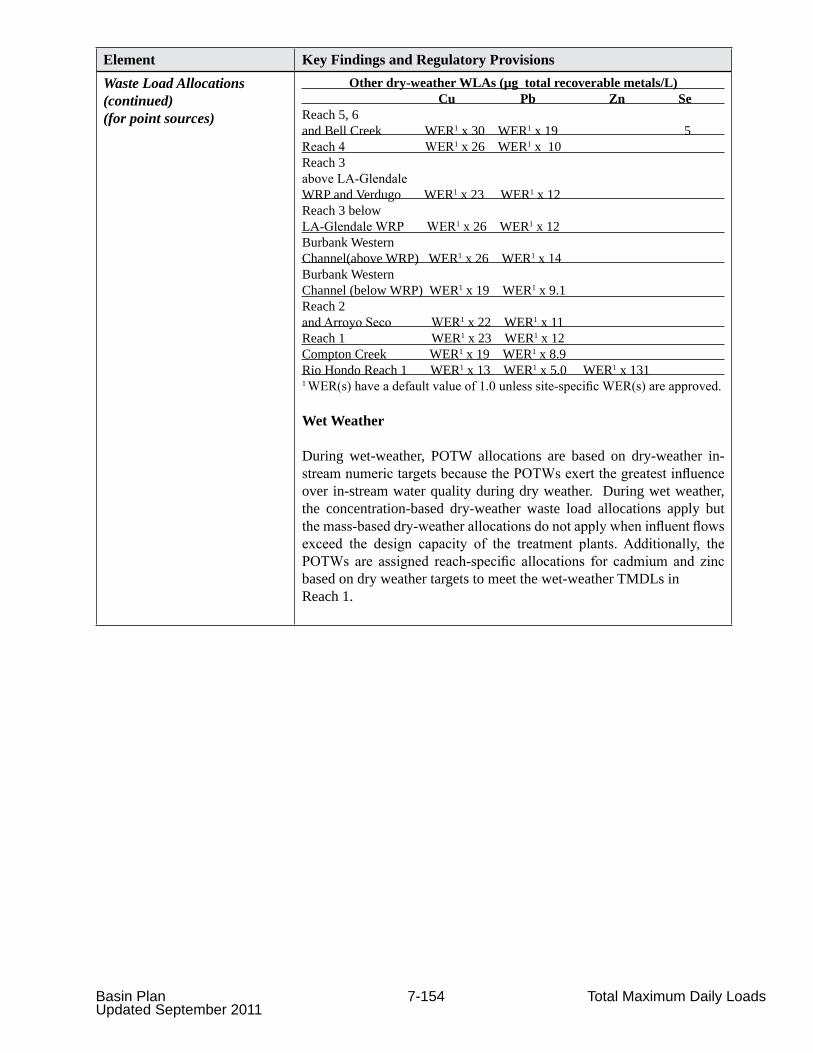
Basin Plan 7-�54 Total Maximum Daily LoadsUpdated September 20��
Element Key Findings and Regulatory ProvisionsWaste Load Allocations (continued)(for point sources)
Other dry-weather WLAs (µg total recoverable metals/L) Cu Pb Zn Se Reach 5, 6 and Bell Creek WER1 x 30 WER1 x 19 5 Reach4WER1 x 26 WER1 x 10Reach 3 aboveLA-GlendaleWRP and Verdugo WER1 x 23 WER1 x 12Reach 3 below LA-GlendaleWRPWER1 x 26 WER1 x 12Burbank Western Channel(above WRP) WER1 x 26 WER1x14Burbank Western Channel (below WRP) WER1 x 19 WER1 x 9.1Reach 2 andArroyoSecoWER1 x 22 WER1 x 11 Reach 1 WER1 x 23 WER1 x 12Compton Creek WER1 x 19 WER1 x 8.9Rio Hondo Reach 1 WER1 x 13 WER1 x 5.0 WER1 x 1311 WER(s)haveadefaultvalueof1.0unlesssite-specificWER(s)areapproved.
Wet Weather
During wet-weather, POTW allocations are based on dry-weather in-streamnumerictargetsbecausethePOTWsexertthegreatestinfluenceover in-stream water quality during dry weather. During wet weather, the concentration-based dry-weather waste load allocations apply but themass-baseddry-weatherallocationsdonotapplywheninfluentflowsexceed the design capacity of the treatment plants.Additionally, thePOTWs are assigned reach-specific allocations for cadmium and zincbased on dry weather targets to meet the wet-weather TMDLs in Reach 1.

Basin Plan 7-�55 Total Maximum Daily LoadsUpdated September 20��
Element Key Findings and Regulatory ProvisionsWaste Load Allocations (continued)(for point sources)
POTW wet-weather WLAs (total recoverable metals): Cd Cu Pb ZnTillman Concentration-based(µg/L) WER1x4.7WER2x26 WER1x10 WER1x212Mass-based(kg/day) WER1x1.4WER2x7.8WER1x 3.03 WER1x64GlendaleConcentration-based(µg/L) WER1x5.3 WER2x26 WER1x12 WER1x253Mass-based(kg/day) WER1x0.40WER2x2.0 WER1x0.88 WER1x19Burbank Concentration-based(µg/L) WER1x4.5WER2x19 WER1x9.1 WER1x 212Mass-based(kg/day) WER1x0.15 WER2x0.64WER1x0.31 WER1x7.31 WER(s)haveadefaultvalueof1.0unlesssite-specificWER(s)areapproved.2TheWERforthisconstituentis3.96.RegardlessoftheWER,effluentlimitationsshallensurethateffluentconcentrationsandmassdischargesdonot exceed the levels of water quality that can be attained by performance of thisfacility’streatmenttechnologiesexistingatthetimeofpermitissuance,reissuance,ormodification.
Wet-weather waste load allocations for the grouped storm water permittees are equal to the total loading capacity minus the load allocations for open space and direct air deposition and the waste load allocations for the POTWs. Wet-weather waste load allocations for the grouped storm water permittees apply to all reaches and tributaries.
Storm water wet-weather WLAs (total recoverable metals):
Metal Waste Load Allocation (kg/day)Cadmium WER1 x 3.1x10-9 x daily volume(L) – 1.95Copper WER1x1.7x10-8 x daily volume (L) – 10Lead WER1 x 6.2x10-8xdailyvolume(L)–4.2Zinc WER1 x 1.6x10-7 x daily volume (L) – 901 WER(s)haveadefaultvalueof1.0unlesssite-specificWER(s)areapproved.
The combined storm water waste load allocation is apportioned between the different storm water categories by their percent area of the portion of the watershed served by storm drains.
MS4 wet-weather WLAs (total recoverable metals):
Metal Waste Load Allocation (kg/day)Cadmium WER1 x 2.8x10-9 x daily volume(L) – 1.8Copper WER1 x 1.5x10-8 x daily volume (L) – 9.5Lead WER1 x 5.6x10-8 x daily volume (L) – 3.85Zinc WER1x1.4x10-7 x daily volume (L) – 83
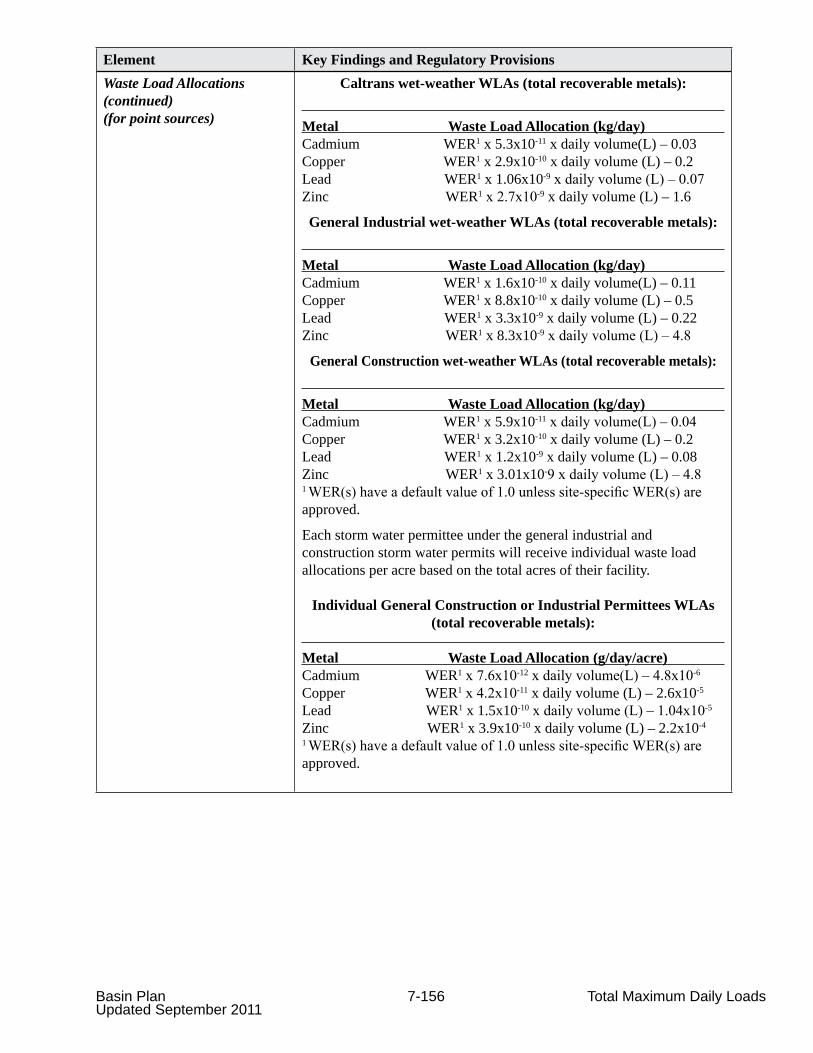
Basin Plan 7-�56 Total Maximum Daily LoadsUpdated September 20��
Element Key Findings and Regulatory ProvisionsWaste Load Allocations (continued)(for point sources)
Caltrans wet-weather WLAs (total recoverable metals):
Metal Waste Load Allocation (kg/day)Cadmium WER1 x 5.3x10-11 x daily volume(L) – 0.03Copper WER1 x 2.9x10-10 x daily volume (L) – 0.2Lead WER1 x 1.06x10-9xdailyvolume(L)–0.07Zinc WER1x2.7x10-9 x daily volume (L) – 1.6
General Industrial wet-weather WLAs (total recoverable metals):
Metal Waste Load Allocation (kg/day)Cadmium WER1 x 1.6x10-10 x daily volume(L) – 0.11Copper WER1 x 8.8x10-10 x daily volume (L) – 0.5Lead WER1 x 3.3x10-9 x daily volume (L) – 0.22Zinc WER1 x 8.3x10-9xdailyvolume(L)–4.8
General Construction wet-weather WLAs (total recoverable metals):
Metal Waste Load Allocation (kg/day)Cadmium WER1 x 5.9x10-11xdailyvolume(L)–0.04Copper WER1 x 3.2x10-10 x daily volume (L) – 0.2Lead WER1 x 1.2x10-9 x daily volume (L) – 0.08Zinc WER1 x 3.01x10-9xdailyvolume(L)–4.81 WER(s)haveadefaultvalueof1.0unlesssite-specificWER(s)areapproved.
Each storm water permittee under the general industrial and construction storm water permits will receive individual waste load allocations per acre based on the total acres of their facility.
Individual General Construction or Industrial Permittees WLAs(total recoverable metals):
Metal Waste Load Allocation (g/day/acre)Cadmium WER1x7.6x10-12xdailyvolume(L)–4.8x10⁻⁶
Copper WER1x4.2x10-11 x daily volume (L) – 2.6x10⁻⁵
Lead WER1 x 1.5x10-10xdailyvolume(L)–1.04x10⁻⁵
Zinc WER1 x 3.9x10-10 x daily volume (L) – 2.2x10⁻⁴
1 WER(s)haveadefaultvalueof1.0unlesssite-specificWER(s)areapproved.

Basin Plan 7-�57 Total Maximum Daily LoadsUpdated September 20��
Element Key Findings and Regulatory ProvisionsWaste Load Allocations (continued)(for point sources)
Other NPDES Permits
Concentration-based wet-weather waste load allocations apply to the otherNPDESpermits*thatdischargetoallreachesoftheLosAngelesRiver and its tributaries.
Wet-weather WLAs for other permits (total recoverable metals)
Cadmium (µg /L) Copper (µg /L) Lead (µg /L) Zinc (µg /L) WER1 x 3.1 WER1x17WER1 x 62 WER1 x 1591 WER(s)haveadefaultvalueof1.0unlesssite-specificWER(s)areapproved.
* “Other NPDES permits” refers to minor NPDES permits, general non-storm water NDPES permits, and major permits other than the Tillman, LA-Glendale,andBurbankPOTWs.
Margin of Safety There is an implicit margin of safety that stems from the use of conservative values for the translation from total recoverable to the dissolved fraction during the dry and wet periods. In addition, the TMDL includes a margin of safety by evaluating wet-weather conditions separately from dry-weather conditions, which is in effect, assigning allocations for two distinct critical conditions. Furthermore, the use of the wet-weather model to calculate load allocations for open space can be applied to the margin of safety because it tends to overestimate loads from open spaces, thus reducing the available waste load allocations to the permitted discharges. AnadditionalexplicitmarginofsafetyisprovidedinReaches1-4andBurbank Western Channel for which a site-specific WER has beendeveloped.Specifically,while the copper targets and loading capacityareadjustedbasedonthefinalWERof3.96,onlytheWLAsforTillmanWRP,LA-GlendaleWRP,andBurbankWRPareadjustedusingthesite-specificWERuntiladditionaldataarecollectedtodeterminewhetherthesite-specificWERisfullyprotectiveofaquaticlifeinallreachesandcanbeappropriatelyappliedtoallLAsandWLAs.
Implementation The regulatory mechanisms used to implement the TMDL will include theLosAngelesCountyMunicipalStormWaterNPDESPermit(MS4),theCityofLongBeachMS4,theCaltransstormwaterpermit,major NPDES permits, minor NPDES permits, general NPDES permits, general industrial storm water NPDES permits, and general construction storm water NPDES permits. Nonpoint sources will be regulated through the authority contained in sections 13263 and 13269 of the Water Code, in conformance with the State Water Resources ControlBoard’sNonpointSourceImplementationandEnforcementPolicy(May2004).EachNPDESpermitassignedaWLAshallbereopened or amended at reissuance, in accordance with applicable laws, toincorporatetheapplicableWLAsasapermitrequirement.

Basin Plan 7-�58 Total Maximum Daily LoadsUpdated September 20��
Element Key Findings and Regulatory ProvisionsImplementation (continued) The Regional Board shall reconsider this TMDL by January 11, 2011
basedonadditionaldataobtainedfromspecialstudies.Table7-13-2presents the implementation schedule for the responsible permittees.
Implementation of WERs
ThecopperWERof3.96forReaches1-4oftheLosAngelesRiverandBurbank Western Channel shall apply until this TMDL is reconsidered. AtthetimethisTMDLisreconsidered,theWERforReaches1-4andBurbankWesternChannelmaybemodifiedorrevertbacktoadefaultof 1.0 unless additional data have been collected that support application ofaWERtoallWLAsandLAs,orconfirmcontinuedapplicationofthesite-specificWERto theWLAs for thePOTWsonly. AnyWERthatis incorporated into a discharger’s permit shall include an appropriatereopener that authorizes the Regional Board to modify the WER as appropriate to accommodate new information.
Non storm water NPDES permits (including POTWs, other major, minor, and general permits):
Permit writers may translate applicable waste load allocations into daily maximumandmonthlyaverageeffluentlimitsforthemajor,minorandgeneralNPDESpermitsbyapplyingtheeffluentlimitationproceduresinSection1.4oftheStateWaterResourcesControlBoard’sPolicyfor Implementation of Toxics Standards for Inland Surface Waters, Enclosed Bays, and Estuaries of California (2000) or other applicable engineering practices authorized under federal regulations. Permittees that hold individual NPDES permits and solely discharge storm water may be allowed (at Regional Board discretion) compliance schedulesuptoJanuary11,2016toachievecompliancewithfinalWLAs.
General industrial storm water permits:
TheRegionalBoardwilldevelopawatershed-specificgeneralindustrial storm water permit to incorporate waste load allocations.
Dry-weather implementation
Non-stormwaterflowsauthorizedbyOrderNo.97-03DWQ,oranysuccessor order, are exempt from the dry-weather waste load allocation equaltozero.Instead,theseauthorizednon-stormwaterflowsshallmeetthereach-specificconcentration-basedwasteloadallocationsassigned to the “other NPDES permits”. The dry-weather waste load allocationequaltozeroappliestounauthorizednon-stormwaterflows,whichareprohibitedbyOrderNo.97-03DWQ.

Basin Plan 7-�59 Total Maximum Daily LoadsUpdated September 20��
Element Key Findings and Regulatory ProvisionsImplementation (continued) It is anticipated that the dry-weather waste load allocations will be
implemented by requiring improved best management practices (BMPs)toeliminatethedischargeofnon-stormwaterflows.However,permitwritersmustprovideadequatejustificationanddocumentationtodemonstratethatspecifiedBMPsareexpectedtoresultinattainmentofthe numeric waste load allocations.
Wet-weather implementation
Generalindustrialstormwaterpermitteesareallowedinterimwet-weather concentration-based waste load allocations based on benchmarkscontainedinEPA’sStormWaterMulti-sectorGeneralPermitforIndustrialActivities.Theinterimwasteloadallocationsapply to all industry sectors and apply until no later than January 11, 2016.
Interim wet-weather WLAs for general industrial storm water permittees (total recoverable metals)*
Cd (µg/L) Cu(µg/L) Pb(µg/L) Zn(µg/L)15.963.681.6117*BasedonUSEPAbenchmarksforindustrialstormwatersector Until January 11, 2011, interim waste load allocations will not be interpreted as enforceable permit conditions. If monitoring demonstrates that interim waste load allocations are being exceeded, the permittee shall evaluate existing and potential BMPs, including structural BMPs, and implement any necessary BMP improvements. It is anticipated that monitoring results and any necessary BMP improvements would occur as partofanannualreportingprocess.AfterJanuary11,2011,interimwasteload allocations shall be translated into enforceable permit conditions. Compliance with permit conditions may be demonstrated through the installation, maintenance, and monitoring of Regional Board-approved BMPs. If this method of compliance is chosen, permit writers must provide adequatejustificationanddocumentationtodemonstratethatBMPsareexpected to result in attainment of interim waste load allocations. The general industrial storm water permits shall achieve final wet-weather waste load allocations no later than January 11, 2016, which shallbeexpressedasNPDESwaterquality-basedeffluent limitations.Effluentlimitationsmaybeexpressedaspermitconditions,suchastheinstallation, maintenance, and monitoring of Regional Board-approved BMPs if adequate justification and documentation demonstrate thatBMPs are expected to result in attainment of waste load allocations.

Basin Plan 7-�60 Total Maximum Daily LoadsUpdated September 20��
Element Key Findings and Regulatory ProvisionsImplementation (continued) General construction storm water permits:
Waste load allocations will be incorporated into the State Board general permit upon renewal or into a watershed-specific general permitdeveloped by the Regional Board.
Dry-weather implementation
Non-stormwaterflowsauthorizedbytheGeneralPermitforStormWaterDischargesAssociatedwithConstructionActivity(WaterQualityOrder No. 99-08 DWQ), or any successor order, are exempt from the dry-weather waste load allocation equal to zero as long as they comply withtheprovisionsofsectionsC.3.andA.9oftheOrderNo.99-08DWQ, which state that these authorized non-storm discharges shall be (1) infeasible to eliminate (2) comply with BMPs as described in the Storm Water Pollution Prevention Plan prepared by the permittee, and (3) not cause or contribute to a violation of water quality standards, or comparable provisions in any successor order. Unauthorized non-storm waterflowsarealreadyprohibitedbyOrderNo.99-08DWQ.
Wet-weather implementation
By January 11, 2013, the construction industry will submit the results of BMP effectiveness studies to determine BMPs that will achieve compliancewiththefinalwasteloadallocationsassignedtoconstructionstorm water permittees. Regional Board staff will bring the recommended BMPs before the Regional Board for consideration by January 11, 2014.General construction stormwater permitteeswill be consideredincompliancewithfinalwasteloadallocationsiftheyimplementtheseRegional Board approved BMPs.All permittees must implement theapproved BMPs by January 11, 2015. If no effectiveness studies are conducted and no BMPs are approved by the Regional Board by January 11,2014,eachgeneralconstructionstormwaterpermitholderwillbesubjecttosite-specificBMPsandmonitoringrequirementstodemonstratecompliancewithfinalwasteloadallocations.
MS4 and Caltrans permits
ApplicableCTRlimitsarebeingmetmostofthetimeduringdry weather, with episodic exceedances. Due to the expense of obtainingaccurateflowmeasurementsrequiredforcalculatingloads,concentration-based permit limits may apply during dry weather. These concentration-basedlimitswouldbeequaltodry-weatherreach-specificnumeric targets.

Basin Plan 7-�6� Total Maximum Daily LoadsUpdated September 20��
Element Key Findings and Regulatory ProvisionsImplementation (continued) Each municipality and permittee will be required to meet the storm
waterwasteloadallocationssharedbythetwoMS4sandCaltranspermitteesatthedesignatedTMDLeffectivenessmonitoringpoints.Aphased implementation approach, using a combination of non-structural and structural BMPs may be used to achieve compliance with the waste load allocations. The administrative record and the fact sheets fortheMS4andCaltransstormwaterpermitsmustprovidereasonableassurancethattheBMPsselectedwillbesufficienttoimplementthewaste load allocations.
The implementation schedule for the MS4 and Caltrans permitteesconsists of a phased approach. The watershed is divided into fivejurisdictional groups based on the subwatersheds of the tributaries that drain to each reach of the river, as presented in Table 7-13-3. Eachjurisdictional group shall achieve compliance in prescribed percentages of its subwatershed(s), with total compliance to be achieved within 22 years. Jurisdictional groups can be reorganized or subdivided upon approvalbytheExecutiveOfficer.
Seasonal Variations and Critical Conditions
Seasonal variations are addressed by developing separate waste load allocations for dry weather and wet weather.
Fordryweather,criticalflowsforeachreachareestablishedfromthelong-termflowrecords(1988-2000)generatedbystreamgageslocatedthroughout the watershed and in selected reaches. The median dry-weather urban runoff plus the combined design capacity of the three majorPOTWsisselectedasthecriticalflowsincemostoftheflowisfromeffluentwhichresultsinarelativelystabledry-weatherflowcondition.Inareaswheretherearenoflowrecords,anarea-weightedapproachisusedtoassignflowstothesereaches.
Wet-weather allocations are developed using the load-duration curve concept. The total wet-weather waste load allocation for wet weather variesbystorm.Giventhisvariabilityinstormwaterflows,nojustificationwas found for selecting a particular sized storm as the critical condition.
Compliance Monitoring and Special Studies
Effective monitoring will be necessary to assess the condition of the Los AngelesRiveranditstributariesandtoassesstheon-goingeffectivenessof efforts bydischargers to reducemetals loading to theLosAngelesRiver. Special studies may also be appropriate to provide further information about new data, new or alternative sources, and revised scientificassumptions.BelowtheRegionalBoardidentifiesthevariousgoals of monitoring efforts and studies. The programs, reports, and studies will be developed in response to subsequent orders issued by the ExecutiveOfficer.

Basin Plan 7-�62 Total Maximum Daily LoadsUpdated September 20��
Element Key Findings and Regulatory ProvisionsCompliance Monitoring and Special Studies (continued)
Ambient Monitoring
AnambientmonitoringprogramisnecessarytoassesswaterqualitythroughouttheLosAngelesRiveranditstributariesandtheprogressbeingmadetoremovethemetalsimpairments.TheMS4andCaltransstorm water NPDES permittees in each jurisdictional group are jointly responsible for implementing the ambient monitoring program. The responsible agencies shall sample for total recoverable metals, dissolved metals, including cadmium and zinc, and hardness once per month at each ambient monitoring location at least until the TMDL is re-considered at year 5. The reported detection limits shall be below the hardness adjusted CTR criteria. Eight ambient monitoring points currentlyexistintheLosAngelesRiveranditstributariesaspartoftheCityofLosAngelesWatershedMonitoringProgram.Thesemonitoringpoints could be used to assess water quality.
AmbientMonitoringPoints Reaches and TributariesWhiteOak LARiver6,AlisoCreek,McCoyCreek,BellCreekAvenueSepulveda LARiver5,BullCreekBoulevardTujunga LARiver4,TujungaWashAvenueColorado LARiver3,BurbankWesternChannel,VerdugoWashBoulevardFigueroa LARiver3,ArroyoSecoStreetWashington LARiver2BoulevardRosecrans LARiver2,RioHondo(gagejustaboveRioHondo)AvenueWillow LARiver1,ComptonCreek(gageatWardlow)Street
TMDL Effectiveness Monitoring
TheMS4andCaltransstormwaterNPDESpermitteesineachjurisdictional group are jointly responsible for assessing progress in reducing pollutant loads to achieve the TMDL. Each jurisdictional groupisrequiredtosubmitforapprovalbytheExecutiveOfficeracoordinated monitoring plan that will demonstrate the effectiveness of thephasedimplementationscheduleforthisTMDL(SeeTable7-13.2),which requires attainment of the applicable waste load allocations in prescribed percentages of each subwatershed over a 22-year period. The monitoringlocationsspecifiedfortheambientmonitoringprogrammaybe used as effectiveness monitoring locations.

Basin Plan 7-�6� Total Maximum Daily LoadsUpdated September 20��
Element Key Findings and Regulatory ProvisionsCompliance Monitoring and Special Studies (continued)
TheMS4andCaltransstormwaterNPDESpermitteeswillbefoundto be effectively meeting dry-weather waste load allocations if the in-streampollutantconcentrationorloadatthefirstdownstreammonitoring location is equal to or less than the corresponding concentration-orload-basedwasteloadallocation.Alternatively,effectiveness of the TMDL may be assessed at the storm drain outlet based on the waste load allocation for the receiving water. For storm drains that discharge to other storm drains, the waste load allocation will be based on the waste load allocation for the ultimate receiving waterforthatstormdrainsystem.TheMS4andCaltransstormwaterNPDES permittees will be found to be effectively meeting wet-weather waste load allocations if the loading at the downstream monitoring location is equal to or less then the wet-weather waste load allocation.
The general industrial storm water permit shall contain a model monitoring and reporting program to evaluate BMP effectiveness. Apermitteeenrolledunderthegeneralpermitshallhavethechoiceof conducting individual monitoring based on the model program orparticipatinginagroupmonitoringeffort.MS4permitteesareencouraged to take the lead in group monitoring efforts for industrial facilities within their jurisdiction because compliance with waste load allocations by these facilities will in many cases translate to reductions inmetalsloadstotheMS4system.
TheTillman,LA-Glendale,andBurbankPOTWs,andtheremainingpermitteddischargesinthewatershedwillhaveeffluentmonitoringrequirements to ensure compliance with waste load allocations.
Additionally,theTillman,LA-Glendale,andBurbankPOTWsshallconduct additional receiving water monitoring to verify that water quality conditions are similar to those of the 2008 copper WER study period. Monitoring is also required to determine if the WER-based copperWLAswillachievedownstreamwaterqualitystandards.ThisadditionalmonitoringshallberequiredthroughthePOTWs’NPDESpermit monitoring and reporting programs or other Regional Board required monitoring programs. The Regional Board will evaluate the WER-basedcopperWLAsbasedonpotentialchangesinthechemicalcharacteristics of the water body that could impact the calculation or applicationoftheWERandwillrevisetheWERsandcopperWLAs,ifnecessary,toensureprotectionofbeneficialuses.
Special StudiesTheimplementationschedule(seeTable7-13.2)allowstimeforspecialstudiesthatmayservetorefinetheestimateofloadingcapacity,waste load and/or load allocations, and other studies that may serve to optimize implementation efforts. The Regional Board will re-consider theTMDLbyJanuary11,2011inlightofthefindingsofthesestudies.Studies may include:

Basin Plan 7-�64 Total Maximum Daily LoadsUpdated September 20��
Element Key Findings and Regulatory ProvisionsCompliance Monitoring and Special Studies (continued)
• RefinedflowestimatesfortheLosAngelesRivermainstemandtributarieswheretherepresentlyarenoflowgagesandforimprovedgagingoflow-flowconditions.
• Water quality measurements, including a better assessment of hardness, water chemistry data (e.g., total suspended solids and organiccarbon)thatmayrefinetheuseofmetalspartitioningcoefficients.
• Effectsstudiesdesignedtoevaluatesite-specifictoxiceffectsofmetalsontheLosAngelesRiveranditstributaries.
• Source studies designed to characterize loadings from background or natural sources
• Review of water quality modeling assumptions including the relationship between metals and total suspended solids as expressed in the potency factors and buildup and washoff and transportcoefficients.
• Evaluation of aerial deposition and sources of aerial deposition.• POTWsthatareunabletodemonstratecompliancewithfinal
waste load allocations must conduct source reduction audits by January 11, 2008.
• POTWs that will be requesting the Regional Board to extend their implementation schedule to allow for the installation of advanced treatment must prepare work plans, with time schedules to allow for the installation advanced treatment. The work plan must be submitted January 11, 2010.

Basin Plan 7-�65 Total Maximum Daily LoadsUpdated September 20��
Table 7-13.2 Los Angeles River and Tributaries Metals TMDL: Implementation ScheduleDate ActionJanuary 11, 2006 Regional Board permit writers shall incorporate waste load allocations
into NPDES permits. Waste load allocations will be implemented through NPDES permit limits in accordance with the implementation schedule contained herein, at the time of permit issuance, renewal, or re-opener.
January 11, 2010 Responsible jurisdictions and agencies shall provide to the Regional Board results of the special studies. POTWs that will be requesting the Regional Board to extend their implementation schedule to allow for the installation of advanced treatment must submit work plans.
January 11, 2011 The Regional Board shall reconsider this TMDL to re-evaluate the waste load allocations and the implementation schedule.
NON-STORM WATER NPDES PERMITS (INCLUDING POTWS, OTHER MAJOR, MINOR, AND GENERAL PERMITS)
Upon permit issuance, renewal, or re-opener
The non-storm water NPDES permits shall achieve waste load allocations, which shall be expressed as NPDES water quality-based effluent limitationsspecified inaccordancewith federal regulationsand state policy on water quality control. Permit writers may translate applicable waste load allocations into daily maximum and monthly average effluent limits for the major, minor and general NPDESpermitsbyapplyingtheeffluentlimitationproceduresinSection1.4of the SIP or other applicable engineering practices authorized under federal regulations. Effluent limitations based on WER-adjustedWLAsshallensurethateffluentconcentrationsandmassdischargesdo not exceed the levels of water quality that can be attained by performanceofafacility’streatmenttechnologiesexistingatthetimeofpermitissuance,reissuance,ormodification.
Permittees that hold individual NPDES permits and solely discharge storm water may be allowed (at Regional Board discretion) compliance schedulesup to January11,2016 to achievecompliancewithfinalWLAs.
GENERAL INDUSTRIAL STORM WATER PERMITSUpon permit issuance, renewal, or re-opener
The general industrial storm water permitees shall achieve dry-weather waste load allocations, which shall be expressed as NPDES water quality-based effluent limitations specified in accordancewith federal regulations and state policy on water quality control. Effluentlimitationsmaybeexpressedaspermitconditions,suchasthe installation, maintenance, and monitoring of Regional Board-approved BMPs. Permittees shall begin to install and test BMPs to meettheinterimwet-weatherWLAs.BMPeffectivenessmonitoringwill be implemented to determine progress in achieving interim wet-weather waste load allocations.
January 11, 2011 The general industrial storm water permits shall achieve interim wet-weather waste load allocations, which shall be expressed as NPDES waterquality-basedeffluentlimitations.Effluentlimitationsmaybeexpressed as permit conditions, such as the installation, maintenance, and monitoring of Regional Board-approved BMPs. Permittees shall begin an iterative BMP process including BMP effectiveness monitoringtoachievecompliancewithfinalwasteloadallocations.
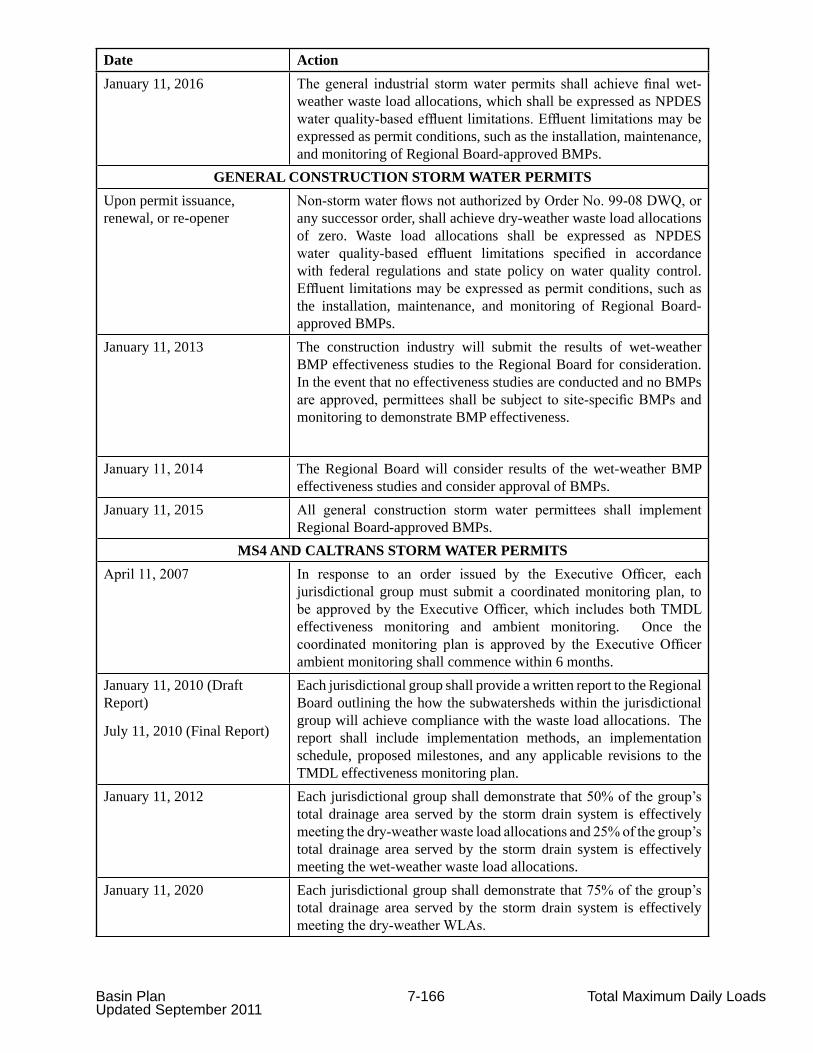
Basin Plan 7-�66 Total Maximum Daily LoadsUpdated September 20��
Date ActionJanuary 11, 2016 Thegeneral industrial stormwater permits shall achievefinalwet-
weather waste load allocations, which shall be expressed as NPDES waterquality-basedeffluentlimitations.Effluentlimitationsmaybeexpressed as permit conditions, such as the installation, maintenance, and monitoring of Regional Board-approved BMPs.
GENERAL CONSTRUCTION STORM WATER PERMITSUpon permit issuance, renewal, or re-opener
Non-stormwaterflowsnotauthorizedbyOrderNo.99-08DWQ,orany successor order, shall achieve dry-weather waste load allocations of zero. Waste load allocations shall be expressed as NPDES water quality-based effluent limitations specified in accordancewith federal regulations and state policy on water quality control. Effluentlimitationsmaybeexpressedaspermitconditions,suchasthe installation, maintenance, and monitoring of Regional Board-approved BMPs.
January 11, 2013 The construction industry will submit the results of wet-weather BMP effectiveness studies to the Regional Board for consideration. In the event that no effectiveness studies are conducted and no BMPs areapproved,permitteesshallbesubject tosite-specificBMPsandmonitoring to demonstrate BMP effectiveness.
January11,2014 The Regional Board will consider results of the wet-weather BMP effectiveness studies and consider approval of BMPs.
January 11, 2015 All general construction storm water permittees shall implementRegional Board-approved BMPs.
MS4 AND CALTRANS STORM WATER PERMITSApril11,2007 In response to an order issued by the Executive Officer, each
jurisdictional group must submit a coordinated monitoring plan, to be approvedby theExecutiveOfficer,which includes bothTMDLeffectiveness monitoring and ambient monitoring. Once the coordinatedmonitoring plan is approved by the Executive Officerambient monitoring shall commence within 6 months.
January 11, 2010 (Draft Report)
July 11, 2010 (Final Report)
Each jurisdictional group shall provide a written report to the Regional Board outlining the how the subwatersheds within the jurisdictional group will achieve compliance with the waste load allocations. The report shall include implementation methods, an implementation schedule, proposed milestones, and any applicable revisions to the TMDL effectiveness monitoring plan.
January 11, 2012 Each jurisdictional group shall demonstrate that 50%ofthegroup’stotal drainage area served by the storm drain system is effectively meetingthedry-weatherwasteloadallocationsand25%ofthegroup’stotal drainage area served by the storm drain system is effectively meeting the wet-weather waste load allocations.
January 11, 2020 Each jurisdictional group shall demonstrate that 75%ofthegroup’stotal drainage area served by the storm drain system is effectively meetingthedry-weatherWLAs.

Basin Plan 7-�67 Total Maximum Daily LoadsUpdated September 20��
Date ActionJanuary11,2024 Each jurisdictional group shall demonstrate that 100%ofthegroup’s
total drainage area served by the storm drain system is effectively meetingthedry-weatherWLAsand50%ofthegroup’stotaldrainagearea served by the storm drain system is effectively meeting the wet-weatherWLAs.
January 11, 2028 Each jurisdictional group shall demonstrate that 100%ofthegroup’stotal drainage area served by the storm drain system is effectively meetingboththedry-weatherandwet-weatherWLAs.

Basin Plan 7-�68 Total Maximum Daily LoadsUpdated September 20��
Table 7-13.3 Los Angeles River and Tributaries Metals TMDL: Jurisdictional Groups
Jurisdictional Group
Responsible Jurisdictions & Agencies Subwatershed(s)
1 CarsonCountyofLosAngelesCityofLosAngelesComptonHuntington ParkLong BeachLynwoodSignal HillSouthgateVernon
LosAngelesRiverReach1and Compton Creek
2 AlhambraArcadiaBellBellGardensBradburyCarsonCommerceComptonCountyofLosAngelesCudahyDowneyDuarteEl MonteGlendaleHuntington ParkIrwindaleLa Canada Flintridge
Long BeachCityofLosAngelesLynwoodMaywoodMonroviaMontebelloMonterey ParkParamountPasadenaPico RiveraRosemeadSanGabrielSan MarinoSierra MadreSouth El MonteSouth PasadenaSouthgateTemple CityVernon
LosAngelesRiverReach2,RioHondo,ArroyoSeco,and all contributing sub watersheds
3 CityofLosAngelesCountyofLosAngelesBurbankGlendaleLa Canada FlintridgePasadena
LosAngelesRiverReach3, Verdugo Wash, Burbank Western Channel
4-5 BurbankGlendaleCityofLosAngelesCountyofLosAngelesSan Fernando
LosAngelesRiverReach4,Reach5,TujungaWash, and all contributing subwatersheds
6 CalabasasCityofLosAngelesCountyofLosAngelesHidden Hills
LosAngelesRiverReach6, Bell Creek, and all contributing subwatersheds

Basin Plan 7-�69 Total Maximum Daily LoadsUpdated September 20��
7-14 Ballona Creek Estuary Toxic Pollutants TMDL
This TMDL was adopted by: TheRegionalWaterQualityControlBoardonJuly7,2005.
This TMDL was approved by: The State Water Resources Control Board on October 20, 2005. TheOfficeofAdministrativeLawonDecember15,2005. TheU.S.EnvironmentalProtectionAgencyonDecember22,2005.
The effective date of this TMDL is January 11, 2006.
The following tables include the elements of this TMDL.
Table 7-14.1. Ballona Creek Estuary Toxic Pollutants TMDL: ElementsElement Key Findings and Regulatory ProvisionsProblem Statement Ballona Creek and Ballona Creek Estuary (Estuary) is on the Clean
WaterActSection303(d)listofimpairedwaterbodiesforcadmium,copper,lead,silver,zinc,chlordane,DDT,PCBsandPAHsinsediments.Thefollowingdesignatedbeneficialusesareimpairedbythese toxic pollutants: water contact recreation (REC1); non-contact water recreation (REC2); estuarine habitat (EST); marine habitat (MAR);wildlifehabitat(WILD);rareandthreatenedorendangeredspecies(RARE);migrationofaquaticorganisms(MIGR);reproductionandearlydevelopmentoffish(SPWN);commercialandsportfishing(COMM);andshellfishharvesting(SHELL).
Numeric Target (Interpretation of the narrative and numeric water quality objective, used to calculate the allocations)
Numeric water quality targets are based on the sediment quality guidelinescompiledbytheNationalOceanicandAtmosphericAdministration,whichareusedinevaluatingwaterbodieswithintheLosAngelesRegionfordevelopmentofthe303(d)list.TheEffectsRange-Low (ERLs) guidelines are established as the numeric targets for sediments in Ballona Creek Estuary.
Metal Numeric Targets (mg/kg) Cadmium Copper Lead Silver Zinc 1.2 34 46.7 1.0 150
Organic Numeric Targets (µg/kg) Chlordane DDTs TotalPCBs TotalPAHs 0.5 1.58 22.7 4,022

Basin Plan 7-�70 Total Maximum Daily LoadsUpdated September 20��
Element Key Findings and Regulatory ProvisionsSource Analysis Urban storm water has been recognized as a substantial source
of metals. Numerous researchers have documented that the most prevalent metals in urban storm water (i.e., copper, lead, zinc, and to a lesser degree cadmium) are consistently associated with suspended solids.Becausemetalsaretypicallyassociatedwithfineparticlesinstorm water runoff, they have the potential to accumulate in estuarine sediments where they may pose a risk of toxicity. McPherson et al.1 estimated that 83% of the cadmium and 86% of the lead were associated with the particle phase in Ballona Creek. Similar to metals, the majority of organic constituents in storm water are associated withparticulates,measuredconcentrationsofPAHs,phthalates,andorganochlorine compounds in Sepulveda Channel, Centinela Creek, and Ballona Creek found that the majority of these compounds occurred in association with suspended solids. There is toxicity associated with suspended solids in urban runoff discharged from Ballona Creek, as well as with the receiving water sediments. This toxicity is likely attributedtometalsandPAHsassociatedwiththesuspendedsediments.
Nonpointsourcesarenotconsideredasignificantsourceoftoxicpollutants in this TMDL. Nonpoint sources are urban runoff from the Ballona Wetland, since this area discharges directly to the Estuary through a tide gate, and direct atmospheric deposition. The Ballona Wetlandscoverapproximately460acresor0.6%ofthewatershed,therefore,loadingfromthissourceisconsideredinsignificant.DirectatmosphericdepositionofmetalsandPAHsisconsideredinsignificantbecause the portion of the Ballona Creek watershed covered by water issmall,approximately480acresor0.6%ofthewatershed.Indirectatmosphericdepositionreflectstheprocessbywhichmetalsdepositedon the land surface may be washed off during storm events and delivered to Ballona Creek and its tributaries. The loading of metals associated with indirect atmospheric deposition are accounted for in the storm water runoff.
Loading Capacity TMDLs are developed for cadmium, copper, lead, silver, zinc, chlordane,DDT,PCBsandPAHswithinthesedimentsoftheBallonaCreek Estuary.
The loading capacity for Ballona Creek Estuary is calculated by multiplyingthenumerictargetsbytheaverageannualdepositionoffinesediment,definedassilts(grainsize0.0625millimeters)andsmaller,within the Estuary by the bulk density of the sediment. The average annualfinesedimentdepositedis5,004cubicmetersperyear(m3/yr) andthebulkdensityis1.42metrictonspercubicmeter(mt/m3). The TMDL is set equal to the loading capacity.
Metals Loading Capacity (kilograms/year) Cadmium Copper Lead Silver Zinc 8.5 241.6 332 7.1 1,066
Organics Loading Capacity (grams/year) Chlordane DDTs TotalPCBs TotalPAHs 3.55 11.2 161 28,580

Basin Plan 7-�7� Total Maximum Daily LoadsUpdated September 20��
Element Key Findings and Regulatory ProvisionsLoad Allocations (for nonpoint sources)
Loadallocations(LA)areassignedtononpointsourcesforBallonaCreek Estuary. Load allocations are developed for open space and direct atmospheric deposition.
The mass-based load allocation for open space is equal to the percentage of the watershed covered by the Ballona Wetlands (0.6%) multiplied by the total loading capacity.
Metals Load Allocations for Open Space (kg/yr) Cadmium Copper Lead Silver Zinc 0.05 1.4 2 0.04 6
Organics Load Allocations for Open Space (g/yr) Chlordane DDTs TotalPCBs TotalPAHs 0.02 0.1 1 160
The mass-based load allocation for direct atmospheric deposition is equal to the percentage of the watershed covered by water (0.6%) multiplied by the total loading capacity.
Metals Load Allocations for Direct Atmospheric Deposition (kg/yr) Cadmium Copper Lead Silver Zinc 0.05 1.4 2 0.04 6
Organics Load Allocations for Direct Atmospheric Deposition (g/yr) Chlordane DDTs TotalPCBs TotalPAHs 0.02 0.1 1 170
Waste Load Allocations (for point sources)
Wasteloadallocations(WLA)areassignedtopointsourcesfortheBallonaCreekwatershed.Agroupedmass-basedwasteloadallocationisdevelopedforthestormwaterpermittees(LosAngelesCountyMS4,Caltrans,GeneralConstructionandGeneralIndustrial)bysubtractingthe load allocations from the total loading capacity. Concentration-based waste load allocations are developed for other point sources in the watershed.
Metals Waste Load Allocations for Storm Water (kg/yr) Cadmium Copper Lead Silver Zinc 8.4 238.8 328 7.02 1,054
Organics Waste Load Allocations for Storm Water (g/yr) Chlordane DDTs TotalPCBs TotalPAHs 3.51 11 159 28,250

Basin Plan 7-�72 Total Maximum Daily LoadsUpdated September 20��
Element Key Findings and Regulatory ProvisionsWaste Load Allocations (for point sources)(continued)
The storm water waste load allocations are apportioned between the MS4permittees,Caltrans,thegeneralconstructionandthegeneralindustrial storm water permits based on an areal weighting approach.
Metals Storm Water WLAs Apportioned between Permits (kg/yr) Cadmium Copper Lead Silver ZincMS4Permittees 8.0 227.3 312.3 6.69 1003Caltrans 0.11 3.2 4.4 0.09 14GeneralConstruction 0.23 6.6 9.1 0.20 29GeneralIndustrial 0.06 1.7 2.3 0.05 7
Organics Storm Water WLAs Apportioned between Permits (g/yr) Chlordane DDTs TotalPCBs TotalPAHsMS4Permittees 3.34 10.56 152 26,900Caltrans 0.05 0.15 2 400GeneralConstruction 0.10 0.31 4 800GeneralIndustrial 0.02 0.08 1 200
Each storm water permittee enrolled under the general construction or industrial storm water permits will receive an individual waste load allocation on a per acre basis, based on the acreage of their facility.
Metals per Acre WLAs for Individual General Construction or Industrial Storm Water Permittees (g/yr/ac) Cadmium Copper Lead Silver Zinc 0.1 3 4 0.1 13
Organics per Acre WLAs for Individual General Construction or Industrial Storm Water Permittees (mg/yr/ac) Chlordane DDTs TotalPCBs TotalPAHs 0.04 0.14 2 350
Concentration-based waste load allocations are assigned to the minor NPDES permits and general non-storm water NPDES permits that dischargetoBallonaCreekoritstributaries.AnyfutureminorNPDESpermits or enrollees under a general non-storm water NPDES permit will also be subject to the concentration-based waste load allocations.
Metals Concentration-based Waste Load Allocations (mg/kg) Cadmium Copper Lead Silver Zinc 1.2 34 46.7 1.0 150
Organic Concentration-based Waste Load Allocations (µg/kg) Chlordane DDTs TotalPCBs TotalPAHs 0.5 1.58 22.7 4,022
Margin of Safety Animplicitmarginofsafetyisappliedthroughtheuseofthemoreprotective sediment quality guideline values. The ERLs were selected over the higher ERMs as the numeric targets.

Basin Plan 7-�7� Total Maximum Daily LoadsUpdated September 20��
Element Key Findings and Regulatory ProvisionsImplementation The regulatory mechanisms used to implement the TMDL will include
theLosAngelesCountyMunicipalStormWaterNPDESPermit(MS4),the State of California Department of Transportation (Caltrans) Storm Water Permit, minor NPDES permits, general NPDES permits, general industrial storm water NPDES permits, general construction storm water NPDES permits. Nonpoint sources will be regulated through the authority contained in sections 13263 and 13269 of the Water Code,inconformancewiththeStateWaterResourcesControlBoard’sNonpointSourceImplementationandEnforcementPolicy(May2004).EachNPDESpermitassignedaWLAshallbereopenedoramendedat re-issuance, in accordance with applicable laws, to incorporate the applicableWLAsasapermitrequirement.
The Regional Board shall reconsider this TMDL in six years after the effective date of the TMDL based on additional data obtained from specialstudies.Table7-14.2presentstheimplementationscheduleforthe responsible permittees.
Minor NPDES Permits and General Non-Storm Water NPDES Permits:The concentration-based waste load allocations for the minor NPDES permits and general non-storm water NPDES permits will be implemented through NPDES permit limits. Permit writers may translateapplicablewasteloadallocationsintoeffluentlimitsfortheminor and general NPDES permits by applying applicable engineering practices authorized under federal regulations. The minor and general non-storm water NPDES permittees are allowed up to seven years from the effective date of the TMDL to achieve the waste load allocations.
General Industrial Storm Water Permit:
TheRegionalBoardwilldevelopawatershedspecificgeneralindustrial storm water permit to incorporate waste load allocations. Concentration-based permit limits may be set to achieve the mass-based waste load allocations. These concentration-based limits would be equal to the concentration-based waste load allocations assigned to the other NPDES permits. It is expected that permit writers will translate the waste load allocations into BMPs, based on BMP performance data.However,thepermitwritersmustprovideadequatejustificationanddocumentationtodemonstratethatspecifiedBMPsareexpectedtoresult in attainment of the numeric waste load allocations. The general industrial storm water permittees are allowed up to seven years from the effective date of the TMDL to achieve the waste load allocations.

Basin Plan 7-�74 Total Maximum Daily LoadsUpdated September 20��
Element Key Findings and Regulatory ProvisionsImplementation (continued) General Construction Storm Water Permit:
Waste load allocations will be incorporated into the State Board general permitupon renewalor intoawatershed specificgeneral constructionstorm water permit developed by the Regional Board.
Within seven years of the effective date of the TMDL, the construction industry will submit the results of BMP effectiveness studies to determine BMPs that will achieve compliance with the waste load allocations assigned to construction storm water permittees. Regional Board staff will bring the recommended BMPs before the Regional Board for consideration within eight years of the effective date of the TMDL.Generalconstructionstormwaterpermitteeswillbeconsideredin compliance with waste load allocations if they implement these Regional Board approved BMPs.
AllgeneralconstructionpermitteesmustimplementtheapprovedBMPs within nine years of the effective date of the TMDL. If no effectiveness studies are conducted and no BMPs are approved by the Regional Board within eight years of the effective date of the TMDL, each general construction storm water permit holder will be subject tosite-specificBMPsandmonitoringrequirementstodemonstratecompliance with waste load allocations.
MS4 and Caltrans Storm Water Permits:
TheCountyofLosAngeles,CityofLosAngeles,BeverlyHills,CulverCity, Inglewood, Santa Monica, and West Hollywood are jointly responsible for meeting the mass-based waste load allocations for the MS4permittees. Caltrans is responsibleformeeting theirmass-basedwasteloadallocations,however,theymaychoosetoworkwiththeMS4permittees. The primary jurisdiction for the Ballona Creek watershed is theCityofLosAngeles.
Each municipality and permittee will be required to meet the waste load allocationsatthedesignatedTMDLeffectivenessmonitoringpoints.Aphased implementation approach, using a combination of non-structural and structural BMPs may be used to achieve compliance with the waste load allocations. The administrative record and the fact sheets for the MS4andCaltransstormwaterpermitsmustprovidereasonableassurancethattheBMPsselectedwillbesufficienttoimplementthenumericwasteload allocations. We expect that reductions to be achieved by each BMP willbedocumentedandthatsufficientmonitoringwillbeputinplacetoverify that the desired reductions are achieved. The permits should also provide a mechanism to adjust the required BMPs as necessary to ensure their adequate performance.
TheimplementationschedulefortheMS4andCaltranspermitteesconsists of a phased approach, with compliance to be achieved in prescribed percentages of the watershed, with total compliance to be achieved within 15 years.
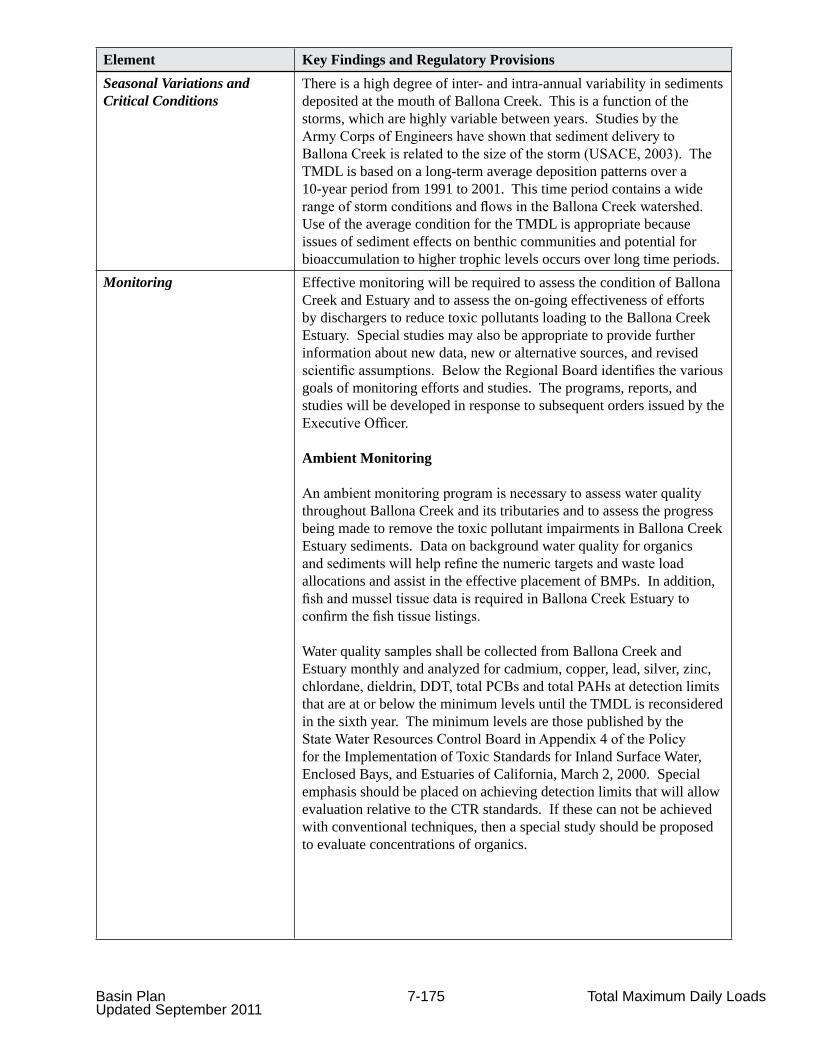
Basin Plan 7-�75 Total Maximum Daily LoadsUpdated September 20��
Element Key Findings and Regulatory ProvisionsSeasonal Variations and Critical Conditions
There is a high degree of inter- and intra-annual variability in sediments deposited at the mouth of Ballona Creek. This is a function of the storms, which are highly variable between years. Studies by the ArmyCorpsofEngineershaveshownthatsedimentdeliverytoBallonaCreekisrelatedtothesizeofthestorm(USACE,2003).TheTMDL is based on a long-term average deposition patterns over a 10-year period from 1991 to 2001. This time period contains a wide rangeofstormconditionsandflowsintheBallonaCreekwatershed.Use of the average condition for the TMDL is appropriate because issues of sediment effects on benthic communities and potential for bioaccumulation to higher trophic levels occurs over long time periods.
Monitoring Effective monitoring will be required to assess the condition of Ballona Creek and Estuary and to assess the on-going effectiveness of efforts by dischargers to reduce toxic pollutants loading to the Ballona Creek Estuary. Special studies may also be appropriate to provide further information about new data, new or alternative sources, and revised scientificassumptions.BelowtheRegionalBoardidentifiesthevariousgoals of monitoring efforts and studies. The programs, reports, and studies will be developed in response to subsequent orders issued by the ExecutiveOfficer.
Ambient Monitoring
Anambientmonitoringprogramisnecessarytoassesswaterqualitythroughout Ballona Creek and its tributaries and to assess the progress being made to remove the toxic pollutant impairments in Ballona Creek Estuary sediments. Data on background water quality for organics andsedimentswillhelprefinethenumerictargetsandwasteloadallocations and assist in the effective placement of BMPs. In addition, fishandmusseltissuedataisrequiredinBallonaCreekEstuarytoconfirmthefishtissuelistings.
Water quality samples shall be collected from Ballona Creek and Estuary monthly and analyzed for cadmium, copper, lead, silver, zinc, chlordane,dieldrin,DDT,totalPCBsandtotalPAHsatdetectionlimitsthat are at or below the minimum levels until the TMDL is reconsidered in the sixth year. The minimum levels are those published by the StateWaterResourcesControlBoardinAppendix4ofthePolicyfor the Implementation of Toxic Standards for Inland Surface Water, Enclosed Bays, and Estuaries of California, March 2, 2000. Special emphasis should be placed on achieving detection limits that will allow evaluation relative to the CTR standards. If these can not be achieved with conventional techniques, then a special study should be proposed to evaluate concentrations of organics.

Basin Plan 7-�76 Total Maximum Daily LoadsUpdated September 20��
Element Key Findings and Regulatory ProvisionsMonitoring (continued) StormwatermonitoringconductedaspartoftheMS4stormwater
monitoring program should continue to provide assessment of water quality during wet-weather conditions and loading estimates from the watershed to the Estuary. If analysis of chlordane, dieldrin, DDT, total PCBsortotalPAHsarenotcurrentlypartofthesamplingprogramsthese organics should be added. In addition, special emphasis should be placedonachievinglowerdetectionlimitsforDDTs,PCBsandPAHs.
TheMS4andCaltransstormwaterpermitteesarejointlyresponsibleforconductingbioaccumulationtestingoffishandmusseltissuewithinthe Estuary. The permittees are required to submit for approval of the ExecutiveOfficeramonitoringplanthatwillprovidethedataneededtoconfirmthe303(d)listingordelisting,asapplicable.
Representative sediment sampling locations shall be randomly selected within the Estuary and analyzed for cadmium, copper, lead, silver, zinc, chlordane,dieldrin,DDT,totalPCBsandtotalPAHsatdetectionlimitsthat are lower than the ERLs. Sediment samples shall also be analyzed for total organic carbon, grain size and sediment toxicity testing. Initial sedimentmonitoringshouldbedonequarterlyinthefirstyearoftheTMDLtodefinethebaselineandsemi-annually,thereafter,toevaluateeffectiveness of the BMPs until the TMDL is reconsidered in the sixth year.
The sediment toxicity testing shall include testing of multiple species, a minimum of three, for lethal and non-lethal endpoints. Toxicity testing may include: the 28-day and 10-day amphipod mortality test; the sea urchin fertilization testing of sediment pore water; and the bivalve embryo testing of the sediment/water interface. The chronic 28-day and shorter-term 10-day amphipod tests may be conducted in the initial year ofquarterlytestingandtheresultscompared.Ifthereisnosignificantdifference in the tests, then the less expensive 10-day test can be used throughout the rest of the monitoring, with some periodic 28-day testing.
TMDL Effectiveness Monitoring
The water quality samples collected during wet weather as part of theMS4stormwatermonitoringprogramshallbeanalyzedfortotaldissolved solids, settable solids and total suspended solids if not already part of the existing sampling program. Sampling shall be designed to collectsufficientvolumesofsettableandsuspendedsolidstoallowfor analysis of cadmium, copper, lead, silver, zinc, chlordane, dieldrin, totalDDT,totalPCBs,totalPAHs,andtotalorganiccarboninthebulksediment.

Basin Plan 7-�77 Total Maximum Daily LoadsUpdated September 20��
Element Key Findings and Regulatory ProvisionsMonitoring (continued) Semi-annually, representative sediment sampling locations shall be
randomly selected within the Estuary and analyzed for cadmium, copper, lead, silver, zinc, chlordane, dieldrin, DDT, total PCBs, and totalPAHsatdetectionlimitsthatarelowerthantheERLs.Thesediment samples shall also be analyzed for total organic carbon, grain size and sediment toxicity. The sediment toxicity testing shall include testing of multiple species, a minimum of three, for lethal and non-lethal endpoints. Toxicity testing may include: the 28-day and 10-day amphipod mortality test; the sea urchin fertilization testing of sediment pore water; and the bivalve embryo testing of the sediment/water interface.
Toxicityshallbeindicatedbyanamphipodsurvivalrateof70%orlessinasingletest.Acceleratedmonitoringshallbeconductedtoconfirmtoxicityatstationsidentifiedastoxic.Acceleratedmonitoringshall consist of six additional tests, approximately every two weeks, over a 12-week period. If the results of any two of the six accelerated testsarelessthan90%survival,thentheMS4andCaltranspermitteesshallconductaToxicityIdentificationEvaluation(TIE).TheTIEshallinclude reasonable steps to identify the sources of toxicity and steps to reduce the toxicity.
The Phase I TIE shall include the following treatments and corresponding blanks: baseline toxicity; particle removal by centrifugation; solid phase extraction of the centrifuged sample using C8, C18, or another media; complexation of metals using ethylenediaminetetraaceticacid(EDTA)additiontotherawsample;neutralization of oxidants/metals using sodium thiosulfate addition to the raw sample; and inhibition of organo-phosphate (OP) pesticide activation using piperonyl butoxide addition to the raw sample (crustacean toxicity tests only).
BioaccumulationmonitoringoffishandmusseltissuewithintheEstuary shall be conducted. The permittees are required to submit for approvaloftheExecutiveOfficeramonitoringplanthatwillprovidethe data needed to assess the effectiveness of the TMDL.
The general industrial storm water permit shall contain a model monitoring and reporting program to evaluate BMP effectiveness. Apermitteeenrolledunderthegeneralindustrialpermitshallhavethe choice of conducting individual monitoring based on the model programorparticipatinginagroupmonitoringeffort.MS4permitteesare encouraged to take the lead in group monitoring efforts for industrial facilities within their jurisdiction because compliance with waste load allocations by these facilities will in many cases translate to reductionsincontaminateloadstotheMS4system.

Basin Plan 7-�78 Total Maximum Daily LoadsUpdated September 20��
Element Key Findings and Regulatory ProvisionsMonitoring (continued) Special Studies
Specialstudiesarerecommendedtorefinesourceassessments,to provide better estimates of loading capacity, and to optimize implementation efforts. The Regional Board will re-consider the TMDLinthesixthyearaftertheeffectivedateinlightofthefindingsofthese studies. Special studies may include:
• Evaluation and use of low detection level techniques to evaluate water quality concentrations for those contaminants where standard detection limits cannot be used to assess compliance for CTR standardsorarenotsufficientforestimatingsourceloadingsfromtributaries and storm water.
• Developing and implementing a monitoring program to collection the data necessary to apply a multiple lines of evidence approach.
• Evaluation and use of sediment TIEs to evaluate causes of any recurring sediment toxicity.
• Evaluatepartitioningcoefficientsbetweenwatercolumnandsediment to assess the contribution of water column discharges to sediment concentrations in the Estuary.
• Studiestorefinerelationshipbetweenpollutantsandsuspendedsolids aimed at better understanding of the delivery of pollutants to the watershed.
• Studies to understand transport of sediments to the estuary, includingtherelationshipbetweenstormflows,sedimentloadingsto the estuary, and sediment deposition patterns within the estuary.
• Studies to evaluate effectiveness of BMPs to address pollutants and/or sediments.
1 McPherson, T.N., S.J. Burian, H.J. Turin, M.K. Stenstrom and I.H. Suffet. 2002. Comparison of Pollutant Loads in Dry and Wet Weather Runoff in a Southern California Urban Watershed. Water Science and Technology45:255-261.

Basin Plan 7-�79 Total Maximum Daily LoadsUpdated September 20��
Table 7-14.2. Ballona Creek Estuary Toxic Pollutants TMDL: Implementation ScheduleDate ActionEffective date of the TMDL Regional Board permit writers shall incorporate the waste load
allocations for sediment into the NPDES permits. Waste load allocations will be implemented through NPDES permit limits in accordance with the implementation schedule contained herein, at the time of permit issuance, renewal or re-opener.
Within 6 months after the effective date of the State Board adopted sediment quality objectives and implementation policy
The Regional Board will re-assess the numeric targets and waste load allocations for consistency with the State Board adopted sediment quality objectives.
5 years after effective date of the TMDL
Responsible jurisdictions and agencies shall provide to the Regional Board result of any special studies.
6 years after effective date of the TMDL
The Regional Board shall reconsider this TMDL to re-evaluate the waste load allocations and the implementation schedule.
MINOR NPDES PERMITS AND GENERAL NON-STORM WATER NPDES PERMITS7yearsafter effectivedateof theTMDL
The non-storm water NPDES permits shall achieve the concentration-based waste load allocations for sediment per provisions allowed for in NPDES permits.
GENERAL INDUSTRIAL STORM WATER PERMIT7yearsafter effectivedateof theTMDL
The general industrial storm water permits shall achieve the mass-based waste load allocations for sediment per provisions allowed for in NPDES permits. Permits shall allow an iterative BMP process including BMP effectiveness monitoring to achieve compliance with permit requirements.
GENERAL CONSTRUCTION STORM WATER PERMIT7yearsfromtheeffectivedateofthe TMDL
The construction industry will submit the results of the BMP effectiveness studies to the Regional Board for consideration. In the event that no effectiveness studies are conducted and no BMPs are approved, permittees shallbesubjecttosite-specificBMPsandmonitoringtodemonstrateBMPeffectiveness.
8 years from the effective date of the TMDL
The Regional Board will consider results of the BMP effectiveness studies and consider approval of BMPs no later than six years from the effective date of the TMDL.
9 years from the effective date of the TMDL
All general construction storm water permittees shall implementRegional Board-approved BMPs.
MS4 AND CALTRANS STORM WATER PERMITS12 months after the effective date of the TMDL
InresponsetoanorderissuedbytheExecutiveOfficer,theMS4andCaltrans storm water NPDES permittees must submit a coordinated monitoring plan, to be approved by the Executive Officer, whichincludes both ambient monitoring and TMDL effectiveness monitoring. Once the coordinated monitoring plan is approved by the Executive Officer,ambientmonitoringshallcommencewithin6months.

Basin Plan 7-�80 Total Maximum Daily LoadsUpdated September 20��
Date Action5 years after effective date of TMDL (Draft Report)
5 ½ years after effective date of TMDL (Final Report)
TheMS4andCaltransstormwaterNPDESpermitteesshallprovideawritten report to the Regional Board outlining how they will achieve the waste load allocations for sediment to Ballona Creek Estuary. The report shall include implementation methods, an implementation schedule, proposed milestones, and any applicable revisions to the TMDL effectiveness monitoring plan.
7yearsafter effectivedateof theTMDL
The MS4 and Caltrans storm water NPDES permittees shalldemonstrate that 25% of the total drainage area served by the MS4 system is effectively meeting the waste load allocations forsediment.
9 years after effective date of the TMDL
The MS4 and Caltrans storm water NPDES permittees shalldemonstrate that 50% of the total drainage area served by the MS4 system is effectively meeting the waste load allocations forsediment.
11 years after effective date of the TMDL
The MS4 and Caltrans storm water NPDES permittees shalldemonstrate that 75% of the total drainage area served by theMS4 system is effectively meeting the waste load allocations forsediment.
15 years after effective date of the TMDL
The MS4 and Caltrans storm water NPDES permittees shalldemonstrate that 100% of the total drainage area served by the MS4 system is effectively meeting the waste load allocations forsediment.

Basin Plan 7-�8� Total Maximum Daily LoadsUpdated September 20��
7-16 Calleguas Creek Watershed Toxicity TMDL
This TMDL was adopted by:TheRegionalWaterQualityControlBoardonJuly7,2005.
This TMDL was approved by:The State Water Resources Control Board on September 22, 2005.TheOfficeofAdministrativeLawonDecember22,2005.TheU.S.EnvironmentalProtectionAgencyonMarch14,2006.
TheeffectivedateofthisTMDLis:March24,2006.
Table 7-16.1. Calleguas Creek Watershed Toxicity TMDL: ElementsTMDL Element Calleguas Creek Watershed Toxicity TMDLProblem Statement Discharge of wastes containing chlorpyrifos, diazinon, other pesticides
and/or other toxicants to Calleguas Creek, its tributaries and Mugu Lagoon cause exceedances of water quality objectives for toxicity established in the Basin Plan. Elevated levels of chlorpyrifos have been foundinfishtissuesamplescollectedfromasegmentofCalleguasCreek.Chlorpyrifos and diazinon are organophosphate pesticides used in both agricultural and urban settings. Excessive chlorpyrifos and diazinon can cause aquatic life toxicity in inland surface and estuarine waters such as Calleguas Creek and Mugu Lagoon. The California 2002 303(d) list of impaired waterbodies includes listings for “water column toxicity,” “sedimenttoxicity,”chlorpyrifosinfishtissue,”and“organophosphatepesticides in water” for various reaches of Calleguas Creek, its tributaries and Mugu Lagoon.
Numeric Targets Awatercolumntoxicitytargetof1.0toxicityunit–chronic(1.0TUc)isestablished to address toxicity in reaches where the toxicant has not been identifiedthroughaToxicityIdentificationEvaluation(TIE)(unknowntoxicity).
TUC=ToxicityUnitChronic=100/NOEC(noobservableeffectsconcentration)
AsedimenttoxicitytargetwasdefinedinthetechnicalreportforreacheswherethesedimenttoxicanthasnotbeenidentifiedthroughaTIE.ThetargetisbasedonthedefinitionofatoxicsedimentsampleasdefinedbytheSeptember2004WaterQualityControlPolicyForDevelopingCalifornia’sCleanWaterActSection303(d)List(SWRCB).
Chlorpyrifos Numeric Targets (ug/L)
ChronicAcute (4dayaverage)(1houraverage)Freshwater0.0140.025Saltwater (Mugu Lagoon) 0.009 0.02

Basin Plan 7-�82 Total Maximum Daily LoadsUpdated September 20��
TMDL Element Calleguas Creek Watershed Toxicity TMDLNumeric Targets (continued)
Diazinon Numeric Targets (ug/L)
ChronicAcute (4dayaverage)(1houraverage)Freshwater 0.10 0.10Saltwater(MuguLagoon)0.400.82 Additionally,thediazinoncriteriaselectedasnumerictargetsarecurrentlyunderreviewbytheUSEPA.Ifwaterqualityobjectivesbecomeavailable, the Regional Board may reconsider this TMDL and revise the water toxicity numeric target.
Source Analysis Source analysis determined that agricultural and urban uses are the largest sources of chlorpyrifos and diazinon in the watershed. Urban use of diazinon and chlorpyrifos is unlikely to be a long-term source to the Calleguas Creek Watershed (CCW) as both of these pesticides have been banned for sale for non-agricultural uses on December 31, 2005 by federalregulation.Asaresult,theproportionoftheloadingfromurbansources will likely decrease after December 2005.
Chlorpyrifos – Sources by Use
Dry Weather Wet WeatherAgriculture66%80%Urban 23% 20%POTW11%<1%Other<1%<1%
Diazinon – Sources by Use
Dry Weather Wet WeatherAgriculture30%1%Urban 13% 62%POTW57%37%Other<1%<1%

Basin Plan 7-�8� Total Maximum Daily LoadsUpdated September 20��
TMDL Element Calleguas Creek Watershed Toxicity TMDLLinkage Analysis Water quality modeling established the linkage of sources of chlorpyrifos
and diazinon in the CCW to observed water quality data. The linkage analysis qualitatively describes the connection between water column concentrationsandsedimentandfishtissueconcentrations.Thequalitative analysis demonstrates that the water column analysis conducted by laboratories implicitly includes sediment associated diazinon and chlorpyrifos loads transported to receiving waters as almost all water quality data do not differentiate between dissolved and particulate fractions. The linkage analysis assumes a reduction in watercolumnconcentrationswillresultinareductioninfishtissueaschlorpyrifosinfreshwaterfishtissuerapidlydepuratewithinseveraldaysofremovalfromexposure.Additionally,aschlorpyrifospreferentiallybinds to sediment the linkage analysis suggests that sediment concentrations of chlorpyrifos will need to decrease to achieve water qualitynumerictargets.Themodelingapproachreflectstheuncertaintyin current conditions and the potential impacts of watershed planning actionsthatmayaffectthoseconditions.AdetaileddescriptionofthemodelisprovidedinanAttachmenttotheTMDLTechnicalReport.
Wasteload Allocations (WLA)
Major point sources:
Awasteloadof1.0TUc is allocated to the major point sources (POTWs) discharging to the Calleguas Creek Watershed.
Additionally,thefollowingwasteloadsforchlorpyrifosanddiazinonare established and based on the numeric target for POTWs. The concentration based wasteload allocations for Camarillo and Camrosa WRPs for chlopyrifos is reduced by a 5% margin of safety from the numeric targets. This margin of safety is applied to the Calleguas Creek and Revelon subwatersheds based on uncertainty in the linkages between thewatercolumncriteriaandfishtissueandsedimentconcentrations.
Chlorpyrifos WLAs, ug/L
POTWInterimWLAFinalWLAChronicAcuteChronic(4day)(1hour)(4day)HillCanyonWWTP0.0300.0250.014SimiValleyWQCP0.0300.0250.014VenturaCounty(Moorpark)WTP0.0300.0250.014CamarilloWRP0.0300.0240.0133CamrosaWRP0.0300.0240.0133

Basin Plan 7-�84 Total Maximum Daily LoadsUpdated September 20��
TMDL Element Calleguas Creek Watershed Toxicity TMDLWasteload Allocations (WLA)(continued)
Diazinon WLAs, ug/L
InterimInterimFinalWLAAcuteChronic(AcuteorChronic)(1hour)(4day)POTW HillCanyonWWTP0.5670.3120.10SimiValleyWQCP0.5670.3120.10VenturaCounty(Morepark)WTP0.5670.3120.10CamarilloWRP0.5670.3120.10CamrosaWRP0.5670.3120.10
Awasteloadof1.0TUc is allocated to Urban Stormwater Co-Permittees (MS4)dischargestotheCalleguasCreekWatershed.
Additionally,thefollowingwasteloadsforchlorpyrifosanddiazinonareestablishedforMS4discharges.
Chlorpyrifos WLAs, ug/L
InterimWLAFinalWLA(4day)(4day)0.450.014
Diazinon WLAs, ug/L InterimWLAInterimWLAFinalWLAAcute(1hour)Chronic(4day)AcuteandChronic1.730.5560.10
Minor point sources:
Minor sources include NPDES permittees other than POTWs, and Urban StormwaterCo-Permittees(MS4s)dischargingtotheCalleguasCreekWatershed.
Awasteloadof1.0TUc is allocated to the minor point sources discharging to the Calleguas Creek Watershed.
Additionally,thefollowingwasteloadsforchlorpyrifosanddiazinonareestablished.

Basin Plan 7-�85 Total Maximum Daily LoadsUpdated September 20��
TMDL Element Calleguas Creek Watershed Toxicity TMDLWasteload Allocations (WLA) (continued)
Chlorpyrifos WLAs, ug/L
InterimWLAFinalWLAChronicAcuteChronic(4day)(1hour)(4day)0.450.0250.014
Diazinon WLAs, ug/L
InterimWLAInterimWLAFinalWLAAcuteChronicAcuteandChronic(1hour)(4day)1.730.5560.10
Load Allocations Non Point Source Dischargers:
Aloadof1.0TUc is allocated to nonpoint sources discharging to the Calleguas Creek Watershed.
Additionally,thefollowingloadsforchlorpyrifosanddiazinonareestablished and based on the numeric targets. These loads apply to dischargers in accordance with the subwatershed into which the dischargers discharge. The concentration based load allocations for the Calleguas Creek and Revelon subwatersheds for chlopyrifos is reduced by a 5% margin of safety from the numeric targets. This margin of safety is based on uncertainty in the linkages between the water column criteria andfishtissueandsedimentconcentrations.
Chlorpyrifos Load Allocations, ug/L
Interim Interim FinalSubwatershedAcuteChronicAcuteChronic(1-hour)(4-day)(1-hour)(4-day)ArroyoSimi2.570.8100.0250.014LasPosas2.570.8100.0250.014Conejo2.570.8100.0250.014Calleguas2.570.8100.0240.0133Revolon2.570.8100.0240.0133MuguLagoon2.570.8100.0250.014
Diazinon Load Allocations, ug/L
InterimLAInterimLAFinalLAAcuteChronicAcuteandChronic(1hour)(4day)0.2780.1380.10

Basin Plan 7-�86 Total Maximum Daily LoadsUpdated September 20��
TMDL Element Calleguas Creek Watershed Toxicity TMDLMargin of Safety In addition to the implicit margin of safety achieved by conservative
assumptions and by using a concentration based TMDL, an explicit margin of safety of 5% has been added to the targets for chlorpyrifos in the Calleguas and Revolon subwatersheds and to the Camarillo and Camrosa WRPs to address uncertainty in the linkages between the watercolumncriteriaandfishtissueandsedimentconcentrations.TheCalleguas and Revolon subwatersheds include those reaches listed for sedimenttoxicityandchlorpyrifosinfishtissue.
Future Growth VenturaCountyaccountsforslightlymorethan2%ofthestate’sresidentswithapopulationof753,197(USCensusBureau,2000).GISanalysisofthe2000censusdatayieldsapopulationestimateof334,000fortheCCW,whichequalsabout44%ofthecountypopulation.AccordingtotheSouthernCaliforniaAssociationofGovernments(SCAG),growthin Ventura County averaged about 51% per decade from 1900-2000; withgrowthexceeding70%inthe1920s,1950s,and1960s.Thephase-out of chlorpyrifos and diazinon is expected to reduce loads from urban andPOTWssignificantlyby2007.Useofdiazinoninagriculturehasdeclined considerably between 1998 and 2003. Conversely, chlorpyrifos use in agriculture has remained relatively stable over the same period. The phase out of chlorpyrifos and diazinon as well as population growth will cause an increase in the use of replacement pesticides (e.g. pyrethroids) in the urban environment and may have an impact on water and/or sediment toxicity.Additionally,populationgrowthmayaffectanincreaseinthelevels of chlorpyrifos and diazinon loading in the CCW from imported products which contain residues of these pesticides.
Critical Conditions ThecriticalconditioninthisTMDLisdefinedastheflowrateatwhichthe model calculated the greatest in-stream diazinon or chlorpyrifos concentration in comparison to the appropriate criterion. The critical condition for chlorpyrifos was in dry weather based on a chronic numeric target; the critical condition for diazinon was in wet weather based on an acute numeric target except in Mugu Lagoon where it was in dry weather based on the chronic numeric target.
Implementation Plan
WLAsestablishedforthemajorpointssources,includingPOTWsintheCCWwillbeimplementedthroughNPDESpermiteffluentlimits.ThefinalWLAswillbeincludedinNPDESpermitsinaccordancewiththecompliance schedules provided. The Regional Board may revise these WLAsbasedonadditionalinformationasdescribedintheSpecialStudiesand Monitoring Section of the Technical Report.
ThetoxicityWLAswillbeimplementedinaccordancewithUSEPA,State Board and Regional Board resolutions, guidance and policy at the timeofpermitissuanceorrenewal.Currently,theseWLAswouldbeimplemented as a trigger for initiation of the TRE/TIE process as outlined inUSEPA’s“UnderstandingandAccountingforMethodVariabilityinWholeEffluentToxicityApplicationsUndertheNationalPollutantDischarge Elimination System Program” (2000) and current NPDES permits held by dischargers to the CCW.
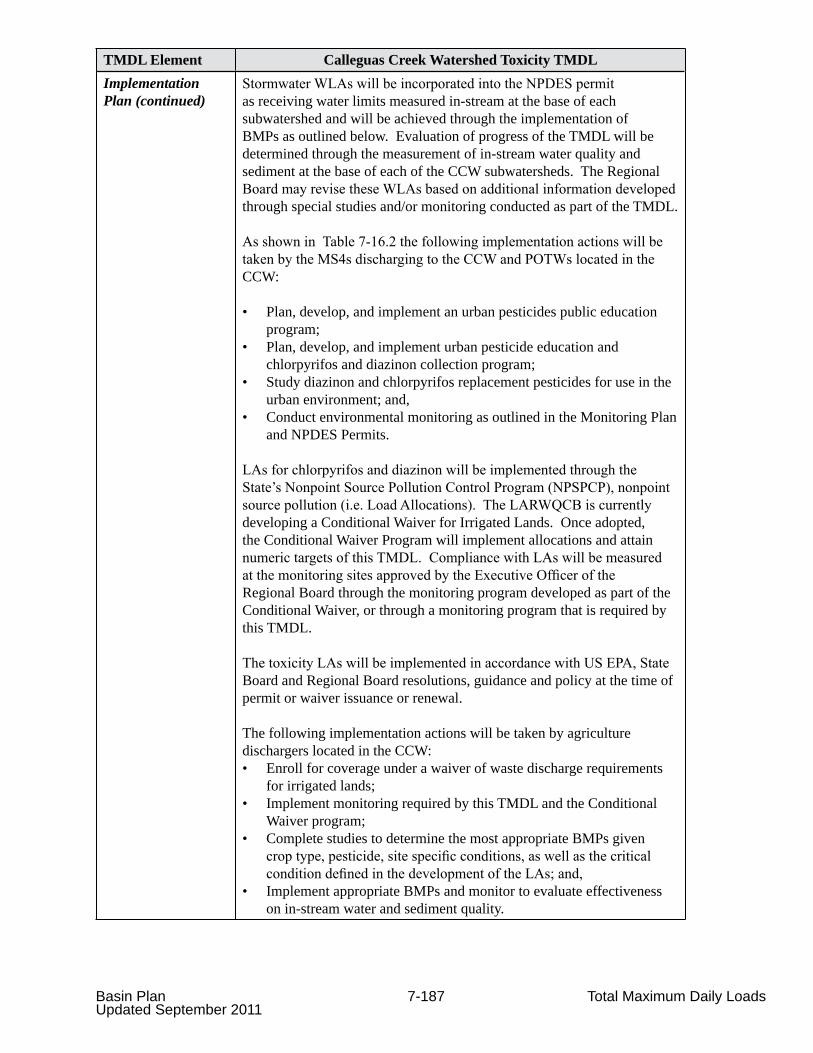
Basin Plan 7-�87 Total Maximum Daily LoadsUpdated September 20��
TMDL Element Calleguas Creek Watershed Toxicity TMDLImplementation Plan (continued)
StormwaterWLAswillbeincorporatedintotheNPDESpermitas receiving water limits measured in-stream at the base of each subwatershed and will be achieved through the implementation of BMPs as outlined below. Evaluation of progress of the TMDL will be determined through the measurement of in-stream water quality and sediment at the base of each of the CCW subwatersheds. The Regional BoardmayrevisetheseWLAsbasedonadditionalinformationdevelopedthrough special studies and/or monitoring conducted as part of the TMDL.
AsshowninTable7-16.2thefollowingimplementationactionswillbetakenbytheMS4sdischargingtotheCCWandPOTWslocatedintheCCW:
• Plan, develop, and implement an urban pesticides public education program;
• Plan, develop, and implement urban pesticide education and chlorpyrifos and diazinon collection program;
• Study diazinon and chlorpyrifos replacement pesticides for use in the urban environment; and,
• Conduct environmental monitoring as outlined in the Monitoring Plan and NPDES Permits.
LAsforchlorpyrifosanddiazinonwillbeimplementedthroughtheState’sNonpointSourcePollutionControlProgram(NPSPCP),nonpointsourcepollution(i.e.LoadAllocations).TheLARWQCBiscurrentlydeveloping a Conditional Waiver for Irrigated Lands. Once adopted, the Conditional Waiver Program will implement allocations and attain numerictargetsofthisTMDL.CompliancewithLAswillbemeasuredatthemonitoringsitesapprovedbytheExecutiveOfficeroftheRegional Board through the monitoring program developed as part of the Conditional Waiver, or through a monitoring program that is required by this TMDL.
ThetoxicityLAswillbeimplementedinaccordancewithUSEPA,StateBoard and Regional Board resolutions, guidance and policy at the time of permit or waiver issuance or renewal.
The following implementation actions will be taken by agriculture dischargers located in the CCW:• Enroll for coverage under a waiver of waste discharge requirements
for irrigated lands;• Implement monitoring required by this TMDL and the Conditional
Waiver program;• Complete studies to determine the most appropriate BMPs given
croptype,pesticide,sitespecificconditions,aswellasthecriticalconditiondefinedinthedevelopmentoftheLAs;and,
• Implement appropriate BMPs and monitor to evaluate effectiveness on in-stream water and sediment quality.

Basin Plan 7-�88 Total Maximum Daily LoadsUpdated September 20��
TMDL Element Calleguas Creek Watershed Toxicity TMDLImplementationPlan (continued)
The Regional Board may revise this TMDL based on monitoring data and special studies of this TMDL. If the Regional Board revises NPDES permits or the Basin Plan to use other methods of evaluating toxicity or if other information supporting other methods becomes available, the Regional Board may reconsider this TMDL and revise the water toxicity numerictarget.Additionally,thedevelopmentofsedimentqualityguidelines or criteria and other water quality criteria revisions may call for the reevaluation of the TMDL. The Implementation Plan includes this provision for reevaluating the TMDL to consider sediment quality guidelines or criteria and revised water quality objectives and the results of implementation studies, if appropriate.

Basin Plan 7-�89 Total Maximum Daily LoadsUpdated September 20��
Table 7-16.2. Overall Implementation Schedule for Calleguas Creek Watershed Toxicity TMDLImplementation Action Responsible Party Date
1 Interim chlorpyrifos and diazinon waste-load allocations apply.1
POTW permittees andMS4Copermittees
Effective date2
2 Interim chlorpyrifos and diazinon load allocations apply.1 AgriculturalDischargers Effective date2
3Finalize and submit workplan for integrated Calleguas Creek Watershed Monitoring Program for approval by the RegionalBoardExecutiveOfficer. 3
POTW permittees, MS4Copermittees,andAgriculturalDischargers
6 months after effective date of amendment2
4 Initiate Calleguas Creek Watershed Toxicity TMDL Monitoring Program developed under Task 3 workplan.
POTW permittees, MS4Copermittees,andAgriculturalDischargers
6 months after E.O. approval of Monitoring Program (task 3) workplan.
5
Conduct Special Study #1-Investigate the pesticides that will replace diazinon and chlorpyrifos in the urban environment, their potential impact on receiving waters, and potential control measures.
POTW permittees andMS4Copermittees
2 years after effective date2
6
Conduct Special Study #2 – Consider results of monitoring of sediment concentrations by source/land use type through special study required in Special Study #1 of the OC Pesticides, PCBs and siltation TMDL Implementation Plan. If the special study is not completed through the OC Pesticides, PCBs and Siltation TMDL no consideration is necessary3
AgriculturalDischargers3 and MS4Copermittees
6 months after completion of CCW OC Pesticides, PCBs and Siltation TMDL sediment concentrations special study.2
7
Develop and implement collection program for diazinon and chlorpyrifos and an educational program. Collection and education could occur through existing programs such as household hazardous waste collection events
POTW permittees andMS4Copermittees
3 years after effective date2
8
DevelopanAgriculturalWaterQualityManagementPlanin conjunction with the Conditional Waiver for Irrigated Lands, or (if the Conditional Waiver is not adopted in a timelymanner)developanAgriculturalWaterQualityManagement Plan as part of the Calleguas Creek WMP.
AgriculturalDischargers3 3 years after effective date2
9Identify the most appropriate BMPs given crop type, pesticide,sitespecificconditions,aswellasthecriticalconditiondefinedinthedevelopmentoftheLAs.
AgriculturalDischargers3 3 years after effective date2
10 ImplementeducationalprogramonBMPsidentifiedintheAgriculturalWaterQualityManagementPlan.
AgriculturalDischargers
1 year after E.O. approval of Plan(Task7)2
11
Conduct Special Study #3-Calculation of sediment transport rates in CCW. Considerfindingsoftransportrates developed through Special Study #1 of the OC Pesticides, PCBs and siltation TMDL Implementation Plan. If the special study is not completed through the OCs TMDL, no consideration is necessary.3
AgriculturalDischargers3 and MS4Copermittees
6 months after completion of CCW OC Pesticides, PCBa and Siltation TMDL sediment transport special study.2
12 Begin implementation of BMPs. AgriculturalDischargers3
1 year after E.O. approval of Plan (Task 8)2
13 Evaluate effectiveness of BMPs. AgriculturalDischargers3
3 years after E.O. approval of Plan (Task 8)2

Basin Plan 7-�90 Total Maximum Daily LoadsUpdated September 20��
Implementation Action Responsible Party Date
14
ReevaluatetheTMDLs,interimorfinalWLAsandLAs,and implementation schedule based on monitoring data andontheresultsofImplementationActions1-13andif sediment guidelines are promulgated, or water quality criteria are revised, and/or if targets are achieved without attainmentofWLAsorLAs.
Stakeholders and Regional Board 2 years after the submittal
of information necessary to reevaluate the TMDL
15 AchievementofFinalWLAsPOTW permittees andMS4Copermittees
2 years after the effective date of the TMDL2
16 AchievementofFinalLAs AgriculturalDischargers
10 years after the effective date of the TMDL2
1InterimWLAsandLAsareeffectiveimmediatelyuponTMDLadoption.WLAswillbeplacedinPOTWNPDESpermitsaseffluentlimits.WLAswillbeplacedinstormwaterNPDESpermitsasin-streamlimits.LAswillbeimplementedusing applicable regulatory mechanisms.2 Effective date of this TMDL.3 The Regional Board regulatory programs addressing all discharges in effect at the time an implementation task is due may contain requirements substantially similar to the requirements of an implementation task. If such a requirement is in place inanotherregulatoryprogramincludingotherTMDLs,theExecutiveOfficermaydeterminethatsuchotherrequirements satisfy the requirements of an implementation task of the TMDL and thereby coordinate this TMDL implementation plan with other regulatory programs.

Basin Plan 7-�9� Total Maximum Daily LoadsUpdated September 20��
7-17 Calleguas Creek Organochlorine Pesticides, Polychlorinated Biphenyls, and Siltation TMDL
This TMDL was adopted by: TheRegionalWaterQualityControlBoardonJuly7,2005.
This TMDL was approved by:The State Water Resources Control Board on September 22, 2005.TheOfficeofAdministrativeLawonJanuary20,2006.TheU.S.EnvironmentalProtectionAgencyonMarch14,2006.
TheeffectivedateofthisTMDLis:March24,2006.
The following table includes the elements of the TMDL:
Table 7-17.1. Calleguas Creek Watershed OC Pesticides, PCBs, and Siltation TMDL: ElementsTMDL Element Calleguas Creek Watershed OC Pesticide, PCBs, and Siltation TMDLProblem Statement
Eleven of fourteen reaches in the Calleguas Creek Watershed (CCW) were identifiedonthe2002303(d)listofwater-qualitylimitedsegmentsasimpaireddue to elevated levels of organochlorine (OC) pesticides and/or polychlorinated biphenyls(PCBs)inwater,sediment,and/orfishtissue.Additionally,MuguLagoon was listed as impaired for sedimentation/siltation. OC pesticides and PCBscanbioaccumulateinfishtissueandcausetoxicitytoaquaticlifeinestuarineand inland waters. Siltation may transport OC Pesticides and PCBs to surface waters and impair aquatic life and wildlife habitats.
NumericTargets
Thefollowingtablesprovidethetargetsforwater,fishtissue,andsedimentforthis TMDL. Water column targets were derived from the California Toxic Rule (CTR) water quality criteria for protection of aquatic life. Chronic criteria (Criteria Continuous Concentration, or CCC) were applied unless otherwise noted in the table below:
Water Quality Targets (ng/L)1
Constituent Freshwater Marine2
Aldrin300.0130.0Chlordane4.34.0Dacthal 3,500,000.0 (a)3
4,4’-DDD4 (a)3 (a)3
4,4’-DDE5 (a)3 (a)3
4,4’-DDT6 1.0 1.0Dieldrin 56.0 1.9EndosulfanI56.08.7EndosulfanII56.08.7Endrin 36.0 2.3HCH (alpha-BHC7) (a)3 (a)3
HCH (beta-BHC) (a)3 (a)3
HCH (delta-BHC) (a)3 (a)3
HCH (gamma BHC) 950.0 160.0Heptachlor 3.8 3.6Heptachlor Epoxide 3.8 3.6PCBs140.08 30.0Toxaphene 0.2 0.2
1 ng/L: nanogram per litter 2 Marine numeric targets applied to Mugu Lagoon 3 Numeric targets have not been established for these constituents4DDD:Dichlorodiphenyldichloroethane 5 DDE: Dichlorodiphenyldichloroethylene 6 DDT: Dichlorodiphenyltrichloroethane7BHC:Hexachlorocyclohexane8 AppliestosumofallcongenerorisomerorhomologorArocloranalyses

Basin Plan 7-�92 Total Maximum Daily LoadsUpdated September 20��
TMDL Element Calleguas Creek Watershed OC Pesticide, PCBs, and Siltation TMDLNumericTargets (continued)
Fish tissue targets are derived from CTR human health criteria for consumption of organisms.
Fish Tissue Targets (ng/Kg)Constituent Aldrin50.0Chlordane 830.0Dacthal (a)9 4,4’-DDD45,000.04,4’-DDE32,000.04,4’-DDT32,000.0Dieldrin 650.0Endosulfan I 65,000,000.0Endosulfan II 65,000,000.0Endrin 3,200,000.0HCH(alpha-BHC)1,700.00HCH (beta-BHC) 6,000.0HCH (delta-BHC) (a)9
HCH (gamma BHC) 8,200.Heptachlor2,400.0Heptachlor Epoxide 1,200.0PCBs 5,300.010
Toxaphene 9,800.0
Sediment targets were derived from sediment quality guidelines contained in NationalOceanographicandAtmosphericAdministration(NOAA)ScreeningQuick Reference Tables (SQuiRT, Buchman, 1999). Sediment Quality Targets (ng/dry Kg)
Constituent Freshwater, TEL11 Marine12, ERL13
Aldrin(a)9 (a)9
Chlordane4,500.0500.0Dacthal (a)9 (a)9
4,4’-DDD3,500.02,000.04,4’-DDE1,400.02,200.04,4’-DDT(a)9 1,000.0Dieldrin 2,900.0 20.0Endosulfan I (a)9 (a)9
Endosulfan II (a)9 (a)9
Endrin2,700.0(a)9
HCH (alpha-BHC) (a)9 (a)9
HCH (beta-BHC) (a)9 (a)9
HCH (delta-BHC) (a)9 (a)9
HCH(gammaBHC)940.0(a)9
Heptachlor (a)9 (a)9
Heptachlor Epoxide 600.0 (a)9
PCBs34,000.010 23,000.0Toxaphene (a)9 (a)9
9 Numeric targets have not been established for these constituents10 AppliestosumofallcongenerorisomerorhomologorArocloranalyses11 TEL=ThresholdEffectsLevel12 Marine numeric targets applied to Mugu Lagoon13 ERL=EffectsRange-Low.

Basin Plan 7-�9� Total Maximum Daily LoadsUpdated September 20��
TMDL Element Calleguas Creek Watershed OC Pesticide, PCBs, and Siltation TMDLSiltation Targets
This TMDL includes two numeric targets for siltation reduction and maintenance of existing habitat in Mugu Lagoon which are listed below:
• Siltation reduction Annualaveragereductionintheimportofsiltof5,200tons/year,whichwill be measured at the US Naval Base total suspended sediment gauge at the entrance to Mugu Lagoon.
• Maintenance of existing habitat in Mugu Lagoon Preservation of the existing1400acresofaquatichabitatinMuguLagoon.
Source Analysis Monitoring data from major NPDES discharges and land use runoff were analyzed to estimate the magnitude of OC pesticides and PCBs loads to Calleguas Creek, its tributaries and Mugu Lagoon. The largest source of OC pesticides in the listed waters is agricultural runoff. Most PCB residues are due to past use of PCBs as coolants and lubricants in transformers, capacitors, and other electrical equipment. AtmosphericdepositionisalsoapotentialsourceofPCBs.UrbanrunoffandPOTWs are minor sources of OC pesticides and PCBs. Data analysis suggests thatgroundwater,atmosphericdeposition,andimportedwaterarenotsignificantsources of OC pesticides, PCBs, or sediment. Further evaluation of these sources is set forth in the Implementation Plan.
Linkage Analysis The linkage analysis is based on a conceptual model for the fate, transformation, and uptake of OC pesticides and PCBs and a mass-balance model that connects the sources of OC pesticides and PCBs to their fate and transport in Calleguas Creek, its tributaries, and Mugu Lagoon. The linkage analysis indicates: 1) OC pesticides and PCBs concentrations in tissue are proportional to OC pesticides and PCBs concentrations in sediments; 2) OC pesticides and PCBs concentrations in water are a function of OC pesticides and PCBs concentrations in sediment; and 3) OC pesticides and PCBs concentrations in sediment are a function of OC pesticides and PCBs loading and sediment transport. Because sediments store, convey and serve as a source of OC pesticides and PCBs, a reduction of OC pesticides and PCBs concentrations in sediment will result in a reduction of OC pesticides and PCBsconcentrationinthewatercolumnandfishtissue.Inthislinkageanalysis,DDE is used as a representative constituent, because DDE is consistently detected in monitoring and exceeds numeric targets in water, sediment, and tissue samples. Also,otherOCPesticidesandPCBspossesssimilarphysicalandchemicalproperties to DDE.

Basin Plan 7-�94 Total Maximum Daily LoadsUpdated September 20��
TMDL Element Calleguas Creek Watershed OC Pesticide, PCBs, and Siltation TMDLWasteload Allocations
1. Interim and Final WLAs* for Pollutants in Effluent for POTWs.
The interim wasteload allocations for POTWs will be re-considered by the Regional Board on a 5-year basis. This re-consideration will be based on sufficientdatatocalculateInterimWasteloadAllocationsinaccordancewithSIP procedures.
a) Interim WLAs (ng/L)
Constituent POTW Hill Canyon Simi Valley Moorpark Camarillo Camrosa Daily Daily Daily Daily DailyChlordane 1.2 100.0 100.0 100.0 100.04,4-DDD20.050.050.06.050.04,4-DDE260.01.21.2188.050.04,4-DDT10.010.010.010.010.0Dieldrin 10.0 10.0 10.0 10.0 10.0PCBs 500.0 500.0 500.0 31.0 500.0Toxaphene 500.0 500.0 500.0 500.0 500.0
*WLAsshallbeappliedtoPOTWs’effluent
b) Final WLAs (ng/L)
Constituent POTW Hill Canyon Simi Valley Moorpark Camarillo Camrosa Daily Monthly Daily Monthly Daily Monthly Daily Monthly Daily MonthlyChlordane 1.2 0.59 1.2 0.59 1.2 0.59 1.2 0.59 1.2 0.594,4-DDD1.70.841.70.841.70.841.70.841.70.844,4-DDE1.20.591.20.591.20.591.20.591.20.594,4-DDT1.20.591.20.591.20.591.20.591.20.59Dieldrin0.280.140.280.140.280.140.280.140.280.14PCBs0.340.170.340.170.340.170.340.170.340.17Toxaphene 0.33 0.16 0.33 0.16 0.33 0.16 0.33 0.16 0.33 0.16
ThefinalWLAswillbeincludedinNPDESpermitsinaccordancewithscheduleintheimplementationplan.TheRegionalBoardmayrevisefinalWLAspriortothedatestheyareplacedintopermitsand/orpriortothedatesoffinalWLAachievement based on special studies and monitoring of this TMDL.

Basin Plan 7-�95 Total Maximum Daily LoadsUpdated September 20��
TMDL Element Calleguas Creek Watershed OC Pesticide, PCBs, and Siltation TMDLWasteload Allocations (continued)
2. Interim and Final WLAs for Pollutants in Sediment for Stormwater Permittees
a) Interim WLAs (ng/g)Constituent SubwatershedMuguCalleguasRevolonArroyoArroyoConejo Lagoon1 Creek Slough Las Posas Simi CreekChlordane25.017.048.03.33.33.44,4-DDD69.066.0400.0290.014.05.34,4-DDE300.0470.01,600.0950.0170.020.04,4-DDT39.0110.0690.0670.025.02.0Dieldrin19.03.05.71.11.13.0PCBs180.03,800.07,600.025,700.025,700.03,800.0Toxaphene22,900.0260.0790.0230.0230.0260.0
CompliancewithsedimentbasedWLAsismeasuredasanin-streamannualaverage at the base of each subwatershed where the discharges are located.
b) Final WLAs (ng/g)
Constituent SubwatershedMuguCalleguasRevolonArroyoArroyoConejo Lagoon1 Creek Slough Las Posas Simi CreekChlordane 3.3 3.3 0.9 3.3 3.3 3.34,4-DDD2.0 2.0 2.0 2.0 2.0 2.0 4,4-DDE2.2 1.4 1.4 1.4 1.4 1.44,4-DDT0.30.30.30.30.30.3Dieldrin4.30.20.10.20.20.2PCBs 180.0 120.0 130.0 120.0 120.0 120.0Toxaphene 360.0 0.6 1.0 0.6 0.6 0.6
1TheMuguLagoonsubwatershedincludesDuckPond/AgriculturalDrain/Mugu/OxnardDrain#2.
CompliancewithsedimentbasedWLAsismeasuredasanin-streamannualaverage at the base of each subwatershed where the discharges are located.
3. Final WLAs for Pollutants in Water Column for Minor Point Sources
WLAsforpollutantsinwatercolumnareallocatedbelowtominorpointsourcesenrolled under NPDES permits or WDRs, which discharge to Calleguas Creek.
ConstituentDailyMaximum(ng/L)MonthlyAverage(ng/L)Chlordane 1.2 0.59 4,4-DDD1.70.844,4-DDE1.20.594,4-DDT1.20.59Dieldrin0.280.14PCBs0.340.17Toxaphene 0.33 0.16
4. Siltation WLA for MS4MS4dischargerswillreceiveanallocationof2,496-tons/yr.reductioninsediment yield to Mugu Lagoon. The baseline from which the load reduction will be evaluated will be determined by a special study of this TMDL. The load allocation will apply after the baseline is established, as described in the Implementation Plan.

Basin Plan 7-�96 Total Maximum Daily LoadsUpdated September 20��
TMDL Element Calleguas Creek Watershed OC Pesticide, PCBs, and Siltation TMDLLoad Allocations CompliancewithsedimentbasedLAslistedbelowismeasuredasanin-stream
annual average at the base of each subwatershed.
1. Interim and Final Load Allocations
a) Interim Sediment LAs (ng/g)
Constituent SubwatershedMuguCalleguasRevolonArroyoArroyoConejo Lagoon1 Creek Slough Las Posas Simi CreekChlordane25.017.048.03.33.33.44,4-DDD69.066.0400.0290.014.05.34,4-DDE300.0470.01,600.0950.0170.020.04,4-DDT39.0110.0690.0670.025.02.0Dieldrin19.03.05.71.11.13.0PCBs180.03,800.07,600.025,700.025,700.03,800.0Toxaphene22900.0260.0790.0230.0230.0260.0
1 TheMuguLagoonsubwatershedincludesDuckPond/AgriculturalDrain/Mugu/OxnardDrain#2.
b) Final Sediment LAs (ng/g)
Constituent SubwatershedMuguCalleguasRevolonArroyoArroyoConejo Lagoon1 Creek Slough Las Posas Simi CreekChlordane 3.3 3.3 0.9 3.3 3.3 3.34,4-DDD2.0 2.0 2.0 2.0 2.0 2.04,4-DDE2.2 1.4 1.41.4 1.4 1.44,4-DDT0.30.30.30.30.30.3Dieldrin4.30.20.10.20.20.2PCBs 180.0 120.0 130.0 120.0 120.0 120.0Toxaphene 360.0 0.6 1.0 0.6 0.6 0.6
1 TheMuguLagoonsubwatershedincludesDuckPond/AgriculturalDrain/Mugu/OxnardDrain#2.
2. Siltation LAs
Agriculturaldischargerswillreceiveanallocationof2,704tons/yr.Reductionin sediment yield to Mugu Lagoon. The baseline from which the load reduction will be evaluated will be determined by a special study of this TMDL. The load allocation will apply after the baseline is established, as described in the Implementation Plan.
Margin of Safety This TMDL relies on an implicit margin of safety, by incorporating conservative assumptions throughout its development, including:
Basingpercentreductionsonthehistoricaldatasetofwaterandfishtissueconcentrations,whichdoesnotreflecttheeffectsofattenuationtheoverthepast ten years.
Determining the percent reduction in sediment, by basing it on the greater percentreductionofeitherwaterorfishtissueconcentrationsbasedonavailable data.

Basin Plan 7-�97 Total Maximum Daily LoadsUpdated September 20��
TMDL Element Calleguas Creek Watershed OC Pesticide, PCBs, and Siltation TMDLMargin of Safety (continued)
Reducing the allowable concentration for upstream subwatersheds, to ensure protection of those subwatersheds downstream from upstream inputs.
Choosing Threshold Effects Levels (TELs) and Effects Range Lows (ERLs) as numeric targets for sediment, which are the most protective applicable sediment guidelines.
Selecting the more stringent of the allowable concentration (as calculated by percent reduction methodology) or the numeric target for sediment (TEL or ERL),whenavailable,astheWLAandLAforallreacheswith303(d)listingsfor sediment.
Future Growth VenturaCountyaccountsforslightlymorethan2%ofthestate’sresidentswithapopulationof753,197(USCensusBureau,2000).GISanalysisofthe2000censusdatayieldsapopulationestimateof334,000fortheCCW,whichequalsabout44%ofthecountypopulation.AccordingtotheSouthernCaliforniaAssociationofGovernments(SCAG),growthinVenturaCountyaveragedabout51%perdecadefrom1900-2000;withgrowthexceeding70%inthe1920s,1950s,and1960s.Significantpopulationgrowthisexpectedtooccurwithinandnearpresentcitylimits until at least 2020. Since most of the listed OCs and PCBs in the CCW are banned, this growth is not expected to increase current loads. Urban application of those OC pesticides which are still legal (dacthal and endosulfan) may increase, but overall use may decrease because urban expansion tends to reduce total acreage of agricultural land.
PopulationgrowthmayresultingreaterOCloadingtoPOTWinfluentfromwashing food products containing OC residues. This loading may be proportional to the increase in population, if per capita domestic water use and pesticide load perhouseholdremainconstant.IncreasedflowfromPOTWsshouldnotresultinimpairmentoftheCCWaslongaseffluentconcentrationstandardsaremetforeach POTW.
Asurbandevelopmentoccurs,constructionactivitiesmayhavearangeofeffectson OC loading to the CCW. Exposure of previously vegetated or deeply buried soil might lead to increased rates of transportation and volatilization. Conversely, urbanization of open space and/or agriculture areas may cover OC pesticides bound to sediments.
Future growth in the CCW may result in increased groundwater concentrations of currently used OC pesticides. This is a potential concern for dacthal, which is still used and has been found in groundwater (although current levels of dacthal are significantlylowerthanallavailabletargets).TheeffectsoffuturegrowthuponPCBloadsareunknown,butnotlikelytoprovesignificant,sinceatmosphericdepositionandaccidentalspillsaretheprimaryloadingpathways.Anyincreasein OCs due to population growth may be offset by decreased inputs from banned OCs, as their presence attenuates due to fate and transport processes.

Basin Plan 7-�98 Total Maximum Daily LoadsUpdated September 20��
TMDL Element Calleguas Creek Watershed OC Pesticide, PCBs, and Siltation TMDLCritical Conditions
The linkage analysis found correlation between concentrations of OC pesticides and PCBs in water and total suspended solids (TSS), and a potential correlation between OC pesticides and PCBs concentrations in water and seasonality (wet vs. dryseason).Asimilarcorrelationbetweensedimentloadingandwetweatherisalso noted.
OC pesticides and PCB pollutants are of potential concern in the Calleguas Creek Watershed due to possible long-term loading and food chain bioaccumulation effects. There is no evidence of short-term effects. However, pollutant loads and transportwithinthewatershedmayvaryunderdifferentflowandrunoffconditions.ThereforetheTMDLsconsiderseasonalvariationsinloadsandflowsbutareestablished in a manner which accounts for the longertime horizon in which ecological effects may occur.
Wet weather events, which may occur at any time of the year, produce extensive sediment redistribution and transport downstream. This would be considered the critical condition for loading. However, the effects of organochlorine compounds are manifested over long time periods in response to bioaccumulation in the food chain. Therefore, short-term loading variations (within the time scale of wet and dryseasonseachyear)arenotlikelytocausesignificantvariationsinbeneficialuseeffects.Therefore,althoughseasonalvariationsinloadsandflowswereconsidered, the TMDL was established in a manner which accounts for the longer time horizon in which ecological effects may occur
Implementation Plan
ThefinalWLAswillbeincludedinNPDESpermitsinaccordancewiththecomplianceschedulesprovidedinTable7-17.2.TheRegionalBoardmayrevisetheseWLAsbasedonadditionalinformationdevelopedthroughSpecialStudiesand/or Monitoring of this TMDL.
WLAsestablishedforthefivemajorPOTWsinthisTMDLwillbeimplementedthrough NPDES permit limits. The proposed permit limits will be applied as end-of-pipeconcentration-basedeffluentlimitsforPOTWs.CompliancewillbedeterminedthroughmonitoringoffinaleffluentdischargeasdefinedintheNPDESpermit. The implementation plan for POTWs focuses on implementation of source control activities. Consideration of annual averaging of compliance data will be evaluated at the time of permit renewal based on available information, Regional Boardpolicies,andUSEPAapproval.

Basin Plan 7-�99 Total Maximum Daily LoadsUpdated September 20��
TMDL Element Calleguas Creek Watershed OC Pesticide, PCBs, and Siltation TMDLImplementation Plan (continued)
Inaccordancewithcurrentpractice,agroupconcentration-basedWLAhasbeendevelopedforMS4s,includingtheCaltransMS4.Thegroupedallocationwillapply to all NPDES-regulated municipal stormwater discharges in the CCW. Other NPDES-regulated stormwater permittees will be assigned a concentration-based WLAconsistentwiththeinterimandfinalWLAssetforthabove.StormwaterWLAswillbeincorporatedintotheNPDESpermitasreceivingwaterlimitsmeasured at the downstream points of each subwatershed and are expected to be achieved through the implementation of BMPs as outlined in the implementation plan.
The Regional Board will need to ensure that permit conditions are consistent withtheassumptionsoftheWLAs.IfBMPsaretobeused,theRegionalBoardwillneedtodetailitsfindingsandconclusionssupportingtheuseofBMPsinthe NPDES permit fact sheets. Should federal, state, or regional guidance or practiceforimplementingWLAsintopermitsberevised,theRegionalBoardmayreevaluated the TMDL to incorporate such guidance.
LAswillbeimplementedthroughtheState’sNonpointSourcePollutionControlProgram(NPSPCP).TheLARWQCBisdevelopingaConditionalWaiverforIrrigated Lands, which includes monitoring at sites subject to approval by the ExecutiveOfficeroftheRegionalBoard.ShouldadoptionoftheConditionalWaiver be delayed, monitoring will be required as part of this TMDL.
Studies are currently being conducted to assess the effectiveness of BMPs for reduction of pollutants from agricultural operations. Results will be used todevelopAgriculturalWaterQualityManagementPlans,includingtheimplementationofagriculturalBMPs.Additionally,anagriculturaleducationprogram will be developed to inform growers of the recommended BMPs and the Management Plan.
AsshowninTable7-17.2,implementationactionswillbetakenbyagriculturaldischargers located in the CCW. The implementation of agricultural BMPs will be based on a comprehensive approach to address pollutant loads discharged from agriculturaloperations.TheRegionalBoardmayrevisetheseLAsbasedonthecollection of additional information developed through special studies and/or monitoring conducted as part of this TMDL. AnumberofprovisionsinthisTMDLmightprovideinformationthatcouldresultinrevisionstotheTMDL.Additionally,thedevelopmentofsedimentqualitycriteria and other water quality criteria revisions may require the reevaluation of this TMDL. Finally, the use of OC pesticides in other countries which may be present in imported food products, compounded with the persistence of OC pesticides and PCBs in the environment, indicate that efforts to control sources and transport of OCs to receiving waters may not result in attainment of targets and allocations due to activities that are outside the control of local agencies and agriculture. For these reasons, the Implementation Plan includes this provision for reevaluating the TMDL to consider revised water quality objectives and the results of implementation studies, if appropriate.

Basin Plan 7-200 Total Maximum Daily LoadsUpdated September 20��
TMDL Element Calleguas Creek Watershed OC Pesticide, PCBs, and Siltation TMDLImplementation Plan (continued)
The siltation portion of the TMDL includes wasteload and load allocations set as an annual mass reduction from a baseline value of sediment and silt deposited in Mugu Lagoon. The baseline value of sediment and silt conveyed to Mugu Lagoon is to be determined by a TMDL Special Study and established by the Regional Board through an amendment to the TMDL. The Special Study is eight years in duration to ensure that the full range of current conditions that affect loading of sediment and siltation to Mugu Lagoon are considered. If appropriate, the Special Study may also result in a revision to the mass load reduction. The Special Study willbeoverseenbyaScienceAdvisoryPanelconsistingoflocal,regional,and/ornationalexpertsinestuarinehabitatbiology,hydrology,andengineering.Attheconclusion of the special study, the Regional Board will reconsider the TMDL to establish sustainable wasteload and load allocations recommended by the Special Studytosupportaquaticlifeandwetlandhabitatbeneficialuses.
In implementing this TMDL, staff recognize that dischargers may be implementing management measures and management practices to reduce sediment and Siltation loads through permit and waiver programs during the special studies. Further, since the effective date of the Consent Decree, reaches of Calleguas Creek have been listed due to sediment, and another TMDL may be initiated during the Special StudyofthisTMDL.Staff’sintentistocoordinatetherequirementsofthisTMDLwith other programs that reduce sedimentation and siltation. The Special Study can consider sediment and silt load reductions through existing permits and the forthcoming conditional waiver for irrigated lands. Load and wasteload allocations become effective after the Regional Board actions based on the Special Study, nine years after the effective date of the TMDL.

Basin Plan 7-20� Total Maximum Daily LoadsUpdated September 20��
Table 7-17.2 Calleguas Creek Watershed OC Pesticides, PCBs, and Siltation TMDL: Implementation Schedule
Item Implementation Action 1 Responsible Party Completion Date
1 Interim organochlorine pesticide and polychlorinated biphenyls wasteload allocations apply.
NPDES Permittees
Effective date of the amendment
2 Interim organochlorine pesticide and polychlorinated biphenyls load allocations apply.
AgriculturalDischargers
Effective date of the amendment
3 Finalize and submit workplan for organochlorine pesticide and polychlorinated biphenyls TMDL monitoring, orfinalizeandsubmitaworkplanforanIntegratedCalleguas Creek Watershed organochlorine pesticide and polychlorinated biphenyls Monitoring Program for approval bytheExecutiveOfficer.Themonitoringworkplanwillinclude, but not be limited to, appropriate water, biota, and sediment loading and monitoring to verify attainment of targetsandprotectionofbeneficialuses.
POTW Permittees, MS4Permittees, AgriculturalDischargers, US Navy
6 months after effective date of the amendment
4 Initiate Calleguas Creek Watershed organochlorine pesticide, polychlorinated biphenyls, and siltation Monitoring Program developed under the Task 3 workplan approvedbytheExecutiveOfficer.
POTW Permittees, MS4Permittees, AgriculturalDischargers, US Navy
6 months after Executive OfficerapprovalofMonitoring Program (Task 3) workplan
5 SubmitaworkplanforapprovalbytheExecutiveOfficerto identify urban, industrial and domestic sources of organochlorine pesticides and polychlorinated biphenyls and control methods and to implement a collection and disposal program for organochlorine pesticides and polychlorinated biphenyls .
POTW Permittees, MS4Permittees, US Navy
1 year after effective date of the amendment
6 SubmitaworkplanforapprovalbytheExecutiveOfficerto identify agricultural sources and methods to implement a collection and disposal program for organochlorine pesticides and polychlorinated biphenyls.
AgriculturalDischargers
1 year after effective date of the amendment
7 Special Study #1 – Submit a workplan and convene a ScienceAdvisoryPaneltoquantifysedimentationinMuguLagoon and sediment transport throughout the Calleguas Creek Watershed. Evaluate management methods to control siltation and contaminated sediment transport to Calleguas Creek, identify appropriate BMPs to reduce sediment loadings, evaluate numeric targets and wasteload and load allocations for siltation/sedimentation to support habitat relatedbeneficialusesinMuguLagoon, evaluate the effect of sediment on habitat preservation in Mugu Lagoon, and evaluate appropriate habitat baseline, effectiveness of sediment and siltation load allocations on a subwatershed basis, and methods to restore habitat for approval by the ExecutiveOfficer.Additionally,thisspecialstudywillevaluate the concentration of organochlorine pesticides and polychlorinated biphenyls in sediments from various sources/land use types. 2
POTW Permittees, MS4Permittees, AgriculturalDischargers,
and US Navy
1 year after effective date of the amendment

Basin Plan 7-202 Total Maximum Daily LoadsUpdated September 20��
Item Implementation Action 1 Responsible Party Completion Date
8 Special study #2 – Conduct a study to identify land areas with high organochlorine pesticide and polychlorinated biphenyls concentrations, and submit a workplan including milestones and an implementation period that is as short as possible, but not to exceed 6 years, for removal to mitigate theeffectsoffloodcontrolpracticesonorganochlorinepesticides, polychlorinated biphenyls, and sediment loadings to Calleguas Creek waterbodies from any high concentrationareasidentified.Milestonesshallincludeproposed percentages of reductions achieved by removal. Such practices include but are not limited to management of agricultural runoff, sediment reduction practices and structures, streambank stabilization, and other projects relatedtostormwaterconveyanceandfloodcontrolimprovements in the Calleguas Creek watershed. 2
AgriculturalDischargers, MS4Permittees, US Navy
1 years after effective date of the amendment
9 DevelopanAgriculturalWaterQualityManagementPlanin consideration of the forthcoming Conditional Waiver for Irrigated Lands, or, if the Conditional Waiver for Irrigated Lands is not adopted in a timely manner, develop an AgriculturalWaterQualityManagementPlanaspartoftheCalleguas Creek WMP. Implement an educational program onBMPsidentifiedintheAgriculturalWaterQualityManagement Plan.
AgriculturalDischargers
3 years after effective date of the amendment
10 Based on results of the Task 5 workplan approved by ExecutiveOfficer,implementacollectionanddisposalprogram for organochlorine pesticides and polychlorinated biphenyls.
POTW Permittees, MS4Permittees, US Navy
5 years after effective of the amendment
11 Based on results of the Task 6 workplan approved by ExecutiveOfficerimplementacollectionanddisposalprogram for organochlorine pesticides and polychlorinated biphenyls.
AgriculturalDischargers
5 years after effective of the amendment
12 Re-evaluation of POTW Interim wasteload allocations for organochlorine pesticides and polychlorinated biphenyls based on State Implementation Plan procedures.
Regional Board 5 years, 10 years and 15 years after the effective date of the amendment
13 Special Study #1 – Submit results of Special Study #1, includingrecommendationsforrefiningthesiltationloadand wasteload allocations.
POTW Permittees, MS4Permittees, AgriculturalDischargers,
and US Navy
8 years after effective date of the amendment
14 Re-evaluation of siltation and sediment load and wasteload allocations based on Special Study #1.
Regional Board 9 years after effective date of the amendment
15 Effective date of siltation load allocation and wasteload allocation.
Agriculturaldischargers, USNavy,MS4permittees
9 years after effective date of the amendment

Basin Plan 7-20� Total Maximum Daily LoadsUpdated September 20��
Item Implementation Action 1 Responsible Party Completion Date
16 Special Study #3 – Evaluate natural attenuation rates and evaluate methods to accelerate organochlorine pesticide and polychlorinated biphenyl attenuation and examine the attainability of wasteload and load allocations in the Calleguas Creek Watershed. 2, 3
POTW Permittees ,AgriculturalDischargers,MS4Permittees, and US Navy
10 years after effective date of the amendment
17 SpecialStudy#4(optional)–Examineofthefoodwebandbioconcentration relationships throughout the watershed to evaluateassumptionscontainedintheLinkageAnalysisandensurethatprotectionofbeneficialusesisachieved. 2
Interested Parties
12 years after effective date of the amendment
18 BasedontheresultsofImplementationItems1-17,ifsediment guidelines are promulgated or water quality criteriaarerevised,and/oriffishtissueandwatercolumntargetsareachievedwithoutattainmentofWLAsorLAs,the Regional Board will consider revisions to the TMDL targets, allocations, and schedule for expiration of Interim WasteloadandInterimLoadAllocations.3
Regional Board 10 years after effective date of the amendment
19 AchieveFinalWLAsandLAs AgriculturalDischargers, POTW Permittees, and MS4Permittees
20 years after effective date of the amendment
1 The Regional Board regulatory programs addressing all discharges in effect at the time an implementation task is due may contain requirements substantially similar to the requirements of an implementation task. If such a requirement is in place inanotherregulatoryprogramincludingotherTMDLs,theExecutiveOfficermaydeterminethatsuchotherrequirements satisfy the requirements of an implementation task of this TMDL and thereby coordinate this TMDL implementation plan with other regulatory programs.2 Special studies included in the Implementation Plan are based on the TMDL Technical Documents.3Aftercompletionofthisspecialstudy,theTMDLwillbereopenedinordertoenabletheRegionalBoardtoevaluatewhetherashortertimeperiodisappropriatefortheachievementofthefinalWLAsandLAs.

Basin Plan 7-204 Total Maximum Daily LoadsUpdated September 20��
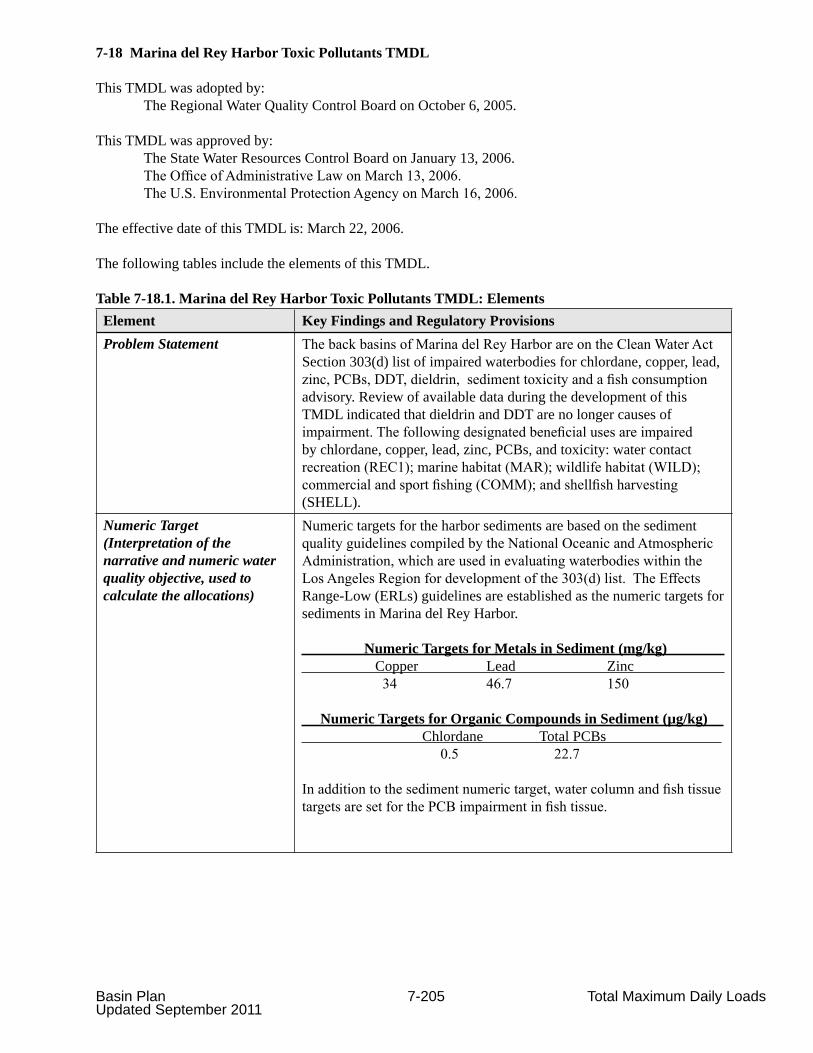
Basin Plan 7-205 Total Maximum Daily LoadsUpdated September 20��
7-18 Marina del Rey Harbor Toxic Pollutants TMDL
This TMDL was adopted by: The Regional Water Quality Control Board on October 6, 2005.
This TMDL was approved by: The State Water Resources Control Board on January 13, 2006. TheOfficeofAdministrativeLawonMarch13,2006. TheU.S.EnvironmentalProtectionAgencyonMarch16,2006.
The effective date of this TMDL is: March 22, 2006.
The following tables include the elements of this TMDL.
Table 7-18.1. Marina del Rey Harbor Toxic Pollutants TMDL: ElementsElement Key Findings and Regulatory ProvisionsProblem Statement ThebackbasinsofMarinadelReyHarborareontheCleanWaterAct
Section 303(d) list of impaired waterbodies for chlordane, copper, lead, zinc,PCBs,DDT,dieldrin,sedimenttoxicityandafishconsumptionadvisory. Review of available data during the development of this TMDL indicated that dieldrin and DDT are no longer causes of impairment.Thefollowingdesignatedbeneficialusesareimpairedby chlordane, copper, lead, zinc, PCBs, and toxicity: water contact recreation(REC1);marinehabitat(MAR);wildlifehabitat(WILD);commercialandsportfishing(COMM);andshellfishharvesting(SHELL).
Numeric Target (Interpretation of the narrative and numeric water quality objective, used tocalculate the allocations)
Numeric targets for the harbor sediments are based on the sediment qualityguidelinescompiledbytheNationalOceanicandAtmosphericAdministration,whichareusedinevaluatingwaterbodieswithintheLosAngelesRegionfordevelopmentofthe303(d)list.TheEffectsRange-Low (ERLs) guidelines are established as the numeric targets for sediments in Marina del Rey Harbor.
Numeric Targets for Metals in Sediment (mg/kg) Copper Lead Zinc 34 46.7150
Numeric Targets for Organic Compounds in Sediment (µg/kg) Chlordane Total PCBs 0.5 22.7
Inadditiontothesedimentnumerictarget,watercolumnandfishtissuetargetsaresetforthePCBimpairmentinfishtissue.

Basin Plan 7-206 Total Maximum Daily LoadsUpdated September 20��
Element Key Findings and Regulatory ProvisionsNumeric Target(Interpretation of the narrative and numeric water quality objective, used to calculate the allocations)(continued)
The California Toxics Rule (CTR) Criterion for the protection of human health from the consumption of aquatic organisms is selected as the finalnumerictargetfortotalPCBsinthewatercolumn.However,giventhe inability of current analytical methods to detect concentrations at this low level, an interim numeric target will be applied. The CTR Chronic Criterion for the protection of aquatic life in saltwater is selectedastheinterimnumerictargetforthefishtissueimpairmentby PCBs. This numeric target will remain in effect until advances in technology allow for analysis of PCBs at lower detection limits. Interim Target for total PCBs in the Water Column: 0.03µg/LFinal Target for total PCBs in the Water Column:0.00017µg/L
ThenumericTargetforPCBsinfishtissueistheThresholdTissueResidue Level that is derived from CTR human health criteria, which are adopted criteria for water designated to protect humans from consumptionofcontaminatedfishorotheraquaticorganisms.Numeric Target for total PCBs in Fish Tissue: 5.3 µg/Kg
Source Analysis Urban storm water has been recognized as a substantial source of metals. Numerous researchers have documented that the most prevalent metals in urban storm water (i.e., copper, lead, and zinc) are consistently associated with suspended solids. Because metals are typicallyassociatedwithfineparticlesinstormwaterrunoff,theyhavethe potential to accumulate in marine sediments where they may pose a risk of toxicity. Similar to metals, the majority of organic constituents in storm water are associated with particulates.
Passive leaching of copper-based anti-fouling paints is a potential sourceofcopperloadingtothesediment.However,thereisinsufficientinformation available to quantify the contribution of boat discharges to the sediment pollutant load. This TMDL requires a study designed to estimate copper partitioning between the water column and sediment in Marina del Rey harbor, in order to determine the impact of passive leaching on the marine sediment.
Direct deposition of airborne particles to the water surface may be responsible for contributing copper, lead and zinc to the Marina del Rey back basins. The estimated contribution from this source is minor.Indirectatmosphericdepositionreflectstheprocessbywhichmetals deposited on the land surface may be washed off during storm events and delivered to Marina del Rey Harbor. The loading of metals associated with indirect atmospheric deposition are accounted for in the storm water runoff.
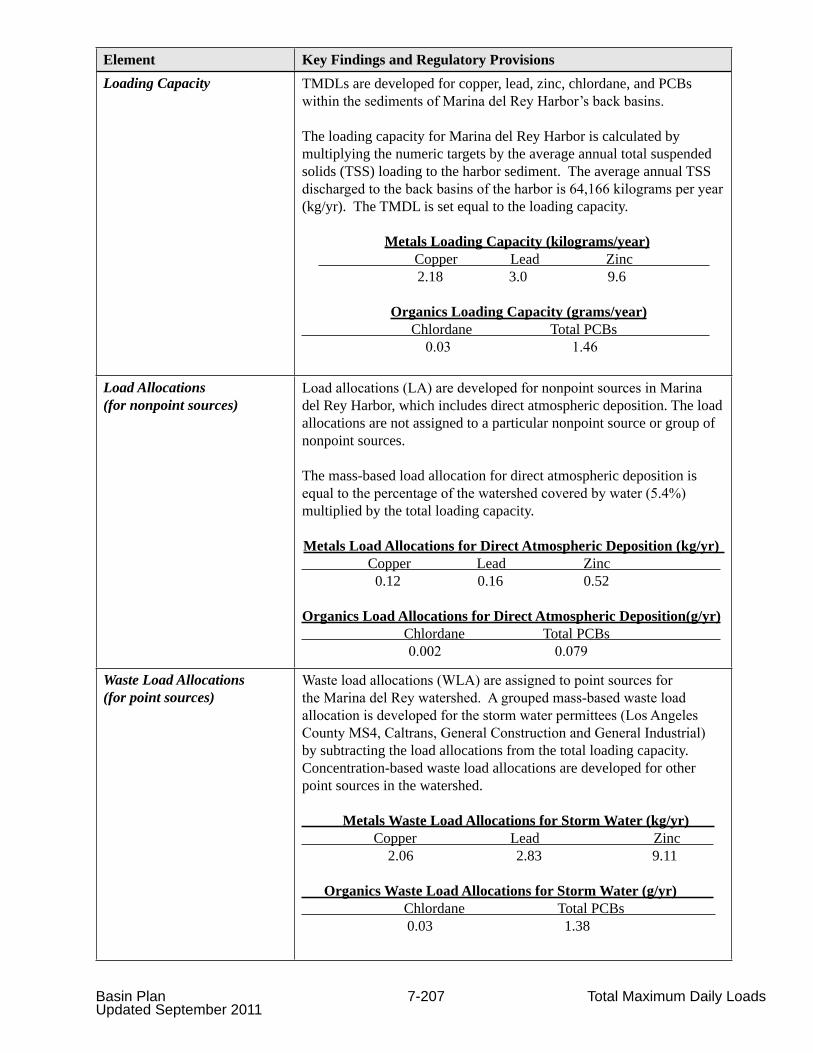
Basin Plan 7-207 Total Maximum Daily LoadsUpdated September 20��
Element Key Findings and Regulatory ProvisionsLoading Capacity TMDLs are developed for copper, lead, zinc, chlordane, and PCBs
withinthesedimentsofMarinadelReyHarbor’sbackbasins.
The loading capacity for Marina del Rey Harbor is calculated by multiplying the numeric targets by the average annual total suspended solids (TSS) loading to the harbor sediment. The average annual TSS dischargedtothebackbasinsoftheharboris64,166kilogramsperyear(kg/yr). The TMDL is set equal to the loading capacity.
Metals Loading Capacity (kilograms/year) Copper Lead Zinc 2.18 3.0 9.6
Organics Loading Capacity (grams/year) Chlordane Total PCBs 0.03 1.46
Load Allocations (for nonpoint sources)
Loadallocations(LA)aredevelopedfornonpointsourcesinMarinadel Rey Harbor, which includes direct atmospheric deposition. The load allocations are not assigned to a particular nonpoint source or group of nonpoint sources.
The mass-based load allocation for direct atmospheric deposition is equaltothepercentageofthewatershedcoveredbywater(5.4%)multiplied by the total loading capacity.
Metals Load Allocations for Direct Atmospheric Deposition (kg/yr) Copper Lead Zinc 0.12 0.16 0.52
Organics Load Allocations for Direct Atmospheric Deposition(g/yr) Chlordane Total PCBs 0.002 0.079
Waste Load Allocations (for point sources)
Wasteloadallocations(WLA)areassignedtopointsourcesfortheMarinadelReywatershed.Agroupedmass-basedwasteloadallocationisdevelopedforthestormwaterpermittees(LosAngelesCountyMS4,Caltrans,GeneralConstructionandGeneralIndustrial)by subtracting the load allocations from the total loading capacity. Concentration-based waste load allocations are developed for other point sources in the watershed.
Metals Waste Load Allocations for Storm Water (kg/yr) Copper Lead Zinc 2.06 2.83 9.11
Organics Waste Load Allocations for Storm Water (g/yr) Chlordane Total PCBs 0.03 1.38

Basin Plan 7-208 Total Maximum Daily LoadsUpdated September 20��
Element Key Findings and Regulatory ProvisionsWaste Load Allocations (for point sources)(continued)
The storm water waste load allocations are apportioned between the MS4permittees,Caltrans,thegeneralconstructionandthegeneralindustrial storm water permits based on an estimate of the percentage of land area covered under each permit.
Metals Storm Water WLAs Apportioned between Permits (kg/yr) Copper Lead Zinc
MS4Permittees 2.01 2.75 8.85Caltrans 0.022 0.03 0.096GeneralConstruction 0.033 0.045 0.144GeneralIndustrial 0.004 0.006 0.018
Organics Storm Water WLAs Apportioned between Permits (g/yr) Chlordane Total PCBs MS4Permittees 0.0295 1.34Caltrans 0.0003 0.015GeneralConstruction 0.0005 0.022GeneralIndustrial 0.0001 0.003
Each storm water permittee enrolled under the general construction or industrial storm water permits will receive an individual waste load allocation on a per acre basis, based on the acreage of their facility.
Metals per Acre WLAs for Individual General Construction or Industrial Storm Water Permittees (g/yr/ac) Copper Lead Zinc 2.3 3.1 10
Organics per acre WLAs for Individual General Construction or Industrial Storm Water Permittees (mg/yr/ac) Chlordane Total PCBs 0.03 1.5
Concentration-based waste load allocations are assigned to the minor NPDES permits and general non-storm water NPDES permits that dischargetoMarinadelReyHarbor.AnyfutureminorNPDESpermitsor enrollees under a general non-storm water NPDES permit will also be subject to the concentration-based waste load allocations.
Metals Concentration-based Waste Load Allocations (mg/kg) Copper Lead Zinc 34 46.7 150
Organic Concentration-based Waste Load Allocations (µg/kg) Chlordane Total PCBs 0.5 22.7
Margin of Safety Animplicitmarginofsafetyisappliedthroughtheuseofthemoreprotective sediment quality guideline values. The ERLs were selected over the higher ERMs as the numeric targets.

Basin Plan 7-209 Total Maximum Daily LoadsUpdated September 20��
Element Key Findings and Regulatory ProvisionsImplementation The regulatory mechanisms used to implement the TMDL will include
theLosAngelesCountyMunicipalStormWaterNPDESPermit(MS4),the State of California Department of Transportation (Caltrans) Storm Water Permit, minor NPDES permits, general NPDES permits, general industrial storm water NPDES permits, general construction storm water NPDES permits. Nonpoint sources will be regulated through the authority contained in sections 13263 and 13269 of the Water Code,inconformancewiththeStateWaterResourcesControlBoard’sNonpointSourceImplementationandEnforcementPolicy(May2004).EachNPDESpermitassignedaWLAshallbereopenedoramendedat re-issuance, in accordance with applicable laws, to incorporate the applicableWLAsasapermitrequirement.
The Regional Board shall reconsider this TMDL in six years after the effective date of the TMDL based on additional data obtained from specialstudies.Table7-18.2presentstheimplementationscheduleforthe responsible permittees.
Minor NPDES Permits and General Non-Storm Water NPDES Permits:
The concentration-based waste load allocations for the minor NPDES permits and general non-storm water NPDES permits will be implemented through NPDES permit limits. Permit writers may translateapplicablewasteloadallocationsintoeffluentlimitsfortheminor and general NPDES permits by applying applicable engineering practices authorized under federal regulations. The minor and existing general non-storm water NPDES permittees are allowed up to seven years from the effective date of the TMDL to achieve the waste load allocations.
General Industrial Storm Water Permit:TheRegionalBoardwilldevelopawatershedspecificgeneralindustrial storm water permit to incorporate waste load allocations. Concentration-based permit limits may be set to achieve the mass-based waste load allocations. These concentration-based limits would be equal to the concentration-based waste load allocations assigned to the other NPDES permits. It is expected that permit writers will translate the waste load allocations into BMPs, based on BMP performance data.However,thepermitwritersmustprovideadequatejustificationanddocumentationtodemonstratethatspecifiedBMPsareexpectedtoresult in attainment of the numeric waste load allocations. The general industrial storm water permittees are allowed up to seven years from the effective date of the TMDL to achieve the waste load allocations.
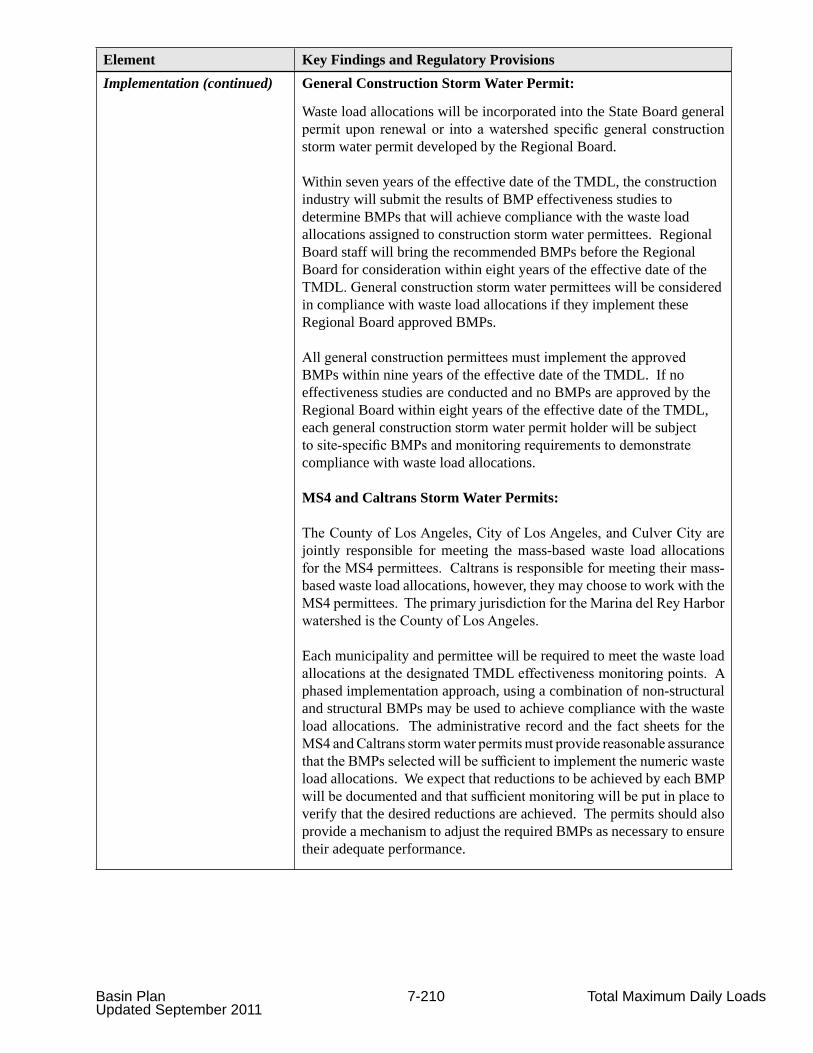
Basin Plan 7-2�0 Total Maximum Daily LoadsUpdated September 20��
Element Key Findings and Regulatory ProvisionsImplementation (continued) General Construction Storm Water Permit:
Waste load allocations will be incorporated into the State Board general permitupon renewalor intoawatershed specificgeneral constructionstorm water permit developed by the Regional Board.
Within seven years of the effective date of the TMDL, the construction industry will submit the results of BMP effectiveness studies to determine BMPs that will achieve compliance with the waste load allocations assigned to construction storm water permittees. Regional Board staff will bring the recommended BMPs before the Regional Board for consideration within eight years of the effective date of the TMDL.Generalconstructionstormwaterpermitteeswillbeconsideredin compliance with waste load allocations if they implement these Regional Board approved BMPs.
AllgeneralconstructionpermitteesmustimplementtheapprovedBMPs within nine years of the effective date of the TMDL. If no effectiveness studies are conducted and no BMPs are approved by the Regional Board within eight years of the effective date of the TMDL, each general construction storm water permit holder will be subject tosite-specificBMPsandmonitoringrequirementstodemonstratecompliance with waste load allocations.
MS4 and Caltrans Storm Water Permits:
TheCountyofLosAngeles,CityofLosAngeles,andCulverCityarejointly responsible for meeting the mass-based waste load allocations fortheMS4permittees.Caltransisresponsibleformeetingtheirmass-based waste load allocations, however, they may choose to work with the MS4permittees.TheprimaryjurisdictionfortheMarinadelReyHarborwatershedistheCountyofLosAngeles.
Each municipality and permittee will be required to meet the waste load allocationsatthedesignatedTMDLeffectivenessmonitoringpoints.Aphased implementation approach, using a combination of non-structural and structural BMPs may be used to achieve compliance with the waste load allocations. The administrative record and the fact sheets for the MS4andCaltransstormwaterpermitsmustprovidereasonableassurancethattheBMPsselectedwillbesufficienttoimplementthenumericwasteload allocations. We expect that reductions to be achieved by each BMP willbedocumentedandthatsufficientmonitoringwillbeputinplacetoverify that the desired reductions are achieved. The permits should also provide a mechanism to adjust the required BMPs as necessary to ensure their adequate performance.

Basin Plan 7-2�� Total Maximum Daily LoadsUpdated September 20��
Element Key Findings and Regulatory ProvisionsImplementation (continued) TheimplementationschedulefortheMS4andCaltranspermittees
consists of a phased approach, with compliance to be achieved in prescribed percentages of the watershed, with total compliance to be achieved within 10 years. However, the Regional Board may extend the implementation period up to 15 years if an integrated water resources approach is employed.
The waste load allocations and load allocations have been developed to achieve the numeric targets in the back basins of Marina del Rey Harbor by the end of the compliance period. However, the Regional Board is aware of toxic pollutants bound up in sediment. To the extent that the Regional Board or another responsible jurisdiction or agency determines that toxic pollutants bound in sediments are still preventing the attainment of numeric targets, the Regional Board will issue appropriate investigatory orders or cleanup and abatement orders to achieve attainment of the numeric targets.
Seasonal Variations and Critical Conditions
There is a high degree of inter- and intra-annual variability in total suspended solids discharged to Marina del Rey Harbor. This is a function of the storms, which are highly variable between years. The TMDL is based on a TSS load derived from long-term average rainfall overa52-yearperiodfrom1948to2000. This time period contains a wide range of storm conditions and drain discharges to Marina del Rey Harbor. Use of the average condition for the TMDL is appropriate because issues of sediment effects on benthic communities and potential for bioaccumulation to higher trophic levels occurs over long time periods.
Monitoring Effective monitoring will be required to assess the condition of Marina del Rey Harbor and to assess the on-going effectiveness of efforts by dischargers to reduce toxic pollutants loading from the Marina del Rey Watershed. Special studies may also be appropriate to provide further information about new data, new or alternative sources, and revisedscientificassumptions.BelowtheRegionalBoardidentifiesthevarious goals of monitoring efforts and studies that shall be developed in a coordinated manner. The programs, reports, and studies will be developed in response to subsequent orders issued by the Executive Officer.
Ambient Component
AmonitoringprogramisnecessarytoassesswaterqualitythroughoutMarinadelReyHarborandtoassessfishtissueandsedimentqualityintheharbor’sbackbasins.DataonbackgroundwaterqualityforcopperwillhelprefinethenumerictargetsandwasteloadallocationsandassistintheeffectiveplacementofBMPs.Inaddition,fishtissuedataisrequiredinMarinadelRey’sbackbasinstoconfirmcontinuedimpairment.

Basin Plan 7-2�2 Total Maximum Daily LoadsUpdated September 20��
Element Key Findings and Regulatory ProvisionsMonitoring (continued) Water quality samples shall be collected monthly and analyzed for
chlordane and total PCBs at detection limits that are at or below the minimum levels until the TMDL is reconsidered in the sixth year. The minimum levels are those published by the State Water Resources ControlBoardinAppendix4ofthePolicyfortheImplementationofToxic Standards for Inland Surface Water, Enclosed Bays, and Estuaries of California, March 2, 2000. Special emphasis should be placed on achieving detection limits that will allow evaluation relative to the CTR standards. If these can not be achieved with conventional techniques, then a special study should be proposed to evaluate concentrations of organics.
Water quality samples shall also be collected monthly and analyzed for copper, lead, and zinc until the TMDL is reconsidered in the sixth year. For metals water column analysis, methods that allow for (1) the removal of salt matrix to reduce interference and avoid inaccurate results prior to the analysis; and (2) the use of trace metal clean sampling techniques, should be applied. Examples of such methods includeEPAMethod1669forsamplecollectionandhandling,andEPAMethod1640forsamplepreparationandanalysis.
Storm water monitoring shall be conducted for metals (copper, lead. and zinc) and organics (chlordane and total PCBs) to provide assessment of water quality during wet-weather conditions and loading estimates from the watershed to the harbor. Special emphasis should be placed on achieving lower detection limits for organochlorine compounds.
TheMS4andCaltransstormwaterpermitteesarejointlyresponsibleforconductingbioaccumulationtestingoffishandmusseltissuewithinthe Harbor. The permittees are required to submit for approval of the ExecutiveOfficeramonitoringplanthatwillprovidethedataneededtoconfirmthe303(d)listingorde-listing,asapplicable.
Representative sediment sampling shall be conducted quarterly within the back basins of the harbor for copper, lead, zinc, chlordane, and total PCBs at detection limits that are lower than the ERLs. Sediment samples shall also be analyzed for total organic carbon, grain size and sediment toxicity.
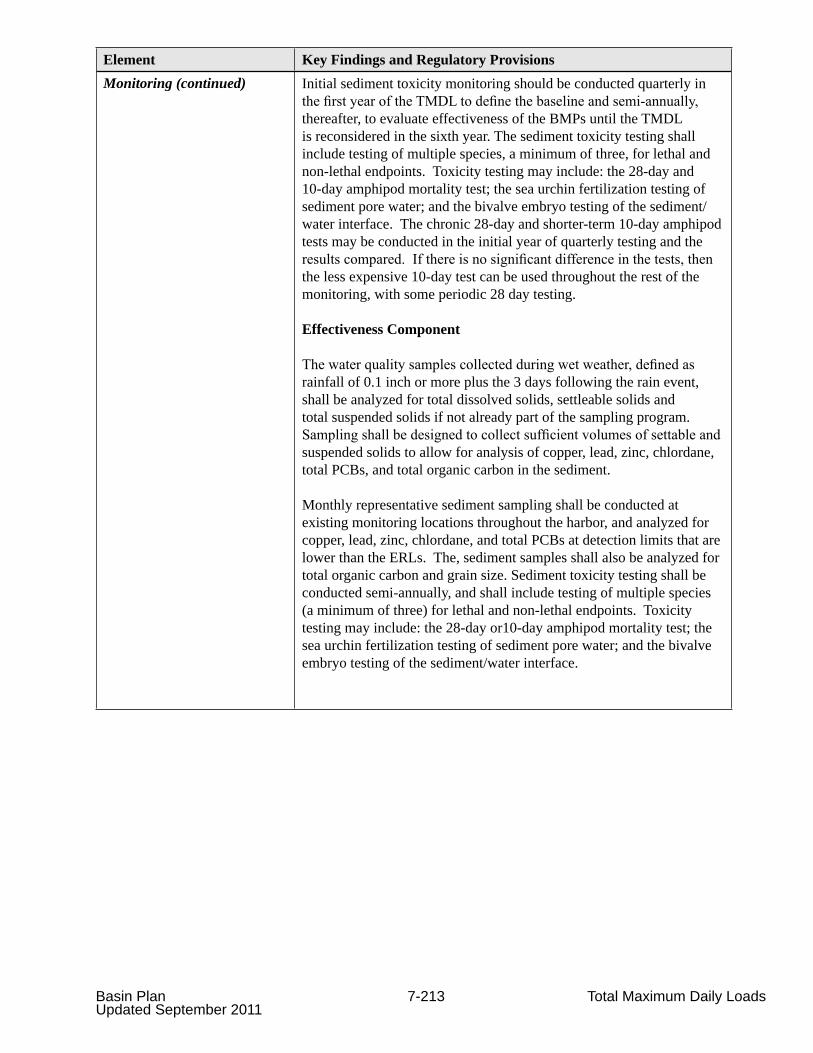
Basin Plan 7-2�� Total Maximum Daily LoadsUpdated September 20��
Element Key Findings and Regulatory ProvisionsMonitoring (continued) Initial sediment toxicity monitoring should be conducted quarterly in
thefirstyearoftheTMDLtodefinethebaselineandsemi-annually,thereafter, to evaluate effectiveness of the BMPs until the TMDL is reconsidered in the sixth year. The sediment toxicity testing shall include testing of multiple species, a minimum of three, for lethal and non-lethal endpoints. Toxicity testing may include: the 28-day and 10-day amphipod mortality test; the sea urchin fertilization testing of sediment pore water; and the bivalve embryo testing of the sediment/water interface. The chronic 28-day and shorter-term 10-day amphipod tests may be conducted in the initial year of quarterly testing and the resultscompared.Ifthereisnosignificantdifferenceinthetests,thenthe less expensive 10-day test can be used throughout the rest of the monitoring, with some periodic 28 day testing.
Effectiveness Component
Thewaterqualitysamplescollectedduringwetweather,definedasrainfall of 0.1 inch or more plus the 3 days following the rain event, shall be analyzed for total dissolved solids, settleable solids and total suspended solids if not already part of the sampling program. Samplingshallbedesignedtocollectsufficientvolumesofsettableandsuspended solids to allow for analysis of copper, lead, zinc, chlordane, total PCBs, and total organic carbon in the sediment.
Monthly representative sediment sampling shall be conducted at existing monitoring locations throughout the harbor, and analyzed for copper, lead, zinc, chlordane, and total PCBs at detection limits that are lower than the ERLs. The, sediment samples shall also be analyzed for total organic carbon and grain size. Sediment toxicity testing shall be conducted semi-annually, and shall include testing of multiple species (a minimum of three) for lethal and non-lethal endpoints. Toxicity testing may include: the 28-day or10-day amphipod mortality test; the sea urchin fertilization testing of sediment pore water; and the bivalve embryo testing of the sediment/water interface.

Basin Plan 7-2�4 Total Maximum Daily LoadsUpdated September 20��
Element Key Findings and Regulatory ProvisionsMonitoring (continued) Toxicityshallbeindicatedbyanamphipodsurvivalrateof70%orless
inasingletest,inconjunctionwithastatisticallysignificantdecreaseinamphipodsurvivalrelativetocontrolorganisms(significancedeterminedbyT-test,a=0.05).Acceleratedmonitoringmaybeconductedtoconfirmtoxicityatstationsidentifiedastoxic.Acceleratedmonitoring shall consist of six additional tests, approximately every two weeks, over a 12-week period. If the results of any two of the sixacceleratedtestsarelessthan90%survival,thentheMS4andCaltranspermitteesshallconductaToxicityIdentificationEvaluation(TIE).Alternatively,responsiblepartieshavetheoptionofforegoingaccelerated toxicity testing and conducting a TIE directly following an indication of toxicity. The TIE shall include reasonable steps to identify the sources of toxicity and steps to reduce the toxicity. The Phase I TIE shall include the following treatments and corresponding blanks: baseline toxicity; particle removal by centrifugation; solid phase extraction of the centrifuged sample using C8, C18, or another media; complexationofmetalsusingethylenediaminetetraaceticacid(EDTA)addition to the raw sample; neutralization of oxidants/metals using sodium thiosulfate addition to the raw sample; and inhibition of organo-phosphate (OP) pesticide activation using piperonyl butoxide addition to the raw sample (crustacean toxicity tests only).
BioaccumulationmonitoringoffishandmusseltissuewithintheHarborshall be conducted annually. The permittees are required to submit for approvaloftheExecutiveOfficeramonitoringplanthatwillprovidethe data needed to assess the effectiveness of the TMDL. The general industrial storm water permit shall contain a model monitoring and reportingprogramtoevaluateBMPeffectiveness.Apermitteeenrolledunder the general industrial permit shall have the choice of conducting individual monitoring based on the model program or participating in agroupmonitoringeffort.MS4permitteesareencouragedtotakethelead in group monitoring efforts for industrial facilities within their jurisdiction because compliance with waste load allocations by these facilities will in many cases translate to reductions in contaminate loads totheMS4system.

Basin Plan 7-2�5 Total Maximum Daily LoadsUpdated September 20��
Element Key Findings and Regulatory ProvisionsMonitoring (continued) Special Studies
Specialstudiesarenecessarytorefinesourceassessments,toprovidebetter estimates of loading capacity, and to optimize implementation efforts. The Regional Board will re-consider the TMDL in the sixth yearaftertheeffectivedateinlightofthefindingsofthesestudies.
Studies required for this TMDL include:
• Evaluatepartitioningcoefficientsbetweenwatercolumnandsediment to assess the contribution of water column discharges to sediment concentrations in the harbor, and
• Evaluate the use of low detection level techniques to determine water quality concentrations for those contaminants where standard detection limits cannot be used to assess compliance for CTR standardsorarenotsufficientforestimatingsourceloadingsfromtributaries and storm water.
Studies recommended for this TMDL include:
• Develop and implement a monitoring program to collect the data necessary to apply a multiple lines of evidence approach;
• Refinetherelationshipbetweenpollutantsandsuspendedsolidsaimed at better understanding of the delivery of pollutants to the watershed, and
• Evaluate the effectiveness of BMPs to address pollutants and/or sediments.

Basin Plan 7-2�6 Total Maximum Daily LoadsUpdated September 20��
Table 7-18.2. Marina del Rey Harbor Toxic Pollutants TMDL: Implementation ScheduleDate ActionEffective date of the TMDL Regional Board permit writers shall incorporate the waste load
allocations for sediment into the NPDES permits. Waste load allocations will be implemented through NPDES permit limits in accordance with the implementation schedule contained herein, at the time of permit issuance, renewal or re-opener.
On-going TheExecutiveOfficershallpromptlyissueappropriateinvestigatoryand clean up and abatement orders to address any toxicity hotspots withinsedimentsidentifiedasaresultofdatasubmittedpursuanttothisTMDL,anyU.S.ArmyCorpsofEngineerdredgingactivity,orany other investigation.
Within 6 months after the effective date of the State Board adopted sediment quality objectives and implementation policy
The Regional Board will re-assess the numeric targets and waste load allocations for consistency with the State Board adopted sediment quality objectives.
5 years after effective date of the TMDL
Responsible jurisdictions and agencies shall provide to the Regional Board result of any special studies.
6 years after effective date of the TMDL
The Regional Board shall reconsider this TMDL to re-evaluate the waste load allocations and the implementation schedule.
MINOR NPDES PERMITS AND GENERAL NON-STORM WATER NPDES PERMITS7yearsafter effectivedateof theTMDL
The non-storm water NPDES permits shall achieve the concentration-based waste load allocations for sediment per provisions allowed for in NPDES permits.
GENERAL INDUSTRIAL STORM WATER PERMIT7yearsafter effectivedateof theTMDL
The general industrial storm water permits shall achieve the mass-based waste load allocations for sediment per provisions allowed for in NPDES permits. Permits shall allow an iterative BMP process including BMP effectiveness monitoring to achieve compliance with permit requirements.
GENERAL CONSTRUCTION STORM WATER PERMIT7yearsfromtheeffectivedateofthe TMDL
The construction industry will submit the results of the BMP effectiveness studies to the Regional Board for consideration. In the event that no effectiveness studies are conducted and no BMPs are approved, permittees shallbesubjecttosite-specificBMPsandmonitoringtodemonstrateBMPeffectiveness.
8 years from the effective date of the TMDL
The Regional Board will consider results of the BMP effectiveness studies and consider approval of BMPs no later than eight years from the effective date of the TMDL.
9 years from the effective date of the TMDL
All general construction storm water permittees shall implementRegional Board-approved BMPs.

Basin Plan 7-2�7 Total Maximum Daily LoadsUpdated September 20��
Date ActionMS4 AND CALTRANS STORM WATER PERMITS
12 months after the effective date of the TMDL
InresponsetoanorderissuedbytheExecutiveOfficer,theMS4andCaltrans storm water NPDES permittees must submit a coordinated monitoring plan, to be approved by the Executive Officer, whichincludes both ambient monitoring and TMDL effectiveness monitoring. Once the coordinated monitoring plan is approved by the ExecutiveOfficer,monitoringshallcommencewithin6months.Thedraft monitoring report shall be made available for public comment andtheExecutiveOfficershallacceptpubliccommentsforat least30 days.
5 years after effective date of TMDL (Draft Report)
5 ½ years after effective date of TMDL (Final Report)
TheMS4andCaltransstormwaterNPDESpermitteesshallprovideawritten report to the Regional Board outlining how they will achieve the waste load allocations for sediment to Marina del Rey Harbor. The report shall include implementation methods, an implementation schedule, proposed milestones, and any applicable revisions to the TMDL effectiveness monitoring plan. The draft report shall be made availableforpubliccommentandtheExecutiveOfficershallacceptpublic comments for at least 30 days.
ScheduleforMS4andCaltransPermitteesifPursuingaTMDLSpecificImplementationPlan8 years after effective date of the TMDL
The MS4 and Caltrans storm water NPDES permittees shalldemonstrate that 50% of the total drainage area served by the MS4 system is effectively meeting the waste load allocations forsediment.
10 years after effective date of the TMDL
The MS4 and Caltrans storm water NPDES permittees shalldemonstrate that 100% of the total drainage area served by the MS4 system is effectively meeting the waste load allocations forsediment.
ScheduleforMS4andCaltransPermitteesifPursuinganIntegratedResourcesApproach,perRegionalBoardApproval7yearsafter effectivedateof theTMDL
The MS4 and Caltrans storm water NPDES permittees shalldemonstrate that 25% of the total drainage area served by the MS4 system is effectively meeting the waste load allocations forsediment.
9 years after effective date of the TMDL
The MS4 and Caltrans storm water NPDES permittees shalldemonstrate that 50% of the total drainage area served by the MS4 system is effectively meeting the waste load allocations forsediment.
11 years after effective date of the TMDL
The MS4 and Caltrans storm water NPDES permittees shalldemonstrate that 75% of the total drainage area served by theMS4 system is effectively meeting the waste load allocations forsediment.
15 years after effective date of the TMDL
The MS4 and Caltrans storm water NPDES permittees shalldemonstrate that 100% of the total drainage area served by the MS4 system is effectively meeting the waste load allocations forsediment.

Basin Plan 7-2�8 Total Maximum Daily LoadsUpdated September 20��

Basin Plan 7-2�9 Total Maximum Daily LoadsUpdated September 20��
7-19 Calleguas Creek Watershed Metals and Selenium TMDL
This TMDL was adopted by:The Regional Water Quality Control Board on June 8, 2006.
This TMDL was approved by:The State Water Resources Control Board on October 25, 2006.TheOfficeofAdministrativeLawonFebruary2,2007.TheU.S.EnvironmentalProtectionAgencyonMarch26,2007.
TheeffectivedateofthisTMDLisMarch26,2007.
TheelementsoftheTMDLarepresentedinTable7-19.1andtheImplementationPlaninTable7-19.2
Table 7-19.1. Calleguas Creek Watershed Metals and Selenium TMDL: Elements
TMDL Element Calleguas Creek Watershed Metals and Selenium TMDL
Problem Statement Three of fourteen reaches in the Calleguas Creek Watershed (CCW) including Revolon Slough, Lower Calleguas Creek – Reach 2, and Mugu Lagoon are identified on the 2002 CleanWaterAct Section 303(d) list of water-qualitylimited segments as impaired due to elevated levels of metals and selenium in water. The 303(d) listings, which were approved by the State Water Resources Control Board in February 2003, require the development of Total Maximum Daily Loads (TMDLs) to establish the maximum amount of pollutants a water body can receive without exceeding water quality standards. TMDLs for listed metals and selenium are presented herein in one document because, as a class of compounds,theypossesssimilarphysicalandchemicalpropertiesthatinfluencetheir persistence, fate, and transport in the environment.
Numeric Targets This TMDL establishes four types of numeric targets: (1) California Toxics Rule(40CFRPart131)(CTR)criteriaindissolvedfractionforcopper,nickel,andzinc,andintotalrecoverableformformercuryandselenium;(2)fishtissue targets for mercury; (3) bird egg targets for mercury and selenium; and(4)sedimentqualityguidelinesforcopper,nickel,andzincfor303(d)listedreaches.Attainmentofsedimentqualitytargetswillbeevaluatedincombination with sediment toxicity data, if available.

Basin Plan 7-220 Total Maximum Daily LoadsUpdated September 20��
TMDL Element Calleguas Creek Watershed Metals and Selenium TMDL
Numeric Targets (continued)
Copper Targets
Dry Weather CCC
Wet Weather CMC
Mugu Lagoon 3.1*WER1 4.8*WER1 34000Calleguas Creek 2 3.1*WER1 4.8*WER1 34000Calleguas Creek 3 25.9 26.3 NA2
Revolon/Beardsley 3.1*WER1 4.8*WER1 NA2
Conejo 27.9 41.6 NA2
Arroyo Simi/Las Posas 29.3 29.8 NA2
Water Quality Target (ug dissolved Copper/L)Subwatershed
Sediment Target3
(SQuiRTs, ERL) (ppb dry weight)
1 The water quality targets for copper in the TMDL are expressed as the copper water quality criteria from the federal California Toxics Rule (CTR). Those criteria include a numerical threshold multiplied by a water-effect ratio (WER). The WER has a default value of 1.0 unlessasite-specificWERisapproved.TouseaWERotherthanthedefaultof1.0,astudymustbeconductedconsistentwithUSEPA’sWERguidanceandadoptedbytheRegionalBoardthroughthestate’sbasinplanamendmentprocess.AWERstudyforMuguLagoon(Reach1),lowerCalleguasCreek(Reach2),RevolonSlough(Reach4)andBeardsleyWash (Reach 5) has been submitted to the Regional Board. If the Regional Board approves site-specificWERsforcopperinthesewaterbodies,theTMDLtargetswillbemodifiedinaccordance with all legal and regulatory requirements and implemented in accordance with the approved WERs using the equations set forth above.
2 Sediment targets were not selected as alternative target for this reach as it is not on the 303(d) list. 3 Sediment targets are based on screening levels endorsed by the National Oceanic andAtmosphericAdministration(NOAA)intheirScreeningQuickReference Tables (SQuiRTs) (Buchman, 1999)
Mercury Targets
Media TargetFish Tissue (Human Health) 0.3 mg methylmercury/kg wet weightFish Tissue (Wildlife) * Trophic Level (TL) 31<50 mm 0.03 mg methylmercury/kg wet weight * TL3 50-150 mm 0.05 mg methylmercury/kg wet weight * TL3 150-350 mm 0.1 mg methylmercury/kg wet weightBird Egg (Wildlife) less than 0.5 mg total mercury/kg wet weightWater Column 0.051 ug total mercury/L
1TrophicLevel3:Predators(e.g.,minnows,sunfish)ontrophiclevel2organism(e.g.,copepodsandwaterfleas)

Basin Plan 7-22� Total Maximum Daily LoadsUpdated September 20��
TMDL Element Calleguas Creek Watershed Metals and Selenium TMDL
Numeric Targets (continued)
Nickel Targets
Dry Weather CCC
Wet Weather CMC
Mugu Lagoon 8.2 74 20900Calleguas Creek 2 8.2 74 NA2
Calleguas Creek 3 149 856 NA2
Revolon/Beardsley 8.2 74 NA2
Conejo 160 1292 NA2
Arroyo Simi/Las Posas 168 958 NA2
Water Quality Target (ug dissolved Nickel/L)Subwatershed
Sediment Target1
(SQuiRTs, ERL) (ppb dry weight)
1 Sediment targets are based on screening levels endorsed by the National Oceanic and AtmosphericAdministration(NOAA)intheirScreeningQuickReferenceTables(SQuiRTs)(Buchman, 1999)
2 Sediment targets were not selected as alternative target for this reach as it is not listed on the 303(d) list.
Astudytosupportasitespecificobjective(SSO)fornickelhasbeensubmittedto the Regional Board and is currently under reviewed by the Regional Board andU.S.EPAstaff.IfaSSOfornickelisapproved,theRegionalBoardwillconsider revision to the numeric targets for nickel based on the approved SSO.
Selenium Targets
Dry Weather CCC
Wet Weather CMC
Mugu Lagoon 71 290 6Calleguas Creek 2 5 290 6Calleguas Creek 3 5 NA1 6Revolon/Beardsley 5 290 6Conejo 5 NA1 6Arroyo Simi/Las Posas 5 NA1 6
Water Quality Target (ug total selenium/L)Subwatershed Bird Egg
(ug/g)
1“NA”indicatesthatatargetisnotavailableforthisconstituentbecausecriterionforfreshwaterisnotdefinedintheCTR.

Basin Plan 7-222 Total Maximum Daily LoadsUpdated September 20��
TMDL Element Calleguas Creek Watershed Metals and Selenium TMDL
Numeric Targets (continued)
Zinc Targets
Dry Weather CCC
Wet Weather CMC
Mugu Lagoon 81 90 150000Calleguas Creek 2 81 90 NA2
Calleguas Creek 3 338 214 NA2
Revolon/Beardsley 81 90 NA2
Conejo 365 324 NA2
Arroyo Simi/Las Posas 382 240 NA2
Water Quality Target (ug dissolved Zinc/L) Subwatershed
Sediment Target1
(SQuiRTs, ERL) (ppb dry weight)
1 Sediment targets are based on screening levels endorsed by the National Oceanic and AtmosphericAdministration(NOAA)intheirScreeningQuickReferenceTables(SQuiRTs)(Buchman, 1999)
2 Sediment targets were not selected as alternative target for this reach because it is not on the 303(d) list.
Source Analysis Significantsourcesofmetalsandseleniumincludeurbanrunoff,agriculturalrunoff,groundwaterseepage,andPOTWeffluent.Formercury,openspacewasalsoasignificantsource.Sourceswerealsoanalyzedasafunctionofwetanddryweather.Higher loads were delivered during wet weather for all constituents, due to the association between metals and particulate matter.
Thesourceanalysisindicatesnaturallyoccurringmercuryinsoilmaybeasignificantsource, and that naturally occurring nickel, copper, zinc, and selenium in soil may be a contributing source, and that naturally occurring selenium in groundwater may be a significantsource.TheTMDLImplementationPlanincludesspecialstudiestofurtherassess natural sources of metals in soil.
Linkage Analysis Linkage between sources and instream pollutant concentrations was established throughadynamicwaterqualityHydrologicSimulationProgram–FORTRAN(HSPF). The model output generally resulted in a conservative estimate of receiving water concentrations for metals. The model was used to calculate load reductions necessary to meet the numeric targets.The load reductions were used to calculate the load and waste load allocations.
Waste Load Allocations
Inthecaseofcopper,nickel,andselenium,wasteloadallocations(WLAs)weredevelopedforbothwetanddry-weather.Thedry-weatherWLAsapplytodayswhenflowsinthestreamarelessthanthe86thpercentileflowrateforeachreach.Thewet-weatherWLAsapplytodayswhenflowsinthestreamexceed the 86thpercentileflowrateforeachreach.Annualmassloadsofmercury in suspended sediment were developed according to low, medium, andhighannualflowcategories.

Basin Plan 7-22� Total Maximum Daily LoadsUpdated September 20��
TMDL Element Calleguas Creek Watershed Metals and Selenium TMDL
Waste Load Allocations (continued)
Publicly Owned Treatment Works (POTWs)
Concentration-basedandmass-basedWLAsareestablishedforcopper,andnickel, in total recoverable forms, and are applied to POTWs during both wetanddryweather.Mass-basedWLAsaredevelopedformercuryforPOTWs. Zinc allocations are not set because current information indicate that numeric targets for zinc are attained. The TMDL Implementation Plan includes a task to provide State Board data to support delisting of zinc. Waste load allocations for selenium are not set for POTWs because POTWs do not discharge to reaches listed for selenium. Interim limits are included to allow time for dischargers to put in place implementation measures necessarytoachievefinalwasteloadallocations.Thedailymaximumandmonthly average interim limits are set equal to the 99th and 95th percentile of available discharge data, respectively.
Interim and Final WLAs for Total Recoverable Copper in Water Column
DailyMaximum
(ug/L)
MonthlyAverage
(ug/L)
DailyMaximum
(ug/L)2
MonthlyAverage(ug/L)2
lb/day
HillCanyonWWTP
20.0 16.0 (a) (a) 0.11*W ER - 0.04
SimiValleyWQCP
(b) (b) 31.0 30.5 (c )
MoorparkWTP (b) (b) 31.0 30.5 (d)
CamarilloWRP
57.0 20.0 (a) (a) 0.12*W ER - 0.04
CamrosaWRP
(b) (b) 27.4 27.0 (d)
POTW
Interim Final1
1Ifsite-specificWERsareapprovedbytheRegionalBoard,TMDLwasteloadallocationsshall be implemented in accordance with the approved WERs using the equations set forthabove.RegardlessofthefinalWERs,totalcopperloadingshallnotexceedcurrentloading.Inaddition,effluentconcentrationsshallnotexceedtheperformancestandardsofcurrent treatment technologies.
2 Concentration-based targets have been converted to total recoverable allocations using the CTR default translator of 0.96
(a)Concentration-basedfinallimitswillbeincludedinthepermitsinaccordancewithNPDES guidance and requirements, but are not calculated as part of the TMDL.
(b)Interimlimitsarenotrequiredbecausethedischargerismeetingthefinallimits.(c) Discharges from Simi Valley WQCP do not reach lower Calleguas Creek and Mugu
lagoonduringdryweather.Monitoringwillbeconductedandmass-basedWLAswillbeevaluatediftargetsarenotmetinArroyoSimi/LasPosasordownstreamreaches.
(d)Dischargerdoesnotcontributeloadingduringdryweather.Concentration-basedWLAsapply during wet weather when discharges occur. Monitoring will be conducted and mass-basedWLAswillbeevaluatediftargetsarenotmetinreceivingwaterand/ordownstreamreaches.

Basin Plan 7-224 Total Maximum Daily LoadsUpdated September 20��
TMDL Element Calleguas Creek Watershed Metals and Selenium TMDL
Waste Load Allocations (continued)
Interim and Final WLAs for Total Recoverable Nickel in Water Column
DailyMaximum
(ug/L)
MonthlyAverage
(ug/L)
DailyMaximum
(ug/L)1
MonthlyAverage(ug/L)2
lb/day
HillCanyonWWTP
8.3 6.4 (a) (a) 0.3
SimiValleyWQCP
(b) (b) 960.0 169.0 (c )
MoorparkWTP (b) (b) 960.0 169.0 (d)
CamarilloWRP
16.0 6.2 (a) (a) 0.2
CamrosaWRP
(b) (b) 858.0 149.0 (d)
POTW
Interim Final
1 Concentration-based targets have been converted to total recoverable allocations using the CTR default translator of 0.998.
2 Concentration-based targets have been converted to total recoverable allocations using the CTRdefaulttranslatorof0.997.
(a)Concentration-basedfinallimitswillbeincludedinthepermitsinaccordancewithNPDES guidance and requirements, but are not calculated as part of the TMDL.
(b)Interimlimitsarenotrequiredbecausethedischargerismeetingthefinallimits.(c) Discharges from Simi Valley WQCP do not reach lower Calleguas Creek and Mugu
lagoonduringdryweather.Monitoringwillbeconductedandmass-basedWLAswillbeevaluatediftargetsarenotmetinArroyoSimi/LasPosasordownstreamreaches.
(d)Dischargerdoesnotcontributeloadingduringdryweather.Concentration-basedWLAsapply during wet weather when discharges occur. Monitoring will be conducted and mass-basedWLAswillbeevaluatediftargetsarenotmetinreceivingwaterand/ordownstream reaches.
AstudytosupportaSSOfornickelhasbeensubmittedtotheRegionalBoardandiscurrentlyunderreviewedbytheRegionalBoardandU.S.EPAstaff. If a SSO for nickel is approved, the Regional Board will consider revisiontothefinalWLAsfornickelbasedontheapprovedSSO.
Interims and Final WLAs for Mercury in Suspended Sediment
POTW Interim(lb/month)
Final(lb/month)
HillCanyonWWTP 0.23 0.022SimiValleyWQCP 0.18 0.031MoorparkWTP N/A N/ACamarilloWRP 0.03 0.015CamrosaWRP N/A N/A
Waste load allocations for POTWs are based on the median monthly mercuryeffluentconcentrationsmultipliedbythedesignflowwherethe total load in water is assumed equal to the suspended sediment load. InterimWLAsformercuryarebasedonthe90th percentile concentration observedineffluentdischargeandmultipliedbythedesignflow,andapplytoallflowconditions.

Basin Plan 7-225 Total Maximum Daily LoadsUpdated September 20��
TMDL Element Calleguas Creek Watershed Metals and Selenium TMDL
Waste Load Allocations (continued)
Permitted Stormwater Dischargers (PSDs)
PSDsincludemass-basedWLAsestablishedforcopper,nickel,andseleniumin total recoverable forms. Mass-basedWLAsaredevelopedformercury insuspended sediment. Interim limits are included to allow time for dischargers toputinplaceimplementationmeasuresnecessarytoachievefinalwasteloadallocations. The daily maximum and monthly average interim limits are set equal to the 99th and 95th percentile of available discharge data.
Interim Limits and Final WLAs for Total Recoverable Copper, Nickel, and SeleniumInterim limits and waste load allocations are applied to receiving water.
A. Interim Limits
DryDailyMaximum
(ug/L)
DryMonthlyAverage
(ug/L)
WetDailyMaximum
(ug/L)
DryDailyMaximum
(ug/L)
DryMonthlyAverage
(ug/L)
WetDailyMaximum
(ug/L)
Copper 23 19 204 23 19 204Nickel 15 13 (a) 15 13 (a)
Selenium (b) (b) (b) 14 (c) 13 (c) (a)
CalleguasandConejoCreek RevolonSlough
Constituents
(a) The current loads do not exceed the TMDL under wet conditions; interim limits are not required.
(b) Selenium allocations have not been developed for this reach as it is not on the 303(d) list. (c) Attainmentofinterimlimitswillbeevaluatedinconsiderationofbackgroundloadingdata,if
available.
B. Final WLAs for Total Recoverable Copper, Nickel, and Selenium
Dry-Weather WLAs in Water Column
LowFlow
AverageFlow
ElevatedFlow
LowFlow
AverageFlow
ElevatedFlow
Copper1(lbs/day)
0.04*W ER - 0.02
0.12*W ER - 0.02
0.18*W ER - 0.03
0.03*W ER - 0.01
0.06*W ER - 0.03
0.13*W ER - 0.02
Nickel(lbs/day) 0.100 0.120 0.440 0.050 0.069 0.116
Selenium(lbs/day) (a) (a) (a) 0.004 0.003 0.004
FlowRange
CalleguasandConejoCreek RevolonSlough
1Ifsite-specificWERsareapprovedbytheRegionalBoard,TMDLwasteloadallocationsshall be implemented in accordance with the approved WERs using the equations set forthabove.RegardlessofthefinalWERs,totalcopperloadingshallnotexceedcurrentloading.
(a) Selenium allocations have not been developed for this reach as it is not on the 303(d) list

Basin Plan 7-226 Total Maximum Daily LoadsUpdated September 20��
TMDL Element Calleguas Creek Watershed Metals and Selenium TMDL
Waste Load Allocations (continued)
Wet-Weather WLAs in Water Column
Constituent CalleguasCreek RevolonSloughCopper1
(lbs/day)(0 .00054*Q^2*0.032*Q - 0.17)*W ER - 0.06
(0 .0002*Q2+0.0005*Q)*W ER
Nickel2
(lbs/day) 0.014*Q^2+0.82*Q 0.027*Q^2+0.47*QSelenium2
(lbs/day) (a) 0.027*Q^2+0.47*Q1Ifsite-specificWERsareapprovedbytheRegionalBoard,TMDLwaste
load allocations shall be implemented in accordance with the approved WERs usingtheequationssetforthabove.RegardlessofthefinalWERs,totalcopper loading shall not exceed current loading.
2 Current loads do not exceed loading capacity during wet weather. Sum of all loads cannot exceed loads presented in the table
(a) Selenium allocations have not been developed for this reach as it is not on the 303(d) list.
Q: Daily storm volume.
Interim Limits and Final WLAs for Mercury in Suspended Sediment
FinalWLAsaresetat80%reductionofHSPFloadestimates.Interimlimitsfor mercury in suspended sediment are set equal to the highest annual load withineachflowcategory,basedonHSPFoutputfortheyears1993-2003.
Interim(lbs/yr)
Final(lbs/yr)
Interim(lbs/yr)
Final(lbs/yr)
0-15,000MGY 3.3 0.4 1.7 0.1
15,000-25,000MGY 10.5 1.6 4 0.7
Above25,000MGY 64.6 9.3 10.2 1.8
CalleguasCreek RevolonSlough
FlowRange
MGY:milliongallonsperyear.

Basin Plan 7-227 Total Maximum Daily LoadsUpdated September 20��
TMDL Element Calleguas Creek Watershed Metals and Selenium TMDL
Waste Load Allocations (continued)
Final WLAs for Other NPDES Dischargers
Final WLAs for Total Recoverable Copper, Nickel, and Selenium
DryMonthlyEverage(ug/L)2
WetDailyMaximum
(ug/L)2
DryMonthlyAverage(ug/L)3
WetDailyMaximum
(ug/L)3
DryMonthlyAverage
(ug/L)
WetDailyMaximum
(ug/L)
1 3.7*W ER 5.8*W ER 8.2 74 (b) (b)2 3.7*W ER 5.8*W ER 8.2 74 (b) (b)3 27.0 27.4 149 859 (b) (b)4 3.7*W ER 5.8*W ER 8.3 75 5 2905 3.7*W ER 5.8*W ER 8.3 75 5 2906 (a) 31.0 (a) 958 (b) (b)7 (a) 31.0 (a) 958 (b) (b)8 (a) 31.0 (a) 958 (b) (b)9 29.1 43.3 160 1296 (b) (b)
10 29.1 43.3 160 1296 (b) (b)11 29.1 43.3 160 1296 (b) (b)12 29.1 43.3 160 1296 (b) (b)13 29.1 43.3 160 1296 (b) (b)
Reach
Copper1 Nickel Selenium
1Ifsite-specificWERsareapprovedbytheRegionalBoard,TMDLwasteloadallocationsshall be implemented in accordance with the approved WERs using the equations set forth above.RegardlessofthefinalWERs,totalcopperloadingshallnotexceedcurrentloading.Inaddition,effluentconcentrationsshallnotexceedtheperformancestandardsofcurrenttreatment technologies
2 Concentration-based targets have been converted to total recoverable allocations using the CTR default translator of 0.96 for freshwater reaches and 0.83 for saltwater reaches.3 Concentration-based targets have been converted to total recoverable allocations using the CTRdefaulttranslatorof0.997forfreshwaterreachesand0.99forsaltwaterreaches.(a) Discharges from these reaches do not reach lower Calleguas Creek and Mugu Lagoon during
dryweather.Allocationsarenotrequiredforthesereaches.(b) Selenium waste load allocations have not been developed for this reach as it is not on the 303(d) list.
Final WLAs for Mercury
ThereisinsufficientinformationtoassignmassbasedWLAstothesesources.Therefore concentration-based waste loads allocations are set equal to 0.051 ug/L for other NPDES dischargers based on the CTR water column target for protection of human health from consumption organism only.
Load Allocation Mass-basedloadallocations(LAs)foragriculture,andopenspacearedeveloped for copper, nickel, and selenium in total recoverable forms. Open space represents background loads from ambient sources (i.e. natural soil concentrations, atmospheric deposition, and natural groundwater seepage) discharged from undeveloped open space, but not ambient sources that are dischargedfromdevelopedland,suchasagriculturalandurbanareas.LAsaredevelopedforbothwetanddry-weather.Thedry-weatherLAsapplytodayswhenflowsinthestreamarelessthan86thpercentileflowrateforeachreach.Thewet-weatherLAsapplytodayswhenflowsinthestreamexceed86thpercentileflowrateforeachreach.Annualmassloadsofmercuryinsuspended sediment were developed according to low, medium, and high annualflowcategories.

Basin Plan 7-228 Total Maximum Daily LoadsUpdated September 20��
TMDL Element Calleguas Creek Watershed Metals and Selenium TMDL
Load Allocation Interim and Final Load Allocations for Total Recoverable Copper, Nickel, and Selenium
Interim limits are included to allow time for dischargers to put in place implementationmeasuresnecessarytoachievefinalloadallocations.Thedaily maximum and monthly average interim limits are set equal to the 99th and 95th percentile of available discharge data. Interim limits and finalloadallocationsareappliedinreceivingwateratthecompliancepoints.
A. Interim Limits
DryDailyMaximum
(ug/L)
DryMonthlyAverage
(ug/L)
WetDailyMaximum
(ug/L)
DryDailyMaximum
(ug/L)
DryMonthlyAverage
(ug/L)
WetDailyMaximum
(ug/L)
Copper 24 19 1390 24 19 1390Nickel 43 42 (a) 43 42 (a)Selenium (b) (b) (b) 6.7 (c) 6 (c) (a)
CalleguasandConejoCreek RevolonSlough
Constituents
(a) The current loads do not exceed the TMDL under wet conditions, interim limits are not
required.(b) Selenium allocations have not been developed for this reach as it is not on the 303(d) list.
Implementation actions includes consideration of watershed-wide selenium impacts.(c) Attainmentofinterimlimitswillbeevaluatedinconsiderationofbackgroundloading
data, if available.
B. Final Load Allocation
Dry Weather LAs in Water Column
LowFlow
AverageFlow
ElevatedFlow
LowFlow
AverageFlow
ElevatedFlow
Agriculture 0.07* WER-0.03
0.12* WER-0.02
0.31*WER - 0.05
0.07*WER - 0.03
0.14*WER- 0.07
0.35*WER - 0.07
OpenSpace 0.150 0.080 0.130 0.050 0.120 0.110Agriculture 0.420 0.260 0.970 0.390 0.690 1.600OpenSpace 0.450 0.420 0.560 0.010 0.020 0.020Agriculture (a) (a) (a) 0.008 0.007 0.018OpenSpace (a) (a) (a) 0.180 0.310 0.490
Selenium(lbs/day)
CalleguasCreekConstituent
RevolonSlough
Copper1
(lbs/day)
Nickel(lbs/day)
1Ifsite-specificWERsareapprovedbytheRegionalBoard,TMDLloadallocationsshallbeimplemented in accordance with the approved WERs using the equations set forth above.
(a) Selenium allocations have not been developed for this reach as it is not on the 303(d) list. Implementation actions include consideration of the watershed-wide selenium impacts.

Basin Plan 7-229 Total Maximum Daily LoadsUpdated September 20��
TMDL Element Calleguas Creek Watershed Metals and Selenium TMDL
Load Allocation (continued)
WetWeatherLAsinWaterColumn
Constituent CalleguasCreek RevolonSlough
Agriculture(0 .00017*Q^2*0.01*Q - 0 .05)*W ER - 0.02
(0.00123*Q^2+0.0034*Q)* W ER
OpenSpace 0.0000537*Q^2+0.00321*Q 0.0000432*Q^2+0.000765*QAgriculture 0.014*Q^2+0.82*Q 0.027*Q^2+0.47*QOpenSpace 0.014*Q^2+0.82*Q 0.027*Q^2+0.47*QAgriculture (a) 0.1*Q^2+1.8*QOpenSpace (a) 0.027*Q^2+0.47*Q
Copper1
(lbs/day)
Nickel2
(lbs/day)Selenium2
(lbs/day)1Ifsite-specificWERsareapprovedbytheRegionalBoard,TMDLloadallocationsshallbe
implemented in accordance with the approved WERs using the equations set forth above.2 Current loads do not exceed loading capacity during wet weather. Sum of all loads cannot
exceed loads presented in the table (a) Selenium allocations have not been developed for this reach as it is not on the 303(d) list. Q Daily storm volume
InterimandFinalLAsforMercuryinSuspendedSediment
FinalLAsaresetat80%reductionofHSPFloadestimates.Interimlimitsfor mercury in suspended sediment are set equal to the highest annual load withineachflowcategory,basedonHSPFoutputfortheyears1993-2003
Interim(lbs/yr)
Final(lbs/yr)
Interim(lbs/yr)
Final(lbs/yr)
Interim(lbs/yr)
Final(lbs/yr)
Interim(lbs/yr)
Final(lbs/yr)
0-15,000MGY1
3.9 0.5 5.5 0.7 2 . 2.9 0.2
15,000-25,000MGY 12.6 1.9 17.6 2 .7 4.8 0.8 6.7 1.1
Above25,000MGY 77.5 11.2 108.4 17.9 12.2 2.2 17.1 2
FlowRange
CalleguasCreek RevolonSloughAgriculture OpenSpace Agriculture OpenSpace
MGY:milliongallonsperyear.
Margin of Safety Amarginofsafety(MOS)fortheTMDLisdesignedtoaddressanyuncertainty in the analysis that could result in targets not being achieved in the water bodies. Both implicit and explicit MOS are included for this TMDL. The implicit MOS stems from 1) the use of conservative assumptions made duringdevelopmentofmultiplenumerictargetstoensuresufficientprotectionunder all conditions, and 2) conservative methods employed in developing the TMDL. Background loads are assigned to the TMDL and assumed to remain constant throughout implementation of the TMDL. This results in higher required reductions for the other sources. Calculation of allocations is based on never exceeding numeric target concentrations more than once inthreeyearsasspecifiedintheCTR.Calculationsofcurrentloadsandloading capacity for Mugu Lagoon are based on the combined discharges from Calleguas Creek and Revolon Slough (without any dilution provided by tidalflushing),whichoverpredictsactualconcentrationsintheLagoon.A15% explicit MOS is also included for copper and nickel to account for the uncertainty resulting from the calculation of the allowable load based on the medianflowrateandtranslatorofeachflowcategory.The15%explicitMOSisdeterminedsufficienttoaddresstheelevatedflowcategory,butstillaccountfor the more conservative nature of low and average category.

Basin Plan 7-2�0 Total Maximum Daily LoadsUpdated September 20��
TMDL Element Calleguas Creek Watershed Metals and Selenium TMDL
Future Growth VenturaCountyaccountsforslightlymorethan2%ofthestate’sresidentswithapopulationof753,197(USCensusBureau,2000).GISanalysisofthe2000censusdatayieldsapopulationestimateof334,000fortheCCW,whichequalsabout44%ofthecountypopulation.AccordingtotheSouthernCaliforniaAssociationofGovernments(SCAG),growthinVenturaCountyaveragedabout51%perdecadefrom1900-2000;withgrowthexceeding70%inthe1920s,1950s,and1960s.Significantpopulationgrowthisexpectedtooccur within and near present city limits until at least 2020. Future growth may initially increase loadings as construction activities expose bare soil and increase erosion-related discharges to receiving water. However, once development has been completed the presence of impermeable land surface and landscaped areas may reduce the amount of natural soils that are eroded and carried to the stream. For copper, future growth could increase loadings fromurbanareasandPOTWsduetoincreasedtraffic(i.e.,brakepadresidues),architectural copper use and corrosion of copper pipes. Selenium loading may increase if increased irrigation raises the groundwater table and increases high selenium groundwater seepage to surface waters. However, if increased growth results in increased water demand and high selenium groundwater is pumped and treated to supply this demand, the selenium could decrease.
Seasonal Variations and Critical Conditions
Seasonal variations are addressed for copper, nickel, and selenium by developing separate allocations for wet and dry weather. Critical conditions for copper, nickel, and selenium were developed using model results to calculatethemaximumobserved4-dayaveragedryweatherconcentrationandtheassociatedflowcondition.Wetweather,asawhole,isdefinedasacriticalcondition. For mercury, there is no indication that mercury contamination in Mugu Lagoon is consistently exacerbated at any particular time of the year. Since the potential effects of mercury are related to bioaccumulation in the food chain over a long period time, any other short term variations in concentrationwhichmightoccurarenotlikelytocausesignificantimpactsuponbeneficialuses.Therefore,seasonalvariationsdonotaffectcriticalconditions for the Calleguas Creek watershed mercury TMDL.
Special Studies and Monitoring Plan
Special Studies
Several special studies are planned to improve understanding of key aspects relatedtoachievementofWLAsandLAsfortheMetalsandSeleniumTMDL
1. Special Study #1 (Optional) – Evaluation and Initiation of Natural Sources Exclusion
TheTMDLtechnicalreporthasidentifiedambientsourcesastheprimarysignificantseleniumandmercuryloadingsinthewatershedandaspotentiallysignificantsourcesofcopperandnickel.Theportionofallambientsourcesassociated with open space runoff and natural groundwater seepage is accounted for in this TMDL as “background load.” This special study will evaluate whether or not background loads for each constituent qualify for natural source exclusion.

Basin Plan 7-2�� Total Maximum Daily LoadsUpdated September 20��
TMDL Element Calleguas Creek Watershed Metals and Selenium TMDL
Special Studies and Monitoring Plan (continued)
This study will also consider whether any portion of the ambient source contribution for agricultural or urban runoff loads qualify for natural source exclusionsand/orprovideabasisforsitespecificobjectives.Thepresenceofnatural sources makes achievement of selenium and mercury targets during all conditions unlikely. For copper, achievement of the CTR targets or the WER based targets (if approved) in Revolon Slough may not be feasible due to the magnitudeofbackgroundloads.Completionofsitespecificobjectivesand/ora use attainability analysis shall be required to review any potential change to water quality objectives for these constituents. This special study will be used to develop the necessary information to revise the water quality objectives for selenium and mercury and possibly for copper and nickel.
2. Special Study #2 – Identification of selenium contaminated Groundwater Sources
The purpose of this special study will be to identify groundwater with high concentrations of selenium that is either being discharged directly to the stream or used as irrigation water. The investigation will focus on areas where groundwater has a high probability of reaching the stream and identify practical actions to reduce the discharge of the groundwater to the stream. The analysis will include an assessment of the availability of alternative water supplies for irrigation water, the costs of the alternative water supplies and the costs of reducing groundwater discharges.
3. Special Study #3– Investigation of Soil Concentrations and Identification of “Hot Spots”
The purpose of this special study will be to identify terrestrial areas with high concentrations of metals and/or selenium, either due to anthropogenic sources or resulting from high natural concentrations in soils. Use of detailedsoilmapsforthewatershedincombinationwithfieldsurveyandsoilsamplingmayleadtoidentificationofareasimportantforreducingoverallloadsreachingthestream.Identificationofanyareaswithelevatedsoilconcentrations of metals and/or selenium would create an opportunity for efficientandtargetedimplementationactions,suchasremediationorerosioncontrol.
4. Special Study #4 (Optional) – Determination of Water Effect Ratio for Copper in Revolon Slough
The purpose of this optional special study would be to calculate a WER forcopperthatisspecifictoRevolonSlough.AWERwasnotpreviouslydeveloped for Revolon Slough because it was not listed for copper. Subsequent monitoring demonstrated that the saltwater copper CTR criterion was exceeded in Revolon Slough. This Study would parallel the developed WER for Mugu Lagoon and Calleguas Creek. This is an optional special study to be conducted if desired by the stakeholders or determined necessary bytheExecutiveOfficer.

Basin Plan 7-2�2 Total Maximum Daily LoadsUpdated September 20��
TMDL Element Calleguas Creek Watershed Metals and Selenium TMDL
Special Studies and Monitoring Plan (continued)
5. Special Study #5 (Optional) – Determination of Site-Specific Objectives for Mercury and Selenium
Special Study #1 will evaluate whether a natural source exclusion is appropriate for background loads of mercury and selenium or any portion of the ambient source contributions to non-background loads in the Calleguas Creek watershed. This special study will develop any SSOs deemed necessary toaccountforthebackgroundconditionsand/orsite-specificimpactsofmercury and selenium (and possibly for copper and nickel) on wildlife and humans in the watershed. This is an optional special study to be conducted if desired by the stakeholders or determined necessary for establishing a natural source exclusion.
Monitoring Plan
The Calleguas Creek Watershed TMDL Monitoring Plan (CCWTMP) is designedtomonitorandevaluatetheimplementationofthisTMDLandrefinethe understanding of metal and selenium loads. CCWTMP is intended to parallel efforts of the Calleguas Creek Watershed Nutrients TMDL, Toxicity TMDL, and OC Pesticide, PCBs, and Sediment TMDL monitoring programs. The proposed CCWTMP shall be made available for public review before approvalbytheExecutiveOfficer.
The goals of the CCWTMP include: (1) to determine compliance with copper, mercury, nickel, and selenium numeric targets at receiving water monitoring stations and at POTWs discharges; (2) to determine compliance with waste load and load allocations for copper, mercury, nickel, and selenium at receiving water monitoring stations and at POTWs discharges; (3) to monitor the effect of implementation action by PSDs, POTW, agricultural dischargers, andotherNPDESpermitteesonin-streamwaterquality;and(4)toimplementthe CCWTMP in a manner consistent with other TMDL implementation plans and regulatory actions within the Calleguas Creek watershed. Monitoring conducted through the Conditional Waiver for Disharges from Irrigated Lands (Conditional Waiver Program) may meet part of the needs of the CCWTMP. To the extent monitoring required by the Metals and Selenium TMDL Implementation Plan parallels monitoring required by the Conditional Waiver Program, monitoring shall be coordinated with monitoring conducted by individuals and groups subject to the term and conditions of the Conditional Waiver Program.
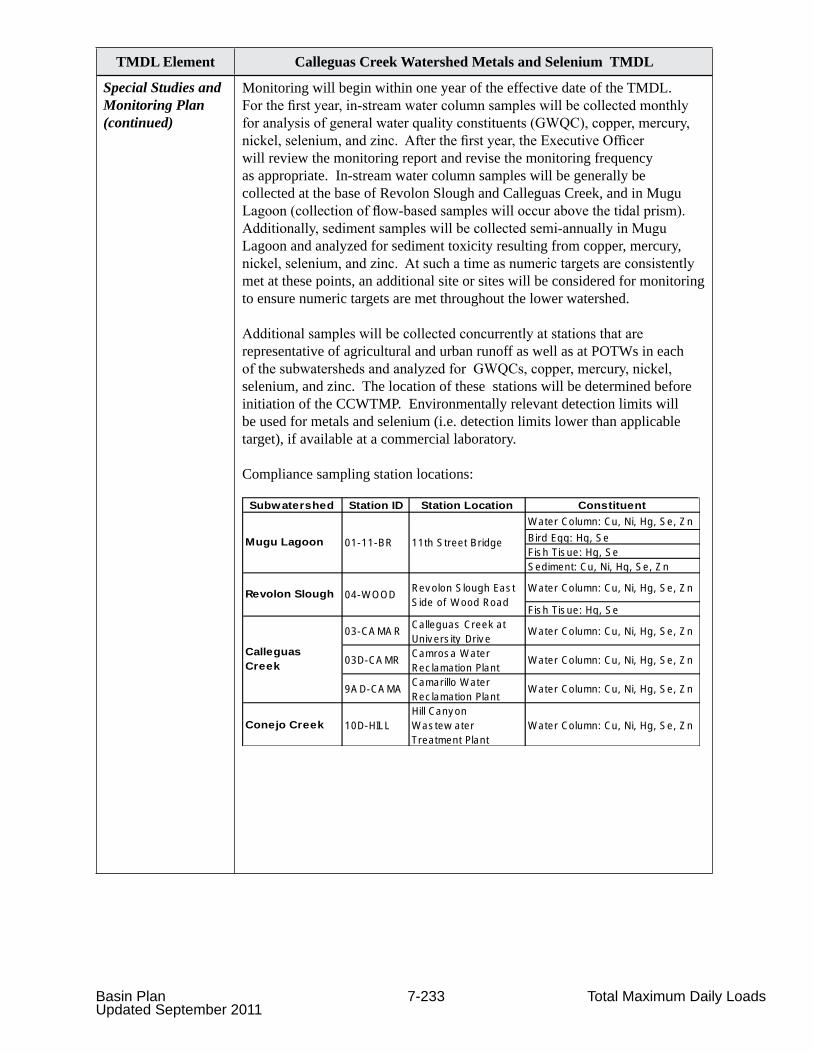
Basin Plan 7-2�� Total Maximum Daily LoadsUpdated September 20��
TMDL Element Calleguas Creek Watershed Metals and Selenium TMDL
Special Studies and Monitoring Plan (continued)
Monitoring will begin within one year of the effective date of the TMDL. Forthefirstyear,in-streamwatercolumnsampleswillbecollectedmonthlyforanalysisofgeneralwaterqualityconstituents(GWQC),copper,mercury,nickel,selenium,andzinc.Afterthefirstyear,theExecutiveOfficerwill review the monitoring report and revise the monitoring frequency as appropriate. In-stream water column samples will be generally be collected at the base of Revolon Slough and Calleguas Creek, and in Mugu Lagoon(collectionofflow-basedsampleswilloccurabovethetidalprism).Additionally,sedimentsampleswillbecollectedsemi-annuallyinMuguLagoon and analyzed for sediment toxicity resulting from copper, mercury, nickel,selenium,andzinc.Atsuchatimeasnumerictargetsareconsistentlymet at these points, an additional site or sites will be considered for monitoring to ensure numeric targets are met throughout the lower watershed.
Additionalsampleswillbecollectedconcurrentlyatstationsthatarerepresentative of agricultural and urban runoff as well as at POTWs in each ofthesubwatershedsandanalyzedforGWQCs,copper,mercury,nickel,selenium, and zinc. The location of these stations will be determined before initiation of the CCWTMP. Environmentally relevant detection limits will be used for metals and selenium (i.e. detection limits lower than applicable target), if available at a commercial laboratory.
Compliance sampling station locations:
Subwatershed StationID StationLocation ConstituentW ater Column: Cu, Ni, Hg, Se, Z nBird Egg: Hg, SeFis h Tis ue: Hg, SeSediment: Cu, Ni, Hg, Se, Z n
W ater Column: Cu, Ni, Hg, Se, Z n
Fis h Tis ue: Hg, Se
03-CA MA R Calleguas Creek at Univ ers ity Dr iv e
W ater Column: Cu, Ni, Hg, Se, Z n
03D-CA MR Camros a W ater Rec lamation Plant
W ater Column: Cu, Ni, Hg, Se, Z n
9A D-CA MA Camar illo W ater Rec lamation Plant
W ater Column: Cu, Ni, Hg, Se, Z n
ConejoCreek 10D-HILLHill Cany on W as tew ater Treatment Plant
W ater Column: Cu, Ni, Hg, Se, Z n
CalleguasCreek
MuguLagoon 01-11-BR 11th Street Br idge
04-W OOD Rev olon Slough Eas t Side of W ood Road
RevolonSlough

Basin Plan 7-2�4 Total Maximum Daily LoadsUpdated September 20��
TMDL Element Calleguas Creek Watershed Metals and Selenium TMDL
Implementation Plan
ThefinalWLAswillbeincludedforpermittedstormwaterdischarges,POTWs, and other NPDES discharges in accordance with the compliance schedulesprovidedinTable7-19.2.TheRegionalBoardmayrevisetheseWLAsbasedonadditionalinformationdevelopedthroughspecialstudies and/or monitoring conducted as part of this TMDL. In addition, the implementation schedule was developed with the assumption that a WER for copper and a SSO for nickel will proceed following the TMDL. Should adoption and approvals of the WER and SSO not proceed, additional implementation actions could be required. The implementation plan includes discussion of implementation actions to address these conditions.
WLAsestablishedforSimiValleyWQCP,CamrosaWRP,andMoorparkWTPin this TMDL will be implemented through NPDES permit limits. Compliance willbedeterminedthroughmonitoringoffinaleffluentdischargeasdefinedin the NPDES permit. The Hill Canyon and Camarillo WRPs are working towardsdiscontinuingthedischargeofeffluenttoConejoCreek.Ifthisplanis implemented, the POTW allocations for the watershed will be achieved byreductionofeffluentdischargestothestream.Theimplementationplanincludessufficienttimeforthisplantobeimplemented.However,ifthisplanis altered, the POTWs will need to meet allocations through other methods such as source control activities. The Regional Board will need to ensure that permitconditionsareconsistentwiththeassumptionsoftheWLAs.Shouldfederal,state,orregionalguidanceorpracticeforimplementingWLAsinto permits be revised, the Regional Board may reevaluate the TMDL to incorporate such guidance.
Inaccordancewithcurrentpractice,agroupconcentration-basedWLAhas been developed for all permitted stormwater discharges, including municipalseparatestormsewersystems(MS4s),Caltrans,generalindustrialandconstructionstormwaterpermits,andNavalAirWeaponsStationPointMugu.MS4WLAswillbeincorporatedintotheNPDESpermitasreceivingwater limits measured in-stream at the base of Revolon Slough and Calleguas Creek, and in Mugu Lagoon and will be achieved through the implementation of BMPs as outlined in the implementation plan. The Regional Board will need to ensure that permit conditions are consistent with the assumptions of theWLAs.IfBMPsaretobeused,theRegionalBoardwillneedtodetailitsfindingsandconclusionssupportingtheuseofBMPsintheNPDESpermit fact sheets. Should federal, state, or regional guidance or practice forimplementingWLAsintopermitsberevised,theRegionalBoardmayreevaluate the TMDL to incorporate such guidance. The Regional Board may revisetheseWLAsbasedonthecollectionofadditionalinformationdevelopedthrough special studies and/or monitoring conducted as part of this TMDL.

Basin Plan 7-2�5 Total Maximum Daily LoadsUpdated September 20��
TMDL Element Calleguas Creek Watershed Metals and Selenium TMDL
Implementation Plan (continued)
LAswillbeimplementedthroughtheState’sNonpointSourcePollutionControl Program (NPSPCP) and Conditional Waiver for Discharges from IrrigatedLandsadoptedbytheLosAngelesRegionalWaterQualityControlBoardonNovember3,2005.CompliancewithLAswillbemeasuredin-stream at the base of Revolon Slough and Calleguas Creek and in Mugu Lagoon and will be achieved through the implementation of BMPs consistent with the NPSPCP and the Conditional Waiver Program.
The Conditional Waiver Program requires the development of an agricultural waterqualitymanagementplan(AWQMP)toaddresspollutantsthatareexceeding receiving water quality objectives as a result of agricultural discharges. Therefore, implementation of the load allocations will be through thedevelopmentofanAWQMPformetalsandselenium.Implementationof the load allocations will also include the coordination of BMPs being implemented under other required programs to ensure metal discharges are consideredintheimplementation.Additionally,agriculturaldischargerswill participate in educational seminars on the implementation of BMPs as required under the Conditional Waiver Program. Studies are currently being conducted to assess the extent of BMP implementation and provide information on the effectiveness of BMPs for agriculture. This information willbeintegratedintotheAWQMPthatwillguidetheimplementationofagriculturalBMPsintheCalleguasCreekwatershed.Afterimplementationof these actions, compliance with the allocations and TMDL will be evaluated and the allocations reconsidered if necessary based on the special studies and monitoring plan section of the implementation plan
AgriculturalandPSDsdischargerswillhavearequired25%,50%and100% reduction in the difference between the current loadings and the load allocations at 5, 10 and 15 years after the effective date, respectively. AchievementofrequiredreductionswillbeevaluatedbasedonprogresstowardsBMPimplementationasoutlinedintheUWQMPs,AWQMP,Conditional Waiver Program, and in consideration of background loading information, if available. If the interim reductions are not met, the dischargers willsubmitareporttotheExecutiveOfficerdetailingwhythereductionswerenot met and the steps that will be taken to meet the required reductions.
AsshowninTable7-19.2,implementationofLAswillbeconductedovera period of time to allow for implementation of the BMPs, as well as coordination with special studies and implementation actions resulting from other TMDL Implementation Plans for the Calleguas Creek watershed. The RegionalBoardmayrevisetheLAsbasedonthecollectionofadditionalinformation developed through special studies and/or monitoring conducted as part of this TMDL.

Basin Plan 7-2�6 Total Maximum Daily LoadsUpdated September 20��
Table 7-19.2 Calleguas Creek Watershed Metals and Selenium TMDL: Implementation ScheduleItem Implementation Action1 Responsible Party Completion Date
1Effective date of interim Metals and Selenium TMDLwasteloadallocation(WLAs),andfinalWLAsforotherNPDESpermittees
POTWs, Permitted Stormwater Dischargers2 (PSD), Other NPDES Permittees
Effective date of the amendment
2 Effective date of interim Metals and Selenium TMDLloadallocation(LAs)
AgriculturalDischargers
Effective date of the amendment
3a Submit Calleguas Creek Watershed Metals and Selenium Monitoring Program
POTWs, PSD, AgriculturalDischargers
Within 3 months after the effective date of the amendment
3b Implement Calleguas Creek Watershed Metals and Selenium Monitoring Program
POTWs, PSD, AgriculturalDischargers
Within 3 months of ExecutiveOfficerapproval of the monitoring program
3c Re-calibrate HSPF water quality model based on firstyearofmonitoringdata
POTWs, PSD, AgriculturalDischargers
1 year after submittal of firstannualmonitoringreport
4a
Conduct a source control study, develop and submit an Urban Water Quality Management Program (UWQMP) for copper, mercury, nickel, and selenium
MS4sWithin 2 years after the effective date of the amendment
4bConduct a source control study, develop and submit an UWQMP for copper, mercury, nickel, and selenium
CaltransWithin 2 years after the effective date of the amendment
4cConduct a source control study, develop and submit an UWQMP for copper, mercury, nickel, and selenium
NAWSpointMugu(US Navy)
Within 2 years after the effective date of the amendment
5 Implement UWQMP PSDWithin 1 year of approval of UWQMP by the ExecutiveOfficer
6DevelopandsubmitanAgriculturalWaterQualityManagementProgram(AWQMP)asdescribedinthe Conditional Waiver Program
AgriculturalDischargers
Within 2 years after the effective date of the amendment
7 ImplementAWQMP AgriculturalDischargers
Within 1 year of approval ofAWQMPbytheExecutiveOfficer
8DevelopWLAsandLAsforzincifimpairmentforMuguLagoonismaintainedonthefinal2006303(d) list
Regional Board or USEPA
Within1yearofthefinal2006 303(d) list
9
Submit progress report on salinity management plan,includingstatusofreducingWRPeffluentdischarges to Conejo and Calleguas Creek reaches of the watershed
POTWsWithin 3 years after the effective date of the amendment
10
Ifprogressreportidentifiestheeffluentdischargesreduction is not progressing, develop and implement source control activities for copper, mercury, nickel, and selenium
POTWsWithin4yearsaftertheeffective date of the amendment

Basin Plan 7-2�7 Total Maximum Daily LoadsUpdated September 20��
Item Implementation Action1 Responsible Party Completion Date
11 Re-evaluation of POTW interim waste load allocations for copper, mercury, and nickel POTWs
Within 5 years after the effective date of the amendment
12a
Evaluate the results of the OCs TMDL, Special Study – Calculation of sediment transport rates in the Calleguas Creek watershed for applicability to the metals and selenium TMDL
AgriculturalDischargers, PSD
Within 6 months of completion of the study
12b
Include monitoring for copper, mercury, nickel, and selenium in the OC pesticides TMDL, special Study – Monitoring of sediment by source and land use type
AgriculturalDischargers, PSD
Within 2 years after the effective date of the amendment
12c
Expand scope of the OC Pesticide TMDL, Special Study – Examination of food webs and accumulation in the Calleguas Creek watershed to ensure protection of wildlife to include mercury
Interested partiesIf necessary, prior to end of the implementation period
12d
Evaluate the results of the OC Pesticides TMDL, Special Study – Effects of BMPs on Sediment and Siltation to determine the impacts on metals and selenium
AgriculturalDischargers, PSD
Within 6 months of completion of the study
13a Submit work plan for Special Study #1 (Optional) –IdentificationofNaturalSourcesExclusion
AgriculturalDischargers, PSD
Within 1 year after the effective date of the amendment
13b Submit results of Special Study #1 (Optional) –IdentificationofNaturalSourcesExclusion
AgriculturalDischargers, PSD
Within 3 years of approval of workplan by ExecutiveOfficer
14aSubmit work plan for Special Study #2 –IdentificationofseleniumContaminatedGroundwaterSources
POTWs, PSD, andAgriculturalDischargers
Within 1 year after the effective date of the amendment
14b SubmitresultsofSpecialStudy#2–IdentificationofseleniumContaminatedGroundwaterSources
POTWs, PSD, andAgriculturalDischargers
Within 1 year of approval of workplan by Executive Officer
15aSubmit work plan for Special Study #3 – InvestigationofMetals’“HotSpot”andNaturalSoil
PSD and AgriculturalDischarger
Within 1 year after the effective date of the amendment
15b Submit results of Special Study #3 – Investigation ofmetals’“HotSpot”andNaturalSoil
PSD and AgriculturalDischarger
Within 2 years of approval of workplan by ExecutiveOfficer
16 SpecialStudy#4(Optional)–DeterminationofWER for copper in Revolon Slough
PSD and AgriculturalDischargers
If necessary, prior to end of the implementation period
17 Special Study #5 (Optional) – Determination of Site SpecificObjectiveforMercuryandSelenium
PSD and AgriculturalDischargers
If necessary, prior to end of the implementation period
18Evaluate effectiveness of BMPs implemented under theAWQMPandUWQMPincontrollingmetalsand selenium discharges
PSD and AgriculturalDischargers
6 years after the effective date of the amendment
19Evaluatetheresultsofimplementationactions14and 15 (Special Study #2 & #3) and implement actionsidentifiedbythestudies
POTWs, PSD, andAgriculturalDischargers
Within 1 year after the completion of the studies
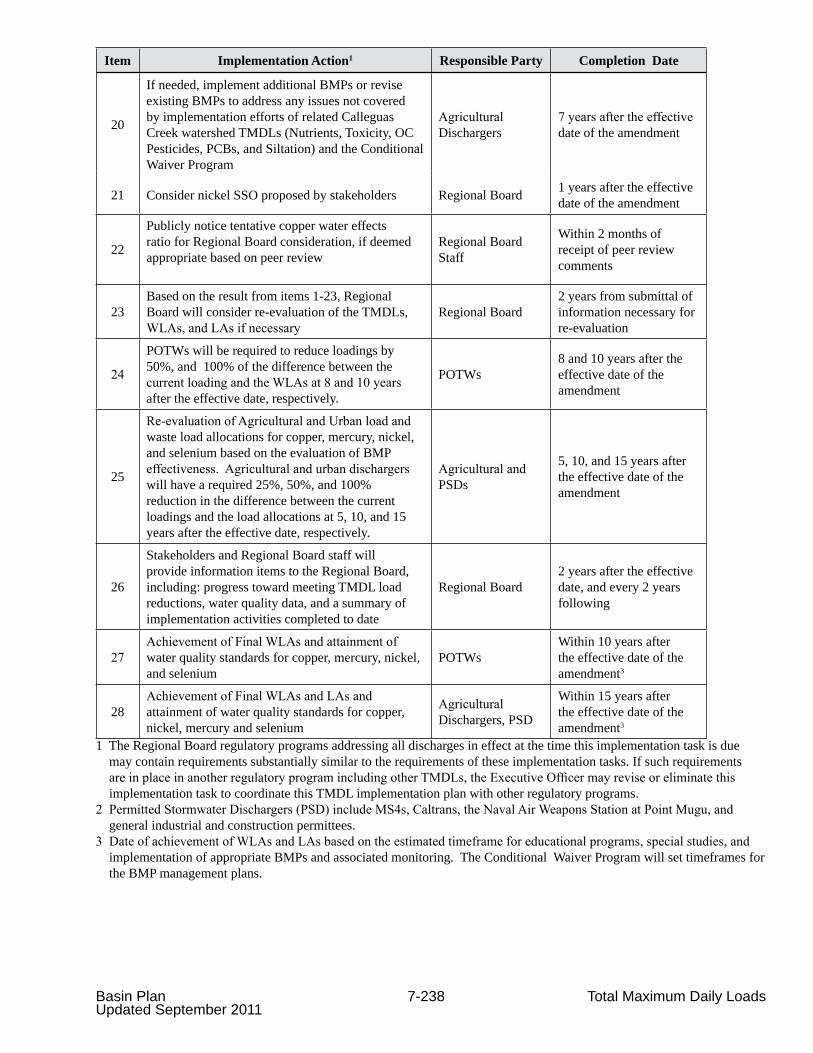
Basin Plan 7-2�8 Total Maximum Daily LoadsUpdated September 20��
Item Implementation Action1 Responsible Party Completion Date
20
If needed, implement additional BMPs or revise existing BMPs to address any issues not covered by implementation efforts of related Calleguas Creek watershed TMDLs (Nutrients, Toxicity, OC Pesticides, PCBs, and Siltation) and the Conditional Waiver Program
AgriculturalDischargers
7yearsaftertheeffectivedate of the amendment
21 Consider nickel SSO proposed by stakeholders Regional Board 1 years after the effective date of the amendment
22
Publicly notice tentative copper water effects ratio for Regional Board consideration, if deemed appropriate based on peer review
Regional Board Staff
Within 2 months of receipt of peer review comments
23Based on the result from items 1-23, Regional Board will consider re-evaluation of the TMDLs, WLAs,andLAsifnecessary
Regional Board2 years from submittal of information necessary for re-evaluation
24
POTWs will be required to reduce loadings by 50%, and 100% of the difference between the currentloadingandtheWLAsat8and10yearsafter the effective date, respectively.
POTWs8 and 10 years after the effective date of the amendment
25
Re-evaluationofAgriculturalandUrbanloadandwaste load allocations for copper, mercury, nickel, and selenium based on the evaluation of BMP effectiveness.Agriculturalandurbandischargerswill have a required 25%, 50%, and 100% reduction in the difference between the current loadings and the load allocations at 5, 10, and 15 years after the effective date, respectively.
AgriculturalandPSDs
5, 10, and 15 years after the effective date of the amendment
26
Stakeholders and Regional Board staff will provide information items to the Regional Board, including: progress toward meeting TMDL load reductions, water quality data, and a summary of implementation activities completed to date
Regional Board 2 years after the effective date, and every 2 years following
27AchievementofFinalWLAsandattainmentofwater quality standards for copper, mercury, nickel, and selenium
POTWsWithin 10 years after the effective date of the amendment3
28AchievementofFinalWLAsandLAsandattainment of water quality standards for copper, nickel, mercury and selenium
AgriculturalDischargers, PSD
Within 15 years after the effective date of the amendment3
1 The Regional Board regulatory programs addressing all discharges in effect at the time this implementation task is due may contain requirements substantially similar to the requirements of these implementation tasks. If such requirements areinplaceinanotherregulatoryprogramincludingotherTMDLs,theExecutiveOfficermayreviseoreliminatethis implementation task to coordinate this TMDL implementation plan with other regulatory programs.2PermittedStormwaterDischargers(PSD)includeMS4s,Caltrans,theNavalAirWeaponsStationatPointMugu,and general industrial and construction permittees.3DateofachievementofWLAsandLAsbasedontheestimatedtimeframeforeducationalprograms,specialstudies,and implementation of appropriate BMPs and associated monitoring. The Conditional Waiver Program will set timeframes for the BMP management plans.

Basin Plan 7-2�9 Total Maximum Daily LoadsUpdated September 20��
7-21 Ballona Creek, Ballona Estuary, and Sepulveda Channel Bacteria TMDL
This TMDL was adopted by: The Regional Water Quality Control Board on June 8, 2006.
This TMDL was approved by: The State Water Resources Control Board on November 15, 2006. TheOfficeofAdministrativeLawonFebruary20,2007. TheU.S.EnvironmentalProtectionAgencyonMarch26,2007.
TheeffectivedateofthisTMDLis:April27,2007.
The following table includes all the elements of this TMDL.
Table 7-21.1. Ballona Creek, Estuary, and Tributaries Bacteria TMDL: Elements
Element Key Findings and Regulatory ProvisionsProblem Statement Elevated bacterial indicator densities are causing impairment of
thewatercontactrecreation(REC-1)beneficialusedesignatedforBallona Estuary and Sepulveda Channel, limited water contact recreation (LREC) designated for Ballona Creek Reach 2, and non-contactrecreation(REC-2)beneficialusesofBallonaCreekReach1.Recreating in waters with elevated bacterial indicator densities has long beenassociatedwithadversehumanhealtheffects.Specifically,localand national epidemiological studies compel the conclusion that there is a causal relationship between adverse health effects and recreational water quality, as measured by bacterial indicator densities.
Numeric Target (Interpretation of the numeric water quality objective, used to calculate the waste load allocations)
The TMDL has a multi-part numeric target based on the bacteriological water quality objectives for marine and fresh water to protect the contact and non-contact recreation uses. These targets are the most appropriate indicators of public health risk in recreational waters.These bacteriological objectives are set forth in Chapter 3 of the Basin Plan.1 The objectives are based on four bacterial indicators and include both geometric mean limits and single sample limits. The Basin Plan objectives that serve as the numeric targets for this TMDL are:
In Marine Waters Designated for Water Contact Recreation (REC-1)
1.GeometricMeanLimitsa. Total coliform density shall not exceed 1,000/100 ml. b. Fecal coliform density shall not exceed 200/100 ml.c. Enterococcus density shall not exceed 35/100 ml.
2. Single Sample Limitsa. Total coliform density shall not exceed 10,000/100 ml.b.Fecalcoliformdensityshallnotexceed400/100ml.c.Enterococcusdensityshallnotexceed104/100ml.d. Total coliform density shall not exceed 1,000/100 ml, if the
ratio of fecal-to-total coliform exceeds 0.1.

Basin Plan 7-240 Total Maximum Daily LoadsUpdated September 20��
Element Key Findings and Regulatory ProvisionsNumeric Target(Interpretation of the numeric water quality objective, used to calculate the waste load allocations)(continued)
In Fresh Waters Designated for Water Contact Recreation (REC-1)
1.GeometricMeanLimitsa. E. coli density shall not exceed 126/100 ml.b. Fecal coliform density shall not exceed 200/100 ml.
2. Single Sample Limitsa. E. coli density shall not exceed 235/100 ml.b.Fecalcoliformdensityshallnotexceed400/100ml.
In Fresh Waters Designated for Limited Water Contact Recreation (LREC-1)2
1.GeometricMeanLimitsa. E. coli density shall not exceed 126/100 ml.b. Fecal coliform density shall not exceed 200/100 ml.
2. Single Sample Limitsa. E. colidensityshallnotexceed576/100ml.
In Fresh Waters Designated for Non-Contact Water Recreation (REC-2)
1.GeometricMeanLimitsa. Fecal coliform density shall not exceed 2000/100 ml.
2. Single Sample Limitsa.Fecalcoliformdensityshallnotexceed4000/100ml.
The targets apply throughout the year. Determination of attainment of thetargetswillbeatin-streammonitoringsitestobespecifiedinthecompliance monitoring report.
Implementation of the above REC-1 and LREC-1 bacteria objectives and the associated TMDL numeric targets is achieved using a ‘reference system/anti-degradationapproach’ratherthanthealternative‘naturalsourcesexclusionapproachsubjecttoantidegradationpolicies’orstrictapplicationofthesinglesampleobjectives.AsrequiredbytheCWAandPorter-CologneWaterQualityControlAct,BasinPlansincludebeneficialusesofwaters,waterqualityobjectivestoprotectthoseuses,an anti-degradation policy, collectively referred to as water quality standards, and other plans and policies necessary to implement water quality standards. This TMDL and its associated waste load allocations, which shall be incorporated into relevant permits, and load allocations arethevehiclesforimplementationoftheRegion’sstandards.

Basin Plan 7-24� Total Maximum Daily LoadsUpdated September 20��
Element Key Findings and Regulatory ProvisionsNumeric Target (Interpretation of the numeric water quality objective, used to calculate the waste load allocations)(continued)
The‘referencesystem/anti-degradationapproach’meansthatonthebasis of historical exceedance levels at existing monitoring locations, including a local reference beach within Santa Monica Bay, a certain number of daily exceedances of the single sample bacteria objectives are permitted. The allowable number of exceedance days is set such that (1) bacteriological water quality at any site is at least as good as at a designated reference site within the watershed and (2) there is no degradation of existing bacteriological water quality. This approach recognizes that there are natural sources of bacteria that may cause or contribute to exceedances of the single sample objectives and that it is not the intent of the Regional Board to require treatment or diversion of natural coastal creeks or to require treatment of natural sources of bacteria from undeveloped areas.
The geometric mean targets may not be exceeded at any time. The rolling 30-day geometric means will be calculated on each day. If weekly sampling is conducted, the weekly sample result will be assigned to the remaining days of the week in order to calculate the daily rolling 30-day geometric mean. For the single sample targets, each existing monitoring site is assigned an allowable number of exceedancedaysforthreetimeperiods(1)summerdry-weather(April1 to October 31), (2) winter dry-weather (November 1 to March 31), and(3)wet-weather(definedasdayswith0.1inchofrainorgreaterand the three days following the rain event.)
ImplementationoftheREC-2targetwillbeasspecifiedintheBasinPlan. The REC-2 bacteria objectives allow for a 10% exceedance frequency of the single sample limit in samples collected during a 30-day period. This allowance, which is based on an acceptable level of health risk, will be applied in lieu of the allowable exceedance days discussedearlier.AswiththeotherREC-1andLREC-1objectives,thegeometric mean target for REC-2, which is based on a rolling 30-day period, will be strictly adhered to and may not be exceeded at any time.
Source Analysis ThemajorcontributorsofflowsandassociatedbacterialoadingtoBallona Creek and Estuary, are dry- and wet-weather urban runoff discharges from the storm water conveyance system. Run-off to Ballona CreekisregulatedasapointsourceundertheLosAngelesCountyMS4Permit,theCaltransStormWaterPermit,andtheGeneralConstructionand Industrial Storm Water Permits. In addition to these regulated point sources, the Ballona Estuary receives input from the Del Rey Lagoon and Ballona Wetlands through connecting tide gates.

Basin Plan 7-242 Total Maximum Daily LoadsUpdated September 20��
Element Key Findings and Regulatory ProvisionsSource Analysis (continued) Preliminary data suggest that the Ballona Wetlands are a sink for
bacteria from Ballona Creek and it is therefore not considered a source in this TMDL. Inputs to Ballona Estuary from Del Rey Lagoon, are considered non-point sources of bacterial contamination. This waterbody may be considered for a natural source exclusion if its contributing bacteria loads are determined to be as a result of wildlife in the area, as opposed to anthropogenic inputs. The TMDL will require asourceidentificationstudyforthelagooninordertoapplythenaturalsource exclusion.
Other nonpoint sources in Ballona Creek and Estuary include natural sources from birds, waterfowl and other wildlife. Data do not currently exist to quantify the extent of the impact of wildlife on bacteria water quality in the Estuary.
Loading Capacity Theloadingcapacityisdefinedintermsofbacterialindicatordensities,which is the most appropriate for addressing public health risk, and is equivalent to the numeric targets, listed above.
Waste Load Allocations (for point sources)
TheLosAngelesCountyMS4andCaltransstormwaterpermitteesandco-permitteesareassignedwasteloadallocations(WLAs)expressedasthe number of daily or weekly sample days that may exceed the single sample targets equal to the TMDLs established for the impaired reaches (seeTable7.21.2a),andWasteLoadAllocationsassignedtowaterstributarytoimpairedreaches(Table7.21.2b).Wasteloadallocationsare expressed as allowable exceedance days because the bacterial density and frequency of single sample exceedances are the most relevant to public health protection.
For each monitoring site, allowable exceedance days are set on an annual basis as well as for three time periods. These three periods are:1. summerdry-weather(April1toOctober31)2. winter dry-weather (November 1 to March 31) 3. wet-weatherdays(definedasdaysof0.1inchofrainormoreplus
three days following the rain event).
TheCountyofLosAngeles,Caltrans,andtheCitiesofLosAngeles,Culver City, Beverly Hills, Inglewood, West Hollywood, and Santa Monica are the responsible jurisdictions and responsible agencies3 for the Ballona Creek Watershed. The responsible jurisdictions and responsible agencies within the watershed are jointly responsible for complying with the waste load allocation in each reach.

Basin Plan 7-24� Total Maximum Daily LoadsUpdated September 20��
Element Key Findings and Regulatory ProvisionsWaste Load Allocations (for point sources)(continued)
For the single sample objectives of the impaired REC-1 and LREC-1 reaches,theproposedWLAforsummerdry-weatherarezero(0)daysof allowable exceedances, and those for winter dry-weather and wet-weatherarethree(3)daysandseventeen(17)daysofexceedance,respectively. In the instances where more than one single sample objective applies, exceedance of any one of the limits constitutes an exceedance day. The proposed waste load allocation for the rolling 30-day geometric mean for the responsible agencies and jurisdictions is zero (0) days of allowable exceedances.
For the single sample objectives of the impaired REC-2 reach, the proposedWLAforallperiodsisa10%exceedancefrequencyoftheREC-2 single sample water quality objectives. The proposed waste load allocation for the rolling 30-day geometric mean for the responsible agencies and jurisdictions is zero (0) days of allowable exceedances.
In addition to assigning TMDLs for the impaired reaches, Waste Load AllocationsandLoadAllocationsareassignedtothetributariestotheseimpairedreaches.TheseWLAsandLAsaretobemetattheconfluenceofeachtributaryanditsdownstreamreach(seeTable7.21.2b).
Load Allocations (for nonpoint sources)
Load allocations are expressed as the number of daily or weekly sampledaysthatmayexceedthesinglesampletargetsidentifiedunder “Numeric Target” at a monitoring site, along with a rolling 30-day geometric mean. Load allocations are expressed as allowable exceedance days because the bacterial density and frequency of single sample exceedances are the most relevant to public health protection. Del Rey Lagoon is considered a nonpoint source and is therefore subject to load allocations.
TheproposedLAforsummerdry-weatherarezero(0)daysofallowable exceedances, and those for winter dry-weather and wet-weatherarethree(3)daysandseventeen(17)daysofexceedance,respectively. In the instances where more than one single sample objective applies, exceedance of any one of the limits constitutes an exceedance day. The proposed load allocation for the rolling 30-day geometric mean for the responsible agencies and jurisdictions is zero (0)daysofallowableexceedances(seeTable7.21.2a).
TheCityofLosAngelesistheresponsiblejurisdictionfortheDelRey lagoon, and is responsible for complying with the assigned load allocationspresentedinTable7.21.2batthetidegate(s)betweentheLagoon and the Estuary.
Ifotherunidentifiednonpointsourcesaredirectlyimpactingbacteriological water quality and causing an exceedance of the numeric targets, within the Estuary, the permittee(s) under the Municipal Storm Water NPDES Permits are not responsible through these permits. However, the jurisdiction or agency adjacent to the monitoring location may have further obligations to identify such sources.

Basin Plan 7-244 Total Maximum Daily LoadsUpdated September 20��
Element Key Findings and Regulatory ProvisionsImplementation The regulatory mechanisms used to implement the TMDL will include
theLosAngelesCountyMunicipalStormWaterNPDESPermit(MS4),the Caltrans Storm Water Permit, general NPDES permits, general industrial storm water permits, general construction storm water permits,andtheauthoritycontainedinSections13263and13267oftheWaterCode.EachNPDESpermitassignedaWLAshallbereopenedor amended at re-issuance, in accordance with applicable laws, to incorporatetheapplicableWLAsasapermitrequirement.
Each responsible jurisdictions and agency will be required to meet the stormwaterwasteloadallocationssharedbytheLACountyMS4andCaltrans permittees at the designated TMDL effectiveness monitoring points.Aniterativeimplementationapproachusingacombinationofnon-structural and structural BMPs may be used to achieve compliance with the waste load allocations. The administrative record and the fact sheetsfortheMS4andCaltransstormwaterpermitsmustprovidereasonableassurancethattheBMPsselectedwillbesufficienttoimplement the waste load allocation.
Load allocations for nonpoint sources will be incorporated into Waste Discharge Requirements and MOUs with the responsible jurisdictional agencies.
This TMDL will be implemented in two phases over a ten-year period (seeTable7-21.3).WithinsixyearsoftheeffectivedateoftheTMDL,compliancewiththeallowablenumberofsummerdry-weather(April1 to October 31), winter dry-weather exceedance days (November 1 to March 31) and the rolling 30-day geometric mean targets for both periods must be achieved. Within ten years of the effective date of the TMDL, compliance with the allowable number of wet-weather exceedance days and rolling 30-day geometric mean targets must be achieved.
In order to clearly justify an extended implementation schedule beyond 10yearsandupto14yearsfromtheeffectivedateoftheTMDL,theresponsibleagenciesarerequiredtosubmitadditionalquantifiableanalyses as described below to demonstrate (1) the proposed plans will meetthefinalWLAsand(2)theproposedimplementationactionswillachievemultiplewaterqualitybenefitsandotherpublicgoals.
Thetypesofapproachesproposedcoupledwithquantifiableestimatesoftheintegratedwaterresourcesbenefitsoftheproposedstructuraland non-structural BMPs included in the Implementation Plan would provide the obligatory demonstration that an integrated water resources approach is being pursued. This demonstration shall include numeric estimatesofthebenefits,includingbutnotlimitedtoreductionsinother pollutants, groundwater recharged, acres of multi-use projects and water(e.g.urbanrunoff)beneficiallyreused.

Basin Plan 7-245 Total Maximum Daily LoadsUpdated September 20��
Element Key Findings and Regulatory ProvisionsImplementation (continued) The responsible jurisdictions and the responsible agencies must submit
areporttotheExecutiveOfficer(seeTable7-21.3)describinghowtheyintendtocomplywiththedry-weatherandwet-weatherWLAs.Astheprimaryjurisdiction,theCityofLosAngelesisresponsibleforsubmitting the implementation plan report described above.
In addition, as the responsible agency for Del Rey Lagoon, the City of LosAngelesmustsubmitareportdetailinghowitintendstocomplywiththeloadallocationsassignedtothiswaterbody.Alternatively,theCityofLosAngelesmaysubmitdataclearlydemonstratingthatDelReyLagoonisnotasource,fortheRegionalBoard’sconsideration..
TheRegionalBoardintendstoreconsiderthisTMDL,within4yearsofitseffectivedatetoincorporatemodificationstotheWLAsbasedon results of the scheduled reconsideration of the Santa Monica Bay (SMB) beaches TMDLs. The SMB beaches TMDLs are scheduled to be reconsidered in four years to re-evaluate the allowable winter dry-weather and wet-weather exceedance days based on additional data on bacterial indicator densities in the wave wash; to re-evaluate the reference system selected to set allowable exceedance levels; to re-evaluate the reference year used in the calculation of allowable exceedance days, and to re-evaluate the need for revision of the geometric mean implementation provision.
TheRegionalBoardalsointendstore-assestheWLAsforBenedictCanyon Channel, Sepulveda Channel, and Centinela Creek based on results of the required compliance monitoring, and/or any voluntary beneficialuseinvestigations.
Margin of Safety By directly applying the numeric water quality standards and implementation procedures asWaste LoadAllocations, there is littleuncertainty about whether meeting the TMDLs will result in meeting the water quality standards.
Seasonal Variations and Critical Conditions
Seasonal variations are addressed by developing separate waste load allocations for three time periods (summer dry-weather, winter-dry weather, and wet-weather) based on public health concerns and observed natural background levels of exceedance of bacterial indicators.
The critical condition for bacteria loading to the Ballona Creek, Ballona Estuary, and Sepulveda Channel is during wet weather when monitoring data indicate greater exceedance probabilities of the single sample bacteria objectives than during dry-weather.

Basin Plan 7-246 Total Maximum Daily LoadsUpdated September 20��
Element Key Findings and Regulatory ProvisionsSeasonal Variations and Critical Conditions (continued)
TheSantaMonicaBayBeachesBacteriaTMDLidentifiedthecriticalconditionwithinwetweathermorespecifically,inordertosettheallowable number of exceedances of the single sample limit days. The 90th percentile storm year in terms of wet days was used as the reference year. The 90th percentile year was selected for several reasons. First, selecting the 90th percentile year avoids an untenable situation where the reference system is frequently out of compliance. Second, selecting the 90th percentile year allows responsible jurisdictions and responsible agenciestoplanfora‘worst-casescenario’,asacriticalconditionisintended to do.
Monitoring The TMDL effectiveness monitoring program will assess attainment of the allowable exceedances for Ballona Creek, Ballona Estuary, and SepulvedaChannel,andtheWLAsforthetributaries.Responsiblejurisdictions and responsible agencies shall conduct daily or systematic weekly sampling at a minimum of two locations within Ballona Estuary and Reach 2 of Ballona Creek, at least one location each in Reach 1ofBallonaCreekandSepulvedaChannel,andattheconfluencewith Centinela Creek and Benedict Canyon Channel, to determine compliance. Similar monitoring at the connecting tide gates of Del Rey Lagoon is also required. Where monitoring locations are located at or close to the boundary of two reaches, data from sampling points will also be used to assess the immediate downstream reach. This will ensure that the downstream reaches, which have more stringent water quality objectives, are adequately protected.
If the number of exceedance days is greater than the allowable number of exceedance days in the REC-1 and LREC-1 waters, and/or the frequency of exceedance is greater than 10% in the REC-2 waters, the responsible jurisdictions and/or responsible agencies shall be considered not to be attaining the TMDLs and/or assigned allocations (non-attaining). Responsible jurisdictions or agencies shall not be deemed non-attaining if the investigation described in the paragraph below demonstrates that bacterial sources originating within the jurisdiction of the responsible agency have not caused or contributed to the exceedance.
If an in-stream location is non-attaining as determined in the previous paragraph, the Regional Board shall require responsible agencies to initiate an investigation, which at a minimum shall include daily sampling at the existing monitoring location until all single sample events meet bacteria water quality objectives.

Basin Plan 7-247 Total Maximum Daily LoadsUpdated September 20��
Element Key Findings and Regulatory ProvisionsSpecial Studies Should the jurisdictional agency for Del Rey Lagoon opt for the natural
source exclusion, the TMDL requires that a separate bacteria source identificationstudybeconductedtodetermineitseligibility.Thestudyshould identify all probable sources of bacteria loads, their estimated contributions to the Lagoon, and a determination of the frequency of exceedances of the single sample bacteria objectives caused by the identifiednaturalsources.
1 The bacteriological objectives were revised by a Basin Plan amendment adopted by the Regional Board on October 25, 2001,andsubsequentlyapprovedbytheStateWaterResourcesControlBoard,theOfficeofAdministrativeLawandfinallybyU.S.EPAonSeptember25,2002.2ThebacteriologicalobjectivesfortheLREC-1usedesignationwereprovidedinaBasinPlanAmendmentadoptedbyStateBoardonJanuary20,2005,andsubsequentlyapprovedbytheOfficeofAdministrativeLawandfinallybyU.S.EPAonFebruary17,2006.3ForthepurposesofthisTMDL,“responsiblejurisdictionsandresponsibleagencies”aredefinedas(1)localagenciesthat are permittees or co-permittees on a municipal storm water permit, (2) local or state agencies that have jurisdiction over Ballona Creek and Estuary, and (3) the California Department of Transportation pursuant to its storm water permit.

Basin Plan 7-248 Total Maximum Daily LoadsUpdated September 20��
Table 7-21.2a: Ballona Creek, Ballona Estuary and Sepulveda Channel Bacteria TMDL: Final Allowable Exceedance Days by Reach
Time Period Ballona Estuary, Ballona Creek Reach 2, and Sepulveda Channel *
Ballona Creek Reach 1**
Summer Dry-Weather (April1toOctober31)
Zero (0) exceedance days based on the applicable Single Sample Bacteria Water Quality Objectives
Zero (0) exceedance days based on theRolling30-DayGeometricMeanBacteria Water Quality Objectives
No more than 10% of the Single Sample Bacteria Water Quality Objectives
Zero (0) exceedance days based on theRolling30-DayGeometricMeanBacteria Water Quality Objectives
Winter Dry-Weather (November 1-March 31)
Three (3) exceedance days based on the applicable Single Sample Bacteria Water Quality Objectives
Zero (0) exceedance days based on theRolling30-DayGeometricMeanBacteria Water Quality Objectives
No more than 10% of the Single Sample Bacteria Water Quality Objectives
Zero (0) exceedance days based on theRolling30-DayGeometricMeanBacteria Water Quality Objectives
Wet-Weather (days with ≥0.1 inch of rain + 3 days following the rain event)
17***exceedancedaysbasedontheapplicable Single Sample Bacteria Water Quality Objectives
Zero (0) exceedance days based on theRolling30-DayGeometricMeanBacteria Water Quality Objectives
No more than 10% of the Single Sample Bacteria Water Quality Objectives
Zero (0) exceedance days based on theRolling30-DayGeometricMeanBacteria Water Quality Objectives
* Exceedance days for Ballona Estuary based on REC-1 marine water numeric targets; for Ballona Creek Reach 2 based on LREC-1 freshwater numeric targets; and for Sepulveda Channel, based on fresh water REC-1 numeric targets ** Exceedance frequency for Ballona Creek Reach 1 based on freshwater REC-2 numeric targets***InReach2,thegreateroftheallowableexceedancedaysunderthereferencesystemapproachorhighflowsuspension shall apply.

Basin Plan 7-249 Total Maximum Daily LoadsUpdated September 20��
Table 7-21.2b: Ballona Creek, Ballona Estuary and Sepulveda Channel Bacteria TMDL: WLAs and LAs for tributaries to the Impaired Reaches.
Tributary Point of Application Water Quality Objectives
Waste Load Allocation(No. exceedance days)
Ballona Creek Reach 1 AtconfluencewithReach2 LREC-1Freshwater
For single sample objectives:(0) summer dry weather, (3) winter dry weather(17*) winter wet weather
For geometric mean objectives:(0) for all periods
Benedict Canyon Channel
AtconfluencewithReach2 LREC-1Freshwater
For single sample objectives:(0) summer dry weather, (3) winter dry weather(17*) winter wet weather
For geometric mean objectives:(0) for all periods
Ballona Creek Reach 2 AtconfluencewithBallonaEstuary
REC-1Marine water
For single sample objectives:(0) summer dry weather, (3) winter dry weather(17) winter wet weather
For geometric mean objectives:(0) for all periods
Centinela Creek AtconfluencewithBallonaEstuary
REC-1Marine water
For single sample objectives:(0) summer dry weather, (3) winter dry weather(17) winter wet weather
For geometric mean objectives:(0) for all periods
Del Rey Lagoon AtconfluencewithBallonaEstuary
REC-1Marine water
For single sample objectives:(0) summer dry weather, (3)winter dry weather(17) winter wet weather
For geometric mean objectives:(0) for all periods
*AttheconfluencewithReach2,thegreateroftheallowableexceedancedaysunderthereferencesystemapproachorhighflowsuspensionshallapply.SepulvedaChannelwasnotassignedawasteloadallocationatitsconfluencewithReach2sincetheTMDLrequiresthe more stringent REC-1 objectives to be met in this waterbody, which should lead to the attainment of the less stringent LREC-1 objectives of the downstream reach.

Basin Plan 7-250 Total Maximum Daily LoadsUpdated September 20��
Table 7-21.3 Ballona Creek, Ballona Estuary and Sepulveda Channel Bacteria TMDL: Significant DatesDate Action
Responsible Jurisdictions for the Waste Load Allocations12 months after the effective date of the TMDL
Responsible jurisdictions and responsible agencies must submit, for Regional Board approval, a comprehensive bacteria water quality monitoring plan for the Ballona Creek Watershed. The plan mustbeapprovedbytheExecutiveOfficerbeforethemonitoringdata can be considered during the implementation of the TMDL. The plan must provide for analyses of all applicable bacteria indicators for which the Basin Plan and subsequent amendments have established objectives The plan must also include a minimum of two sampling locations (mid-stream and downstream) in Ballona Estuary, Ballona Creek (Reach 1 and 2), and their tributaries.
The draft monitoring report shall be made available for public commentandtheExecutiveOfficershallacceptpubliccommentsfor at least 30 days. Once the coordinated monitoring plan is approvedbytheExecutiveOfficer,monitoringshallcommencewithin 6 months.
21/2 years after the effective date of the TMDL
Responsible jurisdictions and agencies must provide a draft Implementation Plan to the Regional Board outlining how each intends to cooperatively achieve compliance with the dry-weather andwet-weatherTMDLWasteLoadAllocations.Thereportshallinclude implementation methods, an implementation schedule, and proposed milestones. The description of the implementation methods and milestones shall include a technically defensible quantitativelinkagetotheinterimandfinalwasteloadallocations(WLAs).Thelinkageshouldincludetargetreductionsinstormwater runoff and/or fecal indicator bacteria. The plan shallincludequantitativeestimatesofthewaterqualitybenefitsprovided by the proposed structural and non-structural BMPs. Estimates should address reductions in exceedance days, bacteria concentrationandloading,andflowinthedrainandateachbeach compliance monitoring location.
Aspartofthedraftplan,responsibleagenciesmustsubmitresultsofallspecialstudiesand/orEnvironmentalImpactAssessments,designed to determine feasibility of any strategy that requires diversionand/orreductionofCreekflows.
If a responsible jurisdiction or agency is requesting a longer schedule for wet-weather compliance based on an integrated approach, the plan must include a clear demonstration that the planmeetsthecriteriaofanIWRA,andacleardemonstrationof the need for the proposed schedule. Compliance with the wet-weather allocations shall be as soon as possible but under no circumstances shall it exceed the time frame adopted in the TMDL for non-integrated approaches or for an integrated approach.

Basin Plan 7-25� Total Maximum Daily LoadsUpdated September 20��
Date Action21/2 years after the effective date of the TMDL (continued)
The draft Plan shall be made available for public comment and theExecutiveOfficershallacceptpubliccommentsforatleast30days.
3 months after receipt of Regional Board comments on the draft plan
Responsible jurisdictions and agencies submit a Final Implementation Plan to the Regional Board.
Responsible agencies for Load Allocations1 year after the effective date of the TMDL
Responsible agencies must submit, for Regional Board approval, separate comprehensive bacteria water quality monitoring plans for inputs from Del Rey Lagoon and the Ballona Wetlands to the Ballona Estuary. Each plan must be approved by the Executive Officerbefore themonitoringdatacanbeconsideredduring theimplementation of the TMDL. The plan must provide for analyses of all applicable bacteria indicators for which the Basin Plan and subsequent amendments have established objectives The plan must also include a minimum of one sampling location at the connecting tide gate(s).
The draft monitoring reports shall be made available for public commentandtheExecutiveOfficershallacceptpubliccommentsfor at least 30 days. Once a coordinated monitoring plan is approvedbytheExecutiveOfficer,monitoringshallcommencewithin 6 months.
3 years after the effective date of the TMDL
If the responsible agency for the Del Rey Lagoon intends to pursue a natural source exclusion, it shall submit the results of separate natural source study for theLagoon to theExecutiveOfficer ofthe Regional Board. The study shall include a comprehensive assessment of all sources of bacteria loads to the Lagoon and estimates of their individual contributions. In addition, a determination of the number of exceedance days caused by these sources should be made.
These studies shall be made available for public comment and theExecutiveOfficershallacceptpubliccommentsforatleast30days.

Basin Plan 7-252 Total Maximum Daily LoadsUpdated September 20��
Date ActionResponsible Agencies for WLAs and LAs* (*Only if not eligible for natural source exclusion(s)
4 years after the effective date ofthe TMDL
The Regional Board shall reconsider this TMDL to:(1) Re-assess the allowable winter dry-weather and wet-weather
exceedance days based on a re-evaluation of the selected reference watershed and consideration of other reference watersheds that may better represent reaches of Ballona Creek and Estuary,
(2) Consider whether the allowable winter dry-weather and wet-weather exceedance days should be adjusted annually dependent on the rainfall conditions and an evaluation of natural variability in exceedance levels in the reference system(s),
(3) Re-evaluate the reference year used in the calculation of allowable exceedance days, and
(4) Re-evaluatewhetherthereisaneedforfurtherclarificationorrevision of the geometric mean implementation provision.
(5) Consider natural source exclusions for bacteria loading from Del Rey Lagoon and the Ballona Wetlands based on results of thesourceidentificationstudy.
(6) Re-assessWLAsforBenedictCanyonChannel,SepulvedaChannel, and Centinela Creek based on results of the required compliancemonitoring,and/oranyvoluntarybeneficialuseinvestigations.
6 years after the effective date of the TMDL:
Achieve compliance with the allowable exceedance days forsummer and winter dry-weather as set forth in Table 6-1 and rolling 30-day geometric mean targets.
10 years after effective date of the TMDL or, if an Integrated WaterResourcesApproachisimplemented, up to July 15, 2021.*
Achieve compliancewith the allowable exceedance days as setforth in Table 6-1 and rolling 30-day geometric mean targets during wet-weather.
*July15,2021isthefinalcompliancedateoftheSantaMonicaBayBeachesBacteriaWet-WeatherTMDL.

Basin Plan 7-25� Total Maximum Daily LoadsUpdated September 20��
7-22 Calleguas Creek Watershed Salts TMDL
This TMDL was adopted by:TheRegionalWaterQualityControlBoardonOctober4,2007.
This TMDL was approved by:The State Water Resources Control Board on May 20, 2008.TheOfficeofAdministrativeLawonNovember6,2008.TheU.S.EnvironmentalProtectionAgencyonDecember2,2008.
The effective date of this TMDL is: December 2, 2008.
TheelementsoftheTMDLarepresentedinTable7-22.1andtheImplementationPlaninTable7-22.2
Table 7-22.1. Calleguas Creek Watershed Salts TMDL: Elements
TMDL Element Key Findings and Regulatory Provisions
Problem Statement ElevenoffourteenreachesintheCalleguasCreekWatershed(CCW)areidentifiedonthe2002CleanWaterActSection303(d)listofwater-qualitylimitedsegmentsasimpaired due to elevated levels of boron, chloride, sulfate, or total dissolved solids (TDS) (these constitutions are commonly referred to as salts). Salts primarily impact twobeneficialuses:agriculturalsupplyandgroundwaterrecharge.Belowis2002303(d) list of water quality limited segments of the Calleguas Creek watershed:
Reach Name Pollutant/StressorCalleguas Creek Reach 3 Chloride, TDSCalleguas Creek Reach 6 Chloride, Sulfate, TDSCalleguasCreekReach7 Boron, Chloride, Sulfate, TDSCalleguas Creek Reach 8 Boron, Chloride, Sulfate, TDSCalleguascreekReach9A Sulfate, TDSCalleguas Creek Reach 9B Chloride, Sulfate, TDSCalleguas Creek Reach 10 Chloride, Sulfate, TDSCalleguas Creek Reach 11 Sulfate, TDSCalleguas Creek Reach 12 Sulfate, TDSCalleguas Creek Reach 13 Chloride, Sulfate, TDS
The list of impaired segments of the Calleguas Creek watershed in the 2002 303(d) list was maintained in the 2006 303(d) list.
ThesegmentofReach4belowLagunaRoadistidallyinfluencedandthereforenotimpaired for chloride, boron, sulfate, and TDS. Consequently, the waste load and loadallocationsdevelopedforReach4inthisTMDLdonotapplybelowLagunaRoad.
The goal of this TMDL is to protect and restore the water quality in the Calleguas Creek watershed by controlling the loading and accumulation of salts.

Basin Plan 7-254 Total Maximum Daily LoadsUpdated September 20��
TMDL Element Key Findings and Regulatory Provisions
Numeric Targets Numerictargetsarebasedonthesite-specificnumericwaterqualityobjectives(WQOs) provided in the Basin Plan.
1. Surface Water Quality Objectives
Site-specificsurfacewaterqualityobjectivesfortheCalleguasCreekwatershedareapplicableupstreamofPotreroRoad.Sitespecificobjectiveshave not been determined for Calleguas Creek below Potrero Road because thereachistidallyinfluenced.BelowareWQOsforCalleguasCreekupstreamof Potrero Road.
ConstituentWater Quality Objective Upstream Potrero Road
(mg/L)Boron 1Chloride 150Sulfate 250TDS 850
2. GroundwaterQualityObjectives
Groundwater Basin1
Boron(mg/L)
Chloride(mg/L)
Sulfate(mg/L)
TDS(mg/L)
DWR Basin No.
Groundwater Basin as Listed in the 1994
Basin Plan
Implementation Areas for Salts
TMDL
4-6 Pleasant Valley Conejo and Calleguas/Pleasant Valley
1.0 150 300 700
4-7 ArroyoSantaRosaArroyoSantaRosaandConejo/ArroyoSanta Rosa
1.0 150 300 900
4-8Las Posas Valley – East ofGrimesCanyonandHitch Blvd
ArroyoSimi/SouthLas Posas 3.0 400 1200 2500
4-8
Las Posas Valley –SouthofLAAvebetween Somis Rd & Hitch Blvd
ArroyoLasPosas/South Las Posas 1.0 250 700 1500
4-8 Las Posas Valley –NorthLasPosasArea
ArroyoLasPosas/North Las Posas 1.0 150 250 500
4-9 Simi Valley ArroyoSimi/SimiValley 1.0 150 600 1200
4-10 Conejo Valley ArroyoConejo/Conejo Valley 1.0 150 250 800
4-15 Tierra Rejada ArroyoSantaRosa/Tierra Rejada 0.5 100 250 700
4-19 Thousand Oaks ArroyoConejo/Thousand Oaks 1.0 150 700 1400
1 Thegroundwaterqualityobjectivesspecifiedinthistableareequivalenttothegroundwaterqualityobjectivesinthe1994BasinPlan.GroundwaterbasinsarenumberedinthefirstcolumnaccordingtoBulletin118-80(DepartmentofWaterResources,1980).Designatedgroundwaterbasinsinthe1994BasinPlanarespecifiedinthe second column and groundwater basin descriptions of Calleguas Creek used in this TMDL are listed in the
third column of the table.

Basin Plan 7-255 Total Maximum Daily LoadsUpdated September 20��
TMDL Element Key Findings and Regulatory Provisions
Source Analysis Sources of salts in the watershed include water supply (water imported from the State Water Project or Freeman Diversion and deep aquifer groundwater pumping), water softeners that discharge to publicly owned treatment works (POTWs), POTW treatment chemicals, atmospheric deposition, pesticides and fertilizers, and indoor water use (chemicals, cleansers, food, etc.). These salts are then transported through POTW discharges and runoff to surface water, shallow groundwater, and/or stranded on the watershed in the soils. Salts transported in the surface water to the ocean are currently the only salts that are exported from the watershed. While the concentration of salts in the introduced water is usually below the Basin Plan Objectives,thequantityofwaterbroughtintothewatershedissufficienttorankintroduced water as the greatest source of salts to the watershed.
Saltsthataretransportedduringdryweathertothesurfacewaterarequantifiedviathefollowingmechanisms:groundwaterpumping,groundwaterexfiltration,POTWs, dry weather urban and agricultural runoff. Wet weather loadings from eachofthesesourceshavethepotentialtobesignificant,buttendtobelowerinconcentration and do not occur during the critical conditions for salts. Wet weather loadsaresignificantfromtheperspectiveoftransportingstrandedsaltsoffthewatershed.
Linkage Analysis The linkage analysis for salts focuses on the surface water concentrations of salts. However, surface water concentrations are only one component of the watershed saltsissue.Becauseitisdifficulttomodelotheraspectsofthesaltproblem(i.e.surfacewaterandgroundwaterinteractions,strandedsalts),twosimplifiedapproaches have been used to demonstrate that salts will be removed from the watershed, which should have a correspondingly positive impact on surface water and groundwater salts concentrations. First, a surface water model was developed to provide a linkage between sources and surface water quality and to demonstrate the impact of projects on receiving water quality in the watershed. Second, a salt balance was developed to quantify the removal of salts from the watershed with the goal of achieving a mass balance in which the mass of boron, sulfate, TDS and chloride imported into Calleguas Creek subwatersheds is no more than the mass of boron, sulfate, TDS and chloride exported from the Calleguas Creek subwatershed. Achievingasaltbalanceinthewatershedwillpreventadditionalbuild-upofsaltsin any medium in the watershed and protect ground water supplies from increasing in salt concentrations.
The Calleguas Creek Modeling System is a mass balance based model that was developed for the surface water to provide a linkage between sources and surface water quality. To estimate the salts balance in the watershed, a simple chloride mass balance was developed by the Camrosa Water District (Hajas, 2003a) and modifiedtoaddresstheothersalts.

Basin Plan 7-256 Total Maximum Daily LoadsUpdated September 20��
TMDL Element Key Findings and Regulatory Provisions
Waste Load Allocations
A. POTWs
TheTMDLincludeswasteloadallocations(WLAs)forfivePOTWsintheCalleguas Creek watershed: Simi Valley Water Quality Control Plant (WQCP), Hill Canyon Wastewater Treatment Plan (WWTP), Moorpark WWTP, Camarillo Water Reclamation Plant (WRP), and Camrosa Water Reclamation Facility (WRF).Attheendoftheimplementationperiod,onlySimiValleyWQCPandthe Hill Canyon WWTP are expected to discharge to surface waters. Moorpark WWTP and Camrosa WRF currently discharge directly to ponds under dry weatherconditions.AspartoftheTMDLimplementation,theRenewableWaterResources Management Program (RWRMP) will introduce treated wastewater from the Camarillo WRP into the Camrosa recycled water storage and distribution system. Surplus treated wastewater from Camarillo WRP and Camrosa WRF will be discharged at a point downstream of Potrero Road Bridge to Calleguas Creek. DryweatherWLAsareincludedforthecasewhenCamarilloWRP,CamrosaWRF,and Moorpark WWTP need to discharge to the stream (for example, if there is insufficientrecycledwaterdemandduringthewetseason).IncludingWLAsforthese POTWs ensures that water quality objectives are not exceeded as a result of their discharge.
POTWmass-basedWLAsarecalculatedasthePOTWeffluentflowratemultipliedbythewaterqualityobjectiveandincludeamass-basedadjustmentfactor(AF)thatissubtractedfromtheproductoftheflow-rateandthewaterqualityobjective.The adjustment factor is used to link POTW allocations to the required reductions in background loads. The adjustment factors are implemented through mechanisms that export salts out of the subwatershed, such as groundwater pumping, to meet the salt balance requirements. To ensure that the loading capacity is achieved in surface water and the reductions in background loads are achieved, minimum saltexportsshownbelowarerequiredforPOTWsandareincludedinWLAsasa component of the adjustment factors. If the background load reductions are not achieved, POTWs shall be responsible for providing additional load reductions to achievewaterqualitystandards.TheAFissetequaltothedifferencebetweentheminimum salts export requirement to attain a salt balance in the subject reaches and the actual salts export. If the calculated annual dry weather salt exports from the subwatershed to which the POTW discharges are less than the minimum required exports for the previous year and the annual average receiving water concentration at the base of the subwatershed to which the POTW discharges exceeds water quality objectives for the previous year, the POTW allocations will be reduced using the adjustment factor.

Basin Plan 7-257 Total Maximum Daily LoadsUpdated September 20��
TMDL Element Key Findings and Regulatory Provisions
Waste Load Allocations (continued)
The adjustment factors are also used to address unusual conditions in which the inputs to the POTWs from the water supply may challenge the POTWs ability to meettheassignedWLAs.TheadjustmentfactorallowsfortheadditionalPOTWloading only when the water quality objectives are met in the receiving waters. POTW allocations can be adjusted upwards when imported water supply chloride concentrationsexceed80mg/LanddischargesfromthePOTWexceedtheWLA.InordertoapplytheAFtotheassignedWLAs,thePOTWisrequiredtosubmitdocumentation of the water supply chloride concentrations, receiving water chlorideconcentration,theeffluentmass,andevidenceofincreasedsaltexportstooffset the increased discharges from the POTW to the RWQCB for approval.
WLAsshownintablebelowapplytoPOTWSduringdryweatherwhentheflowsin the receiving water are below the 86thpercentileflow.Duringwetweather,theloadingcapacityofthestreamissignificantlyincreasedbystormwaterflowswithverylowsaltconcentrations.AnydischargesfromthePOTWsduringwetweatherwouldbeassimilatedbytheselargestormflowsandwouldnotcauseexceedancesof water quality objectives.
Boron is only listed in the Simi and Pleasant Valley (Revolon) subwatersheds and exceedances of boron do not occur in other portions of the watershed. Therefore, boron allocations are only included for the Simi Valley WQCP.
Interim limits are included to allow time for dischargers to put in place implementationmeasuresnecessarytoachievefinalwasteloadallocations.Themonthly average interim limits are set equal to the 95th percentile of available discharge data.
1. Minimum Salt Export Requirements for Adjustment Factor a
POTWMinimum
Chloride Export (lb/day)
Minimum TDS Export (lb/day)
Minimum Sulfate Export
(lb/day)
Minimum Boron Export
(lb/day)Simi Valley WQCP 460 3220 9120 3.3
Moorpark WWTP 460 3220 9120 3.3Hill Canyon WWTP 1060 7920 4610 0
Camrosa WRF 1060 7920 4610 0Camarillo WRP 1060 7920 4610 0
a Minimum export requirements include a 10% Margin of Safety.

Basin Plan 7-258 Total Maximum Daily LoadsUpdated September 20��
TMDL Element Key Findings and Regulatory Provisions
Waste Load Allocations (continued)
2. Interim Monthly Average WLAs for POTWs
POTW Chloride (mg/L)
TDS (mg/L)
Sulfate (mg/L)
Boron (mg/L)
Simi Valley WQCP 183 955 298 N/AHill Canyon WWTP 189 N/A N/A N/AMoorpark WWTP 171 N/A 267 N/ACamarillo WRP 216 1012 283 N/ACamrosa WRF* N/A N/A N/A N/A
* Camrosa WRF has not discharged to surface water during the period under which interim limitswerecalculated.Wheneffluentdataareavailable,theRegionalBoardmayadoptinterimWLAsforCamrosaWRF.
N/A:The95th percentile concentration is below the Basin Plan objective so interim limits are not necessary.
3. Final WLAs for POTWsa,d
POTW Chloride (lb/day) c
TDS (lb/day) c
Sulfate (lb/day) c
Boron (lb/day) c
Simi Valley WQCP
150*Q-AF 850*Q-AF 250*Q-AF 1.0*Q-AF
Hill Canyon WWTP
150*Q-AF 850*Q-AF 250*Q-AF N/A
Moorpark WWTPb
150*Q-AF 850*Q-AF 250*Q-AF N/A
Camarillo WRPb 150*Q-AF 850*Q-AF 250*Q-AF N/ACamrosa WRFb 150*Q-AF 850*Q-AF 250*Q-AF N/A
a.Theallocationsshownonlyapplyduringdryweather(asdefinedinthisTMDL).During wet weather discharges from the POTWs do not cause exceedances of water quality objectives.b. These POTWs are not expected to discharge after the end of the implementation period. c.AFistheadjustmentfactorandequalsthedifferencebetweentheminimumsaltsexport requirement and the actual salts export. d.QrepresentsthePOTWflowatthetimethewaterqualitymeasurementiscollectedandaconversionfactortolb/daybasedontheunitsofmeasurementfortheflow.N/ABoronisnotlistedinthereachestowhichthePOTWdischarges.NoWLAisrequired.
B. Urban Runoff
Permitted stormwater dischargers that are responsible parties to this TMDL includetheMunicipalStormwaterDischargers(MS4s)oftheCitiesofCamarillo,Moorpark, Thousand Oaks, County of Ventura, Ventura County Watershed Protection District, and general industrial and construction permittees. Permitted stormwater dischargers are assigned a dry weather wasteload allocation equal to the averagedryweathercriticalconditionflowratemultipliedbythenumerictargetforeach constituent. Waste load allocations apply in the receiving water at the base ofeachsubwatershed.Becausewetweatherflowstransportalargemassofsaltsat low concentrations, these dischargers meet water quality objectives during wet weather.Dryweatherallocationsapplywheninstreamflowratesarebelowthe86th percentileflowandtherehasbeennomeasurableprecipitationintheprevious24hours.

Basin Plan 7-259 Total Maximum Daily LoadsUpdated September 20��
TMDL Element Key Findings and Regulatory Provisions
Waste Load Allocations (continued)
Interim limits are assigned for dry weather discharges from areas covered by NPDES stormwater permits to allow time to implement appropriate actions. The interim limits are assigned as concentration based receiving water limits set to the 95th percentile of the discharger data as a monthly average limit except for chloride. The 95thpercentile forchloridewas267mg/Lwhich ishigher than the recommendedcriteriasetforthintheBasinPlanforprotectionofsensitivebeneficialusesincludingaquatic life. Therefore, the interim limit for chloride for Permitted Stormwater Dischargersissetequalto230mg/Ltoensureprotectionofsensitivebeneficialusesin the Calleguas Creek watershed.
1. Interim Dry Weather WLAs for Permitted Stormwater Dischargers
Constituent Interim Limit (mg/L)Boron Total 1.3Chloride Total 230Sulfate Total 1289TDS Total 1720
2. Final Dry Weather WLAs for Permitted Stormwater Dischargers
Subwatershed
Critical Condition Flow Rate
(mgd)
Chloride Allocation
(lb/day)
TDS Allocation
(lb/day)
Sulfate Allocation
(lb/day)
Boron Allocation
(lb/day)
Simi 1.39 1,738 9,849 2,897 12Las Posas 0.13 157 887 261 N/AConejo 1.26 1,576 8,931 2,627 N/ACamarillo 0.06 72 406 119 N/APleasant Valley (Calleguas)
0.12 150 850 250 N/A
Pleasant Valley (Revolon)
0.25 314 1,778 523 2
C. Final WLAs for Other NPDES Dischargers
Concentration-based WLAs are assigned at the Basin Plan objectives for otherNPDES dischargers.
Constituent Allocation (mg/L)Chloride 150TDS 850Sulfate 250Borona 1.0

Basin Plan 7-260 Total Maximum Daily LoadsUpdated September 20��
TMDL Element Key Findings and Regulatory Provisions
Waste Load Allocations (continued)
Other NPDES dischargers include, but are not limited to, permitted groundwater cleanup projects that could have significant salt concentrations as a result of thestranded salts in the shallow groundwater basins being treated. To facilitate the cleanup of the basins prior to alternative discharge methods (such as the brine line) being available, interim limits for other NPDES dischargers will be developed on a case-by-case basis and calculated as a monthly average using the 95th percentile of available discharge data.
Load Allocations Dry weather load allocations are assigned as a group allocation to irrigated agriculturaldischarges.Theloadallocation(LA)isequaltotheaveragedryweathercriticalconditionflowratemultipliedbythenumerictargetforeachconstituent. Load allocations apply in the receiving water at the base of each subwatershed.Becausewetweatherflowstransportalargemassofsaltsatatypically low concentration, these dischargers should meet water quality objectives duringwetweather.Dryweatherallocationsapplywheninstreamflowratesarebelow the 86thpercentileflowandtherehasbeennomeasurableprecipitationintheprevious24hours.
Interim limits are assigned for dry weather discharges from irrigated agricultural areas to allow time to implement appropriate actions. The interim limits are assigned as concentration based receiving water limits set to the 95th percentile of the discharger data as a monthly average limit except for chloride. The 95th percentileforchloridewas499mg/LwhichishigherthantherecommendedcriteriasetforthintheBasinPlanforprotectionofsensitivebeneficialusesincluding aquatic life. Therefore, the interim limit for chloride for Irrigated AgriculturalDischargersissetequalto230mg/LtoensureprotectionofsensitivebeneficialusesintheCalleguasCreekwatershed.
I. Interims Load Allocations for Irrigated Agricultural Dischargers
Constituent Interim Limit (mg/L)Boron Total 1.8Chloride Total 230Sulfate Total 1962TDS Total 3995
II. Final Load Allocations for Irrigated Agricultural Dischargers
SubwatershedChloride
Allocation (lb/day)
TDS Allocation
(lb/day)
Sulfate Allocation
(lb/day)
Boron Allocation
(lb/day)Simi 641 3,631 1,068 4Las Posas 2,109 11,952 3,515 N/AConejo 743 4,212 1,239 N/ACamarillo 59 336 99 N/APleasant Valley 305 1,730 509 N/ARevolon 7,238 41,015 12,063 48

Basin Plan 7-26� Total Maximum Daily LoadsUpdated September 20��
TMDL Element Key Findings and Regulatory Provisions
Margin of Safety Amarginofsafety(MOS)fortheTMDLisdesignedtoaddressuncertaintiesinthe analysis that could result in targets not being achieved in the waterbodies. The primary uncertainties associated with this TMDL include the impact of implementing a salt balance on receiving water quality. The effect of the salt balance is estimated by the mass-balance and subject to the following uncertainties: 1)theflowratesusedtodeterminetheloadingcapacitymaychangeduetoTMDLimplementation, 2) the use of a daily load for determining allocations and an annual mass balance to attain water quality objectives, and 3) the sources of salts may not be completely known. Both implicit and explicit MOS are included for this TMDL. The implicit MOS stems from the use of conservative assumptions made during development of the TMDL. The mass of salts transported out of the watershed during wet weather is on average over 15% of the annual mass of salts introduced to the watershed for all constituents. The salt export during wet weather rangesfrom7%to41%forTDS,9%to48%forchloride,and13%to89%forsulfate of the export required to meet a salt balance in the watershed. This mass is notusedtodeterminecompliancewiththesaltbalanceandrepresentsasignificantimplicit margin of safety. The model also contains a component that serves to model the impact of “stranded” salts in the watershed. The component assumes lowirrigationefficienciesandtheabilityofallsaltsappliedasirrigationwateranywhere in the watershed to be discharged to receiving water in critical years. This likely overestimates the impact of “stranded” salts and results in a higher concentration of salts due to irrigation in the receiving water.
AnexplicitMOSof10%isappliedtotheadjustmentfactorsforthePOTWstoaccount for the uncertainties in the TMDL analysis. By applying the margin of safety to the adjustment factor, more salts are required to be exported than are necessary to offset the background loads in the watershed. This additional salt export provides a margin of safety on the salt balance to address uncertainties that the salt balance will result in compliance with water quality objectives. The 10% explicitMOSisdeterminedsufficienttoaddresstheuncertaintiesassociatedwiththe estimated impact of the salt balance on receiving water loadings.
Future Growth VenturaCountyaccountsforslightlymorethan2%ofthestate’sresidentswithapopulationof753,197(USCensusBureau,2000).GISanalysisofthe2000censusdatayieldsapopulationestimateof334,000fortheCCW,whichequalsabout44%ofthecountypopulation.AccordingtotheSouthernCaliforniaAssociationofGovernments(SCAG),growthinVenturaCountyaveragedabout51%perdecadefrom1900-2000;withgrowthexceeding70%inthe1920s,1950s,and1960s.Significantpopulationgrowthisexpectedtooccurwithinandnearpresentcitylimits until at least 2020. Increased growth requires additional water. Therefore, future growth could result in increased loads of salts being imported into the watershed. However, the TMDL implementation plan is designed to maintain a salts balance in the watershed. If additional salts are imported into the watershed, a larger volume of salts will also be exported out of the watershed to maintain the balance. Consequently, increased imports from future growth are not expected to result in higher concentrations in receiving waters.

Basin Plan 7-262 Total Maximum Daily LoadsUpdated September 20��
TMDL Element Key Findings and Regulatory Provisions
Seasonal Variations and Critical Conditions
The critical condition for salts is during dry weather periods. During wet weather, stormwaterflowsdilutethesaltdischargesandreceivingwaterconcentrationsaresignificantlylowerthanwaterqualityobjectives.Dryweather,definedasdayswithflowslowerthanthe86thpercentileflowandnomeasurableprecipitation,isacriticalconditionregardlessofthedryweatherflowsinthestream.Thedrivingconditions for exceedances of water quality objectives are the concentrations in the water supply (which is driven by surface water concentrations in Northern California)andthepreviousyear’sannualprecipitationandcorrespondingflows.Elevated salts concentrations during dry weather occur when stranded salts are discharged into the surface water after higher than average rainfall years. The elevatedconcentrationsoccurduringyearswhenthepreviousannualflowisgreaterthanthe75thpercentileoftheannualflowsforthewatershed(criticalyear).The higher concentrations occur during the dry periods of critical years regardless ofwhethertheannualflowforthecriticalyearisanaverageflowyear,higherthanaverage year, or lower than average year. The key parameter determining a critical yearisthetotalannualflowvolumeforthepreviousyear.Basedonmodelresults,fourcriticalyearsweredefinedbasedonmodeledresultsthatresultedinreceivingwater concentrations greater than the 99th percentile concentration during at least 10%ofthedryperiod.Thecriticalyearsidentifiedfromthemodeloccurwithconditionssimilartowhatoccurredin1978,1979,1983and1998.
Special Studies and Monitoring Plan
Special Studies
Several special studies are planned to improve understanding of key aspects related toachievementofWLAsandLAsfortheSaltsTMDL.
1. Special Study #1 (Optional) – Develop Averaging Periods and Compliance Points
The TMDL technical report has provided information that shows instantaneous salts objectives may not be required to protect groundwater recharge and agriculturalbeneficialuses.Itispossiblethatthebeneficialuseswillbeprotectedand a salt balance achieved without achieving instantaneous water quality objectives in all reaches of the watershed. This optional special study is included to allow an investigation of averaging periods for the salts objectives in the CCW. Additionally,thisstudywillinvestigatethelocationsofbeneficialusesandthepossibility of identifying compliance points for the salts objectives at the point ofbeneficialuseimpacts.Theuseofcompliancepointswouldalleviatetheneedtodevelopsite-specificobjectivesforthereachesofthewatershedupstreamofthe POTW discharges (described in Special Study #3) while still ensuring the protectionofbeneficialuses.Sensitivebeneficialusesarenotpresentintheupper reaches and POTW discharges dilute the salts from the upper reaches and may allow compliance with the objectives at the point of groundwater recharge downstream. This is an optional special study to be conducted if desired by the stakeholdersordeterminednecessaryorappropriatebytheExecutiveOfficer.

Basin Plan 7-26� Total Maximum Daily LoadsUpdated September 20��
TMDL Element Key Findings and Regulatory Provisions
Special Studies and Monitoring Plan(continued)
2. Special Study #2 (Optional) – Develop Natural Background Exclusion
Discharges of groundwater from upstream of the Simi Valley WQCP (Reaches 7and8)andHillCanyonWWTP(Reaches12and13)anddownstreamoftheCamrosa WRF (Reach 3) contain high salts concentrations. Natural marine sediments may contribute to the high concentrations in those discharges. This special study would evaluate whether or not the groundwater discharges in these areas would qualify for a natural sources exclusion. The special study could followa‘referencesystem/anti-degradationapproach’and/ora‘naturalsourcesexclusionapproach’foranyallocationsincludedinthisTMDLthatareprovenunattainable due to the magnitude of natural sources. The purpose of a ‘reference system/anti-degradationapproach’istoensurewaterqualityisatleastasgoodasan appropriate reference site and no degradation of existing water quality occurs where existing water quality is better than that of a reference site. The intention of a‘naturalsourcesexclusionapproach’istoensurethatallanthropogenicsourcesof salts are controlled such that they do not cause exceedances of water quality objectives. These approaches are consistent with state and federal anti-degradation policies(StateBoardResolutionNo.68-16and40C.F.R.131.12).Thisisanoptional special study to be conducted if desired by the stakeholders or determined necessaryforestablishinganaturalsourcesexclusionbytheExecutiveOfficer.
3. Special Study #3 (Optional) – Develop Site-Specific Objectives
The TMDL implementation plan provides for actions to protect the agricultural andgroundwaterrechargebeneficialusesintheCCW.Asshowninthelinkageanalysis, some downstream reaches may not achieve the water quality objectives through implementation of this TMDL because of the transport of salts out of the watershed through those reaches. Consequently, an optional special study is includedtoallowtheCCWstakeholderstopursuedevelopmentofsite-specificobjectives for salts for reaches upstream of the Hill Canyon WWTP and Simi ValleyWQCP(Reaches7,8,12,and13),CalleguasCreekReach3,RevolonSlough(Reach4)andBeardsleyWash(Reach5).Thesealternativenumericwaterqualityobjectiveswouldbedevelopedbasedonthebeneficialusestobeprotectedin a reach and the attainability of the current water quality objectives. This is an optional special study to be conducted if desired by the stakeholders or determined necessaryorappropriatebytheExecutiveOfficer.
4. Special Study #4 (Optional) – Develop Site-Specific Objectives for Drought Conditions
During drought conditions, the load of salts into the watershed increases as a result of increasing concentrations in imported water. Stakeholders in the CCW cannot control the increased mass entering the watershed from the water supply. However, the stakeholders do have the ability to manage the salts within the watershed to protectbeneficialusesandexporttheadditionalmassofsaltsoutofthewatershed.

Basin Plan 7-264 Total Maximum Daily LoadsUpdated September 20��
TMDL Element Key Findings and Regulatory Provisions
Special Studies and Monitoring Plan (continued)
Ifnecessary,site-specificobjectivesmaybedevelopedtoaddresssituationsthatresult in higher imported water salt concentrations to allow management of the saltsandprotectionofbeneficialuses.ThisspecialstudymaybecombinedwithSpecial Study #3 if desired.
This is an optional special study to be conducted if desired by the stakeholders ordeterminednecessaryorappropriatebytheExecutiveOfficeroftheRegionalBoard.
5. Special Study #5 (Optional) – Develop Site-Specific Objectives for Sulfate
Sulfate is a necessary nutrient for plant growth and sulfate containing products are oftenappliedtoagricultureasfertilizersandpesticides.Therefore,site-specificobjectives may be investigated and developed for sulfate that more accurately protectsagriculturalsupplybeneficialuses.Additionally,thisstudycouldevaluatewhether or not a sulfate balance is necessary to maintain in the watershed. This specialstudymaybecombinedwithSpecialStudy#3and/or#4ifdesired.This is an optional special study to be conducted if desired by the stakeholders ordeterminednecessaryorappropriatebytheExecutiveOfficeroftheRegionalBoard.
Monitoring Plan
To ensure that the goal of a salts balance in the watershed is being achieved and water quality objectives are being met, a comprehensive method of tracking inputsandoutputstothewatershedwillbedeveloped.AmonitoringplanwillbesubmittedtotheRWQCBforExecutiveOfficerapprovalwithinsixmonthsofthe effective date of the CCW Salts TMDL. Monitoring will begin one year after ExecutiveOfficerapprovalofthemonitoringplantoallowtimefortheinstallationof automated monitoring equipment.
1. Input Tracking
Inputs to the watershed are tracked through four mechanisms:1) Information on the import of State Water Project water is readily available and provides information onthemassofsaltsbroughtintothewatershed;2)Groundwaterpumpingrecordsprovide information on the mass of salts imported into the watershed from deep aquifer pumping; 3) Import records of water supply form the Santa Clara River canbeobtainedtodeterminethemassofsaltsimportedthroughthissource;4)Monitoring data on imported water quality can be compared to monitoring of effluentqualitytoestimatetheamountofsaltsaddedthroughhumanuseofthewater.

Basin Plan 7-265 Total Maximum Daily LoadsUpdated September 20��
TMDL Element Key Findings and Regulatory Provisions
Special Studies and Monitoring Plan (continued)
2. Output Tracking and Determining Compliance with Water Quality Objectives
Outputs from the watershed will be tracked through surface water monitoring at key locations in the watershed and monitoring of discharges to the brine line. Monitoringwillincludebothflowandquality.Compliancewithwaterqualityobjectiveswillbedeterminedatkeylocationswherebeneficialusesoccurinthewatershed. The stations used for output tracking will also be used to determine compliance with water quality objectives. The monitoring program will determine iftheTMDLcompliancepointsareprotectiveofthebeneficialusesforthesubwatershed. If the monitoring determines that the compliance points are not protectiveofbeneficialuses,analternativecompliancepointwillbeselected.TheExecutiveOfficermayrevisetheTMDLcompliancepointbasedontheresultofthemonitoring.Additionally,ifotherplacesinthewatershedareidentifiedwheresensitivebeneficialusesoccur,waterqualitymonitoringstationscanbeadded to determine compliance with water quality objectives. For the RWRMP, threeneworupgradedautomatedflowmeasuringandsamplecollectionstationswillbeinstalledatthreepointsonthestreamsystemtocontinuouslyrecordflowand various water quality parameters during dry weather. Preliminary monitoring locationsincludeArroyoConejoinHillCanyon,ConejoCreekatBaronBrothersNursery and Calleguas Creek at University Drive. For the NRRWMP, one new or upgradedautomatedflowmeasuringandsamplecollectionstationwillbeaddeddownstreamofSimiValleyatthepointatwhichgroundwaterrechargebegins.ApreliminarymonitoringlocationisatHitchBlvd.whereanexistingflowgaugingstation exists. However, the amount of groundwater recharge upstream of this site will need to be evaluated to determine the exact monitoring location. For Revolon Slough, the existing monitoring station at Wood Road. will be used to monitor qualityandflowonRevolonSloughtodeterminetheoutputsfromtheRevolonportion of the Pleasant Valley subwatershed.
Additionallandusemonitoringwillbeconductedconcurrentlyatrepresentativeagricultural and urban runoff discharge sites as well as at POTWs in each of the subwatersheds and analyzed for chloride, TDS, sulfate, and boron. The location of the land use stations will be determined before initiation of the Calleguas Creek WatershedTMDLMonitoringProgram(CCWTMP).Alleffortswillbemadetoinclude at least two wet weather sampling events during the wet season (October throughApril)duringatargetedstormevent.
3. Reporting and Modification of the Calleguas Creek Watershed TMDL Monitoring Program
Amonitoringreportwillbepreparedannuallywithinsixmonthsaftercompletionofthefinaleventofthesamplingyear.Anadaptivemanagementapproachtothe CCWTMP will be adopted as it may be necessary to modify aspects of the CCWTMP. Results of sampling carried out through the CCWTMP and other programs within the CCW may be used to modify this plan, as appropriate. These modificationswillbesummarizedintheannualreport.Possiblemodificationscould include, but are not limited to the, following:

Basin Plan 7-266 Total Maximum Daily LoadsUpdated September 20��
TMDL Element Key Findings and Regulatory Provisions
Special Studies and Monitoring Plan (continued)
The inclusion of additional land use stations to accurately characterize loadings;
The removal of land use stations if it is determined they are duplicative (i.e., a land use site in one subwatershed accurately characterize the land use in other subwatersheds);
The inclusion of additional in-stream sampling stations; and Theeliminationofanalysisforconstituentsnolongeridentifiedinlanduse
and/or instream samples.
If a coordinated and comprehensive monitoring plan is developed and meets the goals of this monitoring plan that plan should be considered as a replacement for the CCWTMP.
4. Other Monitoring
Other surface water and groundwater monitoring will be implemented as necessary to assess the impacts of the implementation actions and adjust the activities as necessarytoprotectbeneficialusesandachievethesaltsbalance.Examplesofadditional monitoring that may be conducted include: Monitoring under Phase 2 and 3 of the RWRMP to evaluate the effects of
replenishment water releases and groundwater treatment and releases. Monitoring to assess the impacts of management of the Simi Basin
groundwater dewatering wells under Phase 1 of the NRRWMP.
Implementation Plan
TheidentifiedimplementationactionsprovidedinthisTMDLwillresultinasaltbalance in the stream and are expected to result in compliance with the allocations. The implementation plan is comprised of actions that directly impact discharges to the receiving water and actions that will indirectly impact discharges to receiving water. Responsible agencies and jurisdictions shall consider minimum flowrequirementsthatmaybeimposedbyfederalorstateregulatoryagencieswhen implementing actions to comply with this TMDL. Should the proposed implementationactionsnotresultincompliancewithobjectivesandsite-specificobjective are not adopted, additional implementation actions may be required to achievethewaterqualityobjectives.Anyplansorprogramsforimplementationof the TMDL for the Southern Reaches of the CCW upstream of the Conejo Creek DiversionandtheNorthernReachesoftheCCW,thatwouldresultinsignificantreductionininstreamflow,includingbutnotlimitedto,anapplicationforWaterReclamation Requirements (WRRs) shall include an analysis of potential impacts toinstreambeneficialusesthatcouldresultfromthereclamationofwastewateror extracted groundwater. For Phase 1 of the Southern Reaches of the CCW Renewable Water Resource Management Program (RWRMP), Water Rights Decision1638fromSWRCBsatisfiestheserequirementsandestablishestheminimumflowrequirementsforConejoandCalleguasCreekdownstreamoftheConejo Creek Diversion Project.

Basin Plan 7-267 Total Maximum Daily LoadsUpdated September 20��
TMDL Element Key Findings and Regulatory Provisions
Implementation Plan (continued)
AnyWRRsshallrequirethattimelywrittennoticebegiventotheRegionalBoard,andtoanyregulatoryagencywhoseinstreamflowisatissue,ifdiversionor reclamation of waste water or extraction of groundwater results or threatens toresultin(orcontributesto)insufficientflowstomaintainbeneficialuses.TheExecutiveOfficershallissueanorderpursuanttoWaterCodesection13267,whichrequiresresponsibleagenciesandjurisdictionstofileatechnicalreportifreclamation of waste water or extraction of groundwater results or threatens to resultin(orcontributesto)insufficientflowstomaintainbeneficialuses.Theorder shall require that the technical report identify the causes of the impairments orthreatenedimpairments,andidentifiesoptionstoabatetheconditions.TheRegionalBoardshallreconsiderthisTMDLifadequateflowstoprotectinstreambeneficialusesarenotmaintained.
The implementation actions described in the TMDL represent a range of activities that could be conducted to achieve a salts balance in the watershed. Future considerations may result in other actions being implemented rather than the options presented. However, any proposed actions will be reviewed using the salt balance model to ensure the action does not adversely impact other implementation actions in the watershed or the salt balance of a downstream subwatershed.
Currently, the implementation plan is presented in phases with a tentative schedule for each phase. The implementation of projects may occur earlier than planned or beginduringanearlierphase.Additionally,manyoftheimplementationactionsrequire the use of the Regional Salinity Management Conveyance (RSMC or brine line).Assuch,theimplementationscheduleforthoseactionswillbelinkedtheconstruction schedule for the RSMC.
The implementation plan for the Salts TMDL includes regional and subwatershed specificimplementationactions.Therearefourkeystructuralelementstotheregional implementation: Regional Salinity Management Conveyance (RSMC), Water Conservation, Water Softeners, and Best Management Practices for Irrigated Agriculture.SubwatershedimplementationincludesRenewableWaterResourceManagement Program (RWRMP) for the Southern Reaches and Northern Reach Renewable Water Management Plan (NRRWMP). Detailed discussion for each implementation element including description of the action, status and schedule for implementing the action, and a summary of the expected contribution to achievement of the salts balance are provided in the Staff Report and Technical Report for this TMDL. Proposed implementation actions in the watershed, responsible agencies, and the estimated completion date based on the effective date of the TMDL are summarized below.

Basin Plan 7-268 Total Maximum Daily LoadsUpdated September 20��
TMDL Element Key Findings and Regulatory Provisions
Implementation Plan (continued)
Summary of Proposed Implementation Actions
Action Responsible Agency/ies Schedule for Completion
Water Conservation POTWs, Permitted Stormwater Dischargers, and Other NPDES Permittees
3 years
Water Softeners POTWs and Permitted Stormwater Dischargers
10 years
Best Management Practice for AgriculturalDischargers
AgriculturalDischargers 2 years
RMSC Phase 1 Calleguas Municipal Water District 2 year
RMSC Phase 2 Calleguas Municipal Water District
5 year
RMSC Phase 3 Calleguas Municipal Water District 10 years
RWRMP Phase 1 CamrosaWater District, Camarillo Sanitation District
3 years
RWRMP Phase 2 Camrosa Water District, City of Thousand Oaks
6 years
RWRMP Phase 3 Camrosa Water District, City of Thousand Oaks
10 years
RWRMPPhase4 To Be Determined 15 years
NRRWMP Phase 1 Calleguas Municipal Water District, City of Simi Valley, Ventura County Water Work-District No.1
3 years
NRRWMP Phase 2 Calleguas Municipal Water District, Ventura County Water Work-District No.1, City of Camarillo
7years
NRRWMP Phase 3 City of Camarillo, City of Simi Valley
10 years
NRRWMPPhase4 To Be Determined 15 years
Final Completion Date 15 years
ThesectionsbelowprovidediscussionoftheapplicationofthefinalWLAsforPOTWs,specificpermittedstormwaterdischarges,otherNPDESdischargers,andagricultural dischargers.
I. POTWs, permitted stormwater discharges, and other NPDES discharges
ThefinalWLAswillbeincludedforpermittedstormwaterdischarges,POTWs, and other NPDES discharges in accordance with the compliance schedulesprovidedinTable7-22.2.TheRegionalBoardmayrevisetheseWLAsbasedonadditionalinformationdevelopedthroughspecialstudiesand/or monitoring conducted as part of this TMDL.
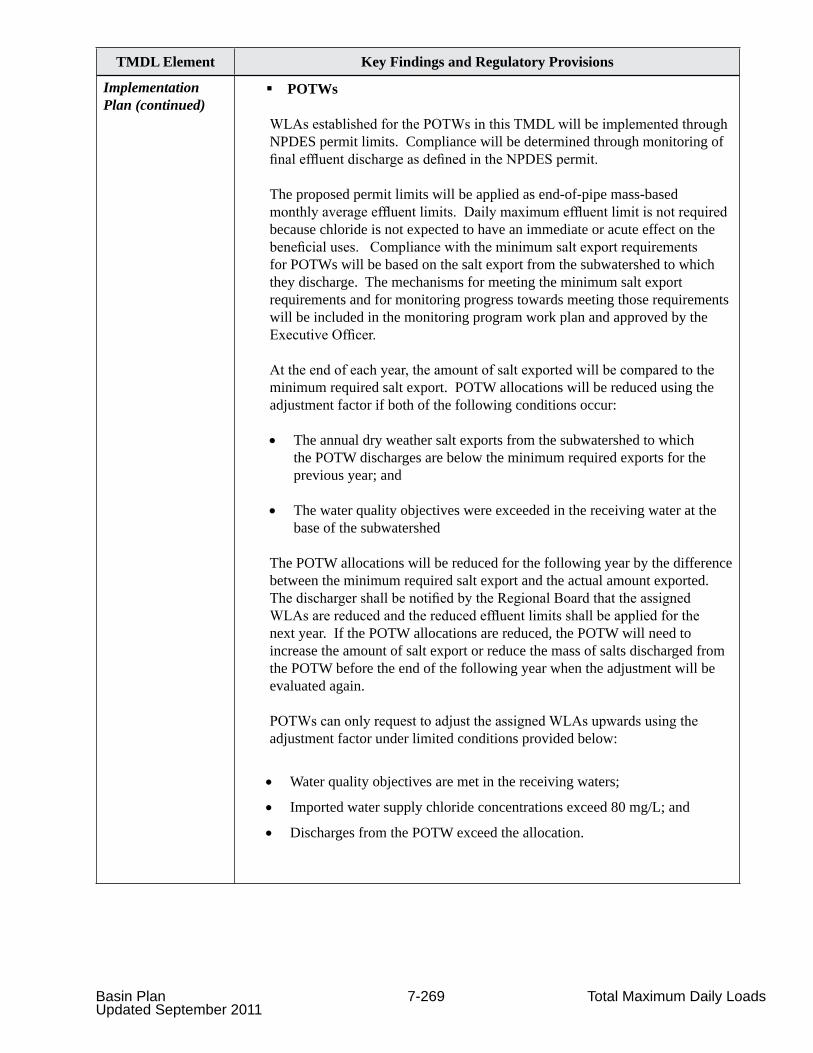
Basin Plan 7-269 Total Maximum Daily LoadsUpdated September 20��
TMDL Element Key Findings and Regulatory Provisions
Implementation Plan (continued)
POTWs
WLAsestablishedforthePOTWsinthisTMDLwillbeimplementedthroughNPDES permit limits. Compliance will be determined through monitoring of finaleffluentdischargeasdefinedintheNPDESpermit.
The proposed permit limits will be applied as end-of-pipe mass-based monthlyaverageeffluentlimits.Dailymaximumeffluentlimitisnotrequiredbecause chloride is not expected to have an immediate or acute effect on the beneficialuses.Compliancewiththeminimumsaltexportrequirementsfor POTWs will be based on the salt export from the subwatershed to which they discharge. The mechanisms for meeting the minimum salt export requirements and for monitoring progress towards meeting those requirements will be included in the monitoring program work plan and approved by the ExecutiveOfficer.
Attheendofeachyear,theamountofsaltexportedwillbecomparedtotheminimum required salt export. POTW allocations will be reduced using the adjustment factor if both of the following conditions occur:
• The annual dry weather salt exports from the subwatershed to which the POTW discharges are below the minimum required exports for the previous year; and
• The water quality objectives were exceeded in the receiving water at the base of the subwatershed
The POTW allocations will be reduced for the following year by the difference between the minimum required salt export and the actual amount exported. ThedischargershallbenotifiedbytheRegionalBoardthattheassignedWLAsarereducedandthereducedeffluentlimitsshallbeappliedforthenext year. If the POTW allocations are reduced, the POTW will need to increase the amount of salt export or reduce the mass of salts discharged from the POTW before the end of the following year when the adjustment will be evaluated again.
POTWscanonlyrequesttoadjusttheassignedWLAsupwardsusingtheadjustment factor under limited conditions provided below:
• Water quality objectives are met in the receiving waters;
• Imported water supply chloride concentrations exceed 80 mg/L; and
• Discharges from the POTW exceed the allocation.

Basin Plan 7-270 Total Maximum Daily LoadsUpdated September 20��
TMDL Element Key Findings and Regulatory Provisions
Implementation Plan (continued)
When imported water supply chloride concentrations exceed 80 mg/L, the POTWwillmonitortheeffluenttodetermineifthewasteloadallocationisexceeded. If the wasteload allocation is exceeded and the POTW desires an adjustment to the allocation, the POTW will submit documentation of the water supply chloride concentrations, the receiving water chloride concentration,theeffluentmass,andtheevidenceofincreasedsaltexportsto offset the increased discharges from the POTW to the Regional Board for approval. The adjustment factor will apply for three months and the POTW must submit the evidence outlined above every three months to keep the adjustmentfactoractive.Aslongastherequiredinformationissubmitted,theadjustmentfactorwillbeineffectuponnotificationinwritingfromtheRWQCB. Urban Stormwater Discharger
Agroupmass-baseddryweatherWLAhasbeendevelopedforallpermittedstormwater discharges, including municipal separate storm sewer systems (MS4s),andgeneralindustrialandconstructionstormwaterpermits.USEPAregulation allows allocations for NPDES-regulated stormwater discharges frommultiplepointsourcestobeexpressedasasinglecategoricalWLAwhenthedataandinformationareinsufficienttoassigneachsourceoroutfallindividualWLAs(40CFR130).ThegroupedallocationwillapplytoallNPDES-regulatedmunicipalstormwaterdischargesintheCCW.MS4WLAswillbeincorporatedintotheNPDESpermitasreceivingwaterlimitsmeasured in-stream at the base of each subwatershed.
Other NPDES Dischargers
WLAsestablishedforotherNPDESpermitteddischargersinthisTMDL,including minor non-stormwater permittees (other than Camrosa WRP) and general non-stormwater permittees, will be implemented through NPDES permit limits. The proposed permit limits will be applied as end-of-pipe concentration-basedeffluentlimits,andcompliancedeterminedthroughmonitoringoffinaleffluentdischargeasdefinedintheNPDESpermit.

Basin Plan 7-27� Total Maximum Daily LoadsUpdated September 20��
TMDL Element Key Findings and Regulatory Provisions
Implementation Plan (continued)
II. Agriculture
Load allocations for salts will be implemented through Conditional Waiver of Discharges from Irrigated Lands (Conditional Waiver Program) adopted by the LARWQCBonNovember3,2005.CompliancewithLAswillbemeasuredin-stream at the base of the subwatersheds and will be achieved through the implementation of Best Management Practices (BMPs) consistent with the Conditional Waiver Program. The Conditional Waiver Program requires the developmentofanagriculturalwaterqualitymanagementplan(AWQMP)to address pollutants that are exceeding receiving water quality objectives as a result of agricultural discharges. Therefore, implementation of the load allocations will be through the development of an agricultural management plan for salts. Implementation of the load allocations will also include the coordination of BMPs being implemented under other required programs to ensuresaltsdischargesareconsideredintheimplementation.Additionally,agricultural dischargers will participate in educational seminars on the implementation of BMPs as required under the Conditional Program. Studies are currently being conducted to assess the extent of BMP implementation and provide information on the effectiveness of BMPs for agriculture. ThisinformationwillbeintegratedintotheAWQMPthatwillguidetheimplementationofagriculturalBMPsintheCalleguasCreekwatershed.Afterimplementation of these actions, compliance with the allocations and TMDL will be evaluated and the allocations reconsidered if necessary based on the special studies and monitoring plan section of the implementation plan.
AsshowninTable7-22.2,implementationofLAswillbeconductedovera period of time to allow for implementation of the BMPs, as well as coordination with special studies and implementation actions resulting from other TMDL Implementation Plans (Nutrient, Historic Pesticides and PCBs, Sediment, Metals, Bacteria, etc.).

Basin Plan 7-272 Total Maximum Daily LoadsUpdated September 20��
Table 7-22.2 Calleguas Creek Watershed Salts TMDL: Implementation ScheduleItem Implementation Action Responsible Party Completion Date
1 Effective date of interim Salts TMDL waste load allocations (WLAs)
POTWs, Permitted Stormwater Dischargers1 (PSD), and Other NPDES Permittees
Effective date of the amendment
2 EffectivedateofinterimSaltsTMDLloadallocations(LAs) AgriculturalDischargers Effective date of the amendment
3 Responsible jurisdictions and agencies shall submit compliancemonitoringplantotheLosAngelesRegionalBoardforExecutiveOfficerapproval.
POTWs, PSD, Other NPDES Permittees, and AgriculturalDischargers
6 months after effective date of the TMDL
4 Responsible jurisdictions and agencies shall begin monitoring as outlined in the approved monitoring plan.
POTWs, PSD, Other NPDES Permittees, and AgriculturalDischargers
1 year after monitoring plan approval by ExecutiveOfficer
5 Responsible jurisdictions and agencies shall submit workplans for the optional special studies.
POTWs, PSD, Other NPDES Permittees, and AgriculturalDischargers
Within 10 years of effective date of the TMDL
6 Responsible jurisdictions and agencies shall submit results of the special studies.
POTWs, PSD, Other NPDES Permittees, and AgriculturalDischargers
2 years after workplan approval byExecutiveOfficer
7 Re-evaluationoftheinterimWLAsandinterimLAsforboron, chloride, sulfate, and TDS based on new data. Responsible jurisdictions and agencies shall demonstrate that implementation actions have reduced the boron, sulfate, TDS, and chloride imbalance by 20%.
POTWs, PSD, Other NPDES Permittees, and AgriculturalDischargers
3 years after effective date of the TMDL
8 Re-evaluationoftheinterimWLAsandinterimLAsforboron, chloride, sulfate, and TDS based on new data. Responsible jurisdictions and agencies shall demonstrate that implementation actions have reduced the boron, sulfate, TDSandchlorideimbalanceby40%.
POTWs, PSD, Other NPDES Permittees, and AgriculturalDischargers
7yearsaftereffective date of the TMDL
9 Re-evaluationoftheinterimWLAsandinterimLAsforboron, chloride, sulfate, and TDS based on new data. Responsible jurisdictions and agencies shall demonstrate that implementation actions have reduced the boron, sulfate, TDS,andchlorideimbalanceby70%.
POTWs, Permitted Stormwater Dischargers (PSD), Other NPDES Permittees, and AgriculturalDischargers
10 years after effective date of the TMDL
10 TheLosAngelesRegionalBoardshallreconsiderthisTMDLtore-evaluatenumerictargets,WLAs,LAsandtheimplementation schedule based on the results of the special studies and/or compliance monitoring.
The Regional Board 12 years after effective date of the TMDL
11 Responsible jurisdictions and agencies shall demonstrate that the watershed has achieved an annual boron, sulfate, TDS, and chloride balance.
POTWs, PSD, Other NPDES Permittees, and AgriculturalDischargers
15 years after effective date of the TMDL
12 The POTWs and non-storm water NPDES permits shall achieveWLAs,whichshallbeexpressedasNPDESmass-basedeffluentlimitationspecifiedinaccordancewithfederalregulations and state policy on water quality control.
POTWs and Other NPDES Permittees
15 years after effective date of the TMDL

Basin Plan 7-27� Total Maximum Daily LoadsUpdated September 20��
Item Implementation Action Responsible Party Completion Date
13 IrrigatedagricultureshallachieveLAs,whichwillbeimplemented through the Conditional Waiver for Irrigated Lands as mass-based receiving water limits.
AgriculturalDischargers 15 years after effective date of the TMDL
14 ThepermittedstormwaterdischargersshallachieveWLAs,which shall be expressed as NPDES mass-based limits specifiedinaccordancewithfederalregulationsandstatepolicy on water quality control.
Permitted Stormwater Dischargers
15 years after effective date of the TMDL
15 Water quality objectives will be achieved at the base of the subwatersheds designated in the TMDL.
POTWs, PSD, Other NPDES Permittees, and AgriculturalDischargers
15 years after effective date of the TMDL
1 Permitted stormwater dischargers that are responsible parties to this TMDL include the Municipal Stormwater Dischargers (MS4s)oftheCitiesofCamarillo,Moorpark,ThousandOaks,CountyofVentura,VenturaCountyWatershedProtection District, and general industrial and construction permittees.

Basin Plan 7-274 Total Maximum Daily LoadsUpdated September 20��

Basin Plan 7-275 Total Maximum Daily LoadsUpdated September 20��
7-23 Lake Elizabeth, Munz Lake, and Lake Hughes Trash TMDL
This TMDL was adopted by: TheRegionalWaterQualityControlBoardonJune7,2007.
This TMDL was approved by: TheStateWaterResourcesControlBoardonDecember4,2007. TheOfficeofAdministrativeLawonFebruary8,2008. TheU.S.EnvironmentalProtectionAgencyonFebruary27,2008.
The effective date of this TMDL is: March 6, 2008.
TheelementsoftheTMDLarepresentedinTable7-23.1andtheImplementationPlaninTables7-23.2aand7-23.2b.
Table 7-23.1 Lake Elizabeth, Munz Lake, and Lake Hughes Trash TMDL: Elements
Element Lake Elizabeth, Munz Lake, and Lake Hughes Trash TMDL
Problem Statement Current levels of trash discharges into Lake Elizabeth and Lake Hughes violatewaterqualityobjectivesandareimpairingbeneficialuses.Based on trash abatement and cleanup efforts by the local landowner in the vicinity of Munz Lake and site visits by Regional Board staff, current assessment of trash levels indicates that Munz Lake is no longer impaired by trash and the local landowner will provide date to evaluate the feasibility of delisting Munz Lake. Relevant water quality objectives include Floating Material and Solid, Suspended, or Settleable Materials.Thefollowingdesignatedbeneficialusesareimpactedby trash: water contact recreation (REC 1) and non-contact water recreation(REC2),warmfreshwaterhabitat(WARM),andwildlifehabitat(WILD);rareandthreatenedspecies(RARE),thatisspecificforLake Elizabeth.
Numeric Target (interpretation of the narrative water quality objective, used to calculate the load allocations)
Zero trash in Lake Elizabeth, Munz Lake, and Lake Hughes and theirshorelines.Zeroisdefinedas(1)fornonpointsources,notrashimmediately following each assessment and collection event consistent withanestablishedMinimumFrequencyofAssessmentandCollectionProgram(MFACProgram).TheMFACProgramisestablishedataninterval that prevents trash from accumulating in deleterious amounts thatcausenuisanceoradverselyaffectbeneficialusesbetweencollections, and (2) for point sources, zero trash discharged into Lake Elizabeth, Munz Lake and Lake Hughes and their shorelines.
Source Analysis Litter from adjacent land areas, roadways and direct dumping and deposition are sources of trash to Lake Elizabeth and Lake Hughes. Point sources such as storm drains are also sources of trash discharged to Lake Elizabeth and Lake Hughes.
Loading Capacity Zero,asdefinedintheNumericTarget.Waste Load Allocations (for point sources)
WasteLoadAllocations(WLAs)areassignedtothePermiteesundertheLosAngelesCountyMunicipalSeparateStormSewerSystem(MS4)NPDESpermit,includingLosAngelesCountyandlocallandownerswith storm drains that discharge to Lake Elizabeth and Lake Hughes. WLAsarezerotrash.WLAsmaybeissuedtoadditionalresponsiblejurisdictionsinthefutureunderPhase2oftheUSEPAStormwaterPermitting Program, or other applicable regulatory programs.

Basin Plan 7-276 Total Maximum Daily LoadsUpdated September 20��
Element Lake Elizabeth, Munz Lake, and Lake Hughes Trash TMDL
Load Allocations (for nonpoint sources)
LoadAllocations(LAs)areassignedtotheNationalForestServiceandlocallandowners.LAsarezerotrash.LAsmaybeissuedtoadditionalresponsible jurisdictions in the future under applicable regulatory programs.
Implementation Implementation of the trash TMDL for Lake Elizabeth and Lake Hughes includes structural and non-structural best management practices (BMPs) and a program of minimum frequency of assessment andcollection(MFAC)toaddresspointandnonpointtrashsources.
Point Sources
WLAsshallbeimplementedthroughstormwaterpermitsandviatheauthorityvestedintheExecutiveOfficerbysection13267ofthePorter-CologneWaterQualityControlAct(WaterCodesection13000etseq.).
IfpointsourcedischargerscomplywithWLAsbyimplementinganExecutiveOfficercertifiedfullcapturesystemonconveyancesthatdischarge to Lake Elizabeth and Lake Hughes through a progressive implementation schedule of full capture devices, they will be deemed in compliancewiththeWLA.
Incertaincircumstances(ifapprovedbytheExecutiveOfficer),pointsourcedischargersmayalternativelycomplywithWLAsbyimplementing a program for minimum frequency of assessment and collectioninconjunctionwithbestmanagementpractices(MFAC/BMPs).
1.CompliancewiththefinalWLAmaybeachievedthroughanadequately sized and maintained full capture system, once the ExecutiveOfficerhascertifiedthatthesystemmeetsthefollowingminimumcriteria.Afullcapturesystem,ataminimum,consistsofany device or series of devices that traps all particles retained by a 5 mm mesh screen and has a design treatment capacity of not less than thepeakflowrate(Q)resultingfromaone-year,one-hour,storminthe sub-drainage area. The rational equation is used to compute the peakflowrate:
Q=C×I×A,whereQ=designflowrate(cubicfeetpersecond,cfs); C=runoffcoefficient(dimensionless); I=designrainfallintensity(inchesperhour);and A=subdrainagearea(acres).

Basin Plan 7-277 Total Maximum Daily LoadsUpdated September 20��
Element Lake Elizabeth, Munz Lake, and Lake Hughes Trash TMDL
Implementation (continued) Point sources that choose to comply via a full capture system, must demonstrate a phased implementation of full capture devices over an 8-yearperioduntilthefinalWLAofzeroisattained.Zerowillbedeemed to have been met if full capture systems have been installed on all conveyances discharging to Lake Elizabeth and Lake Hughes.
Irrespective of whether point sources employ a full capture system, they maycomplywiththeWLAinanylawfulmanner.
2.CompliancethroughaMFACprograminconjunctionwithBMPsmay be proposed to the Regional Board for incorporation into therelevantNPDESpermit.TheMFACprogrammustincluderequirements equivalent to those described in the Conditional Waiver setforthbelow.AgenciesthatareresponsibleforbothpointandnonpointsourceswillbedeemedincompliancewithboththeWLAsandLAsifaMFAC/BMPprogram,approvedbytheExecutiveOfficer,isimplemented.
Nonpoint Sources
LAsshallbeimplementedthrougheither(1)aconditionalwaiverfrom waste discharge requirements, or (2) an alternative program implemented through waste discharge requirements or an individual waiver or another appropriate order of the Regional Board.
Non-pointsourcedischargersmayachievecompliancewiththeLAsbyimplementingaMFAC/BMPprogramapprovedbytheExecutiveOfficer.Responsiblejurisdictionsthatareresponsibleforbothpointand nonpoint sources will be deemed in compliance with both the WLAsandLAsifaMFAC/BMPprogram,approvedbytheExecutiveOfficer,isimplemented.
1) Conditional Waiver: Pursuant to Water Code section 13269, waste discharge requirements are waived for any responsible jurisdiction that implementsaMFAC/BMPProgramwhich,tothesatisfactionoftheExecutiveOfficer,meetsthefollowingcriteria:

Basin Plan 7-278 Total Maximum Daily LoadsUpdated September 20��
Element Lake Elizabeth, Munz Lake, and Lake Hughes Trash TMDL
Implementation (continued) a) TheMFAC/BMPProgramincludesaninitialminimumfrequency of trash assessment and collection and suite of structuraland/ornonstructuralBMPs.TheMFAC/BMPprogram shall include collection and disposal of all trash found in the water and shoreline. Responsible jurisdictions shall implement an initial suite of BMPs based on current trash management practices in land areas that are found to be sources of trash to Lake Elizabeth, and Lake Hughes. For Lake Elizabeth and Lake Hughes, the initial minimum frequency shall be set as follows:
1. Once per week on the water, shoreline and the adjacent land areas of Lake Elizabeth and Lake Hughes where they are publicly accessible, as definedintheExecutiveOfficerapprovedTrashMonitoring and Reporting Plan (TMRP), during May 15 through October 15. Once per month for areas with limited access.
2. Once per month on the water, shoreline and the adjacent land areas for Lake Elizabeth and Lake Hughes,asdefinedintheExecutiveOfficerapproved TMRP, from October 15 to May 15.
3. Within one week on the water, shoreline and the adjacent land areas of Lake Elizabeth and Lake Hughes after each storm event with one inch of rain or greater, and after each wind advisory.
b) TheMFAC/BMPProgramincludesreasonableassurancesthatit will be implemented by the responsible jurisdiction.
c) TheMFAC/BMPProgramincludesaTrashMonitoringandReporting Plan, as described below, and a requirement that the responsible jurisdictions will self-report any non-compliance with its provisions. The results and report of the Trash Monitoring and Reporting Plan must be submitted to Regional Board on an annual basis.
d) MFACprotocolsmaybebasedonSWAMPprotocolsforrapid trash assessment, or alternative protocols proposed by dischargersandapprovedbytheExecutiveOfficer.
e) ImplementationoftheMFAC/BMPprogramshouldincludeaHealthandSafetyProgramtoprotectpersonnel.TheMFAC/BMP program shall not require responsible jurisdictions to access and collect trash from areas where personnel are prohibited.

Basin Plan 7-279 Total Maximum Daily LoadsUpdated September 20��
Element Lake Elizabeth, Munz Lake, and Lake Hughes Trash TMDL
Implementation (continued) TheExecutiveOfficermayapproveorrequirearevisedassessmentandcollectionfrequencyanddefinitionofthecriticalconditionsunderthewaiver:
(a) To prevent trash from accumulating in deleterious amounts thatcausenuisanceoradverselyaffectbeneficialusesbetweencollections;
(b) Toreflecttheresultsoftrashassessmentandcollection;(c) If the amount of trash collected does not show a decreasing
trend, where necessary, such that a shorter interval between collections is warranted; or
(d) If the amount of trash collected is decreasing such that a longer interval between collections is warranted.
Attheendoftheimplementationperiod,arevisedMFAC/BMPprogrammayberequirediftheExecutiveOfficerdeterminesthattheamount of trash accumulating between collections is causing nuisance orotherwiseadverselyaffectingbeneficialuses.
Withregardto(a),(b)or(c),above,theExecutiveOfficerisauthorizedto allow responsible jurisdictions to implement additional structural or non-structural BMPs in lieu of modifying the monitoring frequency.
AnywaiversimplementingtheTMDLshallexpirepursuanttoWaterCodesection13269fiveyearsaftertheeffectivedateofthisTMDL,unless reissued. The Regional Board may reissue this waiver through an order consistent herewith, instead of readopting these regulatory provisions.
(2)Alternatively,responsiblejurisdictionsmaypropose,ortheRegional Board may impose, an alternative program which would be implemented through waste discharge requirements an individual waiver, a cleanup and abatement order, or any other appropriate order or orders, provided the program is consistent with the assumptions and requirementsofthereductionsdescribedinTable7-23.2b,below.
TheCountyofLosAngeleswillactasathirdpartythroughtherecentlyenacted County Ordinance to identify private party dischargers in unincorporated County land. Within six months of the effective date of thisTMDL,theExecutiveOfficershallrequireresponsiblejurisdictionsto submit either a notice of intent to be regulated under the conditional waiverwiththeirproposedMFAC/BMPProgramandTrashMonitoringand Reporting Plan (TMRP), or a report of waste discharge.

Basin Plan 7-280 Total Maximum Daily LoadsUpdated September 20��
Element Lake Elizabeth, Munz Lake, and Lake Hughes Trash TMDL
Monitoring and Reporting Plan
ResponsiblejurisdictionswilldevelopaTMRPforExecutiveOfficerapproval that describes the methodologies that will be used to assess and monitor trash in Lake Elizabeth and Lake Hughes and/or within responsible jurisdiction land areas.
Requirements for the TMRP shall include, but are not limited to, assessmentandquantificationoftrashcollectedfromthesurfacesandshoreline of Lake Elizabeth and Lake Hughes or from responsible jurisdiction land areas. The monitoring plan shall provide details of the frequency, location, and reporting of trash monitoring. Responsible jurisdictions shall propose a metric (e.g., weight, volume, pieces of trash) to measure the amount of trash in Lake Elizabeth and Lake Hughes and on the land area surrounding Lake Elizabeth and Lake Hughes,asdefinedintheExecutiveOfficerapprovedTMRP.
The TMRP shall include a prioritization of areas that have the highest trash generation rates. The TMRP shall give preference to this prioritization when scheduling the installation of full capture devices, BMPs, or trash collection programs.
The TMRP shall also include an evaluation of effectiveness of the MFAC/BMPprogramtopreventtrashfromaccumulatingindeleteriousamountsthatcausenuisanceoradverselyaffectbeneficialusesbetweencollections,proposalstoenhanceBMPs,andarevisedMFACforExecutiveOfficerreview.
Responsible Jurisdictions may coordinate their TMRP activities for Lake Elizabeth and Lake Hughes.
Margin of Safety Zero is a conservative numeric target which contains an implicit margin of safety.
Seasonal Variations and Critical Conditions
Discharge of trash from the conveyances occurs primarily during or shortly after a major rain event. Discharge of trash from nonpoint sources occurs during all seasons, but can be increased during or shortly afterhighwindevents,whicharedefinedasperiodsofwindadvisoriesissued by the National Weather Service.
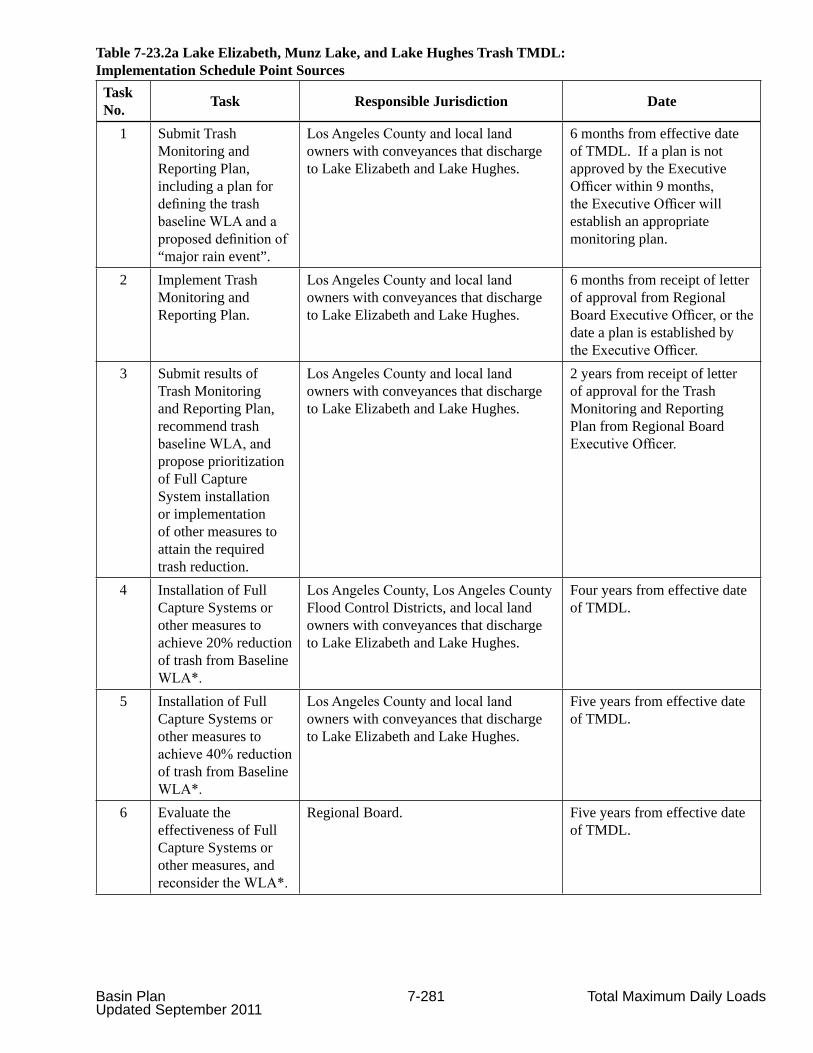
Basin Plan 7-28� Total Maximum Daily LoadsUpdated September 20��
Table 7-23.2a Lake Elizabeth, Munz Lake, and Lake Hughes Trash TMDL: Implementation Schedule Point Sources
TaskNo. Task Responsible Jurisdiction Date
1 Submit Trash Monitoring and Reporting Plan, including a plan for definingthetrashbaselineWLAandaproposeddefinitionof“major rain event”.
LosAngelesCountyandlocallandowners with conveyances that discharge to Lake Elizabeth and Lake Hughes.
6 months from effective date of TMDL. If a plan is not approved by the Executive Officerwithin9months,theExecutiveOfficerwillestablish an appropriate monitoring plan.
2 Implement Trash Monitoring and Reporting Plan.
LosAngelesCountyandlocallandowners with conveyances that discharge to Lake Elizabeth and Lake Hughes.
6 months from receipt of letter of approval from Regional BoardExecutiveOfficer,orthedate a plan is established by theExecutiveOfficer.
3 Submit results of Trash Monitoring and Reporting Plan, recommend trash baselineWLA,andpropose prioritization of Full Capture System installation or implementation of other measures to attain the required trash reduction.
LosAngelesCountyandlocallandowners with conveyances that discharge to Lake Elizabeth and Lake Hughes.
2 years from receipt of letter of approval for the Trash Monitoring and Reporting Plan from Regional Board ExecutiveOfficer.
4 Installation of Full Capture Systems or other measures to achieve 20% reduction of trash from Baseline WLA*.
LosAngelesCounty,LosAngelesCountyFlood Control Districts, and local land owners with conveyances that discharge to Lake Elizabeth and Lake Hughes.
Four years from effective date of TMDL.
5 Installation of Full Capture Systems or other measures to achieve40%reductionof trash from Baseline WLA*.
LosAngelesCountyandlocallandowners with conveyances that discharge to Lake Elizabeth and Lake Hughes.
Five years from effective date of TMDL.
6 Evaluate the effectiveness of Full Capture Systems or other measures, and reconsidertheWLA*.
Regional Board. Five years from effective date of TMDL.

Basin Plan 7-282 Total Maximum Daily LoadsUpdated September 20��
TaskNo. Task Responsible Jurisdiction Date
7 Installation of Full Capture Systems or other measures to achieve 60% reduction of trash from Baseline WLA*.
LosAngelesCountyandlocallandowners with conveyances that discharge to Lake Elizabeth and Lake Hughes
Six years from effective date of TMDL.
8 Installation of Full Capture Systems or other measures to achieve 80% reduction of trash from Baseline WLA*.
LosAngelesCountyandlocallandowners with conveyances that discharge to Lake Elizabeth and Lake Hughes.
Seven years from effective date of TMDL.
9 Installation of Full Capture Systems or other measures to achieve 100% reduction of trash fromBaselineWLA*.
LosAngelesCountyandlocallandowners with conveyances that discharge to Lake Elizabeth and Lake Hughes.
Eight years from effective date of TMDL.
*CompliancewithpercentreductionsfromtheBaselineWLAwillbeassumedwhereverfullcapturesystemsareinstalled in corresponding percentages of the conveyance discharging to the waterbody. Installation will be prioritized based on the greatest point source loadings.

Basin Plan 7-28� Total Maximum Daily LoadsUpdated September 20��
Table 7-23.2b Lake Elizabeth, Munz Lake, and Lake Hughes TMDL: Implementation Schedule Minimum Frequency of Assessment and Collection Program *
TaskNo.
Task Responsible Jurisdiction Date
1 Conditional Waiver in effect.
National Forest Service; Land owners in the vicinity of Lake Elizabeth and Lake Hughes.
Regional Board adoption of TMDL.
2 Submit Notice of Intent to Comply with Conditional Waiver of Discharge Requirements, includingMFAC/BMP Program and Trash Monitoring and Reporting Plan.
National Forest Service; Land owners in the vicinity of Lake Elizabeth and Lake Hughes.
Six months from TMDL effective date.
3 ImplementMFAC/BMP Program.
National Forest Service; Land owners in the vicinity of Lake Elizabeth and Lake Hughes.
Six months from receipt of NoticeofAcceptancefromRegional Board Executive Officer.
4 Submit annual TMRP reports including proposal for revising MFAC/BMPforExecutiveOfficerapproval.
National Forest Service; Land owners in the vicinity of Lake Elizabeth and Lake Hughes.
Two years from effective date of TMDL, and annually thereafter.
5 Reconsideration of Trash TMDL based on evaluation of effectiveness of MFAC/BMPprogram.
Regional Board. Five years from effective date of TMDL.
*AtTask3,allResponsibleJurisdictionsmustbeattainingthezerotrashtargetaftereachrequiredtrashassessmentandcollectionevent.AtTask4,allResponsibleJurisdictionsmustdemonstratefullcomplianceandattainmentofthezerotrashtarget’srequirementthattrashisnotaccumulatingindeleteriousamountsbetweentherequiredtrashassessmentandcollectionevents.BasedonResponsibleJurisdictionmonitoringreports,theExecutiveOfficermayadjusttheminimum frequency of assessment and collection as necessary to ensure compliance between the required trash assessment and collection events.

Basin Plan 7-284 Total Maximum Daily LoadsUpdated September 20��

Basin Plan 7-285 Total Maximum Daily LoadsUpdated September 20��
7-24 Revolon Slough and Beardsley Wash Trash TMDL
This TMDL was adopted by: TheRegionalWaterQualityControlBoardonJune7,2007.
This TMDL was approved by: TheStateWaterResourcesControlBoardonDecember4,2007. TheOfficeofAdministrativeLawonJanuary24,2008. TheU.S.EnvironmentalProtectionAgencyonFebruary27,2008.
The effective date of this TMDL is: March 6, 2008.
TheelementsoftheTMDLarepresentedinTable7-24.1andtheImplementationPlaninTables7-24.2aand7-24.2b.
Table 7-24.1 Revolon Slough and Beardsley Wash Trash TMDL: ElementsElement Revolon Slough and Beardsley Wash Trash TMDLProblem Statement Current levels of trash discharges into Revolon Slough and Beardsley
Washviolatewaterqualityobjectivesandareimpairingbeneficialuses.Relevant water quality objectives include Floating Material and Solid, Suspended,orSettleableMaterials.Thefollowingdesignatedbeneficialuses are impacted by trash: water contact recreation (REC1); non-contactwaterrecreation(REC2);warmfreshwaterhabitat(WARM);wildlife habitat (WILD); wetland habitat (WET).
Numeric Target (Interpretation of the narrative water quality objective, used to calculate the load allocations)
Zero trash in Revolon Slough and Beardsley Wash, and in the channel. Zeroisdefinedas(1)fornonpointsources,notrashimmediatelyfollowing each assessment and collection event consistent with an establishedMinimumFrequencyofAssessmentandCollectionProgram(MFACProgram).TheMFACProgramisestablishedatanintervalthat prevents trash from accumulating in deleterious amounts that cause nuisanceoradverselyaffectbeneficialusesbetweencollections,and(2) for point sources, zero trash discharged into Revolon Slough and Beardsley Wash, shoreline and channel.
Source Analysis Litter from adjacent land areas, roadways and direct dumping and deposition are sources of trash to Revolon Slough and Beardsley Wash. Point sources such as storm drains are also sources of trash discharged to Revolon Slough and Beardsley Wash.
Loading Capacity Zero,asdefinedintheNumericTarget.
Waste Load Allocations (for point sources)
WasteLoadAllocations(WLAs)areassignedtotheDepartmentofTransportation (Caltrans) Permittees and Co-Permittees of the Ventura CountyMunicipalSeparateStormSewerSystem(MS4)Permit,including Ventura County, the Ventura County Watershed Protection District, the City of Camarillo, and the City of Oxnard, and local landowners.WLAsarezerotrash.WLAsmaybeissuedtoadditionalresponsiblejurisdictionsinthefutureunderPhase2oftheUSEPAStormwater Permitting Program, or other applicable regulatory programs.

Basin Plan 7-286 Total Maximum Daily LoadsUpdated September 20��
Element Revolon Slough and Beardsley Wash Trash TMDLLoad Allocations (for nonpoint sources)
LoadAllocations(LAs)areassignedtolandownersandagenciesinthe vicinity of Revolon Slough and Beardsley Wash, including the County of Ventura, Ventura County Watershed Protection District, City ofCamarillo,CityofOxnard,andAgriculturalentitiesintheRevolonSloughandBeardsleyWashsubwatersheds.LAsarezerotrash.LAsmay be issued to additional responsible jurisdictions in the future under applicable regulatory programs.
Implementation Implementation of the trash TMDL for Revolon Slough and Beardsley Wash includes structural and non-structural best management practices (BMPs) and a program of minimum frequency of assessment and collection(MFAC)toaddresspointandnonpointtrashsources.
Point Sources
WLAsshallbeimplementedthroughstormwaterpermitsandviatheauthorityvestedintheExecutiveOfficerbysection13267ofthePorter-CologneWaterQualityControlAct(WaterCodesection13000etseq.).
IfpointsourcedischargerscomplywithWLAsbyimplementinganExecutiveOfficercertifiedfullcapturesystemonconveyancesthatdischarge to Revolon Slough and Beardsley Wash through a progressive implementation schedule of full capture devices, they will be deemed in compliancewiththeWLA.
Incertaincircumstances(ifapprovedbytheExecutiveOfficer),pointsourcedischargersmayalternativelycomplywithWLAsbyimplementing a program for minimum frequency of assessment and collectioninconjunctionwithbestmanagementpractices(MFAC/BMPs).
1.CompliancewiththefinalWLAmaybeachievedthroughanadequately sized and maintained full capture system, once the ExecutiveOfficerhascertifiedthatthesystemmeetsthefollowingminimumcriteria.Afullcapturesystem,ataminimum,consistsofany device or series of devices that traps all particles retained by a 5 mm mesh screen and has a design treatment capacity of not less than thepeakflowrate(Q)resultingfromaone-year,one-hour,storminthe sub-drainage area. The rational equation is used to compute the peakflowrate: Q=C×I×A,whereQ=designflowrate(cubicfeetpersecond,cfs); C=runoffcoefficient(dimensionless); I=designrainfallintensity(inchesperhour);and A=subdrainagearea(acres).

Basin Plan 7-287 Total Maximum Daily LoadsUpdated September 20��
Element Revolon Slough and Beardsley Wash Trash TMDLImplementation (continued) Point sources that choose to comply via a full capture system, must
demonstrate a phased implementation of full capture devices over an 8-yearperioduntilthefinalWLAofzeroisattained.Zerowillbedeemedto have been met if full capture systems have been installed on all conveyances discharging to Revolon Slough and Beardsley Wash.
Irrespective of whether point sources employ a full capture system, they maycomplywiththeWLAinanylawfulmanner.
2.CompliancethroughaMFACprograminconjunctionwithBMPsmay be proposed to the Regional Board for incorporation into therelevantNPDESpermit.TheMFACprogrammustincluderequirements equivalent to those described in the Conditional Waiver setforthbelow.AgenciesthatareresponsibleforbothpointandnonpointsourceswillbedeemedincompliancewithboththeWLAsandLAsifaMFAC/BMPprogram,approvedbytheExecutiveOfficer,isimplemented.
Nonpoint Sources
LAsshallbeimplementedthrougheither(1)aconditionalwaiverfrom waste discharge requirements, or (2) an alternative program implemented through waste discharge requirements or an individual waiver or another appropriate order of the Regional Board.
Non-pointsourcedischargersmayachievecompliancewiththeLAsbyimplementingaMFAC/BMPprogramapprovedbytheExecutiveOfficer.Responsiblejurisdictionsthatareresponsibleforbothpointand nonpoint sources will be deemed in compliance with both the WLAsandLAsifanMFAC/BMPprogram,approvedbytheExecutiveOfficer,isimplemented.
1) Conditional Waiver: Pursuant to Water Code section 13269, waste discharge requirements are waived for any responsible jurisdiction that implementsaMFAC/BMPProgramwhich,tothesatisfactionoftheExecutiveOfficer,meetsthefollowingcriteria:
a) TheMFAC/BMPProgramincludesaninitialminimumfrequency of trash assessment and collection and suite ofstructuraland/ornonstructuralBMPs.TheMFAC/BMP program shall include collection and disposal of all trash found in the water and on the shoreline. Responsible jurisdictions shall implement an initial suite of BMPs based on current trash management practices in land areas that are found to be sources of trash to Revolon Slough and Beardsley Wash. For Revolon Slough and Beardsley Wash, the initial minimum frequency shall be set as follows:

Basin Plan 7-288 Total Maximum Daily LoadsUpdated September 20��
Element Revolon Slough and Beardsley Wash Trash TMDLImplementation (continued) 1. Monthly on Revolon Slough and its adjacent
land areas at Wood Road (the end of the concrete-linedchannel),asdefinedintheExecutiveOfficerapprovedTrashMonitoringand Reporting Plan (TMRP).
2. Bi-monthly on the water, shoreline and channels of Beardsley Wash and Revolon Slough in areas under the jurisdiction of the County of Ventura, and agricultural lands.
3. Monthly assessment and collection at outlets on north side of Camarillo Hills Drain between Las Posas Rd. and Wood Rd.
4. MonthlyonLasPosasEstateDrainbetweenCentralAve.andthe101Freeway.
5. Monthly at the inlet to the North Ramona Place Drain debris basin.
6. Monthly at inlet to Beardsley Wash at Wright Roadandtheadjacentlandareas,asdefinedintheExecutiveOfficerapprovedTMRP.
7. Monthlyonarotatingbasisofthefollowingchannels from the City of Oxnard (i.e. one drain cleaned per month):
a. Fifth Street Drain from Del Norte Blvd. to Revolon Slough
b. Sturgis Drain from Oxnard City Limits to Revolon Slough
c. Nyeland Drain from Center Drive to Friedrich Rd.
d. Del Norte Drain from Del Norte Blvd. to Revolon Slough
8. AllDrainslistedabovewillalsobecleanedwithin one week of every storm event greater than 1 inch of rain.
b) TheMFAC/BMPProgramincludesreasonableassurances that it will be implemented by the responsible jurisdiction.

Basin Plan 7-289 Total Maximum Daily LoadsUpdated September 20��
Element Revolon Slough and Beardsley Wash Trash TMDLImplementation (continued) c) TheMFAC/BMPProgramincludesaTrash
Monitoring and Reporting Plan, as described below, and a requirement that the responsible jurisdictions will self-report any non-compliance with its provisions. The results and report of the Trash Monitoring and Reporting Plan must be submitted to Regional Board on an annual basis.
d) MFACprotocolsmaybebasedonSWAMPprotocolsfor rapid trash assessment, or alternative protocols proposed by dischargers and approved by the Executive Officer.
e) ImplementationoftheMFAC/BMPprogramshouldinclude a Health and Safety Plan to protect personnel. TheMFAC/BMPshallnotrequireresponsiblejurisdictions to access and collect trash from areas where personnel are prohibited.
ComplianceforAgriculturalSources
For agricultural dischargers, the Conditional Waiver for Irrigated Lands willberevisedtoincludeaMFAC/BMPprogramforenrolleesintheRevolon Slough and Beardsley Wash subwatershed. TheExecutiveOfficermayapproveorrequirearevisedassessmentandcollectionfrequencyanddefinitionofthecriticalconditionsunderthewaiver:
(a) To prevent trash from accumulating in deleterious amounts thatcausenuisanceoradverselyaffectbeneficialusesbetweencollections;
(b) Toreflecttheresultsoftrashassessmentandcollection;(c) If the amount of trash collected does not show a decreasing
trend, where necessary, such that a shorter interval between collections is warranted; or
(d) If the amount of trash collected is decreasing such that a longer interval between collections is warranted.
Attheendoftheimplementationperiod,arevisedMFAC/BMPprogrammayberequirediftheExecutiveOfficerdeterminesthattheamount of trash accumulating between collections is causing nuisance orotherwiseadverselyaffectingbeneficialuses.
Withregardto(a),(b)or(c),above,theExecutiveOfficerisauthorizedto allow responsible jurisdictions to implement additional structural or non-structural BMPs in lieu of modifying the monitoring frequency.

Basin Plan 7-290 Total Maximum Daily LoadsUpdated September 20��
Element Revolon Slough and Beardsley Wash Trash TMDLImplementation (continued) AnywaiversimplementingtheTMDLshallexpirepursuanttoWater
Codesection13269fiveyearsaftertheeffectivedateofthisTMDL,unless reissued. The Regional Board may reissue this waiver through an order consistent herewith, instead of readopting these regulatory provisions.
(2)Alternatively,responsiblejurisdictionsmaypropose,ortheRegional Board may impose, an alternative program which would be implemented through waste discharge requirements, an individual waiver, a cleanup and abatement order, or any other appropriate order or orders, provided the program is consistent with the assumptions and requirementsofthereductionsdescribedinTable7-24.2b,below.
Within six months of the effective date of this TMDL, the Executive Officershallrequireresponsiblejurisdictionstosubmiteitheranoticeof intent to be regulated under the conditional waiver with their proposedMFAC/BMPProgramandTrashMonitoringandReportingPlan (TMRP), or a report of waste discharge.
Monitoring and Reporting Plan
ResponsiblejurisdictionswilldevelopaTMRPforExecutiveOfficerapproval that describes the methodologies that will be used to assess and monitor trash in Revolon Slough and Beardsley Wash and/or within responsible jurisdiction land areas. The TMRP shall include aplantoestablishthetrashBaselineWLAsfornon-Caltransentities,or an alternative to the default trash baseline for Caltrans to prioritize installationoffullcapturedevices.ThedefaulttrashbaselineWLAforCaltransis6677.4gallonspersquaremileperyear.
Requirements for the TMRP shall include, but are not limited to, assessmentandquantificationoftrashcollectedfromthesurfacesandshoreline of Revolon Slough and Beardsley Wash or from responsible jurisdiction land areas. The monitoring plan shall provide details of the frequency, location, and reporting of trash monitoring. Responsible jurisdictions shall propose a metric (e.g., weight, volume, pieces of trash) to measure the amount of trash in Revolon Slough and Beardsley Wash and on the land area surrounding Revolon Slough and Beardsley Wash,asdefinedintheExecutiveOfficerapprovedTMRP.
The TMRP shall include a prioritization of areas that have the highest trash generation rates. The TMRP shall give preference to this prioritization when scheduling the installation of full capture devices, BMPs, or trash collection programs.

Basin Plan 7-29� Total Maximum Daily LoadsUpdated September 20��
Element Revolon Slough and Beardsley Wash Trash TMDLMonitoring and Reporting Plan (continued)
The TMRP shall also include an evaluation of effectiveness of the MFAC/BMPprogramtopreventtrashfromaccumulatingindeleteriousamountsthatcausenuisanceoradverselyaffectbeneficialusesbetweencollections,proposalstoenhanceBMPs,andarevisedMFACforExecutiveOfficerreview.
Responsible Jurisdictions may coordinate their TMRP activities for Revolon Slough and Beardsley Wash.
Margin of Safety Zero is a conservative numeric target which contains an implicit margin of safety.
Seasonal Variations and Critical Conditions
Discharge of trash from the conveyances occurs primarily during or shortly after a major rain event. Discharge of trash from nonpoint sources occurs during all seasons, but can be increased during or shortly afterhighwindevents,whicharedefinedasperiodsofwindadvisoriesissued by the National Weather Service.

Basin Plan 7-292 Total Maximum Daily LoadsUpdated September 20��
Table 7-24.2a Revolon Slough and Beardsley Wash Trash TMDL: Implementation Schedule - Point Sources
TaskNo. Task Responsible Jurisdiction Date
1 Submit Trash Monitoring and Reporting Plan, including a plan for definingthetrashbaselineWLAandaproposeddefinitionof“major rain event”.
City of Camarillo; City of Oxnard; Ventura County Watershed Protection District; Ventura County; Caltrans; Local land owners with conveyances
6 months from effective date of TMDL. If a plan is not approved by the Executive Officerwithin9months,theExecutiveOfficerwillestablish an appropriate monitoring plan.
2 Implement Trash Monitoring and Reporting Plan.
City of Camarillo; City of Oxnard; Ventura County Watershed Protection District; Ventura County; Caltrans; Local land owners with conveyances
6 months from receipt of letter of approval from Regional Board Executive Officer,orthedateaplanisestablished by the Executive Officer.
3 Submit results of Trash Monitoring and Reporting Plan, recommend trash baselineWLA,andpropose prioritization of Full Capture System installation or implementation of other measures to attain the required trash reduction.
City of Camarillo; City of Oxnard; Ventura County Watershed Protection District; Ventura County; Caltrans; Local land owners with conveyances
2 years from receipt of letter of approval for the Trash Monitoring and Reporting Plan from Regional Board ExecutiveOfficer.
4 Installation of Full Capture Systems or other measures to achieve 20% reduction of trash from Baseline WLA*.
City of Camarillo; City of Oxnard; Ventura County Watershed Protection District; Ventura County; Caltrans; Local land owners with conveyances
Four years from effective date of TMDL.
5 Installation of Full Capture Systems or other measures to achieve40%reductionof trash from Baseline WLA*.
City of Camarillo; City of Oxnard; Ventura County Watershed Protection District; Ventura County; Caltrans; Local land owners with conveyances
Five years from effective date of TMDL.
6 Evaluate the effectiveness of Full Capture Systems or other measures, and reconsidertheWLA*.
Regional Board. Five years from effective date of TMDL.

Basin Plan 7-29� Total Maximum Daily LoadsUpdated September 20��
TaskNo. Task Responsible Jurisdiction Date
7 Installation of Full Capture Systems or other measures to achieve 60% reduction of trash from Baseline WLA*.
City of Camarillo; City of Oxnard; Ventura County Watershed Protection District; Ventura County; Caltrans; Local land owners with conveyances
Six years from effective date of TMDL.
8 Installation of Full Capture Systems or other measures to achieve 80% reduction of trash from Baseline WLA*.
City of Camarillo; City of Oxnard; Ventura County Watershed Protection District; Ventura County; Caltrans; Local land owners with conveyances
Seven years from effective date of TMDL.
9 Installation of Full Capture Systems or other measures to achieve 100% reduction of trash fromBaselineWLA*.
City of Camarillo; City of Oxnard; Ventura County Watershed Protection District; Ventura County; Caltrans; Local land owners with conveyances
Eight years from effective date of TMDL.
*CompliancewithpercentreductionsfromtheBaselineWLAwillbeassumedwhereverfullcapturesystemsareinstalled in corresponding percentages of the conveyance discharging to Revolon Slough and Beardsley Wash. Installation will be prioritized based on the greatest point source loadings.

Basin Plan 7-294 Total Maximum Daily LoadsUpdated September 20��
Table 7-24.2b Revolon Slough and Beardsley Wash Trash TMDL:Implementation Schedule - Minimum Frequency of Assessment and Collection Program *
TaskNo.
Task Responsible Jurisdiction Date
1 Conditional Waiver in effect.
City of Camarillo; City of Oxnard; VenturaCounty;Agriculturaldischargers;Ventura County Watershed Protection District; Caltrans; Local land owners with conveyances
Regional Board adoption of TMDL.
2 Submit Notice of Intent to Comply with Conditional Waiver of Discharge Requirements, including MFAC/BMPProgramand Trash Monitoring and Reporting Plan.
City of Camarillo; City of Oxnard; VenturaCounty;Agriculturaldischargers;Ventura County Watershed Protection District; Caltrans; Local land owners with conveyances
Six months from TMDL effective date.
3 ImplementMFAC/BMPProgram.
City of Camarillo; City of Oxnard; VenturaCounty;Agriculturaldischargers;Ventura County Watershed Protection District; Caltrans; Local land owners with conveyances
Six months from receipt of Notice of AcceptancefromRegional Board ExecutiveOfficer.
4 Submit annual TMRP reports including proposal for revising MFAC/BMPforExecutiveOfficerapproval.
City of Camarillo; City of Oxnard; VenturaCounty;Agriculturaldischargers;Ventura County Watershed Protection District; Caltrans; Local land owners with conveyances
Two years from effective date of TMDL, and annually thereafter.
5 Reconsideration of Trash TMDL based on evaluation of effectivenessofMFAC/BMP program.
Regional Board. Five years from effective date of TMDL.
*AtTask3,allResponsibleJurisdictionsmustbeattainingthezerotrashtargetaftereachrequiredtrashassessmentandcollectionevent.AtTask4,allResponsibleJurisdictionsmustdemonstratefullcomplianceandattainmentofthezerotrashtarget’srequirementthattrashisnotaccumulatingindeleteriousamountsbetweentherequiredtrashassessmentandcollectionevents.BasedonResponsibleJurisdictionmonitoringreports,theExecutiveOfficermayadjusttheminimum frequency of assessment and collection as necessary to ensure compliance between the required trash assessment and collection events.

Basin Plan 7-295 Total Maximum Daily LoadsUpdated September 20��
7-25 Ventura River Estuary Trash TMDL
This TMDL was adopted by: TheRegionalWaterQualityControlBoardonJune7,2007.
This TMDL was approved by: TheStateWaterResourcesControlBoardonDecember4,2007. TheOfficeofAdministrativeLawonFebruary11,2008. TheU.S.EnvironmentalProtectionAgencyonFebruary27,2008.
The effective date of this TMDL is: March 6, 2008.
TheelementsoftheTMDLarepresentedinTable7-25.1andtheImplementationPlaninTables7-25.2aand7-25.2b.
Table 7-25.1 Ventura River Estuary Trash TMDL: ElementsElement Ventura River Estuary Trash TMDLProblem Statement Current levels of trash discharges into the Ventura River Estuary
violatewaterqualityobjectivesandareimpairingbeneficialuses.Relevant water quality objectives include Floating Material and Solid, Suspended,orSettleableMaterials.Thefollowingdesignatedbeneficialusesareimpactedbytrash:navigation(NAV),contactrecreation(REC1)andnon-contactrecreation(REC2),commercialandsportfishing(COMM),warmfreshwaterhabitat(WARM),estuarinehabitat(EST),marinehabitat(MAR),wildlifehabitat(WILD),rare,threatenedorendangeredspecies(RARE),migrationofaquaticorganisms(MIGR),spawning,reproduction,and/orearlydevelopment(SPWN),shellfishharvesting (SHELL), and wetland habitat (WET).
Numeric Target (Interpretation of the narrative water quality objective, used to calculate the load allocations)
Zero trash in the Ventura River Estuary, shoreline and in the channel. Zeroisdefinedas(1)fornonpointsources,notrashimmediatelyfollowing each assessment and collection event consistent with an establishedMinimumFrequencyofAssessmentandCollectionProgram(MFACProgram).TheMFACProgramisestablishedatanintervalthat prevents trash from accumulating in deleterious amounts that cause nuisanceoradverselyaffectbeneficialusesbetweencollections,and(2)for point sources, zero trash discharged into the Ventura River Estuary, shoreline, and channel.
Source Analysis Litter from adjacent land areas, roadways and direct dumping and deposition are sources of trash to the Ventura River Estuary. Point sources such as storm drains are also sources of trash discharged to the Ventura River Estuary.
Loading Capacity Zero,asdefinedintheNumericTarget.
Waste Load Allocations (for point sources)
WasteLoadAllocations(WLAs)areassignedtotheCityofVentura,County of Ventura, Ventura County Watershed Protection District, CaliforniaDepartmentofFoodandAgriculture,andCaltranswithconveyancesthatdischargetotheVenturaRiverEstuary.WLAsarezerotrash.WLAsmaybeissuedtoadditionalresponsiblejurisdictionsinthefutureunderPhase2oftheUSEPAStormwaterPermittingProgram, or other applicable regulatory programs.

Basin Plan 7-296 Total Maximum Daily LoadsUpdated September 20��
Element Ventura River Estuary Trash TMDLLoad Allocations (for nonpoint sources)
LoadAllocations(LAs)areassignedtotheCityofVentura,VenturaCounty, Ventura County Watershed Protection District, California Department of Parks and Recreation, California Department of Food andAgriculture,andAgriculturalDischargers.LAsarezerotrash.LAsmay be issued to additional responsible jurisdictions in the future under applicable regulatory programs.
Implementation Implementation of the trash TMDL for the Ventura River Estuary includes structural and non-structural best management practices (BMPs) and a program of minimum frequency of assessment and collection(MFAC)toaddresspointandnonpointtrashsources.
Point Sources
WLAsshallbeimplementedthroughstormwaterpermitsandviatheauthorityvestedintheExecutiveOfficerbysection13267ofthePorter-CologneWaterQualityControlAct(WaterCodesection13000etseq.).
IfpointsourcedischargerscomplywithWLAsbyimplementinganExecutiveOfficercertifiedfullcapturesystemonconveyancesthat discharge to the Ventura River Estuary through a progressive implementation schedule of full capture devices, they will be deemed in compliancewiththeWLA.
Incertaincircumstances(ifapprovedbytheExecutiveOfficer),pointsourcedischargersmayalternativelycomplywithWLAsbyimplementing a program for minimum frequency of assessment and collectioninconjunctionwithbestmanagementpractices(MFAC/BMPs).
1.CompliancewiththefinalWLAmaybeachievedthroughanadequately sized and maintained full capture system, once the ExecutiveOfficerhascertifiedthatthesystemmeetsthefollowingminimumcriteria.Afullcapturesystem,ataminimum,consistsofany device or series of devices that traps all particles retained by a 5 mm mesh screen and has a design treatment capacity of not less than thepeakflowrate(Q)resultingfromaone-year,one-hour,storminthe sub-drainage area. The rational equation is used to compute the peakflowrate: Q=C×I×A,whereQ=designflowrate(cubicfeetpersecond,cfs); C=runoffcoefficient(dimensionless); I=designrainfallintensity(inchesperhour);and A=subdrainagearea(acres).
Point sources that choose to comply via a full capture system, must demonstrate a phased implementation of full capture devices over an 8-yearperioduntilthefinalWLAofzeroisattained.Zerowillbedeemed to have been met if full capture systems have been installed on all conveyances discharging to the estuary.

Basin Plan 7-297 Total Maximum Daily LoadsUpdated September 20��
Element Ventura River Estuary Trash TMDLImplementation (continued) Irrespective of whether point sources employ a full capture system, they
maycomplywiththeWLAinanylawfulmanner.
2.CompliancethroughaMFACprograminconjunctionwithBMPsmay be proposed to the Regional Board for incorporation into therelevantNPDESpermit.TheMFACprogrammustincluderequirements equivalent to those described in the Conditional Waiver setforthbelow.AgenciesthatareresponsibleforbothpointandnonpointsourceswillbedeemedincompliancewithboththeWLAsandLAsifanMFAC/BMPprogram,approvedbytheExecutiveOfficer,isimplemented.
Nonpoint Sources
LAsshallbeimplementedthrougheither(1)aconditionalwaiverfrom waste discharge requirements, or (2) an alternative program implemented through waste discharge requirements or an individual waiver or another appropriate order of the Regional Board.
Non-pointsourcedischargersmayachievecompliancewiththeLAsbyimplementingaMFAC/BMPprogramapprovedbytheExecutiveOfficer.Responsiblejurisdictionsthatareresponsibleforbothpointand nonpoint sources will be deemed in compliance with both the WLAsandLAsifaMFAC/BMPprogram,approvedbytheExecutiveOfficer,isimplemented.
1) Conditional Waiver: Pursuant to Water Code section 13269, waste discharge requirements are waived for any responsible jurisdiction that implementsaMFAC/BMPProgramwhich,tothesatisfactionoftheExecutiveOfficer,meetsthefollowingcriteria:
a) TheMFAC/BMPProgramincludesaninitialminimumfrequency of trash assessment and collection and suite of structuraland/ornonstructuralBMPs.TheMFAC/BMPprogram shall include collection and disposal of all trash found in the water, shoreline, and the channel. Responsible jurisdictions shall implement an initial suite of BMPs based on current trash management practices in land areas that are found to be sources of trash to the Ventura River Estuary. For the Ventura River Estuary, the initial minimum frequency shall be set as follows:

Basin Plan 7-298 Total Maximum Daily LoadsUpdated September 20��
Element Ventura River Estuary Trash TMDLImplementation (continued) 1. Once per week for the sandy beach area between the
estuary and the ocean and along the bike path between May 15 and October 15. Once per month for the rest of the year.
2. Within one week after each storm event with one inch of rain or greater at the Front Street storm drain, which discharges under the eastern levee, 50-feet north of the railroad tracks.
3. Quarterly for other areas of the estuary below the U.S. 101 Freeway.
4. AftermajorpubliceventsthatoccurintheVenturaCounty Fairground that charge an admission price and areattendedbygreaterthan7,000people.
b) TheMFAC/BMPProgramincludesreasonableassurancesthatit will be implemented by the responsible jurisdiction.
c) TheMFAC/BMPProgramincludesaTrashMonitoringandReporting Plan, as described below, and a requirement that the responsible jurisdictions will self-report any non-compliance with its provisions. The results and report of the Trash Monitoring and Reporting Plan must be submitted to Regional Board on an annual basis.
d) MFACprotocolsmaybebasedonSWAMPprotocolsforrapid trash assessment, or alternative protocols proposed by dischargersandapprovedbytheExecutiveOfficer.
e) ImplementationoftheMFAC/BMPprogramshouldincludeaHealthandSafetyPlantoprotectpersonnel.TheMFAC/BMPshall not require responsible jurisdictions to access and collect trash from areas where personnel are prohibited.
Compliance for Agricultural Sources
For agricultural dischargers, the Conditional Waiver for Irrigated Lands willberevisedtoincludeaMFAC/BMPprogramforenrolleesintheVentura River Estuary subwatershed. TheExecutiveOfficermayapproveorrequirearevisedassessmentandcollectionfrequencyanddefinitionofthecriticalconditionsunderthewaiver:

Basin Plan 7-299 Total Maximum Daily LoadsUpdated September 20��
Element Ventura River Estuary Trash TMDLImplementation (continued) (a) To prevent trash from accumulating in deleterious amounts
thatcausenuisanceoradverselyaffectbeneficialusesbetweencollections;
(b) Toreflecttheresultsoftrashassessmentandcollection;(c) If the amount of trash collected does not show a decreasing
trend, where necessary, such that a shorter interval between collections is warranted; or
(d) If the amount of trash collected is decreasing such that a longer interval between collections is warranted.
Attheendoftheimplementationperiod,arevisedMFAC/BMPprogrammayberequirediftheExecutiveOfficerdeterminesthattheamount of trash accumulating between collections is causing nuisance orotherwiseadverselyaffectingbeneficialuses.
Withregardto(a),(b)or(c),above,theExecutiveOfficerisauthorizedto allow responsible jurisdictions to implement additional structural or non-structural BMPs in lieu of modifying the monitoring frequency.
AnywaiversimplementingtheTMDLshallexpirepursuanttoWaterCodesection13269fiveyearsaftertheeffectivedateofthisTMDL,unless reissued. The Regional Board may reissue this waiver through an order consistent herewith, instead of readopting these regulatory provisions.
(2)Alternatively,responsiblejurisdictionsmaypropose,ortheRegional Board may impose, an alternative program which would be implemented through waste discharge requirements an individual waiver, a cleanup and abatement order, or any other appropriate order or orders, provided the program is consistent with the assumptions and requirementsofthereductionsdescribedinTable7-25.2b,below.
Within six months of the effective date of this TMDL, the Executive Officershallrequireresponsiblejurisdictionstosubmiteitheranoticeof intent to be regulated under the conditional waiver with their proposedMFAC/BMPProgramandTrashMonitoringandReportingPlan (TMRP), or a report of waste discharge.

Basin Plan 7-�00 Total Maximum Daily LoadsUpdated September 20��
Element Ventura River Estuary Trash TMDLMonitoring and Reporting Plan
ResponsiblejurisdictionswilldevelopaTMRPforExecutiveOfficerapproval that describes the methodologies that will be used to assess and monitor trash in the Ventura River Estuary and/or within responsible jurisdiction land areas. The TMRP shall include a plan toestablishthetrashBaselineWLAsfornon-Caltransentities,oran alternative to the default trash baseline for Caltrans to prioritize installationoffullcapturedevices.ThedefaulttrashbaselineWLAforCaltransis6677.4gallonspersquaremileperyear.
Requirements for the TMRP shall include, but are not limited to, assessmentandquantificationoftrashcollectedfromthesurfacesandshoreline of the Ventura River Estuary or from responsible jurisdiction land areas. The monitoring plan shall provide details of the frequency, location, and reporting of trash monitoring. Responsible jurisdictions shall propose a metric (e.g., weight, volume, pieces of trash) to measure the amount of trash in the estuary and on the land area surrounding the estuary,asdefinedintheExecutiveOfficerapprovedTMRP.
The TMRP shall include a prioritization of areas that have the highest trash generation rates. The TMRP shall give preference to this prioritization when scheduling the installation of full capture devices, BMPs, or trash collection programs.
The TMRP shall also include an evaluation of effectiveness of the MFAC/BMPprogramtopreventtrashfromaccumulatingindeleteriousamountsthatcausenuisanceoradverselyaffectbeneficialusesbetweencollections,proposalstoenhanceBMPs,andarevisedMFACforExecutiveOfficerreview.
Responsible Jurisdictions may coordinate their TMRP activities for the Ventura River Estuary.
Margin of Safety Zero is a conservative numeric target which contains an implicit margin of safety.
Seasonal Variations and Critical Conditions
Discharge of trash from the conveyances occurs primarily during or shortly after a major rain event. Discharge of trash from nonpoint sources occurs during all seasons, but can be increased during or shortly afterhighwindevents,whicharedefinedasperiodsofwindadvisoriesissued by the National Weather Service, and the period from May 15 to October 15, or during and after public events that occur in the Ventura County Fairground.

Basin Plan 7-�0� Total Maximum Daily LoadsUpdated September 20��
Table 7-25.2a Ventura River Estuary Trash TMDL: Implementation Schedule - Point SourcesTaskNo. Task Responsible Jurisdiction Date
1 Submit Trash Monitoring and Reporting Plan, including a plan for definingthetrashbaselineWLAandaproposeddefinitionof“major rain event”.
City of Ventura, Ventura County, Ventura County Watershed Protection District, California Department of Food and Agriculture,andCaltrans.
6 months from effective date of TMDL. If a plan is not approved by the ExecutiveOfficerwithin 9 months, the Executive Officerwillestablishan appropriate monitoring plan.
2 Implement Trash Monitoring and Reporting Plan.
City of Ventura, Ventura County, Ventura County Watershed Protection District, California Department of Food and Agriculture,andCaltrans.
6 months from receipt of letter of approval from Regional Board ExecutiveOfficer,or the date a plan is established by the ExecutiveOfficer.
3 Submit results of Trash Monitoring and Reporting Plan, recommend trash baselineWLA,andpropose prioritization of Full Capture System installation or implementation of other measures to attain the required trash reduction.
City of Ventura, Ventura County, Ventura County Watershed Protection District, California Department of Food and Agriculture,andCaltrans.
2 years from receipt of letter of approval for the Trash Monitoring and Reporting Plan from Regional Board ExecutiveOfficer.
4 Installation of Full Capture Systems or other measures to achieve 20% reduction of trash from Baseline WLA*.
City of Ventura, Ventura County, Ventura County Watershed Protection District, California Department of Food and Agriculture,andCaltrans.
Four years from effective date of TMDL.
5 Installation of Full Capture Systems or other measures to achieve40%reductionof trash from Baseline WLA*.
City of Ventura, Ventura County, Ventura County Watershed Protection District, California Department of Food and Agriculture,andCaltrans.
Five years from effective date of TMDL.
6 Evaluate the effectiveness of Full Capture Systems or other measures, and reconsidertheWLA*.
Regional Board. Five years from effective date of TMDL.
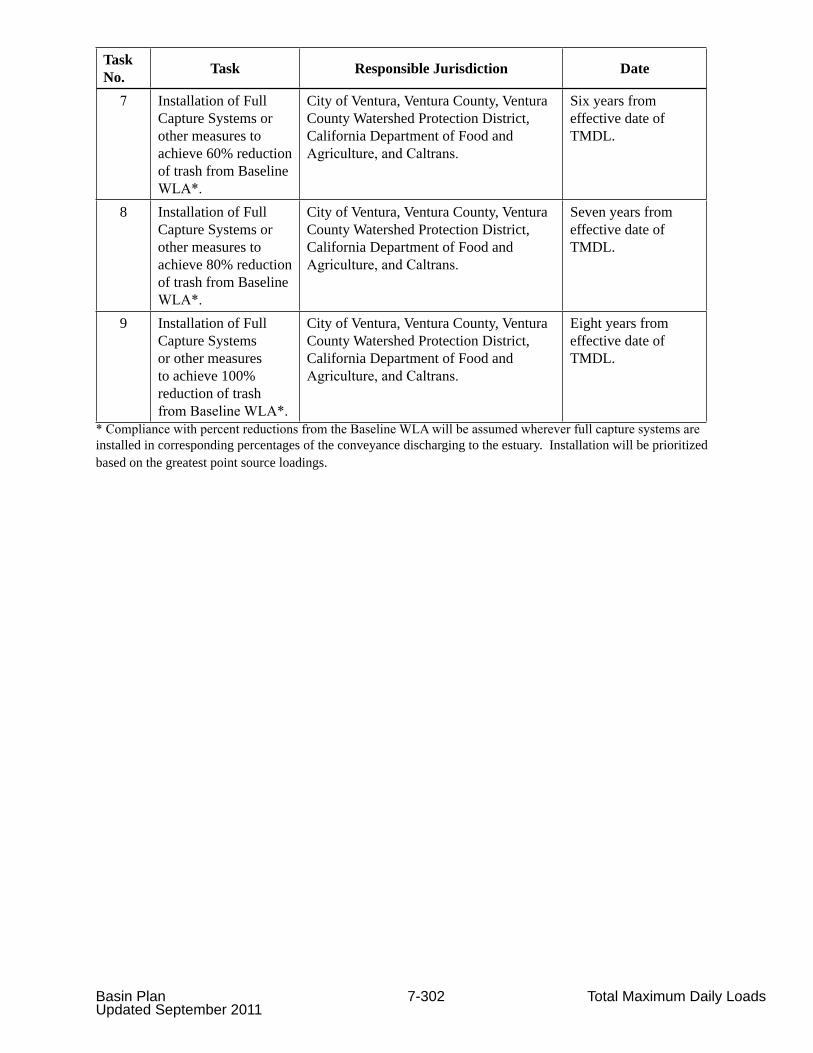
Basin Plan 7-�02 Total Maximum Daily LoadsUpdated September 20��
TaskNo. Task Responsible Jurisdiction Date
7 Installation of Full Capture Systems or other measures to achieve 60% reduction of trash from Baseline WLA*.
City of Ventura, Ventura County, Ventura County Watershed Protection District, California Department of Food and Agriculture,andCaltrans.
Six years from effective date of TMDL.
8 Installation of Full Capture Systems or other measures to achieve 80% reduction of trash from Baseline WLA*.
City of Ventura, Ventura County, Ventura County Watershed Protection District, California Department of Food and Agriculture,andCaltrans.
Seven years from effective date of TMDL.
9 Installation of Full Capture Systems or other measures to achieve 100% reduction of trash fromBaselineWLA*.
City of Ventura, Ventura County, Ventura County Watershed Protection District, California Department of Food and Agriculture,andCaltrans.
Eight years from effective date of TMDL.
*CompliancewithpercentreductionsfromtheBaselineWLAwillbeassumedwhereverfullcapturesystemsareinstalled in corresponding percentages of the conveyance discharging to the estuary. Installation will be prioritized based on the greatest point source loadings.

Basin Plan 7-�0� Total Maximum Daily LoadsUpdated September 20��
Table 7-25.2b Ventura River Estuary Trash TMDL: Implementation Schedule - Minimum Frequency of Assessment and Collection Program *
TaskNo.
Task Responsible Jurisdiction Date
1 Conditional Waiver in effect.
City of Ventura, Ventura County, Ventura County Watershed Protection District, Caltrans, California Department of Parks and Recreation, California Department of Food andAgriculture,andAgriculturalDischargers.
Regional Board adoption of TMDL.
2 Submit Notice of Intent to Comply with Conditional Waiver of Discharge Requirements, including MFAC/BMPProgramand Trash Monitoring and Reporting Plan.
City of Ventura, Ventura County, Ventura County Watershed Protection District, Caltrans, California Department of Parks and Recreation, California Department of Food andAgriculture,andAgriculturalDischargers.
Six months from TMDL effective date.
3 ImplementMFAC/BMPProgram.
City of Ventura, Ventura County, Ventura County Watershed Protection District, Caltrans, California Department of Parks and Recreation, California Department of Food andAgriculture,andAgriculturalDischargers.
Six months from receipt of Notice ofAcceptancefrom Regional Board Executive Officer.
4 Submit annual TMRP reports including proposal for revising MFAC/BMPforExecutiveOfficerapproval.
City of Ventura, Ventura County, Ventura County Watershed Protection District, Caltrans, California Department of Parks and Recreation, California Department of Food andAgriculture,andAgriculturalDischargers.
Two years from effective date of TMDL, and annually thereafter.
5 Reconsideration of Trash TMDL based on evaluation of effectivenessofMFAC/BMP program.
Regional Board. Five years from effective date of TMDL.
*AtTask3,allResponsibleJurisdictionsmustbeattainingthezerotrashtargetaftereachrequiredtrashassessmentandcollectionevent.AtTask4,allResponsibleJurisdictionsmustdemonstratefullcomplianceandattainmentofthezerotrashtarget’srequirementthattrashisnotaccumulatingindeleteriousamountsbetweentherequiredtrashassessmentandcollectionevents.BasedonResponsibleJurisdictionmonitoringreports,theExecutiveOfficermayadjusttheminimumfrequency of assessment and collection as necessary to ensure compliance between the required trash assessment and collection events.

Basin Plan 7-�04 Total Maximum Daily LoadsUpdated September 20��
Basin Plan 7-�05 Total Maximum Daily LoadsUpdated September 20��
7-26 Machado Lake Trash TMDL
This TMDL was adopted by: TheRegionalWaterQualityControlBoardonJune7,2007.
This TMDL was approved by: TheStateWaterResourcesControlBoardonDecember4,2007. TheOfficeofAdministrativeLawonFebruary8,2008. TheU.S.EnvironmentalProtectionAgencyonFebruary27,2008.
The effective date of this TMDL is: March 6, 2008.
TheelementsoftheTMDLarepresentedinTable7-26.1andtheImplementationPlaninTables7-26.2aand7-26.2b.
Table 7-26.1 Machado Lake Trash TMDL: ElementsElement Machado Lake Trash TMDLProblem Statement Current levels of trash discharges into Machado Lake violate water
qualityobjectivesandareimpairingbeneficialuses.Relevantwaterquality objectives include Floating Material and Solid, Suspended, orSettleableMaterials.Thefollowingdesignatedbeneficialusesareimpacted by trash: municipal and domestic supply (MUN); contact water recreation (REC-1); non-contact water recreation (REC-2); warm freshwaterhabitat(WARM);wildlifehabitat(WILD),rare,threatened,orendangeredspecies(RARE),andwetlandhabitat(WET).
Numeric Target (Interpretation of the narrative water quality objective, used to calculate the load allocations)
ZerotrashinMachadoLake,andontheshoreline.Zeroisdefinedas (1) for nonpoint sources, no trash immediately following each assessment and collection event consistent with an established MinimumFrequencyofAssessmentandCollectionProgram(MFACProgram).TheMFACProgramisestablishedatanintervalthatprevents trash from accumulating in deleterious amounts that cause nuisanceoradverselyaffectbeneficialusesbetweencollections,and(2)for point sources, zero trash discharged into Machado Lake and on the shoreline.
Source Analysis Litter from adjacent land areas, roadways and direct dumping and deposition are sources of trash to Machado Lake. Point sources such as storm drains are also sources of trash discharged to Machado Lake.
Loading Capacity Zero,asdefinedintheNumericTarget.

Basin Plan 7-�06 Total Maximum Daily LoadsUpdated September 20��
Element Machado Lake Trash TMDLWaste Load Allocations (for point sources)
WasteLoadAllocations(WLAs)areassignedtotheCaliforniaDepartment of Transportation (Caltrans) and permittees under the LosAngelesCountyMunicipalSeparateStormSewerSystem(MS4)NPDESpermit,includingLosAngelesCounty,LosAngelesFloodControlDistrict,andtheCitiesofCarson,Lomita,LosAngeles,Palos Verdes Estates, Rancho Palos Verdes, Redondo Beach, RollingBeach, Rolling Hills, Rolling Hills Estates, and Torrance.
WLAsarezerotrash.WLAsmaybeissuedtoadditionalresponsiblejurisdictionsinthefutureunderPhase2oftheUSEPAStormwaterPermitting Program, or other applicable regulatory programs.
Load Allocations (for nonpoint sources)
LoadAllocations(LAs)areassignedtotheCityofLosAngeles.LAsarezerotrash.LAsmaybeissuedtoadditionalresponsiblejurisdictionsin the future under applicable regulatory programs.
Implementation Implementation of the trash TMDL for Machado Lake includes structural and non-structural best management practices (BMPs) and a programofminimumfrequencyofassessmentandcollection(MFAC)to address point and nonpoint trash sources. Point Sources
WLAsshallbeimplementedthroughstormwaterpermitsandviatheauthorityvestedintheExecutiveOfficerbysection13267ofthePorter-CologneWaterQualityControlAct(WaterCodesection13000etseq.).
IfpointsourcedischargerscomplywithWLAsbyimplementinganExecutiveOfficercertifiedfullcapturesystemonconveyancesthatdischarge to Machado Lake through a progressive implementation schedule of full capture devices, they will be deemed in compliance withtheWLA.
Incertaincircumstances,(ifapprovedbytheExecutiveOfficer),pointsourcedischargersmayalternativelycomplywithWLAsbyimplementing a program for minimum frequency of assessment and collectioninconjunctionwithbestmanagementpractices(MFAC/BMPs).

Basin Plan 7-�07 Total Maximum Daily LoadsUpdated September 20��
Element Machado Lake Trash TMDLImplementation (continued) 1.CompliancewiththefinalWLAmaybeachievedthroughan
adequately sized and maintained full capture system, once the ExecutiveOfficerhascertifiedthatthesystemmeetsthefollowingminimumcriteria.Afullcapturesystem,ataminimum,consistsofany device or series of devices that traps all particles retained by a 5 mm mesh screen and has a design treatment capacity of not less than thepeakflowrate(Q)resultingfromaone-year,one-hour,storminthe sub-drainage area. The rational equation is used to compute the peakflowrate: Q=C×I×A,whereQ=designflowrate(cubicfeetpersecond,cfs); C=runoffcoefficient(dimensionless); I=designrainfallintensity(inchesperhour);and A=subdrainagearea(acres).
Point sources that choose to comply via a full capture system, must demonstrate a phased implementation of full capture devices over an 8-yearperioduntilthefinalWLAofzeroisattained.Zerowillbedeemed to have been met if full capture systems have been installed on all conveyances discharging to Machado Lake.
Irrespective of whether point sources employ a full capture system, they maycomplywiththeWLAinanylawfulmanner.
2.CompliancethroughanMFACprograminconjunctionwithBMPsmay be proposed to the Regional Board for incorporation into therelevantNPDESpermit.TheMFACprogrammustincluderequirements equivalent to those described in the Conditional Waiver setforthbelow.AgenciesthatareresponsibleforbothpointandnonpointsourceswillbedeemedincompliancewithboththeWLAsandLAsifaMFAC/BMPprogram,approvedbytheExecutiveOfficer,isimplemented.
Nonpoint Sources
LAsshallbeimplementedthrougheither(1)aconditionalwaiverfrom waste discharge requirements, or (2) an alternative program implemented through waste discharge requirements or an individual waiver or another appropriate order of the Regional Board.
Non-pointsourcedischargersmayachievecompliancewiththeLAsbyimplementingaMFAC/BMPprogramapprovedbytheExecutiveOfficer.Responsiblejurisdictionsthatareresponsibleforbothpointand nonpoint sources will be deemed in compliance with both the WLAsandLAsifanMFAC/BMPprogram,approvedbytheExecutiveOfficer,isimplemented.

Basin Plan 7-�08 Total Maximum Daily LoadsUpdated September 20��
Element Machado Lake Trash TMDLImplementation (continued) 1) Conditional Waiver: Pursuant to Water Code section 13269, waste
discharge requirements are waived for any responsible jurisdiction that implementsaMFAC/BMPProgramwhich,tothesatisfactionoftheExecutiveOfficer,meetsthefollowingcriteria:
a) TheMFAC/BMPProgramincludesaninitialminimumfrequency of trash assessment and collection and suite of structuraland/ornonstructuralBMPs.TheMFAC/BMPprogram shall include collection and disposal of all trash found in the water and on the shoreline. Responsible jurisdictions shall implement an initial suite of BMPs based on current trash management practices in land areas that are found to be sources of trash to Machado Lake. For Machado Lake, the initial minimum frequency shall be set as follows:
1. Five days per week on the shoreline and in the Ken MalloyHarborRegionalPark,asdefinedintheExecutiveOfficerapprovedTrashMonitoringandReporting Plan (TMRP).
2. Twice per week on waters of Machado Lake.
b) TheMFAC/BMPProgramincludesreasonableassurancesthatit will be implemented by the responsible jurisdiction.
c) TheMFAC/BMPProgramincludesaTrashMonitoringandReporting Plan, as described below, and a requirement that the responsible jurisdictions will self-report any non-compliance with its provisions. The results and report of the Trash Monitoring and Reporting Plan must be submitted to Regional Board on an annual basis.
d) MFACprotocolsmaybebasedonSWAMPprotocolsforrapid trash assessment, or alternative protocols proposed by dischargersandapprovedbytheExecutiveOfficer.
e) ImplementationoftheMFAC/BMPprogramshouldincludeaHealthandSafetyPlantoprotectpersonnel.TheMFAC/BMPshall not require responsible jurisdictions to access and collect trash from areas where personnel are prohibited.

Basin Plan 7-�09 Total Maximum Daily LoadsUpdated September 20��
Element Machado Lake Trash TMDLImplementation (continued) TheExecutiveOfficermayapproveorrequirearevisedassessmentand
collectionfrequencyanddefinitionofthecriticalconditionsunderthewaiver:
(a) To prevent trash from accumulating in deleterious amounts thatcausenuisanceoradverselyaffectbeneficialusesbetweencollections;
(b) Toreflecttheresultsoftrashassessmentandcollection;(c) If the amount of trash collected does not show a decreasing
trend, where necessary, such that a shorter interval between collections is warranted; or
(d) If the amount of trash collected is decreasing such that a longer interval between collections is warranted.
Attheendoftheimplementationperiod,arevisedMFAC/BMPprogrammayberequirediftheExecutiveOfficerdeterminesthattheamount of trash accumulating between collections is causing nuisance orotherwiseadverselyaffectingbeneficialuses.
Withregardto(a),(b)or(c),above,theExecutiveOfficerisauthorizedto allow responsible jurisdictions to implement additional structural or non-structural BMPs in lieu of modifying the monitoring frequency.
AnywaiversimplementingtheTMDLshallexpirepursuanttoWaterCodesection13269fiveyearsaftertheeffectivedateofthisTMDL,unless reissued. The Regional Board may reissue this waiver through an order consistent herewith, instead of readopting these regulatory provisions.
(2)Alternatively,responsiblejurisdictionsmaypropose,ortheRegional Board may impose, an alternative program which would be implemented through waste discharge requirements an individual waiver, a cleanup and abatement order, or any other appropriate order or orders, provided the program is consistent with the assumptions and requirementsofthereductionsdescribedinTable7-26.2b,below.
Within six months of the effective date of this TMDL, the Executive Officershallrequireresponsiblejurisdictionstosubmiteitheranoticeof intent to be regulated under the conditional waiver with their proposedMFAC/BMPProgramandTrashMonitoringandReportingPlan (TMRP), or a report of waste discharge.

Basin Plan 7-��0 Total Maximum Daily LoadsUpdated September 20��
Element Machado Lake Trash TMDLMonitoring and Reporting Plan
ResponsiblejurisdictionswilldevelopaTMRPforExecutiveOfficerapproval that describes the methodologies that will be used to assess and monitor trash in Machado Lake and/or within responsible jurisdiction land areas. The TMRP shall include a plan to establish thetrashBaselineWLAsfornon-Caltransentities,oranalternativetothe default trash baseline for Caltrans to prioritize installation of full capturedevices.ThedefaulttrashbaselineWLAforCaltransis6677.4gallons per square mile per year.
Requirements for the TMRP shall include, but are not limited to, assessmentandquantificationoftrashcollectedfromthesurfacesandshoreline of Machado Lake or from responsible jurisdiction land areas. The monitoring plan shall provide details of the frequency, location, and reporting of trash monitoring. Responsible jurisdictions shall propose a metric (e.g., weight, volume, pieces of trash) to measure the amount of trash in Machado Lake and on the land area surrounding Machado Lake,asdefinedintheExecutiveOfficerapprovedTMRP.
The TMRP shall include a prioritization of areas that have the highest trash generation rates. The TMRP shall give preference to this prioritization when scheduling the installation of full capture devices, BMPs, or trash collection programs.
The TMRP shall also include an evaluation of effectiveness of the MFAC/BMPprogramtopreventtrashfromaccumulatingindeleteriousamountsthatcausenuisanceoradverselyaffectbeneficialusesbetweencollections,proposalstoenhanceBMPs,andarevisedMFACforExecutiveOfficerreview.
Responsible Jurisdictions may coordinate their TMRP activities for Machado Lake.
Margin of Safety Zero is a conservative numeric target which contains an implicit margin of safety.
Seasonal Variations and Critical Conditions
Discharge of trash from the conveyances occurs primarily during or shortly after a major rain event. Discharge of trash from nonpoint sources occurs during all seasons, but can be increased during or shortly afterhighwindevents,whicharedefinedasperiodsofwindadvisoriesissued by the National Weather Service, and the period from May 15 to October 15.

Basin Plan 7-��� Total Maximum Daily LoadsUpdated September 20��
Table 7-26.2a Machado Lake Trash TMDL: Implementation Schedule - Point SourcesTaskNo. Task Responsible Jurisdiction Date
1 Submit Trash Monitoring and Reporting Plan, including a plan for definingthetrashbaselineWLAandaproposeddefinitionof“major rain event”.
California Department of Transportation (Caltrans) and Municipal Separate Storm SewerSystem(MS4)Permitteesincluding:LosAngelesCounty,LosAngelesCountyFloodControl District, and the Cities of Carson, Lomita,LosAngeles,PalosVerdesEstates,Rancho Palos Verdes, Redondo Beach, Rolling Hills, Rolling Hills Estates, and Torrance
6 months from effective date of TMDL. If a plan is not approved by the ExecutiveOfficerwithin 9 months, the Executive Officerwillestablishan appropriate monitoring plan.
2 Implement Trash Monitoring and Reporting Plan.
California Department of Transportation (Caltrans) and Municipal Separate Storm SewerSystem(MS4)Permitteesincluding:LosAngelesCounty,LosAngelesCountyFloodControl District, and the Cities of Carson, Lomita,LosAngeles,PalosVerdesEstates,Rancho Palos Verdes, Redondo Beach, Rolling Hills, Rolling Hills Estates, and Torrance
6 months from receipt of letter of approval from Regional Board ExecutiveOfficer,or the date a plan is established by the ExecutiveOfficer.
3 Submit results of Trash Monitoring and Reporting Plan, recommend trash baselineWLA,andpropose prioritization of Full Capture System installation or implementation of other measures to attain the required trash reduction.
California Department of Transportation (Caltrans) and Municipal Separate Storm SewerSystem(MS4)Permitteesincluding:LosAngelesCounty,LosAngelesCountyFloodControl District, and the Cities of Carson, Lomita,LosAngeles,PalosVerdesEstates,Rancho Palos Verdes, Redondo Beach, Rolling Hills, Rolling Hills Estates, and Torrance
2 years from receipt of letter of approval for the Trash Monitoring and Reporting Plan from Regional Board ExecutiveOfficer.
4 Installation of Full Capture Systems or other measures to achieve 20% reduction of trash from Baseline WLA*.
California Department of Transportation (Caltrans) and Municipal Separate Storm SewerSystem(MS4)Permitteesincluding:LosAngelesCounty,LosAngelesCountyFloodControl District, and the Cities of Carson, Lomita,LosAngeles,PalosVerdesEstates,Rancho Palos Verdes, Redondo Beach, Rolling Hills, Rolling Hills Estates, and Torrance
Four years from effective date of TMDL.
5 Installation of Full Capture Systems or other measures to achieve40%reductionof trash from Baseline WLA*.
California Department of Transportation (Caltrans) and Municipal Separate Storm SewerSystem(MS4)Permitteesincluding:LosAngelesCounty,LosAngelesCountyFloodControl District, and the Cities of Carson, Lomita,LosAngeles,PalosVerdesEstates,Rancho Palos Verdes, Redondo Beach, Rolling Hills, Rolling Hills Estates, and Torrance
Five years from effective date of TMDL.
Basin Plan 7-��2 Total Maximum Daily LoadsUpdated September 20��
TaskNo. Task Responsible Jurisdiction Date
6 Evaluate the effectiveness of Full Capture Systems or other measures, and reconsidertheWLA*.
Regional Board. Five years from effective date of TMDL.
7 Installation of Full Capture Systems or other measures to achieve 60% reduction of trash from Baseline WLA*.
California Department of Transportation (Caltrans) and Municipal Separate Storm SewerSystem(MS4)Permitteesincluding:LosAngelesCounty,LosAngelesCountyFloodControl District, and the Cities of Carson, Lomita,LosAngeles,PalosVerdesEstates,Rancho Palos Verdes, Redondo Beach, Rolling Hills, Rolling Hills Estates, and Torrance
Six years from effective date of TMDL.
8 Installation of Full Capture Systems or other measures to achieve 80% reduction of trash from Baseline WLA*.
California Department of Transportation (Caltrans) and Municipal Separate Storm SewerSystem(MS4)Permitteesincluding:LosAngelesCounty,LosAngelesCountyFloodControl District, and the Cities of Carson, Lomita,LosAngeles,PalosVerdesEstates,Rancho Palos Verdes, Redondo Beach, Rolling Hills, Rolling Hills Estates, and Torrance
Seven years from effective date of TMDL.
9 Installation of Full Capture Systems or other measures to achieve 100% reduction of trash fromBaselineWLA*.
California Department of Transportation (Caltrans) and Municipal Separate Storm SewerSystem(MS4)Permitteesincluding:LosAngelesCounty,LosAngelesCountyFloodControl District, and the Cities of Carson, Lomita,LosAngeles,PalosVerdesEstates,Rancho Palos Verdes, Redondo Beach, Rolling Hills, Rolling Hills Estates, and Torrance
Eight years from effective date of TMDL.
*CompliancewithpercentreductionsfromtheBaselineWLAwillbeassumedwhereverfullcapturesystemsareinstalledin corresponding percentages of the conveyance discharging to Machado Lake. Installation will be prioritized based on the greatest point source loadings.

Basin Plan 7-��� Total Maximum Daily LoadsUpdated September 20��
Table 7-26.2b Machado Lake Trash TMDL: Implementation Schedule - Minimum Frequency of Assessment and Collection Program *
TaskNo. Task Responsible Jurisdiction Date
1 Conditional Waiver in effect.
CityofLosAngeles Regional Board adoption of TMDL.
2 Submit Notice of Intent to Comply with Conditional Waiver of Discharge Requirements, includingMFAC/BMP Program and Trash Monitoring and Reporting Plan.
CityofLosAngeles Six months from TMDL effective date.
3 ImplementMFAC/BMP Program.
CityofLosAngeles Six months from receipt of Notice of AcceptancefromRegional Board ExecutiveOfficer.
4 Submit annual TMRP reports including proposal for revising MFAC/BMPforExecutiveOfficerapproval.
CityofLosAngeles Two years from effective date of TMDL, and annually thereafter.
5 Reconsideration of Trash TMDL based on evaluation of effectiveness of MFAC/BMPprogram.
Regional Board. Five years from effective date of TMDL.
*AtTask3,allResponsibleJurisdictionsmustbeattainingthezerotrashtargetaftereachrequiredtrashassessmentandcollectionevent.AtTask4,allResponsibleJurisdictionsmustdemonstratefullcomplianceandattainmentofthezerotrashtarget’srequirementthattrashisnotaccumulatingindeleteriousamountsbetweentherequiredtrashassessmentandcollectionevents.BasedonResponsibleJurisdictionmonitoringreports,theExecutiveOfficermayadjust the minimum frequency of assessment and collection as necessary to ensure compliance between the required trash assessment and collection events.

Basin Plan 7-��4 Total Maximum Daily LoadsUpdated September 20��

Basin Plan 7-��5 Total Maximum Daily LoadsUpdated September 20��
7-27 Legg Lake Trash TMDL
This TMDL was adopted by: TheRegionalWaterQualityControlBoardonJune7,2007.
This TMDL was approved by: TheStateWaterResourcesControlBoardonDecember4,2007. TheOfficeofAdministrativeLawonFebruary5,2008. TheU.S.EnvironmentalProtectionAgencyonFebruary27,2008.
The effective date of this TMDL is: March 6, 2008.
TheelementsoftheTMDLarepresentedinTable7-27.1andtheImplementationPlaninTables7-27.2aand7-27.2b.
Table 7-27.1 Legg Lake Trash TMDL: ElementsElement Legg Lake Trash TMDLProblem Statement Current levels of trash discharges into Legg Lake violate water quality
objectivesandareimpairingbeneficialuses.Relevantwaterqualityobjectives include Floating Material and Solid, Suspended, or Settleable Materials.Thefollowingdesignatedbeneficialusesareimpactedby trash: water contact recreation (REC 1) and non-contact water recreation(REC2),warmfreshwaterhabitat(WARM),coldfreshwater(COLD), wildlife habitat (WILD), and wetland habitat (WET).
Numeric Target (Interpretation of the narrative water quality objective, used to calculate the load allocations)
ZerotrashinLeggLakeanditsshoreline.Zeroisdefinedas(1)fornonpoint sources, no trash immediately following each assessment and collection event consistent with an established Minimum Frequency ofAssessmentandCollectionProgram(MFACProgram).TheMFACProgramisestablishedatanintervalthatpreventstrashfromaccumulating in deleterious amounts that cause nuisance or adversely affectbeneficialusesbetweencollections,and(2)forpointsources,zero trash discharged into Legg Lake and its shoreline.
Source Analysis Litter from adjacent land areas, roadways and direct dumping and deposition are sources of trash to Legg Lake. Point sources such as storm drains are also sources of trash discharged to Legg Lake.
Loading Capacity Zero,asdefinedintheNumericTarget.
Waste Load Allocations (for point sources)
WasteLoadAllocations(WLAs)areassignedtotheCaliforniaDepartmentofTransportation,andpermitteesundertheLosAngelesCountyMunicipalSeparateStormSewerSystem(MS4)NPDESpermit,includingtheLosAngelesCountyFloodControlDistrict,theCountyofLosAngeles,andtheCitiesofElMonteandSouthElMonte.WLAsarezerotrash.WLAsmaybeissuedtoadditionalresponsiblejurisdictionsinthefutureunderPhase2oftheUSEPAStormwaterPermitting Program, or other applicable regulatory programs.
Load Allocations (for nonpoint sources)
LoadAllocations(LAs)areassignedtotheCountyofLosAngeles.LAsarezerotrash.LAsmaybeissuedtoadditionalresponsiblejurisdictions in the future under applicable regulatory programs.

Basin Plan 7-��6 Total Maximum Daily LoadsUpdated September 20��
Element Legg Lake Trash TMDLImplementation Implementation of the trash TMDL for Legg Lake includes structural
and non-structural best management practices (BMPs) and a program ofminimumfrequencyofassessmentandcollection(MFAC)toaddresspoint and nonpoint trash sources.
Point Sources
WLAsshallbeimplementedthroughstormwaterpermitsandviatheauthorityvestedintheExecutiveOfficerbysection13267ofthePorter-CologneWaterQualityControlAct(WaterCodesection13000etseq.).
IfpointsourcedischargerscomplywithWLAsbyimplementinganExecutiveOfficercertifiedfullcapturesystemonconveyancesthatdischarge to Legg Lake through a progressive implementation schedule of full capture devices, they will be deemed in compliance with the WLA.
Incertaincircumstances(ifapprovedbytheExecutiveOfficer),pointsourcedischargersmayalternativelycomplywithWLAsbyimplementing a program for minimum frequency of assessment and collectioninconjunctionwithbestmanagementpractices(MFAC/BMPs).
1.CompliancewiththefinalWLAmaybeachievedthroughanadequately sized and maintained full capture system, once the ExecutiveOfficerhascertifiedthatthesystemmeetsthefollowingminimumcriteria.Afullcapturesystem,ataminimum,consistsofany device or series of devices that traps all particles retained by a 5 mm mesh screen and has a design treatment capacity of not less than thepeakflowrate(Q)resultingfromaone-year,one-hour,storminthe sub-drainage area. The rational equation is used to compute the peakflowrate: Q=C×I×A,whereQ=designflowrate(cubicfeetpersecond,cfs); C=runoffcoefficient(dimensionless); I=designrainfallintensity(inchesperhour);and A=subdrainagearea(acres).
Point sources that choose to comply via a full capture system, must demonstrate a phased implementation of full capture devices over an 8-yearperioduntilthefinalWLAofzeroisattained.Zerowillbedeemed to have been met if full capture systems have been installed on all conveyances discharging to Legg Lake.

Basin Plan 7-��7 Total Maximum Daily LoadsUpdated September 20��
Element Legg Lake Trash TMDLImplementation (continued) Irrespective of whether point source dischargers employ a full capture
system,theymaycomplywiththeWLAinanylawfulmanner.
2.CompliancethroughaMFACprograminconjunctionwithBMPsmay be proposed to the Regional Board for incorporation into therelevantNPDESpermit.TheMFACprogrammustincluderequirements equivalent to those described in the Conditional Waiver setforthbelow.AgenciesthatareresponsibleforbothpointandnonpointsourceswillbedeemedincompliancewithboththeWLAsandLAsifaMFAC/BMPprogram,approvedbytheExecutiveOfficer,isimplemented.
Nonpoint Sources
LAsshallbeimplementedthrougheither(1)aconditionalwaiverfrom waste discharge requirements, or (2) an alternative program implemented through waste discharge requirements or an individual waiver or another appropriate order of the Regional Board.
Non-pointsourcedischargersmayachievecompliancewiththeLAsbyimplementinganMFAC/BMPprogramapprovedbytheExecutiveOfficer.Responsiblejurisdictionsthatareresponsibleforbothpointand nonpoint sources will be deemed in compliance with both the WLAsandLAsifaMFAC/BMPprogram,approvedbytheExecutiveOfficer,isimplemented.
1) Conditional Waiver: Pursuant to Water Code section 13269, waste discharge requirements are waived for any responsible jurisdiction that implementsaMFAC/BMPProgramwhich,tothesatisfactionoftheExecutiveOfficer,meetsthefollowingcriteria:
a) TheMFAC/BMPProgramincludesaninitialminimumfrequency of trash assessment and collection and suite of structuraland/ornonstructuralBMPs.TheMFAC/BMPprogram shall include collection and disposal of all trash found in the water and shoreline. Responsible jurisdictions shall implement an initial suite of BMPs based on current trash management practices in land areas that are found to be sources of trash to Legg Lake. For Legg Lake, the initial minimum frequency shall be set as follows:
1. Five days per week on the shoreline and in the WhittierNarrowsRecreationParkArea,asdefinedintheExecutiveOfficerapprovedTrashMonitoring and Reporting Plan (TMRP).
2. Once per week on waters of Legg Lake.

Basin Plan 7-��8 Total Maximum Daily LoadsUpdated September 20��
Element Legg Lake Trash TMDLImplementation (continued) b) TheMFAC/BMPProgramincludesreasonableassurancesthat
it will be implemented by the responsible jurisdiction.
c) TheMFAC/BMPProgramincludesaTrashMonitoringandReporting Plan, as described below, and a requirement that the responsible jurisdictions will self-report any non-compliance with its provisions. The results and report of the Trash Monitoring and Reporting Plan must be submitted to Regional Board on an annual basis.
d) MFACprotocolsmaybebasedonSWAMPprotocolsforrapid trash assessment, or alternative protocols proposed by dischargersandapprovedbytheExecutiveOfficer.
e) ImplementationoftheMFAC/BMPprogramshouldincludeaHealthandSafetyProgramtoprotectpersonnel.TheMFAC/BMP program shall not require responsible jurisdictions to access and collect trash from areas where personnel are prohibited.
TheExecutiveOfficermayapproveorrequirearevisedassessmentandcollectionfrequencyanddefinitionofthecriticalconditionsunderthewaiver:
(a) To prevent trash from accumulating in deleterious amounts thatcausenuisanceoradverselyaffectbeneficialusesbetweencollections;
(b) Toreflecttheresultsoftrashassessmentandcollection;(c) If the amount of trash collected does not show a decreasing
trend, where necessary, such that a shorter interval between collections is warranted; or
(d) If the amount of trash collected is decreasing such that a longer interval between collections is warranted.
Attheendoftheimplementationperiod,arevisedMFAC/BMPprogrammayberequirediftheExecutiveOfficerdeterminesthattheamount of trash accumulating between collections is causing nuisance orotherwiseadverselyaffectingbeneficialuses.
Withregardto(a),(b)or(c),above,theExecutiveOfficerisauthorizedto allow responsible jurisdictions to implement additional structural or non-structural BMPs in lieu of modifying the monitoring frequency.

Basin Plan 7-��9 Total Maximum Daily LoadsUpdated September 20��
Element Legg Lake Trash TMDLImplementation (continued) AnywaiversimplementingtheTMDLshallexpirepursuanttoWater
Codesection13269fiveyearsaftertheeffectivedateofthisTMDL,unless reissued. The Regional Board may reissue this waiver through an order consistent herewith, instead of readopting these regulatory provisions.
(2)Alternatively,responsiblejurisdictionsmaypropose,ortheRegional Board may impose, an alternative program which would be implemented through waste discharge requirements an individual waiver, a cleanup and abatement order, or any other appropriate order or orders, provided the program is consistent with the assumptions and requirementsofthereductionsdescribedinTable7-27.2b,below.
Within six months of the effective date of this TMDL, the Executive Officershallrequireresponsiblejurisdictionstosubmiteitheranoticeof intent to be regulated under the conditional waiver with their proposedMFAC/BMPProgramandTrashMonitoringandReportingPlan (TMRP), or a report of waste discharge.
Monitoring and Reporting Plan
ResponsiblejurisdictionswilldevelopaTMRPforExecutiveOfficerapproval that describes the methodologies that will be used to assess and monitor trash in Legg Lake and/or within responsible jurisdiction land areas. The TMRP shall include a plan to establish the trash BaselineWLAsfornon-Caltransentities,oranalternativetothedefaulttrash baseline for Caltrans to prioritize installation of full capture devices.ThedefaulttrashbaselineWLAforCaltransis6677.4gallonsper square mile per year.
Requirements for the TMRP shall include, but are not limited to, assessmentandquantificationoftrashcollectedfromthesurfacesandshoreline of Legg Lake or from responsible jurisdiction land areas. The monitoring plan shall provide details of the frequency, location, and reporting of trash monitoring. Responsible jurisdictions shall propose a metric (e.g., weight, volume, pieces of trash) to measure the amount of trash in Legg Lake and on the land area surrounding Legg Lake, as definedintheExecutiveOfficerapprovedTMRP.
The TMRP shall include a prioritization of areas that have the highest trash generation rates. The TMRP shall give preference to this prioritization when scheduling the installation of full capture devices, BMPs, or trash collection programs.
The TMRP shall also include an evaluation of effectiveness of the MFAC/BMPprogramtopreventtrashfromaccumulatingindeleteriousamountsthatcausenuisanceoradverselyaffectbeneficialusesbetweencollections,proposalstoenhanceBMPs,andarevisedMFACforExecutiveOfficerreview.
Responsible Jurisdictions may coordinate their TMRP activities for Legg Lake.

Basin Plan 7-�20 Total Maximum Daily LoadsUpdated September 20��
Element Legg Lake Trash TMDLMargin of Safety Zero is a conservative numeric target which contains an implicit margin
of safety. Seasonal Variations and Critical Conditions
Discharge of trash from the conveyances occurs primarily during or shortly after a major rain event. Discharge of trash from nonpoint sources occurs during all seasons, but can be increased during or shortly afterhighwindevents,whicharedefinedasperiodsofwindadvisoriesissued by the National Weather Service.

Basin Plan 7-�2� Total Maximum Daily LoadsUpdated September 20��
Table 7-27.2a Legg Lake Trash TMDL: Implementation Schedule - Point SourcesTaskNo. Task Responsible Jurisdiction Date
1 Submit Trash Monitoring and Reporting Plan, including a plan for definingthetrashbaselineWLAandaproposeddefinitionof“major rain event”.
LosAngelesCounty,LosAngelesCountyFlood Control Districts, the Cities of El Monte and South El Monte, and Caltrans.
6 months from effective date of TMDL. If a plan is not approved by the ExecutiveOfficerwithin9 months, the Executive Officerwillestablishanappropriate monitoring plan.
2 Implement Trash Monitoring and Reporting Plan.
LosAngelesCounty,LosAngelesCountyFlood Control Districts, the Cities of El Monte and South El Monte, and Caltrans.
6 months from receipt of letter of approval from Regional Board Executive Officer,orthedateaplan is established by the ExecutiveOfficer.
3 Submit results of Trash Monitoring and Reporting Plan, recommend trash baselineWLA,andpropose prioritization of Full Capture System installation or implementation of other measures to attain the required trash reduction.
LosAngelesCounty,LosAngelesCountyFlood Control Districts, the Cities of El Monte and South El Monte, and Caltrans.
2 years from receipt of letter of approval for the Trash Monitoring and Reporting Plan from Regional Board Executive Officer.
4 Installation of Full Capture Systems or other measures to achieve 20% reduction of trash from Baseline WLA*.
LosAngelesCounty,LosAngelesCountyFlood Control Districts, the Cities of El Monte and South El Monte, and Caltrans.
Four years from effective date of TMDL.
5 Installation of Full Capture Systems or other measures to achieve40%reductionof trash from Baseline WLA*.
LosAngelesCounty,LosAngelesCountyFlood Control Districts, the Cities of El Monte and South El Monte, and Caltrans.
Five years from effective date of TMDL.
6 Evaluate the effectiveness of Full Capture Systems or other measures, and reconsidertheWLA*.
Regional Board. Five years from effective date of TMDL.

Basin Plan 7-�22 Total Maximum Daily LoadsUpdated September 20��
TaskNo. Task Responsible Jurisdiction Date
7 Installation of Full Capture Systems or other measures to achieve 60% reduction of trash from Baseline WLA*.
LosAngelesCounty,LosAngelesCountyFlood Control Districts, the Cities of El Monte and South El Monte, and Caltrans
Six years from effective date of TMDL.
8 Installation of Full Capture Systems or other measures to achieve 80% reduction of trash from Baseline WLA*.
LosAngelesCounty,LosAngelesCountyFlood Control Districts, the Cities of El Monte and South El Monte, and Caltrans
Seven years from effective date of TMDL.
9 Installation of Full Capture Systems or other measures to achieve 100% reduction of trash fromBaselineWLA*.
LosAngelesCounty,LosAngelesCountyFlood Control Districts, the Cities of El Monte and South El Monte, and Caltrans.
Eight years from effective date of TMDL.
*CompliancewithpercentreductionsfromtheBaselineWLAwillbeassumedwhereverfullcapturesystemsareinstalledin corresponding percentages of the conveyance discharging to the waterbody. Installation will be prioritized based on the greatest point source loadings.

Basin Plan 7-�2� Total Maximum Daily LoadsUpdated September 20��
Table 7-27.2b Legg Lake TMDL: Implementation Schedule - Minimum Frequency of Assessment and Collection Program *
TaskNo.
Task Responsible Jurisdiction Date
1 Conditional Waiver in effect.
LosAngelesCounty,CityofSouthElMonte, City of El Monte.
Regional Board adoption of TMDL.
2 Submit Notice of Intent to Comply with Conditional Waiver of Discharge Requirements, includingMFAC/BMP Program and Trash Monitoring and Reporting Plan.
LosAngelesCounty,CityofSouthElMonte, City of El Monte.
Six months from TMDL effective date.
3 ImplementMFAC/BMP Program.
LosAngelesCounty,CityofSouthElMonte, City of El Monte.
Six months from receipt ofNoticeofAcceptancefrom Regional Board ExecutiveOfficer.
4 Submit annual TMRP reports including proposal for revising MFAC/BMPforExecutiveOfficerapproval.
LosAngelesCounty,CityofSouthElMonte, City of El Monte.
Two years from effective date of TMDL, and annually thereafter.
5 Reconsideration of Trash TMDL based on evaluation of effectiveness of MFAC/BMPprogram.
Regional Board. Five years from effective date of TMDL.
*AtTask3,allResponsibleJurisdictionsmustbeattainingthezerotrashtargetaftereachrequiredtrashassessmentandcollectionevent.AtTask4,allResponsibleJurisdictionsmustdemonstratefullcomplianceandattainmentofthezerotrashtarget’srequirementthattrashisnotaccumulatingindeleteriousamountsbetweentherequiredtrashassessmentandcollectionevents.BasedonResponsibleJurisdictionmonitoringreports,theExecutiveOfficermayadjust the minimum frequency of assessment and collection as necessary to ensure compliance between the required trash assessment and collection events.

Basin Plan 7-�24 Total Maximum Daily LoadsUpdated September 20��

Basin Plan 7-�25 Total Maximum Daily LoadsUpdated September 20��
7-28 Harbor Beaches of Ventura County Bacteria TMDL
This TMDL was adopted by: TheRegionalWaterQualityControlBoardonNovember1,2007.
This TMDL was approved by: TheStateWaterResourcesControlBoardonOctober7,2008. TheOfficeofAdministrativeLawonDecember9,2008. TheU.S.EnvironmentalProtectionAgencyonDecember18,2008.
The effective date of this TMDL is: December 18, 2008.
The following table includes the elements of this TMDL.
Table 7-28.1. Harbor Beaches of Ventura County Bacteria TMDL: ElementsElement Findings and Regulatory ProvisionsProblem Statement Elevated bacteria indicator densities are causing impairment of the
watercontactrecreation(REC-1)beneficialuseatkiddieBeachand Hobie Beach. Kiddie and Hobie Beach are referenced in the Staff Report as the Harbor Beaches of Ventura County. Swimming in marine waters with elevated bacteria indicator densities has been associatedwithadversehealtheffects.Specifically,localandnationalepidemiological studies compel the conclusion that there is a causal relationship between adverse health effects and recreational water quality, as measured by bacteria indicator densities.
Numeric Target (Interpretation of the numeric water quality objective, used to calculate allocations)
The TMDL has a multi-part numeric target based on the bacteriological water quality objectives for marine water to protect the water contact recreation use. These targets are the most appropriate indicators of public health risk in recreational waters.
Bacteriological objectives are set forth in Chapter 3 of the Basin Plan. The objectives are based on four bacteria indicators and include both geometric mean limits and single sample limits. The Basin Plan objectives that serve as the numeric targets for this TMDL are:
1.Rolling30-dayGeometricMeanLimitsa. Total coliform density shall not exceed 1,000/100 ml.b. Fecal coliform density shall not exceed 200/100 ml.c. Enterococcus density shall not exceed 35/100 ml.
2. Single Sample Limitsa. Total coliform density shall not exceed 10,000/100 ml.b. Fecalcoliformdensityshallnotexceed400/100ml.c. Enterococcusdensityshallnotexceed104/100ml.d. Total coliform density shall not exceed 1,000/100 ml, if the
ratio of fecal-to-total coliform exceeds 0.1.
Basin Plan 7-�26 Total Maximum Daily LoadsUpdated September 20��
Element Findings and Regulatory ProvisionsNumeric Target (Interpretation of the numeric water quality objective, used to calculate allocations)(continued)
These objectives are based on health risk for marine recreational waters of 19 illnesses per 1,000 exposed individuals as set by the United States EnvironmentalProtectionAgency(USEPA,1986).FortheHarborBeaches of Ventura County, the targets will apply at existing monitoring sites, with samples taken at ankle to knee-high depths. These targets apply during both dry- and wet-weather.
This TMDL uses a “reference system/anti-degradation approach” which means that on the basis of historical exceedance levels at existing monitoring locations, including a local reference beach within the Los AnglesRegion,acertainnumberofdailyexceedancesofthesinglesample bacteria objectives are permitted. The allowable number of exceedance days is set such that (1) bacteriological water quality at any site is at least as good as at a designated reference site within the watershed and (2) there is no degradation of existing bacteriological water quality. This approach recognizes that there are natural sources of bacteria that may cause or contribute to exceedances of the bacteriological objectives and that it is not the intent of the Regional Board to require treatment or diversion of natural coastal creeks or to require treatment of natural sources of bacteria from undeveloped areas.
The geometric mean targets may not be exceeded at any time. The rolling 30-day geometric mean will be calculated on each sample day. For the single sample targets, each existing monitoring site is assigned an allowable number of exceedance days for three time periods (1) summerdry-weather(April1toOctober31),(2)winterdry-weather(November1toMarch31),and(3)wet-weather(definedasdayswith0.1 inch of rain or greater and the three days following the rain event.)
Source Analysis Bacteria sources in the Harbor Beaches of Ventura County include anthropogenic and non-anthropogenic sources and point and non-point sources. Each of these sources contributes to the elevated levels of bacteria indicator densities at the Harbor Beaches of Ventura County duringdry-andwet-weather.AsofDecember2006,therearefouractive, National Pollutant Discharge Elimination System (NPDES) permits or Waste Discharge Requirements (WDRs) for discharges to Channel Islands Harbor or Edison Canal.
DischargesfromtheStatewideMS4PermitfortheCaliforniaDepartmentofTransportation(Caltrans)areapotentiallysignificantsource of bacteria loading.
Discharges from general NPDES permits, individual NPDES permits, WDRs,theStatewideIndustrialStormWaterGeneralPermit,andtheStatewideConstructionActivityStormWaterGeneralPermitarenotexpectedtobeasignificantsourceofbacteria.

Basin Plan 7-�27 Total Maximum Daily LoadsUpdated September 20��
Element Findings and Regulatory ProvisionsSource Analysis (continued) WhileasourceidentificationstudyconductedattheChannelIslands
Harbor indicated that local non-point sources are the majority contributor in summer dry-weather, high bacteria densities and exceedances during wet-weather may be more indicative of urban and agricultural run-off.
Potential non-point sources of bacteria contamination at the Harbor Beaches of Ventura County include: marina activities such as waste disposal from boats, boat deck and slip washing, swimmer “wash-off”, and restaurant washouts; natural sources including birds, waterfowl, and feral cat; and agricultural sources.
Loading Capacity LoadingcapacityfortheHarborBeachesofVenturaCountyisdefinedin terms of bacteria indicator densities, which is the most appropriate for addressing public health risk, and is equivalent to the numeric targets,listedabove.Asthenumerictargetsshallbemetatthespecificsampling locations, which are representative of the corresponding beaches, no degradation or dilution allowance is provided.
Waste Load Allocations (for point sources)
Wasteloadallocations(WLAs)areexpressedasallowableexceedancedays.
The allowable number of exceedance days for a monitoring site for each time period is based on the more stringent of two criteria (1) exceedance days in the designated reference system and (2) exceedance days based on historical bacteriological data at the monitoring site. This ensures that bacteriological water quality is at least as good as that of a largely undeveloped system and that there is no degradation of existing water quality.
For each beach, allowable exceedance days are set on an annual basis as well as for three time periods. These three periods are:
1. Summerdry-weather(April1toOctober31)2. Winter dry-weather (November 1 to March 31) 3. Wet-weatherdays(definedasdaysof0.1inchofrainormoreplus
three days following the rain event)
For the Channel Islands Harbor Beaches, the County of Ventura, the Ventura County Watershed Protection District (VCWPD) and associatedMunicipalSeparateStormSewerSystem(MS4)permitteesin the Channel Islands Harbor subwatershed, the City of Oxnard, and CaltransareassignedWLAs.
AllWLAsforsummerdry-weathersinglesamplebacteriadensitiesatthe Harbor Beaches of Ventura County are zero (0) days of allowable exceedances.

Basin Plan 7-�28 Total Maximum Daily LoadsUpdated September 20��
Element Findings and Regulatory ProvisionsWaste Load Allocations (for point sources)(continued)
TheWLAfortherolling30-daygeometricmeanduringanytimeperiodor monitoring site at the Harbor Beaches of Ventura County is zero (0) days of allowable exceedances.
TheWLAforwinterdry-weatherandwet-weathersinglesamplebacteria densities for Kiddie Beach and Hobie Beach are listed in Table 7-28.2.
GeneralNPDESpermits,individualNPDESpermits,theStatewideIndustrialStormWaterGeneralPermit,theStatewideConstructionActivityStormWaterGeneralPermit,andWDRpermitteesintheChannelIslandsHarborsubwatershedareassignedWLAsofzero(0)days of allowable exceedances for all three time periods and for the single sample limits and the rolling 30-day geometric mean.
AnyfutureenrolleesunderageneralNPDESpermit,individualNPDESpermit,theStatewideIndustrialStormWaterGeneralPermit,theStatewideConstructionActivityStormWaterGeneralPermit,andWDRwillalsobesubjecttoaWLAofzero(0)daysofallowableexceedances.
TheHarborBeachesofVenturaCountyareassignedinterimWLAsupontheeffectivedateoftheTMDL.InterimWLAsforsinglesampleand the 30-day rolling geometric mean are expressed in terms of an exceedance day and listed below.
Single Sample Exceedances:
Summer Dry-WeatherLocation Daily Sampling Weekly Sampling
Kiddie Beach 54 8Hobie Beach 40 6
Winter Dry-WeatherLocation Daily Sampling Weekly Sampling
Kiddie Beach 23 4Hobie Beach 25 4
Wet-WeatherLocation Daily Sampling Weekly Sampling
Kiddie Beach 32 5Hobie Beach 38 6

Basin Plan 7-�29 Total Maximum Daily LoadsUpdated September 20��
Element Findings and Regulatory ProvisionsWaste Load Allocations (for point sources)(continued)
30-day Rolling Geometric Mean Exceedances:
Summer WeatherLocation Daily Sampling Weekly Sampling
Kiddie Beach 55 8Hobie Beach 80 12
Winter WeatherLocation Daily Sampling Weekly Sampling
Kiddie Beach 92 14Hobie Beach 91 13
Load Allocations (for non-point sources)
Loadallocations(LAs)areexpressedasthenumberofdailyorweeklysampledaysthatmayexceedthesinglesampletargetsidentifiedunder“Numeric Target” at a monitoring site.
For the Channel Islands Harbor Beaches, the County of Ventura and the CityofOxnardareassignedLAs.LAsmaybeassignedtoagriculturallands in the Channel Islands Harbor subwatershed during Regional Board Reconsideration based on monitoring data from the Conditional Waiver for Dischargers from Irrigated Lands.
AllLAsforsummerdry-weather,singlesamplebacteriadensitiesatthe Harbor Beaches of Ventura County are zero (0) days of allowable exceedances.TheLAforwinterdry-weatherandwet-weathersinglesample bacteria densities for Kiddie Beach and Hobie Beach are listed inTable7-28.2.
TheLAfortherolling30-daygeometricmeanduringanytimeperiodor monitoring site at the Harbor Beaches of Ventura County is zero (0) days of allowable exceedances.
TheHarborBeachesofVenturaCountyareassignedinterimLAsupontheeffectivedateoftheTMDL.InterimLAsforsinglesampleandthe30-day rolling geometric mean are expressed in terms of an exceedance day and listed below.

Basin Plan 7-��0 Total Maximum Daily LoadsUpdated September 20��
Element Findings and Regulatory ProvisionsLoad Allocations(for non-point sources)(continued)
Single Sample Exceedances:
Summer Dry-WeatherLocation Daily Sampling Weekly Sampling
Kiddie Beach 54 8Hobie Beach 40 6
Winter Dry-WeatherLocation Daily Sampling Weekly Sampling
Kiddie Beach 23 4Hobie Beach 25 4
Wet-WeatherLocation Daily Sampling Weekly Sampling
Kiddie Beach 32 5Hobie Beach 38 6
30-day Rolling Geometric Mean Exceedances:
Summer WeatherLocation Daily Sampling Weekly Sampling
Kiddie Beach 55 8Hobie Beach 80 12
Winter WeatherLocation Daily Sampling Weekly Sampling
Kiddie Beach 92 14Hobie Beach 91 13
Implementation The regulatory mechanisms used to implement the TMDL will include general NPDES permits, individual NPDES permits, WDRs, theStatewideIndustrialStormWaterGeneralPermit,theStatewideConstructionActivityStormWaterGeneralPermit,theConditionalWaiverforDischargersfromIrrigatedLands,theStatewideMS4Permit for Caltrans, and the authority contained in Sections 13263 and 13267oftheWaterCode.EachNPDESpermit,assignedaWLA,shallbe reopened or amended when the permit is reissued, in accordance withapplicablelaws,toincorporatetheapplicableWLAsasapermitrequirement.LAsfornon-pointsourceswillbeimplementedwithinthecontext of this TMDL.

Basin Plan 7-��� Total Maximum Daily LoadsUpdated September 20��
Element Findings and Regulatory ProvisionsImplementation (continued) This TMDL will be implemented in accordance with the
implementation schedule for the Harbor Beaches of Ventura County.
ThecomplianceandimplementationschedulesaredetailedinTable7-28.3.
Responsiblepartiesarenotspecificallyrequiredtoconductpilotprojects for Best Management Practices (BMPs), though conducting pilot projects is within their discretion. The Regional Board recognizes thelongdurationrequiredtoconductapilotproject.Assuch,timeis allocated in the implementation schedule for the option of piloting structural BMPs, which include but are not limited to enhanced circulation devices.
Special studies are not required for implementation of the TMDL, though conducting special studies is within the discretion of the responsible parties.
The Regional Board shall reconsider this TMDL four years after the effective date of the TMDL for the Harbor Beaches of Ventura County tore-evaluateWLAsandLAsbasedonmonitoringdata;tore-evaluateallowable exceedance levels, including whether the allowable number of exceedance days maybe adjusted based on a Ventura County rainfall record; to re-evaluate the selection of the reference beach if additional, appropriate reference beach options have been developed; to consider a natural source exclusion approach, subject to the antidegradation policy, if it can be demonstrated that such an approach is warranted by demonstration of the control of all anthropogenic sources of bacteria tothebeaches,anddemonstrationthatbeneficialusesarebeingmet;andtoassignLAstoagriculturallandsintheChanelIslandsHarborsubwatershed based on monitoring in the Conditional Waiver for Dischargers from Irrigated Lands.
Five years after the effective date of the TMDL, there shall be no allowable exceedances of the single sample limits, in excess of the allowableexceedanceslistedinTable7-28.2,atanymonitoringlocation at the Harbor Beaches of Ventura County during summer dry-weather, winter dry-weather, and the rolling 30-day geometric mean targets shall be achieved. Ten years after the effective date of the TMDL there shall be no allowable exceedances of the single sample limits,inexcessoftheallowableexceedanceslistedinTable7-28.2,at any monitoring location during dry-weather or wet-weather at the Harbor Beaches of Ventura County, and the rolling 30-day geometric mean targets shall be achieved.

Basin Plan 7-��2 Total Maximum Daily LoadsUpdated September 20��
Element Findings and Regulatory ProvisionsMargin of Safety Animplicitmarginofsafetyisincludedthroughseveralconservative
assumptions, such as the assumption that no dilution takes place betweentheon-shoresourcesandwheretheeffluentinitiallymixeswith the receiving water, and that bacteria degradation rates are notsufficienttoaffectbacteriadensitiesinthereceivingwater.Inaddition, an explicit margin of safety has been incorporated, as the load allocations will allow exceedances of the single sample targets no more than 5% of the time on an annual basis, based on the cumulative allocations for dry- and wet-weather. The Water Quality Control PolicyforDevelopingCalifornia’sCleanWaterActSection303(d)Listconcludes that there are water quality impairments using a binomial distribution method which lists waterbodies when the exceedances are between approximately 8 and 10 percent.
Seasonal Variations and Critical Conditions
Seasonal variations are addressed by developing separate waste load allocations for summer dry-weather, winter dry-weather, and wet-weather based on public health concerns and observed natural background levels of exceedance of bacteria indicators.
Historic monitoring data for the Harbor Beaches of Ventura County and the reference beach indicate that the critical condition for bacteria loading is during wet-weather due to greater exceedance probabilities of the single sample bacteria objectives then during dry-weather. To more specificallyidentifyacriticalconditionwithinwet-weather,inordertosettheallowableexceedancedaysshowninTable7-28.2,the90th percentile‘stormyear’1 in terms of wet days2 is used as the reference year for the reference system. Selecting the 90th percentile year avoids a situation where the reference system is frequently out of compliance. Selecting the 90th percentile year is a more conservative approach that willaccommodatea‘worst-case’scenarioresultinginfewerexceedancedays than the maximum allowed in drier years. Conversely, in the 10% of wetter years, there may be more than the allowable number of exceedance days.
Compliance Monitoring Compliance and monitoring for Harbor Beaches of Ventura County is based on existing monitoring protocols and locations.
Monitoring shall continue at sampling locations (VCEHD 36000 and VCEHD37000)andatthecurrentweeklymonitoringfrequency,consistentwithAB411compliancemonitoring.Monitoringshallbeconducted on a year-round basis at the current monitoring locations includingthesummermonths(i.e.,ApriltoOctober)andwintermonths(i.e., November to March). Bacteria sampling shall be conducted inankle-toknee-highwater,consistentwithAB411.However,ifadditional monitoring stations are added or if changes are made to the sampling frequencies or existing monitoring locations, then submittal of amonitoringplanisrequiredforExecutiveOfficerapproval.

Basin Plan 7-��� Total Maximum Daily LoadsUpdated September 20��
Element Findings and Regulatory ProvisionsCompliance Monitoring (continued)
For agricultural dischargers, the Conditional Waiver for Dischargers from Irrigated Lands shall be revised to include monitoring for enrollees in the Channel Islands Harbor subwatershed.
1ForpurposesofthisTMDL,a‘stormyear’meansNovember1toOctober31.The90thpercentilestormyearwas1993with75wetdaysattheLAXmeteorologicalstation.2Awetdayisdefinedasadaywithrainfallof0.1inchormoreplusthe3daysfollowingtherainevent.

Bas
in P
lan
7
-��4
To
tal M
axim
um D
aily
Loa
dsU
pdat
ed S
epte
mbe
r 20�
�
Tabl
e 7-
28.2
. Har
bor
Bea
ches
of V
entu
ra C
ount
y B
acte
ria
TM
DL
: Fi
nal A
llow
able
Exc
eeda
nce
Day
s by
Loc
atio
n
Loc
atio
n
Sum
mer
dry
-w
eath
er*
Com
plia
nce
Dea
dlin
e
Win
ter
dry-
wea
ther
Com
plia
nce
Dea
dlin
e
Wet
-wea
ther
**
Com
plia
nce
Dea
dlin
eD
aily
sa
mpl
ing
(No.
da
ys)
Wee
kly
sam
plin
g (N
o.
days
)
Dai
ly
sam
plin
g (N
o.
days
)
Wee
kly
sam
plin
g (N
o.
days
)
Dai
ly
sam
plin
g (N
o.
days
)
Wee
kly
sam
plin
g (N
o.
days
)
Hob
ie
Bea
ch0
0
Five
yea
rs
afte
r ef
fect
ive
date
of t
he
TMD
L
31
Five
yea
rs
afte
r ef
fect
ive
date
of t
he
TMD
L
173
Ten
year
s afte
r ef
fect
ive
date
of t
he
TMD
L
Kid
die
Bea
ch0
0
Five
yea
rs
afte
r ef
fect
ive
date
of t
he
TMD
L
31
Five
yea
rs
afte
r ef
fect
ive
date
of t
he
TMD
L
173
Ten
year
s afte
r ef
fect
ive
date
of t
he
TMD
L *A
drydayisdefinedasanon-wetday.
**Awetdayisdefinedasadaywith0.1-inchorm
oreofrainandthethreedaysfollowingtherainevent.

Basin Plan 7-��5 Total Maximum Daily LoadsUpdated September 20��
Table 7-28.3 Harbor Beaches of Ventura County Bacteria TMDL: Implementation Table Implementation Action Responsible Parties DateCompliance(WLAs): ThereshallbenoexceedancesoftheinterimWLAs(seetheWLAssectioninTable7-28.1).
1. County of Ventura2. Ventura County Watershed
Protection District (VCWPD) andassociatedMS4Co-permittees in the Channel Islands Harbor (CIH) subwatershed3
3. City of Oxnard4. Caltrans
Effective date of the TMDL.
Compliance(LAs): ThereshallbenoexceedancesoftheinterimLAs(seetheLAssectioninTable7-28.1).
1. County of Ventura2. City of Oxnard
Effective date of the TMDL.
Monitoring: Continue monitoring at stations VCEHD 36000 and VCEHD37000,ataweeklymonitoringfrequency,and on a year-round basis. Extend the monitoring period for Hobie Beach to include winter months.
1. County of Ventura2. VCWPDandassociatedMS4
Co-permittees in the CIH subwatershed
3. City of Oxnard4. Caltrans
Effective date of the TMDL.
Monitoring4: Submit a monitoring plan for the Harbor Beaches of Ventura County (HBVC) for approval by the ExecutiveOfficer.
1. County of Ventura2. VCWPDandassociatedMS4
Co-permittees in the CIH subwatershed
3. City of Oxnard4. Caltrans
Prior to the modificationof existing monitoring locations or frequencies.
Implementation: Submit draft work plan to implement source control and BMPs, including but not limited to structural and non-structural BMPs, at the HBVC during dry-weatherforExecutiveOfficerapproval.
1. County of Ventura2. VCWPDandassociatedMS4
Co-permittees in the CIH subwatershed
3. City of Oxnard4. Caltrans
Six months after the effective date of the TMDL.
Monitoring: Submit monitoring plan for agricultural discharges into the Channel Islands Harbor subwatershed for approvalbytheExecutiveOfficer.
1. AgriculturalDischargers One year after the effective date of the TMDL.
Monitoring: Monitor agricultural discharges at the frequency and monitoring locations approved by the ExecutiveOfficerinthemonitoringplan.
1. AgriculturalDischargers Six months after ExecutiveOfficerapproval of the monitoring plan for agricultural discharges.
Pilot Project: Submit a work plan piloting Structural BMPs, including but not limited to enhanced circulation devices,forExecutiveOfficerapproval(optional).
1. County of Ventura2. VCWPDandassociatedMS4
Co-permittees in the CIH subwatershed
3. City of Oxnard4. Caltrans
One year and six months after the effective date of the TMDL.

Basin Plan 7-��6 Total Maximum Daily LoadsUpdated September 20��
Table 7-28.3 Harbor Beaches of Ventura County Bacteria TMDL: Implementation Table Implementation Action Responsible Parties DateImplementation: Submit draft work plan to implement source control and BMPs, including but not limited to structural and non-structural BMPs, at the HBVC during wet-weatherforExecutiveOfficerapproval.
1. County of Ventura2. VCWPDandassociatedMS4
Co-permittees in the CIH subwatershed
3. City of Oxnard4. Caltrans
One year and six months after the effective date of the TMDL.
Pilot Project: Completion of Structural BMP pilot projects, including but not limited to enhanced circulation devices (optional).
1. County of Ventura2. VCWPDandassociatedMS4
Co-permittees in the CIH subwatershed
3. City of Oxnard4. Caltrans
Two years and six months after the effective date of the TMDL.
Implementation: Submitfinalworkplan;toimplementsourcecontrol and BMPs, including but not limited to structural and non-structural BMPs, at the HBVC duringdry-weatherforExecutiveOfficerapproval.
1. County of Ventura2. VCWPDandassociatedMS4
Co-permittees in the CIH subwatershed
3. City of Oxnard4. Caltrans
Three years and six months after the effective date of the TMDL.
Regional Board Reconsideration:a. Re-evaluateWLAsandLAsbasedondata.b. Re-evaluate the implementation schedule based
on results from pilot projects.c. Re-evaluate allowable exceedance levels,
including whether the allowable number of exceedance days maybe adjusted based on a Ventura County rainfall record.
d. Re-evaluate the selection of the reference beach if additional, appropriate reference beach options have been developed and if an appropriate reference system cannot be identifiedforthisenclosedharbor,evaluateusingthe‘naturalsourcesexclusion’approachsubject to antidegradation policies rather thanthe‘referencesystem/antidegradation’approach.
e. AssignLAstoagriculturallandsintheChannel Islands Harbor subwatershed based on monitoring in the Conditional Waiver for Dischargers from Irrigated Lands.
Regional Board Four years after effective date of the TMDL.
Implementation: Submitfinalworkplantoimplementsourcecontroland BMPs, including but not limited to structural and non-structural BMPs, at the HBVC during wet-weatherforExecutiveOfficerapproval.
1. County of Ventura2. VCWPDandassociatedMS4
Co-permittees in the CIH subwatershed
3. City of Oxnard4. Caltrans
Four years after the effective date of the TMDL.

Basin Plan 7-��7 Total Maximum Daily LoadsUpdated September 20��
Table 7-28.3 Harbor Beaches of Ventura County Bacteria TMDL: Implementation Table Implementation Action Responsible Parties DateCompliance(WLAs): There shall be no exceedances in excess of the numbersinTable7-28.2ofthesinglesamplelimitsat any location during dry-weather, and the rolling 30-day geometric mean targets shall be achieved.
1. County of Ventura2. VCWPDandassociatedMS4
Co-permittees in the CIH subwatershed
3. City of Oxnard4. Caltrans
Five years after the effective date of the TMDL.
Compliance(LAs): There shall be no exceedances in excess of the numbersinTable7-28.2ofthesinglesamplelimitsat any location during dry-weather, and the rolling 30-day geometric mean targets shall be achieved.
1. County of Ventura2. City of Oxnard
Five years after the effective date of the TMDL.
Compliance: SubmitComplianceReportforExecutiveOfficerapproval. The Compliance Report shall include an evaluation of compliance with dry-weather allocations, interim wet-weather allocations, and rolling 30-day geometric mean targets.
1. County of Ventura2. VCWPDandassociatedMS4
Co-permittees in the CIH subwatershed
3. City of Oxnard4. Caltrans
Six and Eight years after the effective date of the TMDL.
Compliance: Submit Final Compliance Report for Executive Officerapproval.TheComplianceReportshallinclude an evaluation of compliance with dry-weather allocations, wet-weather allocations, and the rolling 30-day geometric mean targets.
1. County of Ventura2. VCWPDandassociatedMS4
Co-permittees in the CIH subwatershed
3. City of Oxnard4. Caltrans
Ten years after the effective date of the TMDL.
FinalCompliance(WLAs): There shall be no allowable exceedances of single sample limits in excess of the numbers listed in Table7-28.2ofthesinglesamplelimitsatanylocation during any periods and the rolling 30-day geometric mean targets shall be achieved.
1. County of Ventura2. VCWPDandassociatedMS4
Co-permittees in the CIH subwatershed
3. City of Oxnard4. Caltrans
Ten years after the effective date of the TMDL.
FinalCompliance(LAs): There shall be no allowable exceedances of single sample limits in excess of the numbers listed in Table7-28.2ofthesinglesamplelimitsatanylocation during any periods and the rolling 30-day geometric mean targets shall be achieved.
1. County of Ventura2. City of Oxnard
Ten years after the effective date of the TMDL.
3Co-permitteesofMunicipalSeparateStormSewerSystem(MS4)permitforChannelIslandsHarborsubwatershedinclude the County of Ventura and incorporated cities therein. The incorporated cities for Channel Islands Harbor subwatershed include the City of Oxnard.4Submittalofamonitoringplanisrequiredifadditionalmonitoringstationsareaddedorifchangesaremadetothesamplingfrequenciesorexistingmonitoringlocations(VCEHD36000andVCEHD37000).

Basin Plan 7-��8 Total Maximum Daily LoadsUpdated September 20��

Basin Plan 7-��9 Total Maximum Daily LoadsUpdated September 20��
7-29 Machado Lake Eutrophic, Algae, Ammonia, and Odors (Nutrient) TMDL
This TMDL was adopted by:The Regional Water Quality Control Board on May 1, 2008.
This TMDL was approved by:The State Water Resources Control Board on December 2, 2008.TheOfficeofAdministrativeLawonFebruary19,2009.TheU.S.EnvironmentalProtectionAgencyonMarch11,2009.
The effective date of this TMDL is: March 11, 2009.
TheelementsoftheTMDLarepresentedinTable7-29.1andtheImplementationPlaninTable7-29.2
Table 7-29.1. Machado Lake Eutrophic, Algae, Ammonia, and Odors (Nutrient) TMDL: Elements
TMDL Element Regulatory Provisions
Problem Statement
Excessive loadings of nutrients, in particular nitrogen (including ammonia) and phosphorus, cause eutrophic effects, including algae and odors, which impair the beneficialusesofMachadoLake. Thenutrientenrichment results inhighalgalproductivity; algal blooms have been observed in the lake during summer months. In addition, high nutrient concentrations contribute to excessive and nuisance macrophytegrowth.Algaerespirationanddecaydepletesoxygenfromthewatercolumn creating an adverse aquatic environment. Machado Lake was placed on the CleanWaterAct303(d)listofimpairedwaterbodiesin1998,2002,and2006forammonia, algae, odors, and eutrophic.
Applicable Water Quality Objectives for this TMDL are narrative objectivesfor Biostimulatory Substances and Taste and Odor; and numeric objectives for DissolvedOxygenandAmmonia.
The beneficial uses of Machado Lake include beneficial uses associated withrecreation(REC1andREC2),aquatic life (WARM,WILD,RARE,andWET)and water supply (MUN).
This TMDL addresses the eutrophic, algae, ammonia, and odor listings which impair these uses.

Basin Plan 7-�40 Total Maximum Daily LoadsUpdated September 20��
TMDL Element Regulatory Provisions
Numeric Targets The total phosphorus target for Machado Lake is 0.1 mg/L as a monthly average concentrationinthewatercolumn,whichisbaseduponUSEPANutrientCriteriaTechnicalGuidanceManualforLakesandReservoirs.Aratiooftotalnitrogentototal phosphorus of 10 is the basis for the total nitrogen (TKN + NO3-N + NO2 –N) numeric target of 1.0 mg/L as a monthly average concentration in the water column. The total nitrogen target incorporates all forms of nitrogen including TKN, which is the sum of organic nitrogen and ammonia nitrogen, nitrate nitrogen (NO3-N), and nitrite nitrogen (NO2-N). The total nitrogen target expressed as a monthly average is protective of chronic aquatic life exposure for ammonia. There is a separate numeric target for ammonia of 5.95 mg/L as an hourly average to be protective of acute aquatic life exposure. The chlorophyll atargetis20ug/LbasedonEPAguidance and the Carlson Trophic Status Index. The dissolved oxygen target is a single sample concentration of no less than 5 mg/L measured at 0.3 meter above the sediments based on the Basin Plan objective. The following table provides the numeric targets for the Machado Lake TMDL.
Indicator Numeric TargetTotal Phosphorus 0.1 mg/L monthly averageTotal Nitrogen (TKN + NO3-N + NO2 –N)
1.0 mg/L monthly average
Ammonia - N - N 5.95 mg/L one-hour averageAmmonia - N - N 2.15 mg/L 30 day averageDissolved Oxygen 5 mg/L single sample minimum
measured 0.3 meter above the sediments.
Chlorophyll a 20μg/Lmonthlyaverage
Source Analysis The point sources of nutrients into Machado Lake are stormwater discharges from themunicipal separate storm sewer system (MS4), CaliforniaDepartmentof Transportation (Caltrans), and general construction and industrial discharges. Stormwater discharges to Machado Lake occur through the following subdrainage systems: Drain 553, Wilmington Drain, Project 77/510, and Walteria Lake.Discharges from Walteria Lake and Drain 553 are tributary to the Wilmington Drain, which then directly discharges in the northern portion of Machado Lake. Approximately,88%ofthedischargeintothelakeentersthroughtheWilmingtonDrain.
The major nonpoint source of nutrients to Machado Lake is internal nutrient loading (nutrientfluxfromsediments).Atmosphericdepositionisalsoanonpointsourceof total nitrogen. Nutrient loads from wind resuspension, bioturbation, birds, and general surface runoff are minor sources. Special studies may be conducted to further evaluate sources.

Basin Plan 7-�4� Total Maximum Daily LoadsUpdated September 20��
TMDL Element Regulatory Provisions
Linkage Analysis The linkage analysis focuses on the relationship between the nutrient loading to the lakeand thenumeric targets established tomeasure attainmentofbeneficialuses.TheNutrientNumericEndpointsBATHTUBSpreadsheetModel,whichwasdevelopedbyTetraTechforUSEPA,wasusedtoestablishthelinkagebetweennutrient loading to Machado Lake and the predicted water quality response. The model performs water and nutrient balance calculations under steady-state conditions. Eutrophication related water quality conditions are expressed in terms of total phosphorus, ortho-phosphourus, total nitrogen, inorganic nitrogen, chlorophyll a, transparency (Secchi depth), and hypolimnetic oxygen depletion rates. The linkage analysis demonstrates that assigning waste load and load allocations for total nitrogen and total phosphorus will address eutrophication related water quality conditions.
Waste Load Allocations
Wasteloadallocationsareassignedtourbanstormwaterdischargers(MS4,Caltrans,generalconstructionandgeneralindustrial)inbothwetanddryweather.Thefinalwaste load allocations are assigned as concentration based allocations of 0.1 mg/L and 1.0 mg/L as monthly averages for total phosphorus and total nitrogen (TKN + NO3-N + NO2 –N), respectively.
InterimWLAs are based on current in-lake concentrations. The effective dateinterim total nitrogen and total phosphorus waste load allocations are set as the 95th percentile of current concentrations in the lake. The 5 year interim total nitrogen WLAsareestablishedasa30percentreductionfromcurrentin-lakeconcentrations.Concentration-basedinterimandfinalWLAswillbeincludedinstormwaterpermitsin accordance with NPDES guidance and requirements. The tables below present theinterimandfinalwasteloadallocationsforthestormwaterdischarges.
Waste Load Allocations Total Phosphorus Total Nitrogen (TKN + NO3-N + NO2-N)
Final WLA (mg/L) Final WLA (mg/L)MS4Permittees1 Caltrans, GeneralConstructionandIndustrial stormwater permits
0.1 1.0
1MunicipalSeparateStormSewerSystem(MS4)PermitteesthatareresponsiblefordischargestoMachadoLakeinclude:LosAngelesCounty,LosAngelesCountyFloodControlDistrict,andtheCitiesofCarson,Lomita,LosAngeles,PalosVerdesEstates, Rancho Palos Verdes, Redondo Beach, Rolling Hills, Rolling Hills Estates, and Torrance.

Basin Plan 7-�42 Total Maximum Daily LoadsUpdated September 20��
TMDL Element Regulatory Provisions
Waste Load Allocations (continued)
Waste Load Allocations
Years After Effective Date
Interim Total Phosphorus
WLAs (mg/L)
Interim Total Nitrogen (TKN + NO3-N + NO2-N)
WLAs (mg/L)MS4Permittees,Caltrans,GeneralConstruction and Industrial Stormwater permits
AtEffectiveDate1
1.25 3.50
52 1.25 2.459.5
(FinalWLAs3)0.10 1.00
1ThecompliancepointforalleffectivedateinterimWLAsismeasuredinthelake. 2Thecompliancepointforallyear5interimWLAsismeasuredasspecifiedinImplementationPlanSectionIIofTable7-29.1 3ThecompliancepointforallfinalWLAsismeasuredasspecifiedinImplementationPlanSectionIIofTable7-29-.1
Load Allocations Load allocations are assigned for nonpoint source discharges to the lake, primarily internalloadingfromthelake.Thefinalloadallocationsforinternalloadingareconcentration based allocations of 0.1 mg/L and 1.0 mg/L as monthly averages for total phosphorus and total nitrogen (TKN + NO3-N + NO2 –N), respectively. Concentration based load allocations are appropriate and can be evaluated by monitoring the nutrient concentrations in the water column.
InterimLAsarebasedoncurrentin-lakeconcentrations.Theeffectivedateinterimtotal nitrogen and phosphorus load allocations are set at the 95th percentile of current concentrationsinthelake.The5yearinterimtotalnitrogenLAsareestablishedas a 30 percent reduction from current in-lake concentrations. The tables below presentthefinalandinterimloadallocationsforthenonpointsources.
Load Allocations Total Phosphorus Total Nitrogen (TKN + NO3-N + NO2-N)
Final LA (mg/L) Final LA (mg/L)Internal Nutrient Load (City of Los AngelesDepartmentofRecreation and Parks)
0.1 1.0
Load Allocations Years After Effective Date
Interim Total Phosphorus LAs
(mg/L)
Interim Total Nitrogen (TKN + NO3-N + NO2-N)
LAs (mg/L)Internal Nutrient Load (City of LosAngelesDepartment of Recreation and Parks)
AtEffectiveDate 1.25 3.505 1.25 2.45
9.5(FinalLAs) 0.10 1.00

Basin Plan 7-�4� Total Maximum Daily LoadsUpdated September 20��
TMDL Element Regulatory Provisions
Margin of Safety The uncertainties associated with this TMDL are due to limited data from the stormdrains entering the lake and the inherent seasonal and annual variability in delivery of phosphorus and nitrogen for external sources and nutrient cycling within the lake. To address these uncertainties, conservative numeric targets were selected by establishing the targets under a critical lake volume. Likewise, the waste load and load allocations are based on a constant value for internal loading. Moreover, the lake conditions under which the load capacity was developed were based on dry weather critical conditions when the lake level is reduced and therefore loading capacity is reduced. These conservative approaches provide an implicit margin of safety.
Seasonal Variations and Critical Conditions
The external nutrient loading to Machado Lake generally occurs during winter and spring months, in conjunction with storm events. During the dry season the lake receives minimal external loading. In the summer there is the release of nutrients from the sediments. At the same time there is very little water inflow and adecreased lake level due to evaporation. These seasonal variations cause increased nutrient concentrations. Moreover, the reduced lake volume during the summer months provides less assimilative capacity. The critical condition for the attainment ofbeneficial uses atMachadoLakeoccursduring the summermonths. Also,the critical conditions for dissolved oxygen impairments related to algae growth are during the warm dry summer months when algal respiration is highest. The Machado Lake nutrient TMDL accounts for seasonal and critical conditions of the summer months by assigning a load allocation to the lake sediments and requiring areductioninthissourceofnutrientstothelake,andbyassigningWLAstourbanstormwater dischargers year-round.
Special Studies and Monitoring Plan
Special Studies
Additional monitoring and special studies may be undertaken by dischargersand responsible agencies to evaluate the uncertainties and assumptions made in the development of this TMDL. (The results of special studies may be used to reevaluate waste load allocations and load allocations when the Machado Lake Nutrient TMDL is reconsidered.)
Optional Study #1: Corefluxstudytoestimatethenutrientfluxfromsedimentsunderequilibriumconditions.Resultsfromthisstudywouldbebeneficialtogauge the success of implementation measures such as aeration.
Optional Study #2: A study to understand factors such as nitrogen andphosphorus sedimentation rates (particulate settling velocities), the overall lake sedimentation rate, and sediment resuspension rate. These factors would be important for a Machado Lake nutrient budget and gauging the potential need for periodic hydraulic dredging.

Basin Plan 7-�44 Total Maximum Daily LoadsUpdated September 20��
TMDL Element Regulatory Provisions
Special Studies and Monitoring Plan (continued)
Optional Study #3: Awork plan for permittees to assess compliancewithTMDLWLAsonamassbasisfortotalnitrogenandtotalphosphorous.Thework plan should detail testing methodologies, BMPs, and treatments to be implemented to attain and demonstrate a reduction of total nitrogen and phosphorousloadingonamassbasis.AfinalreportincludingtheresultsshallbesubmittedtotheRegionalBoardforExecutiveOfficerapproval.
Additional special studies proposed by stakeholders are optional and will beconsideredatthe7.5yearTMDLreconsideration.AllproposedspecialstudyworkplansanddocumentsshallbesubmittedtotheRegionalBoardforExecutiveOfficerapproval prior to special studies being initiated.
Monitoring Plan
A Monitoring and Reporting Program (MRP) plan to assess compliance withLAsandWLAsmeasuredinlakemustbesubmittedtotheExecutiveOfficerforapproval within one year of the effective date. Monitoring will begin 60 days after theExecutiveOfficerhasapprovedthemonitoringplan.
This MRP plan will be required as part of the Lake Water Quality Management Plan as discussed in the Implementation Section.
The MRP plan will be designed to monitor and implement this TMDL. The monitoring plan is required to measure the progress of pollutant load reductions and improvements in water quality. The monitoring plan shall
Determine attainment of total phosphorus, total nitrogen, ammonia, dissolved oxygen, and chlorophyll a numeric targets.
Determine compliance with the waste load and load allocations for total phosphorus, and total nitrogen.
Monitor the effect of implementation actions on lake water quality
Responsible jurisdictions shall be required to begin monitoring sixty days after the ExecutiveOfficerapproves theMRP. Fieldsamplesandwatersamplesshallbecollected bi-weekly on a year-round basis. The lake sampling sites will be located in the open water portion of the lake with one in the northern portion and one in the southern portion of the lake. In situ measurements of water quality shall be made.
The water quality probes will be calibrated immediately prior to departure to the fieldagainstknownpH,EC,andDOsolutions.Secchidepth,ameasurementoftransparency, will also be measured with a standard Secchi disk or other approved method.Additionally,astaffgaugeshallbeplacedinanappropriatelocationatthelake to measure changes in lake elevation.

Basin Plan 7-�45 Total Maximum Daily LoadsUpdated September 20��
TMDL Element Regulatory Provisions
Special Studies and Monitoring Plan (continued)
Themonitoringplanshallconsiderstratificationforthecollectionofwatersamples.Water samples shall be analyzed for constituents including but not limited to the following.
Total nitrogenTotal phosphorusNitrate (NO3-N)Total ammonia (NH3-N)Ortho-phosphorus (PO4)Total Dissolved SolidsTotal Suspended SolidsChlorophyll a Turbidity
DetectionlimitsshallbelessthanthenumerictargetsinthisTMDL.Amonitoringreport shall be prepared and submitted to the Regional Board annually within six monthsafterthecompletionofthefinalsamplingeventoftheyear.
IfanalternativeWLAcomplianceoptionisselected,anappropriateseparateTMDLcompliance MRP Plan and TMDL Implementation Plan must be submitted for ExecutiveOfficerapproval.Annualmonitoringreportsdemonstratingcomplianceornon-compliancewithWLAsshallbesubmittedforExecutiveOfficerapproval.
All compliance monitoring must be conducted in conjunction with a RegionalBoardapprovedQualityAssuranceProjectPlan(QAPP).TheQAPPshallincludeprotocols for sample collection, standard analytical procedures, and laboratory certification.
Implementation Plan
CompliancewiththeTMDLisbasedontheassignedWLAsandLAs.Compliancewith this TMDL will require the implementation of NPDES stormwater permit limits and lake management activities to reduce nutrient loading to the lake, reduce nutrient concentrations in the lake, prevent excessive algal biomass growth, and maintain an adequate dissolved oxygen concentration. Table 7-29.2 containsa schedule for responsible jurisdictions to implement BMPs and a Lake Water Quality Management Plan to comply with the TMDL.
I. ImplementationandDeterminationofCompliancewithLAs
CompliancewiththeLAswillbemeasuredinthelakeandwillbeachievedthrougha combination of implementation of lake management projects and BMPs to reduce external and internal nutrient loading to the lake and to reduce and manage internal nutrient sources.

Basin Plan 7-�46 Total Maximum Daily LoadsUpdated September 20��
TMDL Element Regulatory Provisions
Implementation Plan (continued)
Load allocations will be implemented through the following:
(1)MemorandumofAgreement(MOA),or (2)CleanUpandAbatementOrderorOtherRegulatoryOrder
The responsible jurisdictions for the load allocations shall be allowed one year fromtheeffectivedateofthisTMDLtoenterintoaMemorandumofAgreement(MOA) with the Executive Officer, detailing the voluntary efforts that will beundertakentoattaintheloadallocations.TheMOAshallcomplywiththeWater QualityControlPolicyforAddressingImpairedWaters:RegulatoryStructureandOptions (“Policy”), including part II, section 2 c ii and related provisions, and shall beconsistenttherequirementsofthisTMDL.IftheMOAistimelyadopted,andsolongasitisimplemented,theprogramdescribedintheMOAshallbedeemed“certified”, pursuant to the Policy, subject to the conditions of Policy section 2e. TheMOA shall include development of a LakeWaterQualityManagementPlan(LWQMP),mustbeapprovedbytheExecutiveOfficer,andmaybeamendedwithExecutiveOfficerapproval,asnecessary. IfaMOAisnotestablishedwithresponsible jurisdictions within one year or if responsible jurisdictions do not complywith the termsof theMOA,acleanupandabatementorderpursuant toWaterCodesection13304,oranotherappropriateregulatoryorder,shallbeissuedto implement the load allocations.
Furthermore,theimplementationoftheMOAmustresultinattainmentoftheTMDLloadallocations.IftheMOAandLWQMParenotimplementedorotherwisedonotresultinattainmentofloadallocations,thecertificationshallberevoked,theMOArescinded,andtheloadallocationsshallbeimplementedthroughacleanupand abatement order, or other order, as described above. Implementation of the MOAshallbereviewedannuallybytheExecutiveOfficeraspartoftheMonitoringand Reporting Program (MRP) annual reports.
TothesatisfactionoftheExecutiveOfficertheLWQMPshallmeetthefollowingcriteria: One and one half years from the effective date of the TMDL responsible
jurisdictionsshallsubmitaLWQMP,MRPPlanandQAPPforapprovalbytheExecutiveOfficer.
The LWQMP shall include a list of cooperating parties.

Basin Plan 7-�47 Total Maximum Daily LoadsUpdated September 20��
TMDL Element Regulatory Provisions
Implementation Plan (continued)
The LWQMP shall address appropriate water quality monitoring and a timeline for the implementation of management practices to reduce and manage nutrient loading to the lake. The timeline shall ensure that the implementation actions are underway prior to Regional Board reconsideration of the TMDL. The LWQMP shall present a comprehensive managementplanandstrategyforachievingtheLAsatMachadoLakeandattainingnumerictargetsandbeneficialuses.TheLWQMPshallincludeaschedule for implementation actions.
The LWQMP shall achieve compliance with the load allocations through the implementation of lake management strategies to reduce and manage internal nutrient sources. The lake management implementation actions may include, but are not limited to the following:
Wetland restoration Aerationsystem Hydraulic Lake dredging Hydroponic Islands Alumtreatment Fisheries Management Macrophyte Management and Harvesting Maintain Lake Level – Supplemental Water
The LWQMP shall include a MRP Plan. The MRP shall include a requirement that the responsible jurisdictions report compliance and non-compliance with load allocations as part of annual reports submitted to the Regional Board. Compliance with the load allocations shall be measured in the lake at two locations, one in the north portion and one in the south. The average of these two sampling locations shall determine compliance with the load allocations. MRP protocols may be based on Surface Water Ambient Monitoring Program (SWAMP) protocols for water qualitymonitoring or alternative protocols proposed by dischargers and approved bytheExecutiveOfficer.
AQAPPshallalsobesubmittedtotheRegionalBoardforapprovalbytheExecutiveOfficertoensuredataquality.TheQAPPshallincludeprotocolsfor sample collection, standard analytical procedures, and laboratory certification. TheQAPPmaybebasedonSWAMPprotocols forwaterquality monitoring and quality assurance or alternative protocols proposed bydischargersandapprovedbytheExecutiveOfficer.
TheMOAandLWQMPprogramshall includeassurances that itwillbeimplemented by the responsible jurisdiction.

Basin Plan 7-�48 Total Maximum Daily LoadsUpdated September 20��
TMDL Element Regulatory Provisions
Implementation Plan (continued)
Implementation of the LWQMP program should include a Health and Safety Plan to protect personnel.
The Executive Officer may require a revised assessment under the MOA andLWQMP:
(a) To prevent nutrients from accumulating or recycling in the lake in deleterious amounts that impair water quality, contribute to negative eutrophicconditionsoradverselyaffectbeneficialuses;
(b) Toreflecttheresultsofnutrientassessmentorspecialstudies
CleanupandAbatementOrderorOtherRegulatoryOrder:
Alternatively,responsible jurisdictionsmaypropose,or theRegionalBoardmayimpose, an alternative program which would be implemented through a cleanup and abatement order, or any other appropriate order or orders, provided the program isconsistentwith theallocations,reductions,andscheduledescribedinTable7-29.2.
DeterminationofCompliancewithInterimLAs
ResponsiblepartiesshallcomplywithnumericinterimLAsormaybedeemedincompliancewith the interimLAsthroughimplementationof lakesedimentremoval and/or lake management implementation actions in accordance with the LWQMPscheduleasapprovedbytheRegionalBoardExecutiveOfficer.
II. ImplementationandDeterminationofCompliancewithWLAs
WLAswillbeincorporatedintoNPDESstormwaterpermits.
Stormwater permittees may be deemed in compliance with waste load allocations by actively participating in a LWQMP and attaining the waste load allocations for Machado Lake. Stormwater permittees and the responsible party for the lake may work together to implement the LWQMP and reduce external nutrient loading to attain the TMDL waste load allocations measured in the lake.
Alternatively, MS4 Permittees may be deemed in compliance with waste loadallocations by demonstrating reduction of total nitrogen and total phosphorous on an annual mass basis measured at the stormdrain outfall of the permittee’sdrainage area. The annual mass based allocation shall be equal to a monthly averageconcentrationof0.1mg/LTPand1.0mg/LTNbasedonapprovedflowconditions. Permittees must demonstrate total nitrogen and total phosphorous load reductions to be achieved in accordance with a special study workplan approved by theExecutiveOfficer.
Compliance may also be demonstrated as concentration based monthly averages forTPandTNmeasuredatthestormdrainoutfallofthepermittee’sdrainagearea.

Basin Plan 7-�49 Total Maximum Daily LoadsUpdated September 20��
TMDL Element Regulatory Provisions
Implementation Plan (continued)
MS4 Permittees shall be required to develop and implement a MRP plan andTMDL Implementation Plan. The MRP plan shall include a requirement that the responsible jurisdictions report compliance and non-compliance with waste load allocations as part of annual reports submitted to the Regional Board.
DeterminationofCompliancewithInterimWLAs
ResponsiblepartiesmaycomplywiththenumericinterimWLAsormaybedeemedincompliancewiththeinterimWLAsthroughimplementationofexternalnutrientsource reduction projects in accordance with the TMDL Implementation Plan scheduleasapprovedbytheRegionalBoardExecutiveOfficer.
The Regional Board may revise theseWLAs and the compliance point basedon the collection of additional information developed through special studies or monitoring conducted as part of this TMDL.
TheRegionalBoardwillreconsidertheTMDLat7.5yearsfromtheeffectivedatebased on water quality monitoring and special studies.
III.APPLICATIONOFALLOCATIONSTORESPONSIBLEJURISDICTIONS
ResponsiblejurisdictionstoattainWLAsforthisTMDLincludebutarenotlimitedto:
• Caltrans• GeneralStormwaterPermitEnrollees• MS4Permitteesincluding:
LosAngelesCountyLosAngelesCountyFloodControlDistrictCities of Carson, City of Lomita, CityofLosAngeles,City of Palos Verdes Estates, City of Rancho Palos Verdes,City of Redondo Beach, City of Rolling Hills, City of Rolling Hills Estates, City of Torrance.
TheCityofLosAngeles,DepartmentofRecreationandParksisresponsiblejurisdictiontoimplementtheassignedLoadAllocationsforthisTMDL.

Basin Plan 7-�50 Total Maximum Daily LoadsUpdated September 20��
Table 7-29.2 Machado Lake Eutrophic, Algae, Ammonia, and Odors (Nutrient) TMDL: Implementation Schedule
Task Number Task Responsible Jurisdiction Date
1 Effectivedateinterimwasteload(WLA)andloadallocations(LA)fortotalnitrogenandtotal phosphorus apply.
California Department of Transportation (Caltrans), Municipal Separate Storm Sewer System Permittees4(MS4Permittees), City of Los Angeles–DepartmentofRecreation and Parks
Effective Date of TMDL
2 Responsible jurisdictions shall enter into a MemorandumofAgreement(MOA)withthe Regional Board to implement the load allocations.
CityofLosAngeles–Department of Recreation and Parks
1 year from effective date of TMDL
3 Regional Board staff shall begin development ofaCleanUpandAbatementOrderorother regulatory order to implement the load allocationsifanMOAisnotestablishedwithresponsible jurisdictions.
Regional Board Staff 1 year from effective date of TMDL
4 CleanUpandAbatementOrderorotherregulatory order adopted by the Regional BoardifanMOAisnotestablishedwithresponsible jurisdictions. The Clean Up and AbatementOrderorotherregulatoryordershallreflecttheTMDLImplementationSchedule.
Regional Board Staff 1.5 years from effective date of TMDL
5 Responsible jurisdictions whose compliance isdeterminedasconcentrationbasedWLAsmeasured at end of pipe shall submit a Monitoring and Reporting Program (MRP) PlantotheExecutiveOfficerforapproval.
Caltrans,MS4Permittees One year from effective date of TMDL
6 Responsible jurisdictions shall submit a Lake Water Quality Management Plan, MRP PlanandQualityAssuranceProjectPlanforapprovalbytheExecutiveOfficertocomplywithMOA.
CityofLosAngeles–Department of Recreation and Parks
1.5 years from effective date of TMDL
7 Responsible jurisdictions shall submit a work plan for optional special study #3 (if responsible jurisdictions choose to conduct this special study) for approval by the ExecutiveOfficer.
Caltrans,MS4Permittees One year from effective date of TMDL
8 Responsible jurisdictions shall submit work plans for optional special studies #1 and #2 (if responsible jurisdictions choose to conduct special studies) for approval by the Executive Officer.
Caltrans,MS4Permittees,CityofLosAngeles–Department of Recreation and Parks
1.5 years from effective date of TMDL

Basin Plan 7-�5� Total Maximum Daily LoadsUpdated September 20��
Task Number Task Responsible Jurisdiction Date
9 Responsible jurisdictions shall begin monitoring as outlined in the approved MRP plan.
Caltrans,MS4Permittees,CityofLosAngeles–Department of Recreation and Parks
Sixty days from date of MRP Plan approval
10 Responsible jurisdictions shall begin implementation of Lake Water Quality Management Plan.
CityofLosAngeles–Department of Recreation and Parks
Sixty days from date of Lake Water Quality Management Plan approval
11 Responsible jurisdictions whose compliance isdeterminedasconcentrationbasedWLAsmeasured at end of pipe shall submit a TMDL Implementation Plan including BMPs to address discharges from storm drains.
Caltrans, MS4Permittees
Two years from effective date of TMDL
12 Responsible jurisdictions whose compliance is determined as concentration based WLAsmeasuredatendofpipeshallbegin implementation of BMPs to address discharges from stormdrains
Caltrans, MS4Permittees
Sixty days from date of Implementation Plan approval
13 Responsible jurisdictions shall submit annual monitoring reports. The monitoring reports shall include a requirement that the responsible jurisdictions demonstrate compliancewiththeMOA.IftheMOAandLake Water Quality Management Plan are not implemented or otherwise do not result in attainment of load allocations, the Regional BoardshallrevoketheMOAandtheloadallocations shall be implemented through aCleanUpandAbatementOrderorotherregulatory order.
CityofLosAngeles–Department of Recreation and Parks
Annually–fromdate of Lake Water Quality Management Plan approval
14 Responsible jurisdictions whose compliance isdeterminedasconcentrationbasedWLAsmeasured at end of pipe shall submit annual monitoring reports.
Caltrans, MS4Permittees
Annually–fromdate of MPR Plan approval
15 Optional Special Study #3 completed and finalreportsubmittedforExecutiveOfficerapproval.
Caltrans,MS4Permittees Within 2.5 years of effective date of TMDL
16 Responsible jurisdictions shall submit a MRP Plan and TMDL Implementation Plan for thealternativemassbasedWLAcomplianceoption(ifselected),totheExecutiveOfficerfor approval.
Caltrans,MS4Permittees Within 2.5 years of effective date of TMDL

Basin Plan 7-�52 Total Maximum Daily LoadsUpdated September 20��
Task Number Task Responsible Jurisdiction Date
17 Responsible jurisdictions shall begin monitoring and implementing projects/programs as outlined in the approved MRP and TMDL Implementation Plan for the alternativemassbasedWLAcomplianceoption.
Caltrans,MS4Permittees Sixty days from date of MRP/ Implementation Plan approval
18 Responsible jurisdictions whose compliance isdeterminedasmassbasedWLAsmeasuredat end of pipe shall submit annual monitoring reports.
Caltrans,MS4Permittees Annually–fromdate of MPR/ Implementation Plan approval
19 Optional Special Studies completed and SpecialStudyfinalreportssubmittedforExecutiveOfficerapproval.
Caltrans,MS4Permittees,CityofLosAngeles–Department of Recreation and Parks
Within 6 years of effective date of TMDL
20 Regional Board staff and responsible jurisdictions will present an Information Item to the Regional Board on the progress of TMDL implementation efforts and compliance with implementation schedules.
Regional Board staff and responsible jurisdictions
4yearsfromeffective date of TMDL
21 5YearinterimtotalnitrogenWLAandLAapply.
Caltrans,MS4permittees,CityofLosAngeles– Department Recreation and Parks
Within 5 years of effective date of TMDL
22 Regional Board will reconsider the TMDL to include results of optional special studies and water quality monitoring data completed by the responsible jurisdictions and revise numerictargets,WLAs,LAs,andtheimplementation schedule as needed.
Regional Board 7.5yearsfromeffective date of TMDL
23 Responsible jurisdictions shall achieveFinalWLAsandLAsfortotalnitrogen(including ammonia) and total phosphorus and demonstrate attainment of numeric targets for total nitrogen, ammonia, total phosphorus, dissolved oxygen, and chlorophyll a. Responsible parties shall demonstrate attainment of water quality standards for total nitrogen, ammonia, total phosphorus, dissolved oxygen, and biostimulatory substances in accordance with federal regulations and state policy on water quality control.
Caltrans,MS4Permittees,CityofLosAngeles–Department of Recreation and Parks
Within 9.5 years of effective date of TMDL
4MunicipalSeparateStormSewerSystem(MS4)PermitteesthatareresponsiblefordischargestoMachadoLakeinclude:LosAngelesCounty,LosAngelesCountyFloodControlDistrict,andtheCitiesofCarson,Lomita,LosAngeles,Palos Verdes Estates, Rancho Palos Verdes, Redondo Beach, Rolling Hills, Rolling Hills Estates, and Torrance.

Basin Plan 7-�5� Total Maximum Daily LoadsUpdated September 20��
7-30 Colorado Lagoon OC Pesticides, PCBs, Sediment Toxicity, PAHs, and Metals TMDL
This TMDL was adopted by:The Regional Water Quality Control Board on October 1, 2009.
This TMDL was approved by:The State Water Resources Control Board on November 16, 2010.TheOfficeofAdministrativeLawonMay6,2011.TheU.S.EnvironmentalProtectionAgencyonJune14,2011.
TheeffectivedateofthisTMDLis:June14,2011.
TheelementsoftheTMDLarepresentedinTable7-30.1andtheImplementationPlaninTable7-30.2
Table 7-30.1. Colorado Lagoon OC Pesticides, PCBs, Sediment Toxicity, PAHs, and Metals TMDL:Elements
TMDL Element Regulatory Provisions
Problem Statement
ColoradoLagoonisidentifiedonthe1998,2002,and2006CleanWaterActSection303(d) lists of water-quality limited segments as impaired due to elevated levels of OC pesticides,PCBs,sedimenttoxicity,PAHs,andmetalsinfishtissueandsediment.
Applicablefishtissue,sediment,andwaterqualityobjectivesforthisTMDLarenarrativeobjectives for chemical constituents, bioaccumulation, pesticides, and toxicity; and numeric objectives for metals and organic compounds.
ThebeneficialusesofColoradoLagoonincludewatercontactrecreation(REC-1)andnon-contactwaterrecreation(REC-2),commercialandsportfishing(COMM),warmfreshwaterhabitat(WARM),wildlifehabitat(WILD),andshellfishharvesting(SHELL).
ThegoalofthisTMDListoprotectandrestorefishtissueandsedimentqualityinColorado Lagoon by controlling the contaminated sediment loading and accumulation of contaminated sediment in the lagoon.

Basin Plan 7-�54 Total Maximum Daily LoadsUpdated September 20��
TMDL Element Regulatory Provisions
Numeric Targets ColoradoLagoonislistedonthe303(d)listforsedimenttoxicity,PAHs,lead,andzincinsediment;DDT,Dieldrin,andPCBsinfishtissue;andchlordaneinfishtissueandsediment.Inordertoaddresstheselistings,watercolumn,fishtissueandsedimenttargets are selected. The following table provides the numeric targets for the Colorado LagoonOCPesticides,PCBs,SedimentToxicity,PAHs,andMetalsTMDL.
Numeric targets for water, fish tissue, and sediment for OC Pesticides, PCBs, PAHs, and metalsConstituents Water Quality Target1
(ug/L)Fish Tissue Target2 (ug/kg)
ERL Sediment Target3 (ug/dry Kg)
Chlordane 0.00059 5.60 0.50DDTs 0.00059 21.00 1.584
Dieldrin 0.00014 0.46 0.02PCBs 0.000175 3.606 22.70TotalPAHs7 0.0498 5.47 4,022.00TotalLPAHs9 NA NA 552.00TotalHPAHs10 NA NA 1,700.00Lead 8.1011 NA 46,700.00Zinc 81.0011 NA 150,000.00
1 The California Toxics Rule (CTR) water quality criteria for consumption of organisms only are applied as the numeric targetsforChlordane,4,4’DDT,Dieldrin,andPCBsforprotectionofhumanhealth.TheCTRaquaticlifecriteriafor saltwater are applied as the numeric targets for protection of aquatic life for lead and zinc.2OfficeofEnvironmentalHealthHazardAssessment(OEHHA)FishContaminantGoalsareappliedasnumerictargetsforChlordane,DDTs,Dieldrin,andPCBs.TheU.S.EnvironmentalProtectionAgency(USEPA)screeningvalueisappliedasthenumerictargetfortotalPAHs.3EffectRangeLow(ERL)sedimentcriteriafromNationalOceanicandAtmosphericAdministration(NOAA)SedimentQualityGuidelinesareappliedasnumerictargets.4DDTsinsedimentaremeasuredasthesumofDDT,DDE,andDDD.5 PCBs in water are measured as the sum of all congener or isomer or homolog or aroclor.6PCBsinfishtissueandsedimentaremeasuredassumofallcongeners.7PAHs:Polycyclicaromatichydrocarbons(sumofacenaphthylene,anthracene,benz(a)anthracene,benzo(b)fluoranthene,benzo(k)fluoranthene,benzo(g,h,i)perylene,benzo(a)pyrene,chrysene,dibenz(a,h)anthracene,fluorene,indeno(1,2,3- c,d)pyrene, phenanthrene, and pyrene).8CTRhumanhealthcriteriawerenotestablishedfortotalPAHs,Therefore,thelowestCTRcriteriaforindividualPAHsof0.049ug/Lisappliedtothesumofbenz(a)anthracene,benzo(b)fluoranthene,benzo(k)fluoranthene,benzo(a)pyrene,chrysene,dibenz(a,h)anthracene,andindeno(1,2,3-c,d)pyrene.OtherPAHscompoundsintheCTRshallbescreenedas part of the TMDL monitoring plan.9LPAHs:LowmolecularweightPAHs.10HPAHs:HighmolecularweightPAHs.11 Saltwater criteria for metals are expressed in terms of the dissolved fraction of metals in water column.

Basin Plan 7-�55 Total Maximum Daily LoadsUpdated September 20��
TMDL Element Regulatory Provisions
Source Analysis Point sources
ThepointsourcesofOCpesticides,PCBs,PAHs,andmetalsdischargedtoColoradoLagoon are urban runoff and stormwater discharges from the municipal separate storm sewersystems(MS4s)andCaliforniaDepartmentofTransportation(Caltrans).TheColoradoLagoonwatershedisdividedintofivesub-basinsthatdischargestormwaterand urban dry weather runoff to Colorado Lagoon. Each of the sub-basins is served by a major storm sewer trunk line and supporting appurtenances that collect and transport stormwater and urban dry weather runoff to Colorado Lagoon. The sub-basins are as follows:
Sub-basin A.Discharges to Colorado Lagoon via a 63-inch reinforced concrete pipe owned and operatedbytheLosAngelesCountyFloodControlDistrict(Project452Drain)discharging into the north part of the west arm. The drainage pattern is generally to thesouthandeast.Sub-basinAcontainsthemostcommercialactivitiesmainlyalongAnaheimStreetandthenorthernpartofRedondoAvenue.
Sub-basin B.DischargestoColoradoLagoonviaa54-inchreinforcedconcretepipe(LineIStormDrain) discharging into the north part of the north arm. The drainage pattern is generally to the south and west. Sub-basin B is predominately park/golf course open space with some residential areas on the north east corner.
Sub-basin C.DischargestoColoradoLagoonviaa48-inchreinforcedconcretepipe(LinekStorm Drain) discharging into the mid-point of the north arm. The drainage pattern is generally to the south and west. Sub-basin C is almost entirely residential with a few commercial activities at the eastern boundary.
Sub-basin D.DischargestoColoradoLagoonviaa24-inchreinforcedconcretepipe(LineMStorm Drain) discharging into the south part of the west arm. The drainage pattern is generally to the north and east. Sub-basin D is almost entirely residential with schools and other public facilities.
Sub-basin E.DischargestoColoradoLagoonviaa48-inchreinforcedconcretepipe(TerminoAvenueDrain)dischargingintothewestarm.Thedrainagepatternisgenerallytothesouth and east. Sub-basin E is mainly residential with commercial activities located along7thStreet,CoronadoandRedondoAvenuestothewest,andpublicfacilitiestothe north.
Several other smaller storm drains serve the areas immediately adjacent to the lagoon.Thesesmallerstormdrainscontributesmallamountsofcontaminantsrelativetothefivesub-basin discharges described above.

Basin Plan 7-�56 Total Maximum Daily LoadsUpdated September 20��
TMDL Element Regulatory Provisions
Source Analysis(continued)
Non-point Sources
Sediment loading from non-point sources to Colorado Lagoon is mainly runoff from urban, recreational park areas including two golf courses and adjacent park areas, a right-of-way greenbelt, and the picnic and park areas surrounding Colorado Lagoon, and atmospheric deposition.
Linkage Analysis This TMDL analysis makes a simplifying assumption that the relationship between OC pesticidesandPCBsconcentrationsinfishtissueandsedimentsislinear,withtheslopeofthelinebeingtheoverallsediment–organismbioaccumulationfactor(BAF).
Theimpairingcontaminantsinsedimentareassociatedwithfine-grainedparticlesthatareprimarily delivered to the sediments through suspended solids in stormwater and urban runoff. It is expected that reductions in loadings of these pollutants will lead to reductions in sediment concentrations over time. The existing contaminants in surface sediments will be removed by dredging operations and reduced as sediments are scoured during storms. For the legacy pollutants (chlordane and PCBs), some losses will also occur through the slow decay and breakdown of these organic compounds. Concentrations in surfacesedimentswillbereducedthroughmixingwithcleanersediments.Attenuationofpollutantconcentrationlevelsinsedimentisexpectedtotranslatetoreductionsinfishtissue contaminant levels.
The linkage analysis focuses on the relationship between source contributions and in-lagoon water and sediment response. The Environmental Fluid Dynamics Code (EFDC) model was selected to simulate source loadings and transport of the listed pollutants intheColoradoLagoon.Thismodelestimatesthemetals,PAHs,PCBs,andDDTconcentrations in the receiving water to evaluate potential management scenarios and to identify waste load allocations to support water and sediment quality management decisions for Colorado Lagoon. Hydrodynamic, water quality, and sediment transport was developed to simulate the dynamic interaction between Marine Stadium and Colorado Lagoon.
Waste Load Allocations
Sediment Waste Load Allocations (WLAs) for MS4 Discharges:
Mass-basedWLAsforMS4Discharges
Mass-basedwasteloadallocationsforMS4permitteesincludingtheCityofLongBeach,LosAngelesCountyFloodControlDistrict,andCaltransareallocatedtothefivemajorstormdrainoutfallsthatcurrentlydischargetothelagoon.BecauseColorado Lagoon is located completely within the jurisdictional boundaries of the City of Long Beach and land areas serviced by storm drains that currently discharge tothelagoonareunderthejurisdictionoftheCityofLongBeach,theWLAsareassigned to the City of Long Beach. Caltrans and the City of Long Beach shall each beresponsibleforachievingtheWLAsassignedtotheLineIStormDrainasitconveysstormwaterfrombothCaltrans’facilitiesandtheCityofLongBeach.TheLosAngelesCountyFloodControlDistrict(District)ownsandoperatestheProject452StormDrain;therefore,theDistrictandtheCityofLongBeachshalleachberesponsibleforachievingtheWLAsassignedtotheProject452StormDrain.Mass-basedWLAsareappliedasannuallimitsandcompliancewiththemass-basedWLAsfor sediment will be determined at the storm drain outfalls to the lagoon.

Basin Plan 7-�57 Total Maximum Daily LoadsUpdated September 20��
TMDL Element Regulatory Provisions
Waste Load Allocations (continued)
ConstituentFinal Mass-based WLAs (mg/yr)
Project 452 Line I Termino Ave Line K Line M Chlordane 5.10 3.65 12.15 1.94 0.73Dieldrin 0.20 0.15 0.49 0.08 0.03Lead 476,646.68 340,455.99 1,134,867.12 181,573.76 68,116.09Zinc 1,530,985.05 1,093,541.72 3,645,183.47 583,213.37 218,788.29PAHs 41,050.81 29,321.50 97,739.52 15,637.89 5,866.44PCBs 231.69 165.49 551.64 88.26 33.11DDT 16.13 11.52 38.40 6.14 2.30
Concentration-basedWLAsforMS4Discharges
Concentration-basedWLAsforsedimentareassignedtoMS4permitteesincludingtheCityofLongBeach,LosAngelesCountyFloodControlDistrict,andCaltrans.Concentration-basedWLAsforsedimentareappliedasaveragemonthlylimits.Compliancewiththeconcentration-basedWLAsforsedimentshallbedeterminedbypollutantconcentrationsinthesedimentinthelagoonatpointsintheWestArm,NorthArm,andCentralArmthatrepresentthecumulativeinputsfromtheMS4drainagesystemtothelagoon.Concentration-basedWLAsforsedimentarealsoassignedtoallotherminorstormdrainsdischargingfromtheMS4tothelagoon.
Concentration-basedinterimWLAsforsedimentaresettoallowtimeforremovalofcontaminatedsedimentthroughproposedimplementationactions.InterimWLAsare based on the 95th percentile value of sediment data collected from 2000 to 2008. The use of 95th percentile values to develop interim limits is consistent with current NPDES permitting methodology. If the 95th percentile is equal to or lower than thenumerictarget,theinterimlimitisequaltothefinalWLAs.InterimandfinalWLAswillbeincludedinMS4permitsinaccordancewithNPDESguidanceandrequirements.
ConstituentConcentration-based WLAs
Interim WLAs (ug/dry kg)
Final WLAs (ug/dry kg)
Chlordane 129.65 0.50Dieldrin 26.20 0.02Lead 399,500.00 46,700.00Zinc 565,000.00 150,000.00PAHs 4,022.00 4,022.00PCBs 89.90 22.7DDT 149.80 1.58

Basin Plan 7-�58 Total Maximum Daily LoadsUpdated September 20��
TMDL Element Regulatory Provisions
Waste Load Allocations (continued)
Sediment Waste Load Allocations for Other Point Sources
Concentration-based waste load allocations are assigned to minor NPDES permits, otherstormwater,andnon-stormwaterpermittees.AnyfutureminorNPDESpermitsor enrollees under a general non-stormwater NPDES permit, general industrial stormwater permit or general construction permit will also be subject to the concentration-based waste load allocations.
Constituents Waste Load Allocation (ug/dry kg)
Chlordane 0.50Dieldrin 0.02Lead 46,700.00Zinc 150,000.00PAHs 4,022.00PCBs 22.70DDT 1.58
Load Allocations Amass-basedloadallocationisdevelopedfordirectatmosphericdeposition.Anestimateof direct atmospheric deposition was developed based on the percent area of surface water within the watershed, which is approximately 15 acres or 1.3% of the total watershed area. The load allocation for atmospheric deposition is calculated by multiplying this percentage by the total loading capacity.
Constituent Load Allocation (mg/year)
Chlordane 0.36Dieldrin 0.014Lead 33,217.48Zinc 106,694.25PAHs 2,860.83PCBs 16.15DDT 0.71
Margin of Safety AnimplicitmarginofsafetyexistsinthefinalWLAs.Theimplicitmarginofsafetyisbasedontheselectionofmultiplenumerictargets,includingtargetsforwater,fishtissueand sediment to protect human health, and the selection of ERLs as numeric targets for sediment, which are the most protective of the potentially applicable sediment guidelines available.
Additionally,toaddresssourcesofuncertaintyintheanalysis,particularlytheassumptionof natural removal of contaminated sediment at the northern arm of the lagoon, an explicit 10% margin of safety is also included.

Basin Plan 7-�59 Total Maximum Daily LoadsUpdated September 20��
TMDL Element Regulatory Provisions
Seasonal Variations and Critical Conditions
Nocorrelationwithfloworseasonality(wetvs.dryseason)wasfoundtoexistinsedimentortissuedata.GiventhatallocationsforthisTMDLareexpressedintermsofOCpesticides,PCBs,PAHs,andmetalsconcentrationsinsediment,acriticalconditionisnotidentifiedbaseduponfloworseasonality.
BecausetheadverseeffectsofOCpesticides,PCBs,PAHs,andmetalsarerelatedtosediment accumulation and bioaccumulation in the food chain over long periods of time, shorttermvariationsinconcentrationsarelesslikelytocausesignificantimpactsuponbeneficialuses.
Monitoring Plan The Colorado Lagoon TMDL Monitoring Plan (CLTMP) is designed to monitor and evaluateimplementationofthisTMDL,andrefinetheunderstandingofcurrentsedimentloadings. The goals of the CLTMP are:
TodeterminecompliancewithOCpesticides,PCBs,metals,andPAHswasteloadandload allocations,
TomonitortheeffectivenessofimplementationactionsproposedbyLosAngelesCountyFlood Control District and the City of Long Beach on water and sediment quality, includingthepotentialimpactsofredirectingdischargesfromtheTerminoAve.Drainandfrom cleaning the culvert on Marine Stadium and Colorado Lagoon,
TomonitorcontaminatedsedimentlevelsintheLagoonespeciallyintheNorthArmof the Lagoon and determine if additional implementation action such as dredging are necessary to achieve the TMDL, and
To implement the CLTMP in a manner consistent with other TMDL implementation plans and regulatory actions within the Colorado Lagoon watershed.
Monitoring shall begin six months after the monitoring plan is approved by the Executive Officer.Watercolumnandsedimentsampleswillbecollectedattheoutletofthestormdrainsdischargingtothelagoon,whilewatercolumn,sediment,andfishtissuesampleswillbecollectedintheWestArm,CentralArm,NorthArm,attheoutletofthelagoontoMarineStadiumduringanincomingtide,andattheoutfallofTerminoAve.DraintoMarineStadium.ThenumberandlocationofmonitoringsitesshallbespecifiedinthemonitoringplantobeapprovedbytheExecutiveOfficer.TheCityofLongBeach,theLosAngelesCountyFloodControlDistrict,andCaltransareeachresponsibleforconductingwater,sediment,andfishtissuemonitoring.However,theyareencouragedtocollaborate or coordinate their efforts to avoid duplication and reduce associated costs.
Water quality samples and total suspended solids samples shall be collected quarterly inthefirstyearandsemi-annuallythereafterandanalyzedforchlordane,dieldrin,OCpesticides, and total PCBs at detection limits that are at or below the minimum levels. The minimum levels are those published by the State Water Resources Control Board in Appendix4ofthePolicyfortheImplementationofToxicStandardsforInlandSurfaceWater, Enclosed Bays, and Estuaries of California, 2005.

Basin Plan 7-�60 Total Maximum Daily LoadsUpdated September 20��
TMDL Element Regulatory Provisions
Monitoring Plan (continued)
Waterqualitysamplesshallalsobecollectedquarterlyinthefirstyearandsemi-annuallythereafterandanalyzedforgeneralwaterqualityconstituents(GWQC),totalrecoverableanddissolvedPAHs,lead,andzinc.Ifwaterqualityobjectivesareexceededatanytime, sampling frequency shall be accelerated to quarterly thereafter until water quality objectives are not exceeded. Total suspended solid samples shall also be collected to analyzeforPAHs,lead,andzinc.Formetalanalysis,methodsthatallowfor(1)theremoval of salt matrix to reduce interference and avoid inaccurate results prior to the analysis; and (2) the use of trace metal clean sampling techniques, must be applied. ExamplesofsuchmethodsincludeEPAMethod1669forsamplecollectionandhandling,andEPAMethod1640forsamplepreparationandanalysis.
Sediment samples will be collected annually for analysis of general sediment quality constituents(GSQC),OCpesticides,PCBs,PAHs,andmetals.Lead,zinc,chlordane,dieldrin, and total PCBs shall be analyzed at detection limits that are lower than the ERLs. The sediment toxicity testing shall include testing a minimum of three species for lethal and non-lethal endpoints. Toxicity testing may include: the 28-day and 10-day amphipod mortality test, the sea urchin fertilization testing using sediment pore water, and the bivalve embryo testing of the sediment/water interface. The chronic 28-day and shorter-term10-dayamphipodtestsmaybeconductedinthefirstyear.Ifthereisnosignificantdifference in the tests, then the less expensive 10-day test can be used throughout the rest of the monitoring, with some periodic 28-day tests. Sediment toxicity monitoring shallbeconductedannuallytoprovidesufficientdataovertheimplementationtimeframeto evaluate changes in sediment quality due to implementation actions. If sediment objectives are exceeded or sediment toxicity is observed at any time, sampling frequency for both sediment and sediment toxicity shall be accelerated to semi-annually thereafter until sediment objectives are not exceeded and sediment toxicity is not observed.
Fish tissue samples will be collected annually and analyzed for chlordane, dieldrin, DDT, and PCBs to assess changes in concentrations of target organic constituents. The same rationaleusedforestablishingsamplingfrequencyforsedimentsisusedtoestablishfishtissue sample collection frequency. For Colorado Lagoon, species with the potential for human and wildlife consumption will be targeted. Fish targeted to evaluate potential impacts to human health will be limited to species more commonly consumed by humans. Tissues analyzed will be based on the most appropriate and common preparation for the selectedfishspecies.TissuesfromresidentCaliforniaorbaymusselsshallbecollectedannually and analyzed to further assess and track impairment.
Monitoring reports shall be prepared and submitted to the Regional Board annually within sixmonthsafterthecompletionofthefinalsamplingeventoftheyear.Allcompliancemonitoring must be conducted in conjunction with a Regional Board approved Quality AssuranceProjectPlan(QAPP).TheQAPPshallincludeprotocolsforsamplecollection,standardanalyticalprocedures,andlaboratorycertification.

Basin Plan 7-�6� Total Maximum Daily LoadsUpdated September 20��
TMDL Element Regulatory Provisions
Implementation Plan
TheCityofLongBeach,LosAngelesCountyFloodControlDistrict,andCaliforniaDepartment of Transportation (Caltrans) are each responsible for meeting the waste load allocations.However,totheextenttheireffluentdischargesarecommingled,theywillbeheld jointly liable for abating the pollutants in the commingled discharge to the extent any of them are unable to disprove their own contribution of pollutants.
CompliancewiththeTMDLisdeterminedbasedontheassignedWLAs.NPDESpermits will be amended to be consistent with the assumptions and requirements of the WLAs.Responsibleagenciesarerequiredtoimplementtheproposedactionstoremovecontaminated sediment; control the discharges of pollutants in urban runoff, stormwater andcontaminatedsedimentstoColoradoLagoon;attainwater,fishtissue,andsedimentqualitystandards;andprotectbeneficialuses.Table7-30.2containsascheduleforresponsible agencies to implement BMPs and proposed implementation actions to comply with the TMDL.
Responsible agencies may employ a variety of implementation strategies such as non-structural and structural best management practices (BMPs) to meet the required waste load allocations. The implementation actions described in this section represent a range ofactivitiesthatareproposedbytheLosAngelesCountyFloodControlDistrictandCityof Long Beach in the Los Angeles County Termino Avenue Drain Project and Colorado Lagoon Restoration Project, respectively.
Implementation and Determination of Compliance with the WLAs
TheWLAswillapplytoallNPDESdischargersintheColoradoLagoonwatershed.TheregulatorymechanismsusedtoimplementtheTMDLincludetheLosAngelesCountyMS4permit,theCityofLongBeachMS4permit,theCaltransstormwaterpermit,and any future general industrial stormwater permits, general construction stormwater permits, minor NPDES permits, and general NPDES permits as well as any other appropriate regulatory mechanism, including Board orders, where required. Each NPDES permit may be reopened immediately after the TMDL becomes effective, or amended at re-issuance, in accordance with applicable laws, to incorporate the waste load allocations and other provisions of this TMDL.
CompliancewiththeWLAswillbemeasuredatthestormdrainoutletsandinthelagoonand will be achieved through BMPs and a combination of proposed implementation actions provided in the Proposed Implementation section below to remove contaminated sediment and reduce loadings of contaminated sediment through the control of stormwater and contaminated sediments to Colorado Lagoon.
ThefinalWLAswillbeincludedforpermittedMS4dischargesandotherNPDESdischargesinaccordancewiththecomplianceschedulesprovidedinTable7-30.2.TheRegionalBoardmayrevisetheseWLAsbasedonadditionalinformationdevelopedthrough monitoring or special studies.

Basin Plan 7-�62 Total Maximum Daily LoadsUpdated September 20��
TMDL Element Regulatory Provisions
Implementation Plan (continued)
TheWLAsfortheminorNPDESpermitsandgeneralnon-stormwaterNPDESpermitswillbeimplementedthrougheffluentlimitationsconsistentwiththeassumptionsandrequirementsoftheWLAs.Permitwritersforthenon-stormwaterpermitsmaytranslateapplicablewasteloadallocationsintoeffluentlimitationsfortheminorandgeneralNPDES permits by applying applicable engineering practices. Proposed Implementation Actions
Non-Structural Best Management Practices
Thenon-structuralBMPsarebasedonthepremisethatspecificlandusesorcritical sources can be targeted to achieve the TMDL waste load allocations. Availablenon-structuralBMPsincludebettersedimentcontrolatconstructionsites and improved street cleaning by upgrading to vacuum type sweepers, storm drain cleaning, and public education and out reach. The lagoon is also impacted by irrigation runoff from the golf course located adjacent to the lagoon in the dry season. Improvements to the golf course operation should also be considered to protect lagoon resources by reducing watering needs and eliminating pesticide and herbicide use.
Site-SpecificImplementationActions: The Regional Board does not prescribe the methods of achieving compliance with the TMDL allocations. However, described below are several implementation actions proposed by the responsible agencies.
Relocation of the Termino Avenue Drain.
Oneofthemajorsystemoutfalls,theTerminoAvenueDrain,hasbeenproposedbytheLosAngelesCountyFloodControlDistricttobemodified,whichwillnolongerdischargeintotheLagoon.AsproposedintheLosAngelesCountyFloodControlDistrictTerminoAvenueDrainProject(TADP)thedrainwouldbypasstheLagoonanddischargestormwaterflowsintoMarineStadium.Dryweatherflowswill be diverted into the sanitary sewer system. This project would also redirect flowsfromthreeotherstormdrainslocatedonthesouthshoreoftheLagoonthatcurrently discharge into the Lagoon.
Low Flow Diversion and Trash Separation Device.
The City of Long Beach proposed in the Colorado Lagoon Restoration Project to divertlowstormdrainflowsfromotherthreemajorstormdrainsystemoutfallsand install trash separation devices to trap trash and debris prior to entering the wet well for the diverted runoff. The Colorado Lagoon Restoration Project would redirectortreatlowflowsfromthesedrainstominimizecontaminationtowaterand sediment.

Basin Plan 7-�6� Total Maximum Daily LoadsUpdated September 20��
TMDL Element Regulatory Provisions
Implementation Plan (continued)
Vegetated Bioswale Installation.
TheflowsfromtheremainingfourlocalstormdrainswouldbetreatedviaavegetatedbioswaleasproposedintheColoradoLagoonRestorationProject.Abioswale would also be developed on the north shore between the Lagoon and RecreationParkGolfCourse.Thevegetatedbioswalewouldtreatstormwateranddryweatherrunoffthroughfiltrationtoremovesedimentandpollutantspriortodischarging into the Lagoon.
Clean Culvert, Repair Tidal Gates, and Remove Sill/Structural Impedances.
TheColoradoLagoonisconnectedtoAlamitosBayandthePacificOceanthroughan underground tidal culvert to Marine Stadium. The existing culvert has not beencleanedsinceitwasbuiltinthe1960s.Theflowintheculvertisimpededby sediment that has accumulated on the bottom, extensive marine growth that has accumulated on the sides and ceiling, and debris that is trapped within the trash racks on the tide gate screens at both ends of the culvert. These existing conditions limittheLagoon’stidalrangeandtidalflushing,whichresultsinincreaseddegradationofwaterquality.AsproposedintheColoradoLagoonRestorationProject, the City of Long Beach plans to clean the existing culvert and trash racks, repair the tidal gates, and remove the sill and structural impedances within and around the existing culvert. Implementation of this component of the Colorado LagoonRestorationProjectwouldresultinincreasedtidalrange,tidalflushing,and water circulation, and improvement of water and sediment quality.
Remove Contaminated Sediment in the Western Arm of the Lagoon.
OCpesticides,PCBs,PAHs,andmetalsweredepositedovertimefromtheparticulates in the runoff brought to the Lagoon through the existing storm drains. Itisestimatedthatthelayerofcontaminatedsedimentreaches4to5ftdeep.TheCity of Long Beach proposes to remove sediment to a depth of 6 ft to provide a safeguard that only clean sediment remains. The excavation depth gradually decreases toward the footbridge. This component of the Colorado Lagoon Restoration Project would remove approximately 16,000 cubic yards (cy) of contaminated sediment within the western arm of the Lagoon.
Remove Contaminated Sediment in the Central Lagoon.
Similar to the sediment removal project above, the Colorado Lagoon Restoration Project would remove sediment and sand that has eroded and been deposited into theLagoonoveryears,andcreatealargersubtidalarea.Approximately5,500cyof sediment would be removed from the central Lagoon. Sediment removal from the central area of the lagoon would create a channel through the center of the central Lagoon to connect the dredge areas in the western arm to the outlet at the existing culvert or proposed open channel. Removal of this sediment would also provideadditionalspaceforwatercirculationandtidalflushing.

Basin Plan 7-�64 Total Maximum Daily LoadsUpdated September 20��
TMDL Element Regulatory Provisions
Implementation Plan (continued)
AsproposedintheColoradoLagoonRestorationProject,onlytheWesternArmand the Central Lagoon are planned to be dredged based on the recommendation from the Sediment Testing and Disposal Report. The TMDL monitoring program will determine if additional implementation actions such as dredging in the North ArmwillberequiredtoremovecontaminatedsedimentintheLagoon.
Build Alternate Channel or Underground Culvert between Lagoon and Marine Stadium.
City is considering an open channel or parallel underground culvert option to further improve water quality at the Colorado Lagoon. However, this project was notincludedinthecertifiedEIR.Thisproposedprojectconsistsofreplacingtheexisting concrete box culvert with an open channel or new underground culvert that would run from the Lagoon through Marina Vista Park to Marine Stadium in a location generally parallel to the existing culvert. Creating an open channel orundergroundculvertwouldimprovetidalflushingbyanincreaseinthetidalrange, and result in a corresponding improvement of water and sediment quality. In addition,itwouldprovideimprovedfloodflowconveyance.
Implementation of the proposed actions should result in attainment of the TMDL allocations. If the proposed actions are not implemented or otherwise do not result in attainment of allocations, additional implementation actions shall be required.

Basin Plan 7-�65 Total Maximum Daily LoadsUpdated September 20��
Table 7-30.2 Colorado Lagoon OC Pesticides, PCBs, Sediment Toxicity, PAHs, and Metals TMDL: Implementation Schedule
Item Implementation Action Responsible Party Date1 Effective date of interim waste load
allocations(WLAs).The City of Long Beach, the LosAngelesCountyFloodControl District, and Caltrans
Effective date of the TMDL
2 Responsible agencies shall submit a monitoringplantotheLosAngelesRegionalBoardforExecutiveOfficerapproval.
The City of Long Beach, the LosAngelesCountyFloodControl District, and Caltrans
6 months after effective date of the TMDL
3 Responsible agencies shall begin monitoring as outlined in the approved monitoring plan.
The City of Long Beach, the LosAngelesCountyFloodControl District, and Caltrans
6 months after monitoring plan approved by E.O.
4 Responsible agencies shall submit annual reportstotheLosAngelesRegionalBoardfor review.
The City of Long Beach, the LosAngelesCountyFloodControl District, and Caltrans
15 months after monitoring starts and annually thereafter
5 Responsible agencies shall submit bi-annual progress reports to provide updates on the status of implementation actions performed under the TMDL. The plan shall contain mechanisms for demonstrating progress toward meeting theassignedWLAs.
The City of Long Beach, the LosAngelesCountyFloodControl District, and Caltrans
Every 2 years after effective date of the TMDL
6 ResponsibleagenciesshallachieveWLAs. The City of Long Beach, the LosAngelesCountyFloodControl District, and Caltrans
7yearsaftereffectivedate of the TMDL

Basin Plan 7-�66 Total Maximum Daily LoadsUpdated September 20��

Basin Plan 7-�67 Total Maximum Daily LoadsUpdated September 20��
7-31 Malibu Creek Watershed Trash TMDL
This TMDL was adopted by: The Regional Water Quality Control Board on May 1, 2008.
This TMDL was approved by: TheStateWaterResourcesControlBoardonMarch17,2009. TheOfficeofAdministrativeLawonJune16,2009. TheU.S.EnvironmentalProtectionAgencyonJune26,2009.
TheeffectivedateofthisTMDLis:July7,2009.
TheelementsoftheTMDLarepresentedinTable7-31.1andtheImplementationPlaninTables7-31.2aand7-31.2b.
Table 7-31.1 Malibu Creek Watershed Trash TMDL: ElementsElement Malibu Creek Watershed Trash TMDLProblem Statement Discharges of trash into Malibu Creek, Malibu Lagoon, Malibou
Lake, Medea Creek (Reach 1 and Reach 2), Lindero Creek (Reach 1 and Reach 2), Lake Lindero, and Las Virgenes Creek violate water qualityobjectivesandimpairbeneficialuses.Thewaterbodiesabovewerelistedinthe1998,2002,2004,and2006303(d)listsofimpairedwaterbodies for trash. Relevant water quality objectives in the Water QualityControlPlanLosAngelesRegionincludeFloatingMaterialandSolid, Suspended, or Settleable Materials. The following designated beneficialusesareimpairedbytrash:municipalanddomesticsupply(MUN),groundwaterrecharge(GWR),contactwaterrecreation(REC-1), non-contact water recreation (REC-2), warm freshwater habitat(WARM),coldfreshwaterhabitat(COLD),migrationofaquaticorganisms(MIGR),wildlifehabitat(WILD),rare,threatened,orendangeredspecies(RARE),spawning,reproduction,andorearlydevelopment (SPWN), and wetland habitat (WET).
Numeric Target (Interpretation of the narrative water quality objective, used to calculate the load allocations)
Zero trash in the above listed subwatersheds of the Malibu Creek Watershed,andontheshorelinesofthosewaterbodies.Zeroisdefinedfor nonpoint sources as no trash immediately following each assessment and collection event consistent with an established Minimum Frequency ofAssessmentandCollectionProgram(MFACProgram).TheMFACProgramisestablishedatanintervalthatpreventstrashfromaccumulating in deleterious amounts that cause nuisance or adversely affectbeneficialusesbetweencollections.Forpointsources,zeroisdefinedasnotrashdischargedintothelistedwaterbodiesoftheMalibuCreek Watershed and on the shoreline of those waterbodies.
Source Analysis Litter from adjacent land areas, roadways and direct dumping and deposition are sources of trash to Malibu Creek Watershed. Point sources such as storm drains are also sources of trash discharged to Malibu Creek Watershed.
Loading Capacity Zero,asdefinedintheNumericTarget.

Basin Plan 7-�68 Total Maximum Daily LoadsUpdated September 20��
Element Malibu Creek Watershed Trash TMDLWaste Load Allocations (for point sources)
WasteLoadAllocations(WLAs)areassignedtotheCalifornia Department of Transportation (Caltrans, permittee for Statewide National Pollutant Discharge Elimination System (NPDES) StormWaterPermit,No.99-06-DWQ),LosAngelesCounty(principalpermitteeforNPDESLosAngelesCountyMunicipalSeparateStromSewerSystem(MS4)permit,No.CAS004001),andtheCitiesofAgouraHills,Calabasas,HiddenHills,Malibu,andWestlakeVillage(co-permitteesforNPDESLosAngelesCountyMS4permit)undertheNPDESLosAngelesCountyMS4permit,andtoVenturaCountyWatershed Protection District (principal permittee for NPDES Ventura CountyMS4permit,No.004002),CountyofVentura,andCityofThousandOaks(co-permitteesforNPDESVenturaCountyMS4permit)undertheNPDESVenturaCountyMS4permit.
WLAsarezerotrash.WLAsmaybeissuedtoadditionalresponsiblejurisdictionsinthefutureunderPhase2oftheUSEPAStormwaterPermitting Program, or other applicable regulatory programs.
Load Allocations (for nonpoint sources)
LoadAllocations(LAs)areassignedtotheNationalParkService,CaliforniaDepartmentofParksandRecreation,CountyofLosAngeles,County of Ventura, Ventura County Watershed Protection District, SantaMonicaMountainsConservancy,CitiesofMalibu,AgouraHills,Hidden Hills, Thousand Oaks, Westlake Village, and Calabasas, and land owners in the vicinity of listed waterbodies in the Malibu Creek Watershed.LAsarezerotrash.LAsmaybeissuedtoadditionalresponsible jurisdictions in the future under applicable regulatory programs.
Implementation Implementation of the trash TMDL for Malibu Creek Watershed includes structural and non-structural best management practices (BMPs) and a program of minimum frequency of assessment and collection(MFAC)toaddresspointandnonpointtrashsources.
Point Sources
WLAsshallbeimplementedthroughstormwaterpermitsandviatheauthorityvestedintheExecutiveOfficerbysection13267ofthePorter-CologneWaterQualityControlAct(WaterCodesection13000etseq.).
IfpointsourcedischargerscomplywithWLAsbyimplementinganExecutiveOfficercertifiedfullcapturesystemonconveyancesthatdischarge to the listed subwatersheds of the Malibu Creek Watershed through a progressive implementation schedule of full capture devices, theywillbedeemedincompliancewiththeWLA.

Basin Plan 7-�69 Total Maximum Daily LoadsUpdated September 20��
Element Malibu Creek Watershed Trash TMDLImplementation (continued) Incertaincircumstances,(ifapprovedbytheExecutiveOfficer),
pointsourcedischargersmayalternativelycomplywithWLAsbyimplementing a program for installing partial capture systems (PCS) in conjunction with best management practices. Compliance through implementation of a PCS/BMP program must demonstrate attainment ofWLAsthroughtrashmonitoringinaccordancewiththeTrashMonitoring and Reporting Plan (TMRP) approved by the Executive Officer.
1.CompliancewiththefinalWLAmaybeachievedthroughanadequately sized and maintained full capture system, once the ExecutiveOfficerhascertifiedthatthesystemmeetsthefollowingminimumcriteria.Afullcapturesystem,ataminimum,consistsofany device or series of devices that traps all particles retained by a 5 mm mesh screen and has a design treatment capacity of not less than thepeakflowrate(Q)resultingfromaone-year,one-hour,storminthe sub-drainage area. The rational equation is used to compute the peakflowrate: Q=C×I×A,whereQ=designflowrate(cubicfeetpersecond,cfs); C=runoffcoefficient(dimensionless); I=designrainfallintensity(inchesperhour);and A=subdrainagearea(acres).
Point sources discharges that choose to comply via a full capture system must demonstrate a phased implementation of full capture devices over an8-yearperioduntilthefinalWLAofzeroisattained.Zerowillbedeemed to have been met if full capture systems have been installed on all conveyances discharging to the listed subwatersheds of the Malibu Creek Watershed.
Irrespective of whether point sources employ a full capture system, they maycomplywiththeWLAinanylawfulmanner.
2. Compliance through a PCS/BMP program may be proposed to the Regional Board for incorporation into the relevant NPDES permit.
Nonpoint Sources
LAsshallbeimplementedthrougheither(1)aconditionalwaiverfromwaste discharge requirements, (2) an alternative program implemented through waste discharge requirements, or (3) an individual waiver or another appropriate order of the Regional Board.

Basin Plan 7-�70 Total Maximum Daily LoadsUpdated September 20��
Element Malibu Creek Watershed Trash TMDLImplementation (continued) Non-pointsourcedischargersmayachievecompliancewiththeLAs
byimplementingaMFAC/BMPprogramapprovedbytheExecutiveOfficer.Responsiblejurisdictionsthatareresponsibleforbothpointand nonpoint sources will be deemed in compliance with both the WLAsandLAsifanMFAC/BMPprogram,approvedbytheExecutiveOfficer,isimplemented.
1) Conditional Waiver: Pursuant to Water Code section 13269, waste discharge requirements are waived for any responsible jurisdiction that implementsaMFAC/BMPProgramwhich,tothesatisfactionoftheExecutiveOfficer,meetsthefollowingcriteria:
a) TheMFAC/BMPProgramincludesaninitialminimumfrequency of trash assessment and collection and suite of structuraland/ornonstructuralBMPs.TheMFAC/BMPprogram shall include collection and disposal of all trash found in the water and on the shoreline. Responsible jurisdictions shall implement an initial suite of BMPs based on current trash management practices in land areas that are found to be sources of trash to Malibu Creek Watershed. For individual subwatershed in the Malibu Creek Watershed, the initial minimum frequency shall be set as follows:
Malibu Creek (from Malibu Lagoon to Malibou Lake)1. Within City of Malibu, the waterbody, shorelines and
areas adjacent to Malibu Creek: once per week and within72hoursaftercriticalconditions.
2. WithintheCountyofLosAngelesandintheStateParks:oncepermonth,andwithin72hoursaftercritical conditions.
Malibu Lagoon1. The waterbody, shorelines, beach and areas adjacent to
Malibu Lagoon: twice per week during high visitation seasons from May 15 through October 15.
2. The waterbody, shorelines, beach and areas adjacent to Malibu Lagoon: once per week from October 15 throughMay15,andwithin72hoursaftercriticalconditions.
Malibou LakeOnce per month for the waterbody, shorelines and theadjacentlands,andwithin72hoursaftercriticalconditions.

Basin Plan 7-�7� Total Maximum Daily LoadsUpdated September 20��
Element Malibu Creek Watershed Trash TMDLImplementation (continued) MedeaCreekReach1(MalibouLaketoconfluencewith
Lindero Creek)Twice per month for the waterbody, shorelines and theadjacentareas,andwithin72hoursaftercriticalconditions.
MedeaCreekReach2(aboveconfluence)1. Once per week on the waterbody, shorelines and the
adjacentareasfromtheconfluencewithLinderoCreekto the intersection with Thousand Oaks Blvd., and within72hoursaftercriticalconditions.
2. Twice per month above the intersection with Thousand OaksBlvd.,andwithin72hoursaftercriticalconditions.
LinderoCreekReach1(ConfluencewithMedeaCreektoLakeLindero)
Twice per month for Lindero Creek Reach 1 including the waterbody, shorelines and the adjacent areas, and within72hoursaftercriticalconditions.
LinderoCreekReach2(AboveLakeLindero)Twice per month for Lindero Creek Reach 2 including the waterbody, shorelines and the adjacent areas, and within72hoursaftercriticalconditions.
Lake LinderoTwice per month for the waterbody, shorelines and theadjacentland,andwithin72hoursaftercriticalconditions.
Las Virgenes Creek1. Within the State Parks northerly to the intersection with
MulhollandHighway:oncepermonth,andwithin72hours after critical conditions.
2. Once per week for the waterbody, shorelines and the adjacent areas between Mulholland Highway and Juan BautistaDeAnzaParkatLosHillsRoadintheCityofCalabasas,andwithin72hoursaftercriticalconditions.
3. Twice per week for the waterbody, shorelines and the adjacent areas for the rest of City of Calabasas.
4. OncepermonthforsectioninLosAngelesCountyalongVenturaFreewayandwithin72hoursaftercritical conditions.
5. Within Ventura County, once every two months for the waterbody, shorelines and the adjacent areas, and within72hoursaftercriticalconditions.

Basin Plan 7-�72 Total Maximum Daily LoadsUpdated September 20��
Element Malibu Creek Watershed Trash TMDLImplementation (continued) b) TheMFAC/BMPProgramincludesreasonableassurancesthat
it will be implemented by the responsible jurisdiction.c) TheMFAC/BMPProgramincludesaTrashMonitoringand
Reporting Plan, as described below, and a requirement that the responsible jurisdictions will self-report any non-compliance with its provisions. The results and report of the Trash Monitoring and Reporting Plan must be submitted to Regional Board on an annual basis.
d) MFACprotocolsmaybebasedonSWAMPprotocolsforrapid trash assessment, or alternative protocols proposed by dischargersandapprovedbytheExecutiveOfficer.
e) ImplementationoftheMFAC/BMPprogramshouldincludeaHealthandSafetyPlantoprotectpersonnel.TheMFAC/BMPshall not require responsible jurisdictions to access and collect trash from areas where personnel are prohibited.
TheExecutiveOfficermayapproveorrequirearevisedassessmentandcollectionfrequency,location,anddefinitionofthecriticalconditionsunder the waiver:
(a) To prevent trash from accumulating in deleterious amounts thatcausenuisanceoradverselyaffectbeneficialusesbetweencollections;
(b) Toreflecttheresultsoftrashassessmentandcollection;(c) If the amount of trash collected does not show a decreasing
trend, where necessary to prevent nuisance or adverse effects on beneficialuses,suchthatashorterintervalbetweencollectionsis warranted; or
(d) If the amount of trash collected is decreasing such that a longer interval between collections is warranted.
Attheendoftheimplementationperiod,arevisedMFAC/BMPprogrammayberequirediftheExecutiveOfficerdeterminesthattheamount of trash accumulating between collections is causing nuisance orotherwiseadverselyaffectingbeneficialuses.
Withregardto(a),(b)or(c),above,theExecutiveOfficerisauthorizedto allow responsible jurisdictions to implement additional structural or non-structural BMPs in lieu of modifying the monitoring frequency.
AnywaiversimplementingtheTMDLshallexpirepursuanttoWaterCodesection13269fiveyearsaftertheeffectivedateofthisTMDL,unless reissued. The Regional Board may reissue this waiver through an order consistent herewith, instead of readopting these regulatory provisions.

Basin Plan 7-�7� Total Maximum Daily LoadsUpdated September 20��
Element Malibu Creek Watershed Trash TMDLImplementation (continued) (2)Alternatively,responsiblejurisdictionsmaypropose,orthe
Regional Board may impose, an alternative program which would be implemented through waste discharge requirements, an individual waiver, a cleanup and abatement order, or any other appropriate order or orders, provided the program is consistent with the assumptions and requirementsofthereductionsdescribedinTable7-31.2b,below.
Within six months of the effective date of this TMDL, the Executive Officershallrequireresponsiblejurisdictionstosubmiteitheranoticeof intent to be regulated under the conditional waiver with their proposedMFAC/BMPProgramandTrashMonitoringandReportingPlan (TMRP), or a report of waste discharge.
Monitoring and Reporting Plan
ResponsiblejurisdictionswilldevelopaTMRPforExecutiveOfficerapproval that describes the methodologies that will be used to assess and monitor trash in the listed subwatersheds of the Malibu Creek Watershed and/or within responsible jurisdiction land areas. The TMRPshallincludeaplantoestablishthetrashBaselineWLAsfornon-Caltrans entities, or an alternative to the default trash baseline for Caltrans to prioritize installation of full capture devices. The default trashbaselineWLAforCaltransis2136gallonsperyear.
Requirements for the TMRP shall include, but are not limited to, assessmentandquantificationoftrashcollectedfromthesurfacesandshoreline of the listed waterbodies in the Malibu Creek Watershed or from responsible jurisdiction land areas. The monitoring plan shall provide details of the frequency, location, and reporting of trash monitoring. Responsible jurisdictions shall propose a metric (e.g., weight, volume, pieces of trash) to measure the amount of trash in the listed subwatersheds of the Malibu Creek Watershed and on the land areasurroundingthesesubwatersheds,asdefinedintheExecutiveOfficerapprovedTMRP.
The TMRP shall include a prioritization of areas that have the highest trash generation rates. The TMRP shall give preference to this prioritization when scheduling the installation of full capture devices, BMPs, or trash collection programs.
The TMRP shall also include an evaluation of effectiveness of the MFAC/BMPprogramtopreventtrashfromaccumulatingindeleteriousamountsthatcausenuisanceoradverselyaffectbeneficialusesbetweencollections,proposalstoenhanceBMPs,andarevisedMFACforExecutiveOfficerreview.
ResponsibleJurisdictionsinTable7-31.2aand7-31.2bmaycooperateand coordinate their TMRP activities for Malibu Creek Watershed.
Margin of Safety Zero is a conservative numeric target which contains an implicit margin of safety.

Basin Plan 7-�74 Total Maximum Daily LoadsUpdated September 20��
Element Malibu Creek Watershed Trash TMDLSeasonal Variations and Critical Conditions
Discharge of trash from the conveyances occurs primarily during or shortly after a major rain event. Discharge of trash from nonpoint sources occurs during all seasons, but can be increased during or shortly afterhighwindevents,whicharedefinedasperiodsofwindadvisoriesissued by the National Weather Service.

Basin Plan 7-�75 Total Maximum Daily LoadsUpdated September 20��
Table 7-31.2a Malibu Creek Watershed Trash TMDL: Implementation Schedule - Point SourcesTaskNo. Task Responsible Jurisdiction Date
1 Submit Trash Monitoring and Reporting Plan, including a plan for definingthetrashbaselineWLAandaproposeddefinitionof“major rain event”.
California Department of Transportation, CountyofLosAngeles,CountyofVentura, Ventura County Watershed ProtectionDistrict,CitiesofAgouraHills, Calabasas, Hidden Hills, Malibu, Westlake Village and Thousand Oaks.
6 months from effective date of TMDL. If a plan is not approved by the ExecutiveOfficerwithin9 months, the Executive Officerwillestablishanappropriate monitoring plan.
2 Implement Trash Monitoring and Reporting Plan.
California Department of Transportation, CountyofLosAngeles,CountyofVentura, Ventura County Watershed ProtectionDistrict,CitiesofAgouraHills, Calabasas, Hidden Hills, Malibu, Westlake Village and Thousand Oaks.
6 months from receipt of letter of approval from Regional Board Executive Officer,orthedateaplan is established by the ExecutiveOfficer.
3 Submit results of Trash Monitoring and Reporting Plan, recommend trash baselineWLA,andpropose prioritization of Full Capture System installation or implementation of other measures to attain the required trash reduction.
California Department of Transportation, CountyofLosAngeles,CountyofVentura, Ventura County Watershed ProtectionDistrict,CitiesofAgouraHills, Calabasas, Hidden Hills, Malibu, Westlake Village and Thousand Oaks.
One year from receipt of letter of approval for the Trash Monitoring and Reporting Plan from Regional Board Executive Officer,andannuallythereafter.
4 Installation of Full Capture Systems or other measures to achieve 20% reduction of trash from Baseline WLA*.
California Department of Transportation, CountyofLosAngeles,CountyofVentura, Ventura County Watershed ProtectionDistrict,CitiesofAgouraHills, Calabasas, Hidden Hills, Malibu, Westlake Village and Thousand Oaks.
Four years from effective date of TMDL.
5 Installation of Full Capture Systems or other measures to achieve40%reductionof trash from Baseline WLA*.
California Department of Transportation, CountyofLosAngeles,CountyofVentura, Ventura County Watershed ProtectionDistrict,CitiesofAgouraHills, Calabasas, Hidden Hills, Malibu, Westlake Village and Thousand Oaks.
Five years from effective date of TMDL.
6 Evaluate the effectiveness of Full Capture Systems or other measures, and reconsidertheWLA*.
Regional Board. Five years from effective date of TMDL.

Basin Plan 7-�76 Total Maximum Daily LoadsUpdated September 20��
TaskNo. Task Responsible Jurisdiction Date
7 Installation of Full Capture Systems or other measures to achieve 60% reduction of trash from Baseline WLA*.
California Department of Transportation, CountyofLosAngeles,CountyofVentura, Ventura County Watershed ProtectionDistrict,CitiesofAgouraHills, Calabasas, Hidden Hills, Malibu, Westlake Village and Thousand Oaks.
Six years from effective date of TMDL.
8 Installation of Full Capture Systems or other measures to achieve 80% reduction of trash from Baseline WLA*.
California Department of Transportation, CountyofLosAngeles,CountyofVentura, Ventura County Watershed ProtectionDistrict,CitiesofAgouraHills, Calabasas, Hidden Hills, Malibu, Westlake Village and Thousand Oaks.
Seven years from effective date of TMDL.
9 Installation of Full Capture Systems or other measures to achieve 100% reduction of trash fromBaselineWLA*.
California Department of Transportation, CountyofLosAngeles,CountyofVentura, Ventura County Watershed ProtectionDistrict,CitiesofAgouraHills, Calabasas, Hidden Hills, Malibu, Westlake Village and Thousand Oaks.
Eight years from effective date of TMDL.
*CompliancewithpercentreductionsfromtheBaselineWLAwillbeassumedwhereverfullcapturesystemsareinstalled in corresponding percentages of the conveyance discharging to Malibu Creek Watershed. Installation will be prioritized based on the greatest point source loadings.

Basin Plan 7-�77 Total Maximum Daily LoadsUpdated September 20��
Table 7-31.2b Malibu Creek Watershed Trash TMDL: Implementation Schedule
Minimum Frequency of Assessment and Collection Program * - Nonpoint SourcesTaskNo. Task Responsible Jurisdiction Date
1 Conditional Waiver in effect. National Park Service, California Department of Parks and Recreation, CountyofLosAngeles,CountyofVentura, Ventura County Watershed Protection District, Santa Monica Mountains Conservancy, Cities of AgouraHills,Calabasas,HiddenHills,Malibu, Westlake Village, and Thousand Oaks, and land owners in the vicinity of the waterbodies addressed in the Nonpoint Source Implementation Section ofthisBasinPlanAmendment.
Regional Board adoption of TMDL.
2 Submit Notice of Intent to Comply with Conditional Waiver of Discharge Requirements, including MFAC/BMPProgramand Trash Monitoring and Reporting Plan.
National Park Service, California Department of Parks and Recreation, CountyofLosAngeles,CountyofVentura, Ventura County Watershed Protection District, Santa Monica Mountains Conservancy, Cities of AgouraHills,Calabasas,HiddenHills,Malibu, Westlake Village, and Thousand Oaks, and land owners in the vicinity of the waterbodies addressed in the Nonpoint Source Implementation Section ofthisBasinPlanAmendment.
Six months from TMDL effective date. If a plan is not approved by the Executive Officerwithin9months, the Executive Officerwillestablishanappropriate monitoring plan.
3 ImplementMFAC/BMPProgram.
National Park Service, California Department of Parks and Recreation, CountyofLosAngeles,CountyofVentura, Ventura County Watershed Protection District, Santa Monica Mountains Conservancy, Cities of AgouraHills,Calabasas,HiddenHills,Malibu, Westlake Village, and Thousand Oaks, and land owners in the vicinity of the waterbodies addressed in the Nonpoint Source Implementation Section ofthisBasinPlanAmendment.
6 months from receipt of letter of approval from Regional Board ExecutiveOfficer,or the date a plan is established by the ExecutiveOfficer.

Basin Plan 7-�78 Total Maximum Daily LoadsUpdated September 20��
TaskNo. Task Responsible Jurisdiction Date
4 Submit annual TMRP reports including proposal forrevisingMFAC/BMPforExecutiveOfficerapproval.
National Park Service, California Department of Parks and Recreation, CountyofLosAngeles,CountyofVentura, Ventura County Watershed Protection District, Santa Monica Mountains Conservancy, Cities of AgouraHills,Calabasas,HiddenHills,Malibu, Westlake Village, and Thousand Oaks, and land owners in the vicinity of the waterbodies addressed in the Nonpoint Source Implementation Section ofthisBasinPlanAmendment.
One year from receipt of letter of approval for the Trash Monitoring and Reporting Plan from Regional Board ExecutiveOfficer,andannually thereafter.
5 Reconsideration of Trash TMDL based on evaluation ofeffectivenessofMFAC/BMP program.
Regional Board. Five years from effective date of TMDL.
*AtTask3,allResponsibleJurisdictionsmustbeattainingthezerotrashtargetaftereachrequiredtrashassessmentandcollectionevent.AtTask4,allResponsibleJurisdictionsmustdemonstratefullcomplianceandattainmentofthezerotrashtarget’srequirementthattrashisnotaccumulatingindeleteriousamountsbetweentherequiredtrashassessmentandcollectionevents.BasedonResponsibleJurisdictionmonitoringreports,theExecutiveOfficermayadjusttheminimumfrequency of assessment and collection as necessary to ensure compliance between the required trash assessment and collection events.

Basin Plan 7-�79 Total Maximum Daily LoadsUpdated September 20��
7-37 McGrath Lake PCBs, Pesticides and Sediment Toxicity TMDL
This TMDL was adopted by:The Regional Water Quality Control Board on October 1, 2009.
This TMDL was approved by:TheStateWaterResourcesControlBoardonDecember14,2010.TheOfficeofAdministrativeLawonMay31,2011.TheU.S.EnvironmentalProtectionAgencyonJune30,2011.
The effective date of this TMDL is: June 30, 2011.
TheelementsoftheTMDLarepresentedinTable7-37.1andtheImplementationPlaninTable7-37.2.
Table 7-37.1. McGrath Lake PCBs, Pesticides and Sediment Toxicity TMDL: Elements
TMDL Element Regulatory Provisions
Problem Statement
McGrathLakewasplacedontheCleanWaterActSection303(d)listin1998,2002,and2006 as impaired for organochlorine pesticides (chlordane, dieldrin, DDT and derivatives) and polychlorinated biphenyls (PCBs) in sediment and for sediment toxicity. These toxic organic chemicals bind to soil particles, are stored in the fat tissue of exposed organisms, and create long term environmental impairments. Past studies concluded that sediment toxicityinMcGrathLakewaslikelyduetotheelevatedconcentrationsofpesticidesandPCBs in sediment.
ApplicableWaterQualityObjectivesforthisTMDLarenarrativewaterqualityobjectivesfor Chemical Constituents, Bioaccumulation, Pesticides and Toxicity contained in Chapter 3, the numeric water quality objective for PCBs contained in Chapter 3 and the numeric waterqualitycriteriapromulgatedin40CFR131(CaliforniaToxicsRule(CTR)).
TheexposureoftheMcGrathLakeecosystemtochlordane,DDT,dieldrin,andPCBsinamountsexceedingtheobjectivesandcriteriahasimpairedthebeneficialusesofthelake, including aquatic life uses (rare, threatened or endangered species and estuarine, wildlife, and wetland habitat) and recreation uses (contact and non-contact recreation and commercialandsportfishing).

Basin Plan 7-�80 Total Maximum Daily LoadsUpdated September 20��
TMDL Element Regulatory Provisions
Numeric Targets Water column targets for PCBs, chlordane, DDT, and dieldrin are based on the CTR water quality criteria for protection of human health (organisms only). These criteria are more stringent than those for the protection of aquatic life and thus will protect both aquatic lifeandfishconsumptionbeneficialuses.Thesedimentnumerictargetsarederivedfromthe Effects Range-Low (ER-Ls) guidelines compiled by the National Oceanographic and AtmosphericAdministration(NOAA).Thesedimenttoxicityimpairmentisaddressedbythese numeric targets, which are protective of aquatic life in sediment.
Pollutant Water Column Targets (µg/L)
Sediment Targets (ng/dry g)
Chlordane 0.00059 0.5Dieldrin 0.00014 0.024,4’-DDT 0.00059 14,4’-DDE 0.00059 2.24,4’-DDD 0.00084 2Total DDT -- 1.58Total PCBs 0.00017 22.7
Source Analysis AsourceofthepesticideandPCBloadingiscontaminatedsurfacewaterandsedimentsflushingintoMcGrathLakefromtheCentralDitch,whichdrainsagricultureandotherlands.AllofthecontaminantsincludedinthisTMDLarelegacypollutants.Whiletheyare no longer legally sold or used, they remain ubiquitous in the environment, bound to fine-grainedparticles.Irrigationandrainfallinthewatershedmobilizetheseparticles,whichareloadedtoMcGrathLake.Surfacewater(stormwaterandagriculturaldrainage)accounts for almost half of the total recharge of the lake, while groundwater accounts for the rest of the recharge. Pesticides and PCBs have been detected in the surface water inlet to the lake (Central Ditch) but not in the groundwater from local monitoring wells. There arenopointsourcesofpesticidesorPCBstoMcGrathLake.Atmosphericdepositionmaybe contributing PCBs.
In addition to external loading, the in-situ sediments are likely a source of contaminants to the lake water column due to the high concentrations of contaminants in the sediment.
Linkage Analysis AconceptualmodelidentifiestheassimilativecapacityofMcGrathLakeandlinksthe source loading information to the numeric targets. The chemical properties of the pesticides and PCBs result in strong binding to particulate matter, therefore most of the incoming contaminants from the Central Ditch to the lake are bound to suspended solids. However,pesticideexceedancesareobservedintheCentralDitcheveninlow-flowconditions, indicating that some of the contaminants are transported to the lake in the water fraction. Therefore, there are water column and suspended sediment allocations for the Central Ditch.
Once the suspended sediment settles to the lake bottom, desorption is possible due to the high contaminant concentrations, favorable environmental conditions and extended contact time (between the sediment and water). The contaminated lake sediments are toxic to benthic organisms and may also be taken up through bioturbation and feeding processes. Therefore, both external loading sources from the lake subwatershed and internal loading from contaminated lake sediments are assigned load allocations.

Basin Plan 7-�8� Total Maximum Daily LoadsUpdated September 20��
TMDL Element Regulatory Provisions
Load Allocations
Loadallocations(LAs)addressingnon-pointsourcesofpesticidesandPCBsareassignedto discharges from the Central Ditch to the lake and internal sources from the lake sediments.Thelakesedimentsaredefinedasbedsedimentsinthemainbodyofthelakeand the riparian corridor west of Harbor Boulevard.
Thein-lakeLAsareforconcentrationsinsedimentonly.
Pollutant LoadAllocationforConcentration in Lake Sediment (µg/dry kg)
Chlordane 0.5Dieldrin 0.024,4’-DDT 14,4’-DDE 2.24,4’-DDD 2Total DDT 1.58Total PCBs 22.7
TheCentralDitchLAsareforconcentrationsinbothsuspendedsedimentandwater.
Pollutant Water Column Load Allocation(µg/L)
LoadAllocationforConcentration in Suspended Sediment (µg/dry kg)
Chlordane 0.00059 0.5Dieldrin 0.00014 0.024,4’-DDT 0.00059 14,4’-DDE 0.00059 2.24,4’-DDD 0.00084 2Total DDT -- 1.58Total PCBs 0.00017 22.7
Margin of Safety The uncertainties associated with this TMDL are due to limited data on the amount and media by which PCBs and pesticides are entering the lake and the extent to which these contaminants are already in the lake. The seasonal and annual variability in the hydrologic budget also creates uncertainty. To address these uncertainties, an implicit margin of safety is applied. Conservative assumptions were used to calculate the loading to the lake and more the protective ER-L sediment quality guidelines were used for the sediment numeric targets.

Basin Plan 7-�82 Total Maximum Daily LoadsUpdated September 20��
TMDL Element Regulatory Provisions
Seasonal Variations and Critical Conditions
AsthecontaminantsofconcernforthisTMDLaretransportedtothelakebythemobilizationofsediment,itisexpectedthatthegreatestinfluxofPCBsandpesticidesoccursduringperiodsofincreasedrunofffromthewatershed.Duetotheartificialinterference in the watershed hydrologic cycle due to agricultural activities, peak runoff may not correspond to the southern California wet season. Seasonal variations and critical conditions are addressed by the use of concentration-based load allocations. However, due to the bioaccumulative properties of the pollutants, effects occur over extended time periods, which minimizes the importance of seasonal variations.
Monitoring Monitoring Program
The monitoring program shall measure the progress of pollutant load reductions and improvements in water and sediment quality. The monitoring program shall:
• Determine attainment of numeric targets for PCBs and pesticides;• Determine compliance with the load allocations for PCBs and pesticides; and• Monitor the effect of implementation actions on lake water and sediment quality.
Themonitoringprogramshallconsistoftwophases.ThefirstphasewillfocusonsamplingtheCentralDitch(forthefirst10yearsoftheTMDLimplementationschedule)andwillbeconductedbytheresponsiblepartiesfortheCentralDitchLAs.Fortheremaining portion of the TMDL implementation schedule, required water and sediment samples will be collected from the Central Ditch by “responsible parties” for the Central DitchLAs,whilerequiredwaterandsedimentsampleswillbecollectedfromthelakeasprescribedbytheMcGrathLakeWorkPlan(MLWP)developedpursuanttoaMemorandumofAgreement(MOA)enteredintobyandbetween“cooperativeparties”andtheRegionalBoard.The“responsibleparties”and“cooperativeparties”aredefinedin the implementation section below.
Phase 1Phase 1 requires the development of a monitoring and reporting plan (MRP) to comply with the TMDL requirements. The MRP shall propose a monitoring frequency for water and sediment sampling that will characterize the variability in water and sediment quality observed in the Central Ditch. Water samples will be analyzed for the following constituents:
• Total Organic Carbon• Total Suspended Solids• Total PCBs• DDT and Derivatives• Dieldrin• Total Chlordane

Basin Plan 7-�8� Total Maximum Daily LoadsUpdated September 20��
TMDL Element Regulatory Provisions
Monitoring (continued)
Sediment samples will be analyzed for the following constituents:
• Total Organic Carbon• Total PCBs• DDT and Derivatives• Dieldrin• Total Chlordane
The annual monitoring reports will summarize proposed changes to the MRP based ontheresultsofthepreviousyear’smonitoring.Samplingfrequencymaybereducedduring future years once characterization of the variability in water and sediment quality has been achieved. In addition to the constituents above, general water chemistry (temperature,dissolvedoxygen,pHandelectricalconductivity)andaflowmeasurementwill be required at each sampling event.
Responsible parties for phase 1 monitoring shall submit a MRP plan to assess compliance withLAsandaQualityAssuranceProjectPlan(QAPP).TheMRPandQAPPmustbesubmittedtotheExecutiveOfficerforapprovalwithinsixmonthsoftheeffectivedateoftheTMDL.TheQAPPshallincludeprotocolsforsamplecollection,standardanalyticalprocedures,andlaboratorycertification.AllsamplesshallbecollectedinaccordancewithSurfaceWaterAmbientMonitoringProgram(SWAMP)protocols,whereavailableoralternativeprotocolsproposedbydischargersandapprovedbytheExecutiveOfficer.Monitoringshallbegin90daysaftertheExecutiveOfficerhasapprovedtheMRPandQAPP.
AtthetimeofTMDLadoption,severaloftheconstituentsofconcernhadnumerictargetslowerthanthelaboratorydetectionlimits.Asanalyticalmethodsanddetectionlimits continue to improve (i.e. development of lower detection limits) and become more environmentally relevant, responsible parties shall incorporate new analytical methods withlowerdetectionlimitsintheMRPandtheQAPP. AmonitoringreportshallbepreparedandsubmittedtotheRegionalBoardannuallywithinthreemonthsafterthecompletionofthefinalsamplingeventoftheyear.
Phase 2Thesampling,analysisandflowmeasurementsbeguninPhase1willcontinue.Additionally,sampleswillbecollectedfromwithinthelake.Watercolumnandsurficialsediment (top 2 cm) samples will be collected at the northern end of the lake and from thedeepestportionofthelake.AllsampleswillbecollectedinaccordancewithSWAMPprotocols. Cooperative parties shall only commence, participate or fund the Phase 2 monitoring as provided in the MLWP.

Basin Plan 7-�84 Total Maximum Daily LoadsUpdated September 20��
TMDL Element Regulatory Provisions
Monitoring (continued)
Water samples will be analyzed for the following constituents:
• Total Organic Carbon• Total Suspended Solids• Total PCBs• DDT and Derivatives• Dieldrin• Total Chlordane
Sediment samples will be analyzed for the following constituents:
• Total Organic Carbon• Total PCBs• DDT and Derivatives• Dieldrin• Total Chlordane• Toxicity (if toxicity is determined, a TIE shall be completed to elucidate the cause of
the toxicity)
Samples from the lake will be collected annually. The annual reports required for Phase 1 willcontinueduringPhase2.Additionalmonitoringmayberequireddependingonwhichimplementation option is chosen.
Three years from the effective date of the TMDL, cooperative parties must submit the MLWP as discussed in the implementation section below.
AtthetimeofTMDLadoption,severaloftheconstituentsofconcernhadnumerictargetslowerthanthelaboratorydetectionlimits.AllrequiredmonitoringunderPhase1andPhase 2 shall incorporate new analytical methods, once commercially available with lowerdetectionlimits,intheMRPandtheQAPP. AmonitoringreportshallbepreparedandsubmittedtotheRegionalBoardannuallywithinthreemonthsafterthecompletionofthefinalsamplingeventoftheyear.
Implementation Plan
Compliance with this TMDL will require the elimination of pollutant loads in toxic amountsfromtheCentralDitchtothelakeandidentificationandimplementationofstrategiestoremediatethecontaminatedsedimentsatthebottomofthelake.Table7-37.2containsascheduleforcooperativepartiestoimplementaMOAtojointlydevelopthe MLWP to implement strategies to remediate the contaminated lake sediments and achieve lake sediment load allocations.
I.ImplementationandDeterminationofCompliancewiththeCentralDitchLAsforAgriculturalNon-pointSourceDischarges
The Central Ditch load allocations assigned to agriculture non-point source dischargers will be implemented through the Conditional Waiver of Waste Discharge Requirements for Discharges from Irrigated Lands (Conditional Waiver) or other appropriate Regional Board Orders. The load allocations for the Central Ditch shall be incorporated into the Conditional Waiver or other appropriate Regional Board Orders.

Basin Plan 7-�85 Total Maximum Daily LoadsUpdated September 20��
TMDL Element Regulatory Provisions
Implementation Plan (continued)
It is likely that a combination of implementation measures will be needed to achieve the LAs.TheCentralDitchimplementationactionsmayinclude,butarenotlimitedtothefollowing:
• On-Farm BMPs• Regional Sub-Watershed BMPs• Regional Treatment System• RedirectAgricultureDischarge
Theestimatedcostsforon-farmBMPssuchasbuffercrops,filterstrips,andsedimentationbasinsareapproximately$373/acreofBMP,$1002/acreofBMP,and$10,000/acre of BMP, respectively. The estimated costs for regional sub-watershed BMPs, such as converting the Central Ditch to a grassed waterway or converting the dirtroadthatrunsalongtheCentralDitchintoafilterstrip,areapproximately$1,288/per acre of BMP and $1002/per acre of BMP, respectively. The estimated cost of a regional treatment system to address the Central Ditch water is about $151,536/year. The estimated costs to redirect the agriculture discharge toward a nearby canal are $612,611 (openditch)to$1,287,402(pipeddiversion).Potentialsourcesoffinancingfortheseimplementationalternatives,suchasCleanWaterActsection319(h)grantfunding,arediscussedinChapter4.AsdiscussedinChapter4,theU.S.DepartmentofAgricultureSoil Conservation Service and the Resource Conservation Districts provide information on, and assistance in, implementing BMPs.
AgriculturalDischargerswillbeconsideredincompliancewiththeTMDLLAsiftheycomplywithallprovisionsoftheConditionalWaiverestablishedtoimplementtheLAs,or those of any alternative regulatory order, if any, that may be established to implement theLAsinlieuoftheConditionalWaiver.
II.ImplementationofMemorandumofAgreementtoDevelopMcGrathLakeWorkPlanandDeterminationofCompliancewithLAsforContaminatedLakeSediments
ThecontaminatedlakesedimentLAsmaybeimplementedthroughaMOA,whichtheExecutiveOfficerisauthorizedtonegotiateandexecute,provideditisconsistentwiththefollowing:TheMOAshalldetailthevoluntaryeffortsthatwillbeundertakentoattaintheloadallocations.TheMOAshallcomplywiththeWater Quality Control Policy for AddressingImpairedWaters:RegulatoryStructureandOptions (“Policy”), including part II, section 2 (c)(ii) and related provisions, and shall be consistent with the requirements ofthisTMDL.IftheMOAistimelyadoptedinaccordancewiththeimplementationschedulebelow,theprogramdescribedintheMOAshallbedeemed“certified”,pursuanttothePolicy,subjecttotheconditionsofPolicysection2(e).TheMOAshallincludedevelopmentoftheMLWP,whichmustbeapprovedbytheExecutiveOfficer,andmaybeamendedwithExecutiveOfficerapproval,asnecessary.ImplementationoftheMOAshallbereviewedannuallybytheExecutiveOfficeraspartoftheMRPannualreports.

Basin Plan 7-�86 Total Maximum Daily LoadsUpdated September 20��
TMDL Element Regulatory Provisions
Implementation Plan (continued)
ThepurposeoftheMOAisnottocreateevidenceofresponsibilityorascertainlegalliability for subsequent remediation of the lake sediments, but rather to organize stakeholders who have an interest in the remediation of the lake sediments.
To be a valid non-regulatory implementation program adopted by the Regional Board, the MOAshallincludethefollowingrequirementsandconditions:
• TheMOAshalldirectdevelopmentofaMLWPthataddressestheimpairedwaterbodyasapprovedbytheExecutiveOfficer.
• TheMOAshalloutlinetherolesandresponsibilitiesoftheRegionalBoardandeach cooperative party.
• TheMOAshallcontainconditionsthatrequiretrackableprogressonattainingloadallocationsandnumerictargets.Atimelineshallbeincludedthatidentifiesthe point(s) at which Regional Board regulatory intervention and oversight will be triggered if the pace of work lags or fails.
• TheMOAshallcontainaprovisionthatitshallberevokedbaseduponfindingsthat the program has not been adequately implemented, is not achieving its goals, or is no longer adequate to restore water quality.
• TheMOAshallbeconsistentwiththeCalifornia Policy for Implementation and Enforcement of the Non-point Source Pollution Control Program, including but not limited to, the “Key Elements of a Non-point Source Pollution Control Implementation Program”.
PursuanttothetermsoftheMOA,thecooperativepartiesandtheRegionalBoardwillwork jointly to develop the MLWP and remediate the lake sediments. The purpose of the MLWP is to set forth strategies to achieve lake sediment load allocations in a manner that isbeneficialtosubwatershedlandownersandthepublicingeneral.TothesatisfactionoftheExecutiveOfficer,theMLWPshallmeetthefollowingcriteria:
• Three years from the effective date of the TMDL cooperative parties shall submit aMLWPforapprovalbytheExecutiveOfficer.
• TheMLWPshallincludeidentificationofimplementationmeasuresthatwillachievelakesedimentLAs.
• The MLWP shall include any additional monitoring needed to assess the effectivenessoftheMLWP’schosenimplementationstrategies.
• TheMLWPshallincludeaMRPandQAPPforphase2monitoring.
• The MLWP shall include a strategy to secure funds necessary to remediate the lake sediments and achieve lake sediment allocations.
Basin Plan 7-�87 Total Maximum Daily LoadsUpdated September 20��
TMDL Element Regulatory Provisions
Implementation Plan (continued)
• The MLWP shall include tasks and a clear timeline for task completion leading toattainmentoflakesedimentLAs.Therolesandresponsibilitiesofeachcooperative party shall also be outlined in the MLWP.
• The MLWP shall consider and address the potential impacts of lake sediment remediationstrategiesontheimplementationoftheMcGrathBeachBacteriaTMDLandongoingrestorationeffortsatMcGrathStateBeach.
• The MLWP shall achieve compliance with the load allocations through the implementation of lake management strategies to reduce and manage internal pesticide and PCBs sources from lake bed sediments. The lake management implementation actions may include:
• Sediment Capping;• Dredging/Hydraulic Dredging;• MonitoredNaturalAttenuation;or• Other appropriate means of implementation.
TheExecutiveOfficermayrequirearevisedMLWPtoreflecttheresultsofdataobtainedthrough TMDL implementation.
III. APPLICATIONOFALLOCATIONS
A.ResponsiblepartiesfortheCentralDitchLAsaretheagriculturaldischargersintheMcGrathLakesub-watershed.
B.ResponsiblepartiesforthelakesedimentLAshavenotyetbeenidentified.Instead,cooperativepartiesforthelakesedimentLAsareidentified,notasresponsibleparties or as dischargers, but as landowners in the subwatershed who may execute a MOAjointlywiththeRegionalBoardforthedevelopmentoftheMLWPsothatlakesediment allocations can be achieved in a manner that is in the best interest of both the subwatershed landowners and the public in general.
CooperativepartiesforthelakesedimentLAsinclude:• State of California Department of Parks and Recreation• McGrathFamily(ownersoftheCentralDitchwestofHarborBlvdandthe
northern end of the lake)• AgriculturalLandownersintheMcGrathLakesub-watershed• VenturaRegionalSanitationDistrict(BailardLandfill)

Basin Plan 7-�88 Total Maximum Daily LoadsUpdated September 20��
TMDL Element Regulatory Provisions
Implementation Plan (continued)
IfaMOAisnotestablishedbyandbetweencooperativepartiesandtheRegionalBoardwithin two years of the effective date of the TMDL, or the cooperative parties do not complywiththetermsoftheMOA,oriftheMOAandMLWParenotimplementedorotherwise do not result in attainment of load allocations consistent with the provisions and scheduleoftheTMDL,theExecutiveOfficershallinitiateaninvestigation,withinputfrom current landowners, to (1) identify the responsible parties, whether named in this TMDL or not, whose discharges of the legacy pollutants have caused or contributed to the impairment of the lake; (2) ascertain the whereabouts and capacities of those responsible parties and/or their successors; (3) determine the parties to whom responsibility for remediationofsedimentsshouldbeassigned;and(4)issueappropriateregulatoryordersto those responsible parties.
Inaddition,acomprehensivereviewoftheMOAbytheExecutiveOfficershalltakeplacefiveyearsfromtheeffectivedateoftheMOA.ThepurposeofthisreviewistoensureadequateprogresspursuanttothetimelineestablishedintheMOAondevelopmentoftheMLWP and ultimately attainment of the lake sediment load allocations. If the Executive Officerdeterminesthatadequateprogresshasnotbeenmade,theRegionalBoardshallinitiate the investigation described above.
IftheExecutiveOfficerisunabletoidentifytheresponsiblepartiespertheinvestigationsabove, then the TMDL shall be reconsidered.

Basin Plan 7-�89 Total Maximum Daily LoadsUpdated September 20��
Table 7-37.2 McGrath Lake PCBs and Pesticides TMDL: Implementation ScheduleTask
NumberTask Deadline
1 ResponsiblepartiesassignedCentralDitchLAsshall submit a Monitoring and Reporting Plan (MRP)totheExecutiveOfficerforreviewandapproval to address Phase 1 monitoring.
6 months from the effective date of the TMDL
2 ResponsiblepartiesassignedCentralDitchLAsshall begin monitoring as outlined in the approved MRP.
90 days from the date of MRP approval
3 ResponsiblepartiesassignedCentralDitchLAsshall submit annual monitoring reports. Reports shall be submitted within three months after the completionofthefinalsamplingeventoftheyear.
Annually
4 Cooperative parties shall enter into a MemorandumofAgreement(MOA)withtheRegional Board to implement the lake sediment LAs.
Two years from the effective date of the TMDL
5 PartiessubjecttotheMOAshallsubmitaMcGrathLake Work Plan (MLWP) for review and approval bytheExecutiveOfficer.
Three years from the effective date of the TMDL
6 PartiessubjecttotheMOAshallsubmitannualprogress reports.
Annuallyfromthedateof MLWP approval
7 ResponsiblepartiesshallattainCentralDitchLAs. 10 years from the effective date of the TMDL
8 BeginimplementationofMcGrathLakesedimentremediation actions based on MLWP.
Assoonaspossible,butno later than 10 years from the effective date of the TMDL
9 Phase 2 monitoring shall begin as outlined in the MLWP. The results shall be included as part of the annual progress reports initiated in Task 6.
To be determined based on MLWP.
10 LakesedimentLAsshallbeachieved. 14yearsfromtheeffective date of the TMDL