california one-stop system cost study reportvcoao081/research and publication/cost study...
TRANSCRIPT

California One-Stop System
Cost Study Report
October 18, 2007
Prepared for The California Workforce Investment Board
By Richard W. Moore, Ph.D. Philip C. Gorman, Ph.D. Andrew Wilson, MBA The College of Business and Economics

California One-Stop System Cost Study Report
ii
Executive Summary California’s One-Stop Career Centers began with a bold vision of bringing together a host of federal, state, and local programs under one roof, with a common goal, to better serve people seeking to improve their lives through education, training or employment. In 2006 the California Workforce Investment Board’s (CWIB) Accountability Committee was uncertain how well the vision had been realized and wanted to examine California’s One-Stops through a new lens. The committee called for a cost study of the One-Stop Career System. In the committee’s view:
The reality is that there is inconsistent integration of services and no centralized accounting process within the System that effectively controls or accounts for all resources utilized to produce the System’s Outputs….As a result, the One-Stop System appears to some of its customers and outside observers as a fragmented and inefficient business enterprise.1
The Study Approach To complete a cost study of One-Stops, the CWIB contracted with a team of researchers in the College of Business and Economics at California State University, Northridge to analyze the costs and operations of California’s One-Stop Career Centers. The comprehensive report of study and appendices are available on the CWIB Website at www.calwia.org. Working with staff from EDD and the CWIB, the Cal State Northridge team developed the following research questions to guide the study:
1. What resources do California One-Stops have and where do they spend them? 2. What do partners contribute to the operation of the One-Stop and how does the
pattern vary between sites? 3. How much and what types of services do One-Stops produce, and how do sites vary
from each other? 4. What do different One-Stop services cost to produce and how do costs vary between
sites? 5. Can standard measures or service units and costs be developed and applied across
One-Stops? The study designed to answer these questions had two phases. In Phase I, the research team conducted four in-depth case studies. The goal of the case studies was to answer the research questions and develop methods that could be replicated in a state-wide survey of One-Stops. In Phase II of the study, the team conducted a survey of 18 comprehensive One-Stops, which when added to the case study data provided a study population of 22 full service One-Stops. To get the best response possible, we promised each One-Stop anonymity. In the report you will see sites are designated by generic names such as “large southern urban One-Stop” to protect each site’s confidentiality.
1 From: “Proposal by the California Workforce Investment Board Accountability Committee for a Cost Study of the One-Stop Career System”, October 28, 2005.

California One-Stop System Cost Study Report
iii
This is the first study to look at the consolidated costs and the consolidated services across the full range of on-site partners in a group of One-Stops. The study used the Activity Based Cost (ABC) accounting model to conduct its analysis. The purpose of Activity Based Costing is to better understand the real costs of producing a product or service.2 The ABC approach focuses on the processes and activities that produce specific services rather than the traditional line items found in government budgets. In short, ABC is a dramatic departure from traditional government budgets, and we believed it would provide valuable insights into the costs of One-Stops. The ABC accounting model begins by mapping the processes and activities that generate costs and produce services. Our case studies revealed that the One-Stops were built around four processes:
• A universal services process, where an person can walk in to One-Stop and use services to find a job or training opportunities;
• An enrolled services process, eligible clients formally enroll in programs such as the WIA Adult program, the Trade Adjustment Assistance Act program or CalWorks;
• A business services process, services to business ranging from workshops on writing a business plan to rapid response services for companies facing a layoff or closure;
• A youth services process, services to eligible youth that range academic support to case management, to help finding a summer job.
Within each process were multiple activities, and each process produced multiple services lines. Using this framework, the study estimated the costs of processes and the activities within them, and then estimated the cost-per-unit of services produced. It also estimated the costs incurred by partners within the One-Stops associated with each process. Here’s a quick word about what this study is not. This study is not an evaluation of the One-Stop system. It is not an attempt to make judgments about what costs are appropriate or what activities are most efficient; rather, we endeavor to describe as clearly as possible what we observed. There are no standards or regulations for what services should cost in One-Stops, or what partners should contribute, or which services should be produced in what volume. So there was no yardstick against which to evaluate what we found. Further, this is not a study of the larger workforce development system. This study is restricted to services provided by personnel who were based “under the roof” of the One-Stop at the time the services were provided. Services that were conducted off-site by personnel who were not based at the One-Stop, such as training at a local community college, were not included in the analysis. With these limits in mind, here is a brief summary of our results for the research questions posed before. 1. What resources do California One-Stops have and where do they spend them? The 22 sites studied had annual costs of $66.5 million, with an average cost of about $3 million, but a median cost (the point at which half the sites were above and half below) of $2.4 million. Costs ranged from a low of $900,000 to a high of $10 million. 2 For a general introduction to ABC see Cokins, Gary, et.al (1992) An ABC Manager’s Primer: Straight Talk on Activity-Based Costing, Irwin Publishing.

California One-Stop System Cost Study Report
iv
We found the activities that took place in the One-Stops could be placed within four processes noted above: “universal services process,” “enrolled services process,” “business services process,” and “youth services process.” We then estimated the percentage of total costs generated by each process. Summing across all 22 sites, we found that the “enrolled services process” accounted for the largest amount of costs at 48%, followed by “universal services”, “business services” and “youth services” (which were present in about half the One-Stops). Figure E-1: Percent of Cost By Process Across All Sites
Universal Services
30%
Enrolled Services
48%
Youth Services
9%Business Services
13%
2. What do partners contribute to the operation of the One-Stop and how does the
pattern vary between sites? Across all 22 sites partners’ costs accounted for about 34% or $22.4 million of total costs for the One-Stops studied. Figure E-2: Local Area Costs and Partner Costs
Local Area Costs
$44,017,466
Partner Costs$22,451,795
California One-Stop System Cost Study Report
v
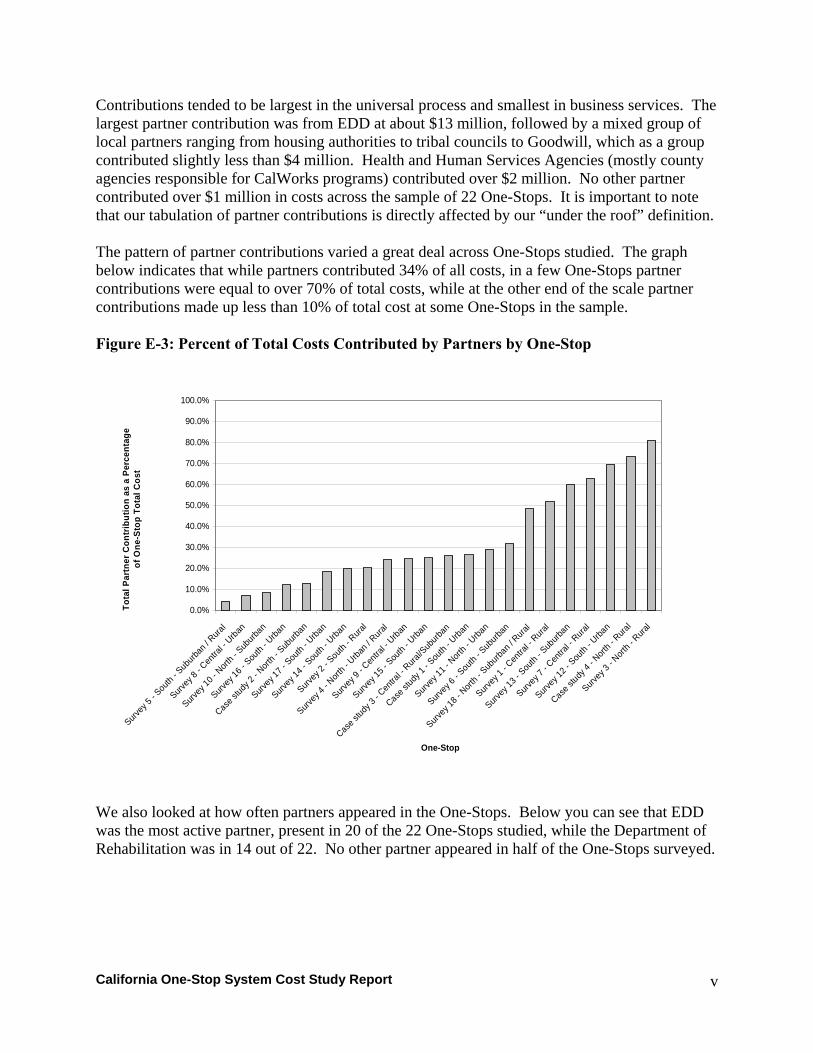
Contributions tended to be largest in the universal process and smallest in business services. The largest partner contribution was from EDD at about $13 million, followed by a mixed group of local partners ranging from housing authorities to tribal councils to Goodwill, which as a group contributed slightly less than $4 million. Health and Human Services Agencies (mostly county agencies responsible for CalWorks programs) contributed over $2 million. No other partner contributed over $1 million in costs across the sample of 22 One-Stops. It is important to note that our tabulation of partner contributions is directly affected by our “under the roof” definition. The pattern of partner contributions varied a great deal across One-Stops studied. The graph below indicates that while partners contributed 34% of all costs, in a few One-Stops partner contributions were equal to over 70% of total costs, while at the other end of the scale partner contributions made up less than 10% of total cost at some One-Stops in the sample. Figure E-3: Percent of Total Costs Contributed by Partners by One-Stop
0.0%
10.0%
20.0%
30.0%
40.0%
50.0%
60.0%
70.0%
80.0%
90.0%
100.0%
Survey
5 - S
outh
- Subu
rban /
Rura
l
Survey
8 - C
entra
l - Urba
n
Survey 1
0 - N
orth -
Suburb
an
Survey
16 - S
outh
- Urba
n
Case s
tudy 2
- Nort
h - Sub
urban
Survey 1
7 - Sou
th - U
rban
Survey
14 - S
outh
- Urba
n
Survey
2 - S
outh
- Rura
l
Survey
4 - N
orth -
Urba
n / R
ural
Survey
9 - C
entra
l - Urba
n
Survey
15 - S
outh
- Urba
n
Case s
tudy 3
- Cen
tral -
Rural/S
uburb
an
Case s
tudy 1
- Sou
th - U
rban
Survey
11 - N
orth -
Urba
n
Survey
6 - S
outh
- Sub
urban
Survey
18 - N
orth -
Suburb
an / R
ural
Survey
1 - C
entra
l - Rura
l
Survey
13 - S
outh
- Sub
urban
Survey 7
- Cen
tral -
Rural
Survey 1
2 - Sou
th - U
rban
Case st
udy 4
- Nort
h - R
ural
Survey
3 - N
orth -
Rura
l
One-Stop
Tota
l Par
tner
Con
trib
utio
n as
a P
erce
ntag
eof
One
-Sto
p To
tal C
ost
We also looked at how often partners appeared in the One-Stops. Below you can see that EDD was the most active partner, present in 20 of the 22 One-Stops studied, while the Department of Rehabilitation was in 14 out of 22. No other partner appeared in half of the One-Stops surveyed.

California One-Stop System Cost Study Report
vi
Figure E-4: Number of One-Stops Served by Partners
0
2
4
6
8
10
12
14
16
18
20
22
Vetera
ns A
dmin.
ABLESBDC
AARP
Aging a
nd A
dult
Job C
orps
HHSA
Loca
l Adu
lt Sch
ool
Other L
ocal
Schoo
l
Loca
l Coll
ege /
Univ
ersity
DOR
Other L
ocal
Partne
rsEDD
Partner
Num
ber o
f One
-Sto
ps S
erve
d by
Par
tner
3. How much and what types of services do One-Stops produce, and how do sites vary
from each other? 4. What do different One-Stop services cost to produce and how do costs vary between
sites? These are two complex and closely related questions. As a new enterprise, One-Stops do not have standard cost indicators like those found in more mature organizations. In the analysis, we developed a wide array of cost per-unit of service measures which can evolve into valuable management tools. From the case studies, we developed a standard set of services One-Stops produced and then estimated the per-unit cost of producing those services, by dividing the total costs of a service by the number of units produced at each One-Stop. In the table below we present what we believe are the most valuable “cost-per” measures for understanding One-Stop operations by process. Table E-1: Services by Process: Median Cost and Range Of Cost Per-Unit of Service and Range Process/ Unit of Service Median Cost Per Range Universal Services Per Universal Client $166 $33 - $554 Per Universal Visit $41 $8 - $146 Per Coaching and 1-on-1 assistance
Event $20 $6 - 145

California One-Stop System Cost Study Report
vii
Process/ Unit of Service Median Cost Per Range Enrolled Service Per Enrolled Client $2,671 $579 - $8,015 Per Client Receiving Case Management $1,208 $218 - $4,543 Per Enrolled Client Placed $7,012 $739 - $20,708 Business Services Per Rapid Response Employer Assisted $964 $62 - $18,127 Per Rapid Response Employee Assisted $157 $3 - $4,671 Per Mass Hire Event $2,934 $355 - $11,524 Youth Per Youth Served $3,837 $546 - $20,178 Per Youth Placed in Employment $2,526 $617 - $6,328 Universal Services Universal services accounted for about 25% of the costs in the One-Stops in the sample. These services are open to anyone who walks into a One-Stop. In theory, Universal services are provided on a self-service basis, but much like the public library, many clients need help and One-Stops provide it by offering some one-on-one coaching, such as reviewing resumes or helping with computers. From our case study experience we found that there were three key cost-per-unit measures for universal services: cost per universal client, cost per universal visit and cost per one-on-one assistance event. The median cost per universal client was $166, with a range of only $33 to $554. The cost per client visit tends to cluster around $40 a visit with a few outliers at higher and lower costs. This is not surprising, as we found in our case studies that most universal access processes deliver roughly the same types of services, and hence have similar costs. The variance in cost-per-client is explained mostly by the average number of visits made by clients. The average number of visits by universal clients varies across the sites from one to twelve visits per client. Obviously, clients who visit many times on average will cost more to serve than clients who come a few times. Finally, we found the median cost of providing one-on-one assistance to be about $20 per event. Enrolled Services The enrolled services process is the most costly process within the One-Stops, accounting for 48% of sampled One-Stop costs. We found three key cost-per-unit measures: the cost per enrolled client, cost per client receiving case management and cost per client placed. Cost per enrolled client had a median of almost $2,700, with a wide range from less than $600 to over $8,000. The variance in cost was driven in part by the type of client. In sites where there was a large CalWorks program in which clients got extensive case management over many months, costs were higher than in One-Stops with only WIA clients. Similarly, if sites provided training services in the One-Stop rather than contracting them out, costs tended to be higher.

California One-Stop System Cost Study Report
viii
Business Services One of the key business services we looked at were rapid response services, where One-Stops provide services to businesses facing a layoff or shut down. Another was mass hire events, where a large business such as a big box retailer is seeking a number of employees, and the One-Stop will advertise and provide a facility to the employer to meet and interview employees. We examined rapid response from two perspectives: the number of employers assisted and number of employees assisted. As the table above indicates, the median cost of providing rapid response services to a business was $964, but the cost ranged widely. When we looked at the cost of assisting an employee with rapid response service the median cost was $157, again with a wide range. The wide variation is due to the variety of interventions offered and the size of the companies. In one case, the One-Stop may just provide some routine information to the company, while in another they may set up extensive on-site services. Similarly, the number of companies served affects the cost per company served; the number of companies served ranged from 450 to a handful. The median cost of a mass hire event was $2,934, with a median cost per applicant interviewed of $48. The wide range in costs is driven by the number of clients interviewed and the amount of marketing and logistics that go into the event. Youth Services Only about half the One-Stops surveyed had a youth program housed under the roof, so our measures in this process are more limited and more variable. We saw two key indicators here; the cost per youth served, which is simply the total number of youth served divided by the total cost of the youth process and the cost of placing a youth in any type of employment experience. The median cost per youth receiving services was $3,837, substantially higher than the median cost for enrolled adults. The costs varied widely from only $546 to over $20,000, but most sites had costs between $2,000 and $7,000 per youth. Again, the wide variation in volume of service delivered may account for the different costs in large part. The median cost per youth who was placed in some type of employment (work experience, summer job, and regular employment) was $2,526. 5. Can standard measures or service units and costs be developed and applied across
One-Stops? We believe the results of this study clearly show that such a set of standard measures can be developed. The full report shows the detailed definitions and calculations we used for measures we developed. Below we propose a process lead by the CWIB to develop a sophisticated measurement system for One-Stops.

California One-Stop System Cost Study Report
ix
Conclusions This project is the first Activity Based Cost Accounting (ABC) analysis of One-Stop Career Centers and their finances and as such this project raises as many questions as it answers. Our goal was not to evaluate how the One-Stops manage their costs but to describe objectively what is happening in the field in terms of operations and finances and to provide a model for how One-Stop costs and operations could be measured. The study does have a few observations which will add some insight for policymakers and practitioners:
• Traditional federal, state and local funding streams still drive how One-Stops conceptualize costs and services, and undermine managers’ ability to see their operation holistically.
• There are few standard measures for units of service produced, so comparison and benchmarking against other sites or over time is difficult.
• Partner relations vary widely, based on local conditions, funding and eligibility requirements for each program, and the personal networks of One-Stop managers.
• One-Stops tend to structure their processes around the WIA program, so the four processes we uncovered appear to be fairly consistent across sites.
• One-Stop services were customized to local needs and this accounts in large part for the differences in costs between sites.
• Recommendations Finally, we recommend that the State Board take the lead in developing a voluntary system of standard measures of costs and services for the One-Stops. Such a system can evolve over time into a powerful method for improving the performance of One-Stops. We see four specific steps the Board could take to promote the development of such a system:
• Extend the ABC analysis to different types of One-Stops, including satellite One-Stops and smaller, less-than-comprehensive One-Stops.
• Form a voluntary group of One-Stop managers and policy makers to develop a limited set of key “workforce industry measures” based on their expert opinion and the results of this study.
• Create a voluntary centralized data-base system where One-Stops can submit data on line and have key measures calculated and returned, benchmarked against other similar One-Stops.
• Link cost analysis to performance outcome measures that include all programs housed “under the One-Stop roof.” These data can start to create a framework for reliable valid cost/benefit analyses and ultimately a return on investment analysis.
The complete report is available at www.calwia.org .

California One-Stop System Cost Study Report
x
Acknowledgements
This project was designed to be a collaborative effort so we have many contributions to acknowledge. First, we want to thank to the 22 One-Stop Career Centers and their local WIA programs and partners for being willing to share their data with us and investing the time and effort it took to complete the survey. We particularly want to thank the case study sites who hosted our study team for several days each. Because we promised the sites strict confidentiality, we are unable to name them here. We would also like to thank the California Workforce Association and Virginia Hamilton for their instrumental role in communicating and garnering support from the Local Workforce Investment Boards. Three EDD staff worked with us through out the study. Doug Orlando participated in all four of the case studies, and provided his invaluable accounting expertise, particularly about ABC accounting, and a deep knowledge of One-Stops. Doug also contributed significantly to the development of the survey instruments. Rod Addy participated in three of the case studies and lent us his in-depth knowledge of One-Stops, WIA and local EDD operations to help us develop our data collection approach. Both Doug and Ron are relentlessly cheerful and fun to be with in the field. Steve Saxton, of EDD provided some of the original thinking that went in to study and reliably came up with tough questions and new insights as the study progressed. CWIB staff played and important in the project as well. Ray York, helped us plan our work and see the issues from state level perspective throughout the project. He helped us many times at critical junctures to gain cooperation from key parties and think through strategic decisions. Bev Odom of the CWIB staff played a vital role in keeping the project on-time and on budget; she helped manage our relationship with the steering committee and the CWIB, and most importantly proved very persuasive in getting One-Stops to participate in the survey. Professor Ken Euske of the Monterey Naval Post-Graduate School and a leading national expert in the field of ABC accounting in the public sector served as a consultant to the project. He played a critical role in helping us shape our methods and reviewed our work products through out the project. His good humor and commitment to helping us get it “roughly right and not precisely wrong” are much appreciated. Our steering committee provided advice and reviewed many work products through out the study. We thank them. The committee included: Albert L. Tweltridge III, California Department of Education Jean Scott, California Department of Education Bob Schallig, California Department of Education Tammi Holloway, California Department of Education Ron Selge, California Community College Chancellor’s Office Geri Douglas, California Community College Chancellor’s Office Walter Dario Di Mantova, Los Rios Community College District George Boodrookas, Modesto Junior College Lana Fraser, California Department of Rehabilitation Michelle Alford-Williams, California Department of Rehabilitation Cindy Escott, California Department of Rehabilitation

California One-Stop System Cost Study Report
xi
Gail Sullivan, California Department of Social Services Kristen Sanchez, California Department of Social Services Joyce Fukui, California Department of Aging Johnna Meyer, California Department of Aging Rich Friedman, Housing and Community Development Jamie Fall, California Labor & Workforce Development Agency Wendy Wohl, Community Services and Development Department Finally, we would like to thank our colleagues in the College of Business and Economics at Cal State Northridge who supported the project with extra help when needed Liz Barrett and Jigar Patel. While many people contributed to the study the opinions expressed here and certainly any mistakes are those of the authors only.

California One-Stop System Cost Study Report
xii
Table of Contents Executive Summary................................................................................................................... ii Acknowledgements ................................................................................................................... x Table of Contents..................................................................................................................... xii I Introduction ......................................................................................................................... 1 II Methods ................................................................................................................................ 3
The ABC Approach .................................................................................................................. 3 Case Study Method ................................................................................................................... 4
Case Study Site Selection...................................................................................................... 5 Implementing the ABC Approach at the Case Studies ..................................................... 6 Conducting Case Studies ...................................................................................................... 8 Reports ................................................................................................................................. 10
Survey Methods....................................................................................................................... 10 Activities Defined ................................................................................................................ 10 Services Defined .................................................................................................................. 14 Survey Instruments............................................................................................................. 16 Sample and Response ......................................................................................................... 17 Reconnaissance Interview .................................................................................................. 18 Survey Procedures .............................................................................................................. 19 Data Analysis ....................................................................................................................... 20 Limits ................................................................................................................................... 21
III Results ................................................................................................................................ 22
What resources do California One-Stops have and where do they spend them? ............. 22 Total Costs By Site and Process......................................................................................... 23 Total Costs by Site and Activity ........................................................................................ 28
What do partners contribute to the operation of the One-Stop and how does the pattern vary between sites? ................................................................................................................. 42
Overall Partner Contributions .......................................................................................... 43 Partner Contributions by Process ..................................................................................... 43 Specific Partner Contributions .......................................................................................... 50
What do different One-Stop services cost to produce and how do costs vary between sites? How much service do One-Stops produce and how does volume vary by site?.... 55
Universal Services ............................................................................................................... 55 Enrolled Services................................................................................................................. 66 Business Services ................................................................................................................. 75 Youth Services ..................................................................................................................... 89
IV Conclusions....................................................................................................................... 96 V Recommendations for Policy and Further Research ............................................. 99

California One-Stop System Cost Study Report
xiii
Appendix A: Other Partner Contributions....................................................................... 102 Appendix B: Other Cost-Per Measures ............................................................................ 107 Appendix C-1: ......................................................................................................................... 113 Case Study 1 – Southern California Urban One-Stop Report .................................... 113 Appendix C-2: Case Study 2 – Northern California Suburban One-Stop Report . 129 Appendix C-3: Case Study 3 – Central California Rural/Suburban One-Stop Report..................................................................................................................................................... 153 Appendix C-4: Case Study 4 – Northern California Rural One-Stop Report.......... 170 Appendix D: Survey Instruments ...................................................................................... 190

California One-Stop System Cost Study Report
1
I Introduction In 2006 the California Workforce Investment Board’s Accountability Committee called for a cost study of the One-Stop Career System. In the committee’s view:
The reality is that there is inconsistent integration of services and no centralized accounting process within the System that effectively controls or accounts for all resources utilized to produce the System’s Outputs….As a result, the One-Stop System appears to some of its customers and outside observers as a fragmented and inefficient business enterprise.3
To complete a cost study of One-Stops, the California Workforce Investment Board (WIB) contracted with a team of researchers in the College of Business and Economics at California State University, Northridge to analyze the cost of California One-Stop Centers. Working with staff from EDD and the WIB, the Cal State Northridge team developed the following research questions to guide the study:
1. What resources do California One-Stops have and where do they spend them? 2. What do partners contribute to the operation of the One-Stop and how does the
pattern vary between sites? 3. How much and what types of services do One-Stops produce, and do sites vary from
each other? 4. What do different One-Stop services cost to produce and how do costs vary between
sites? 5. Can standard measures or service units and costs be developed and applied across
One-Stops? The study subsequently designed to answer these questions had two phases. In Phase I, the research team conducted four in-depth case studies of four full-service One-Stops. The goal of the case studies was to answer the research questions and develop methods that could be replicated in a state-wide survey of One-Stops. In Phase II of the study, the team conducted a survey of 18 representative One-Stops. This report presents the results of the case studies and the survey. We begin with a description of the methods we employed and then present the results of the surveys.
3 From: “Proposal by the California Workforce Investment Board Accountability Committee for a Cost Study of the One-Stop Career System”, October 28, 2005
California One-Stop System Cost Study Report
2
How To Read This Report
This was a complex project and produced a long report. To help readers find what they need we have some suggestions. If you just want an overview of the report and key findings, read the executive summary. If you are interested in ABC approach and how it can be applied to One-Stops, read Chapter II: Methods and look through the Appendices with our instruments and procedures. In you are interested in partner contributions look at pages 42 to 50 in Chapter III: Results If you want to see how One-Stops compare with each other look at the detailed graphs throughout Chapter III: Results If you are interested in why One-Stops differ from each other, read the case studies in Appendix C . If you are interested in where research should go from here, read Chapter IV: Conclusions and Chapter V: Recommendations
The entire report in whole or in sections can be downloaded from the web at www.calwia.org

California One-Stop System Cost Study Report
3
II Methods A major product of this study is the development of a method for conducting Activity-Based Costing (“ABC”) analysis of One-Stops. As we noted before, this is the first study of its type. Here we provide a fairly detailed description of the reasoning behind our analysis and the methods we employed to help other analysts who want to conduct similar studies. Readers more interested in the results may want move on to section III. As noted above, the study had two phases. In Phase I, we conducted four case studies to develop an in-depth understanding of the One-Stop Career centers, how they operated, and how they were financed. We used the knowledge developed in the case studies to construct a survey method to capture standard data across 18 additional sites, providing a final benchmark group of 22 One-Stops. In both the case studies and the survey, our analysis method was based on “Activity Based Cost Accounting,” a method designed to help managers better understand their process and costs. The ABC Approach Throughout the study, we used Activity Based Costing (“ABC”) to analyze each One-Stop’s finances. The purpose of Activity Based Costing is to better understand the real costs of producing a product or service. It is a system designed to support effective management of resources rather than to provide reporting to outside auditors. A key insight of the ABC method is that certain activities may generate greater indirect costs than others, and that to really understand the cost of a product or service, these costs need to be accounted for with some precision rather than just spread as a general overhead rate.4 In short, ABC is a dramatic departure from traditional government budget reporting systems, but we believed it would provide valuable insights into the costs of One-Stops. The Figure below shows simply how an ABC analysis is different from a traditional government budget. Figure II-1: Comparison of Traditional Views and ABC View
Traditional Line Item Government Budget View
Activity Based Costing View
Salaries $375,000 Access to Resource Room $175,500
Benefits $92,000Career Search Workshops $82,000
Supplies $47,000 Case Management $103,000 Telephone $8,500 ESL Training $58,000
Travel $13,000 Rapid Response Service $115,000
Business Plan Consulting $105,000
TOTAL $535,500 TOTAL $535,500
4 For a general introduction to ABC see Cokins, Gary, et.al (1992) An ABC Manager’s Primer: Straight Talk on Activity-Based Costing, Irwin Publishing.

California One-Stop System Cost Study Report
4
At both the case study sites and the survey sites, it took a great deal of work for our team and the local staff to transform their traditional accounting records into an ABC analysis of costs. Case Study Method
There is not any systematic study of One-Stop costs on which this study could directly build. Given the lack of previous studies in this area, the study team made two critical methods decisions. First, given the research questions, the team decided that the best approach for answering the questions was “Activity Based Costing,” commonly referred to as ABC accounting, as we described before. Second, given the many complexities of applying ABC accounting to One-Stops and the lack of previous research on which to model this study, the team decided to begin the project with four case studies. The over-arching goal of this research project is to use the grounded theory approach to develop a model of how One-Stops use their resources to produce services. The grounded theory approach developed by Glaser and Strauss uses case studies rich in detail to generate empirically based theory, which can then be tested by other research methods5. This approach seems particularly appropriate to this setting where there is little previous empirical work on which to build. One-Stops are a novel type of organization. Studies of them are limited and research on their finances is virtually nonexistent. There are few standard definitions or a standard practices. We do know that One-Stops vary widely along a number of dimensions. Some One-Stops are large with many employees, while others are small with just a few staff. Some One-Stops are operated by local government employees, and others are contracted out to non-profit or for-profit organizations. Some One-Stops are co-located with many partners, while others have few partners active in the One-Stop. A recent report from researchers at the University of California, Davis made a first attempt at capturing the complexity and variation in how California One-Stops operate, but it did not study the financial aspects of One-Stop operations6. When confronted with the task of performing an evaluation of a complex program about which little is known, evaluators have, as noted earlier, frequently use a case study approach.7 The case study approach allows researchers to enter programs with a blank slate and capture the reality of what actually exists in rich detail, rather than imposing a template of what they think exists or what they think should exist. In this study, we entered each case study site and documented how each site was organized and how partners participated. We used whatever measures of service were collected at each site. Because of this case study approach, each case study report differs in a variety of ways from each other site. We do not have a complete set of standard measures across each site. Rather, the case study approach allows us to show each site as it is, as it operates. The case studies did 5 Glaser, B.G. and A.L. Strauss (1967) The Discovery of Grounded Theory: Strategies for Qualitative Research.
New York: Aldine. 6 Cambell, David, et.al (2006) Final Report: UC Davis Evaluation of California’s Workforce Development System, Department of Human and Community Development, University of California Davis. 7 See for example Patton, Michael Quinn (1980) Qualitative Evaluation Methods Newbury Park, CA: Sage Publications.

California One-Stop System Cost Study Report
5
show us the commonalities and differences found in the system, and provided a basis for designing a survey which did use a standard set of measures to collect data on a larger sample of One-Stops in the second phase of the research. Below we elaborate the steps employed in conducting the case studies.
Case Study Site Selection We wanted to select four sites that would capture a good part of the diversity found among California One-Stop Centers. We began by sending a letter to every WIA local area in California, from the State WIB and the Secretary of the EDD, asking for volunteers. We also made presentations at several professional meetings to explain the purpose of the study. As part of the project, the State WIB offered a $10,000 payment to local areas who would volunteer one of their One-Stops to be a case study site. Sites were promised strict anonymity so that they would be willing to open their practices to the researchers. From the pool of volunteers we selected four full-service One-Stops, which represented a good cross-section across a variety of characteristics we were interested in. Due to restricted resources we were not able to include satellite One-Stops in our sample. We also required that, to be a case study site, One-Stops had to at least have counts of the number of universal access clients. It is important to note that our “unit of analysis” is full service One-Stops, not local areas. The table below profiles the case study One-Stops. Table II-1: Profile of Case Study Sites Site Name Local Area
Characteristics Service Area One-Stop
Characteristics So-Cal Urban - Multi-city local area
- Multiple One-Stops in local area
- Large - Southern California
- Urban - Low Income - Large Metro area
labor market
- Large - Staff: city
employees
No-Cal Suburban - Multi-city local area - Single One-Stop in
local area - Northern California
- Suburban - High-tech area - Mid to high
income - High levels of
education
- Large - Staff: city
employees
Central CA Urban - County local area - Small city in rural
area - Multiple One-Stops - Central Valley
region of California
- Small city surrounded by rural area
- High unemployment
- Low levels of education
- Agricultural area - Low income
- Mid-sized - Staff: county
employees

California One-Stop System Cost Study Report
6
Site Name Local Area Characteristics
Service Area One-Stop Characteristics
No-Cal Rural - County local area - Small city and rural
area - Multiple One-Stops - Northern California
- Rural - Small local labor
market - High
unemployment - Low income
- Small - Staff: non-profit
employees
Implementing the ABC Approach at the Case Studies
Conducting an ABC analysis at each site was a complex process. The figure below shows the process we used to move through an ABC analysis. As Figure II-2 indicates, the process had five steps8. Step 1: We first found the annual expenditure report for the most recently closed year, which for the survey sites at the time of our visits was FY 2004-05. These expenditure reports were based on traditional line item budgets for the One-Stop and for all major partners such as EDD. This was not easy, as some One-Stops do not have separate budgets but instead are integrated into the local area budget. Most partner agencies did not have a budget for a particular One-Stop and therefore had to do some reverse-engineering to extract the One-Stop’s data from a larger budget report. Step 2: We had One-Stop managers identify the responsibility centers through which they managed the One-Stop’s work. For example, the resource room that served universal access clients was often a responsibility center. Other responsibility centers typically were enrolled services, business services, and youth services. We also treated each partner as a responsibility center. We would then move 100% of costs, including support costs, from the Local Area into the responsibility centers. The largest item in every case was payroll. For a variety of practical reasons, each partner who provided services in the One-Stop was treated as its own responsibility center. Step 3: We mapped all the processes and activities that went on in the One-Stop, in many cases these processes overlapped with the responsibility centers, and in others they did not. (See Figure II-3, for a sample process map with activities). Step 4: In this step, for each responsibility center, we identified key cost drivers, usually staff time, space used, and equipment. We used these cost drivers to identify the cost of each activity in the process map, for each responsibility center. For example, a resume writing workshop would take staff time to plan and deliver, use some space in the One-Stop and consume some supplies. We kept going until 100% of each responsibility center’s costs had been assigned to the set of activities. 8 Our method evolved and simplified as we went from case to case. For example, in the first case study we attempted to have every staff member estimate how they had spent their time in the previous year. This proved impossible. We did find that managers were able to estimate better how the effort of their unit was distributed.

California One-Stop System Cost Study Report
7
Step 5: In this final step we took the costs of the various responsibility centers traced to various activities and added them together to get the cost of the activity. Then we took the units of service produced to calculate the cost per service unit. So, for example, if we found across all the responsibility centers that there was a cost of $12,000 for delivering workshops during the year, and 10 workshops were produced, then the cost per workshop was $1,200. The approach described here was taken largely from Service Process Measurement; Breaking the Code, Applying Activity Based Performance Measures to Service Processes, by K.J. Euske et.al. Professor Ken Euske, of the Naval Post-Graduate School in Monterey, served as a consultant to this project and was instrumental in developing the methods employed. Figure II-2: One-Stop ABC Analysis Process
Traditional Line Item
Budget
Distribute all costs to
Responsibility Centers
For each Responsibility
Center, measure
Cost Drivers by
Activities
• Space Allocation• Time Allocation
Use Cost Drivers to Allocate
cost to Activity,
calculate cost per unit of
service
Process Map
One-Stop ABC Analysis Process
STEP 3
STEP 1 STEP 2 STEP 4 STEP 5

California One-Stop System Cost Study Report
8
Figure II-3: Sample One-Stop Process Map
Outreach / Recruitment
Reception / Orientation
Self Service
Counseling /1-on-1 assist.
Group Workshops
04-05 Labor Market
Outcomes
Support Activities
Employer Outreach Employer Services
PlanningIntakeIEP
Core / IntensiveCase Mgmt.
Basic Skills
Placement
Job Development
TrainingOJTITA
IndividualJob
Development
Sample One-Stop Process MapUniversal Access Process (mass service)
Registered Clients Process (service shop)
Employer Services Process (service shop)
• 6,631 Universal Clients
• # EnteredEmployment
• 24,537 Client Visits
• 253 Placements• $11.50 Average
Wage Placed
• 21 On-Site Recruiting Events Adult
• 2,441 Job Participants
• 280 Hired• 13 Small Business
Workshops
LAB
OR
MA
RK
ET
Conducting Case Studies Conducting the case studies involved three stages. In the first stage we reviewed the available information on the site to familiarize ourselves as much as possible with the site. In the second stage we conducted the site visit. Some cases were done in a single multi-day visit, while other cases, particularly the first case, required multiple follow-up visits. In all four cases there were follow-up contacts by phone and email to collect additional data and clarify data collected. Data collection for a typical site visit consumed over 10 person-days of work by our team. In the third stage we analyzed the data collected, wrote up a case study report, reviewed the case study report with the staff of the case study site and made final revisions. One important methods issue that emerged immediately in the field work was: what to count? Which costs and activities should be included and which excluded? This was a particularly significant issue in relation to partner costs. For example, if a One-Stop gives a participant an ITA, essentially a training voucher, to attend a local community college, should the costs of the voucher and the additional subsidies the client gets by attending the community college be included in our analysis? Similarly, if the local Salvation Army shelter is a partner and a universal client is referred there, and gets services, should that be counted in the cost analysis? After a lengthy discussion of the theoretical and practical issues involved in trying to trace all costs through the entire network of providers, we came up with a definition that we used across
California One-Stop System Cost Study Report
9
all sites. We call the definition the “under the One-Stop roof” criterion. Simply put, we only measured costs and activities that took place physically in the One-Stop. Services that clients received away from the site, or services the One-Stop contracted for away from the site (including ITAs and OJTs) were not counted in this analysis. So by the “under the One-Stop roof” criterion, a community college counselor who spends time in the One-Stop advising clients is counted, but a community college counselor who provides counseling at the college campus does not. This definition was essential for us, since we needed a bright line that allowed us to know which costs are in our analysis and which are out. Text Box II-1 below shows the detailed protocol we followed in conducting the case study analysis. Text Box II-1: Case Study Protocol Stage I: Pre-visit reconnaissance
• Obtain mission/vision/goals/objectives • Obtain Annual Plan – current and for FY04-05 • Get performance on Federal performance measures FY04-05 • Survey One-Stop to gather descriptive data (organization chart, floor plan of site,
partners on site, etc.) Stage II: On-site
• Walk-through, including interviews with key personnel. Purpose: o Define the boundaries of the One-Stop o Validate Responsibility Centers o Define Activities
• Caucus to review data so far • Meet with Director. Purpose:
o Revise/refine the definition of the One-Stop, including Partners; validate the list
o Revise/refine the list of Responsibility Centers; validate the list o Revise/refine the list of Activities; validate the list
• Get WIB budget w/ breakout by funding stream • Get WIB staff time allocation (specifically, allocation to the One-Stop) • Define responsibility centers (at One-Stop, and in WIB Central Office), identify
the leader of each one • Get salary data for existing employees and also for FY04-05 employees
o Assign each employee to a Responsibility Center • Map the activity/process flow • Interview each Responsibility Center Leader; allocate time/effort across activities • Define Activity measures • Define Outcome measures; link to activities • Identify Partner contributions • Meet with people as needed to nail down budget spreadsheets

California One-Stop System Cost Study Report
10
Stage III: Analysis and Reporting • Get 100% of costs into responsibility centers • Trace 100% of each responsibility center’s costs to activities • Calculate total cost of each activity • Calculate total cost of each process • Calculate partner contributions “under the roof” and assign their costs to specific
activities • Link best service measures to activities and calculate cost per service • Draft report • Review report with study team and site • Final report revisions
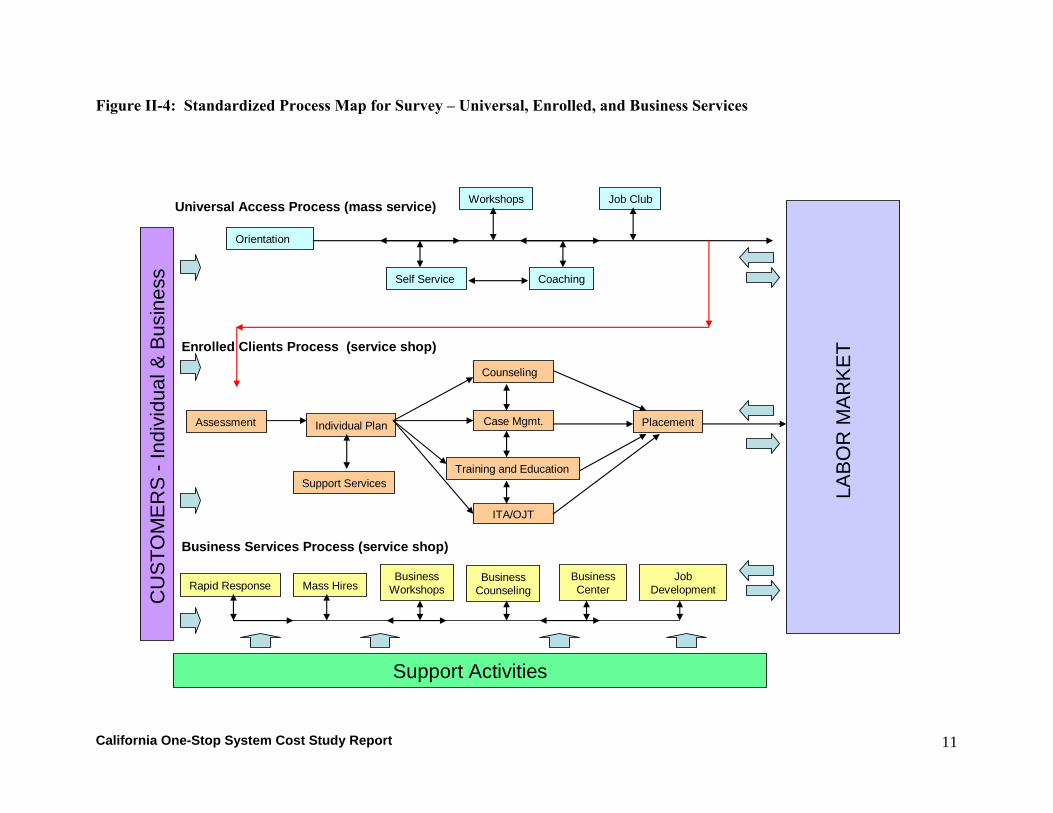
Reports Each case study was written up in a detailed report. The four case study reports can be found in Appendix C. These reports provide details on how our ABC analysis evolved and the local factors that affect costs and services at each site. We recommend these reports to readers who want a rich explanation of One-Stop costs. Survey Methods In the case studies we used the grounded theory approach where we tailored our analysis to how each site was organized, to the unique set of services provided and used whatever measures of services produced the site had. In the survey sites we needed to create standard data collection methods, and that meant creating a standard set of activities and measures of services produced. We had to clearly define the activities and the services produced so that sites could accurately report how resources were used and what services were produced. We also needed clear survey forms which would allow One-Stops to report their costs by responsibility centers reliably, and to then trace those costs back to specific activities. We would not have been able to do this without the rich experience we accumulated in the case studies. Using the case studies we developed a standard set of activities and services which would allow One-Stops to accurately describe their activities and services produced. These standard definitions were used to produce questionnaires for the surveys. Activities Defined In the case studies, we found that virtually all One-Stops organized their activities for adults into four processes that reflected WIA funding streams. There was a universal service process, an enrolled services process, and a business services process. A few One-Stops also served youth, which treated that as a distinct process. We found the activities of partners could be accounted for within these processes. For example, when EDD offered Veteran services, we fit those activities into the enrolled service process; and providing assistance with a UI claim fit easily into the universal services process. When a local Small Business Development Corporation offered a workshop on marketing for small businesses, it fit into Business services. Below is the standardized process map we developed for the survey.
California One-Stop System Cost Study Report
11
Figure II-4: Standardized Process Map for Survey – Universal, Enrolled, and Business Services
Orientation
Self Service
Workshops Job Club
Coaching
Assessment Individual Plan Case Mgmt.
Training and EducationSupport Services
Placement
Universal Access Process (mass service)
Enrolled Clients Process (service shop)
Rapid ResponseBusiness
WorkshopsBusiness
Counseling
Support Activities
Business Services Process (service shop)
LAB
OR
MA
RK
ET
CU
STO
ME
RS
-In
divi
dual
& B
usin
ess
Counseling
Mass HiresBusiness Center
ITA/OJT
Job Development

California One-Stop System Cost Study Report
12
Figure II-5: Standardized Process Map for Survey – Youth Services
Employment ServicesCollege Preparation
Case Management
Academic Support Follow-Up
Support Activities
LABOR MARKET
Or
FURTHEREDUCATION
YOUTH
California One-Stop System Cost Study Report
13
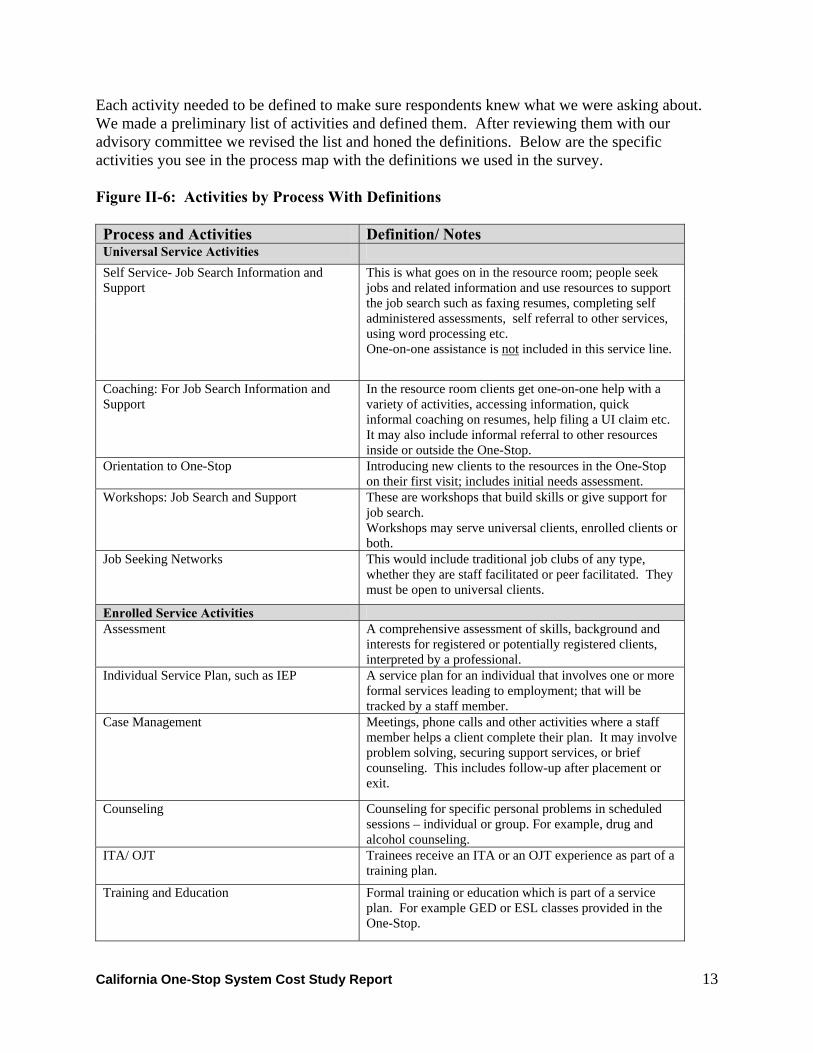
Each activity needed to be defined to make sure respondents knew what we were asking about. We made a preliminary list of activities and defined them. After reviewing them with our advisory committee we revised the list and honed the definitions. Below are the specific activities you see in the process map with the definitions we used in the survey. Figure II-6: Activities by Process With Definitions Process and Activities Definition/ Notes Universal Service Activities Self Service- Job Search Information and Support
This is what goes on in the resource room; people seek jobs and related information and use resources to support the job search such as faxing resumes, completing self administered assessments, self referral to other services, using word processing etc. One-on-one assistance is not included in this service line.
Coaching: For Job Search Information and Support
In the resource room clients get one-on-one help with a variety of activities, accessing information, quick informal coaching on resumes, help filing a UI claim etc. It may also include informal referral to other resources inside or outside the One-Stop.
Orientation to One-Stop
Introducing new clients to the resources in the One-Stop on their first visit; includes initial needs assessment.
Workshops: Job Search and Support
These are workshops that build skills or give support for job search. Workshops may serve universal clients, enrolled clients or both.
Job Seeking Networks
This would include traditional job clubs of any type, whether they are staff facilitated or peer facilitated. They must be open to universal clients.
Enrolled Service Activities Assessment
A comprehensive assessment of skills, background and interests for registered or potentially registered clients, interpreted by a professional.
Individual Service Plan, such as IEP
A service plan for an individual that involves one or more formal services leading to employment; that will be tracked by a staff member.
Case Management
Meetings, phone calls and other activities where a staff member helps a client complete their plan. It may involve problem solving, securing support services, or brief counseling. This includes follow-up after placement or exit.
Counseling
Counseling for specific personal problems in scheduled sessions – individual or group. For example, drug and alcohol counseling.
ITA/ OJT
Trainees receive an ITA or an OJT experience as part of a training plan.
Training and Education
Formal training or education which is part of a service plan. For example GED or ESL classes provided in the One-Stop.

California One-Stop System Cost Study Report
14
Process and Activities Definition/ Notes Support Services
This is restricted to support services such as drop-in child care which are delivered under the roof.
Placement Assistance
Defined as staff provided assistance to locate and secure a job.
Business Service Activities Rapid Response Assistance Meeting at the company site with employers or employees
of companies considering a lay-off or closure.
Mass Hires/ Job Fairs One-Stop staff arrange logistics, screen applicants for employer hiring a number of employees or Job Fairs where employers come and meet a number of potential applicants.
Workshops
Workshops to provide skills or information for businesses.
Business Consulting
One-on-one assistance to businesses to provide help with taxes, marketing, loan applications etc.
Business Center Service
Essentially office support for small businesses, faxing, internet access, office space etc.
Job Development
Contacting businesses to identify open positions and posting those positions in the One-Stop and elsewhere.
Youth Service Activities Employment Services
Youth placed in work experience, summer jobs or regular employment.
Counseling, Case Management Supportive Services
Services to counsel and support youth while they are enrolled in a program.
College Preparation
Activities to prepare youth for college, campus visits, SAT Prep, information session etc.
Academic Support
Services such as GED preparation, home work clubs, or tutoring to help improve academic achievement.
Follow-up
Follow-up services to see if youth have completed activities.
Services Defined We needed a list of clearly defined services produced by One-Stops that would account for virtually all the services produced. Again we reviewed our case studies to develop a list of service measures we thought each One-Stop would know. We reviewed that list with the advisory committee, and revised it according to feedback we received. A key problem in doing ABC analysis is the problem of joint costs. A detailed description of joint costs is provided in the case study reports. For now, we off the following simplified definition of joint costs: Joint costs occur when there are two distinct outputs and it is difficult or impossible to accurately trace the portion of costs consumed in the production of each distinct output. To overcome this problem we created a list of services produced that either tied clearly to a single activity or were clearly produced by an entire process. For example, a workshop delivered is tied clearly to cost of workshops in the universal process, so the cost per workshop

California One-Stop System Cost Study Report
15
could be calculated by simply dividing the number of workshops delivered into the fully loaded cost of workshops. On the other hand, the cost of serving a client in universal services could be calculated by dividing the total number of universal clients into the fully loaded cost of all universal service activities. The following Figure lists the measures of services produced for which we collected data, and the activities to which the measures are linked in our cost analysis. Figure II-7: Activities by Process; Services Produced and Measured Process and Activities Services Produced and Measured Universal Service Activities
Number Universal Access visits Number Universal Access clients
Self Service- Job Search Information and Support Number Universal Access Service Events (e.g. faxed a resume,
accessed career information on internet) Coaching: For Job Search Information and Support
Number of times one-on-one coaching events occur
Orientation to One-Stop Number of new universal access clients. Workshops: Job Search and Support
Number of Workshops Number of People attending
Job Seeking Networks
Number Job club or network members Total Job club or network attendance
Enrolled Service Activities Assessment Number of comprehensive assessments
Individual Service Plan, such as IEP
Number of IEPs or other formal plans
Case Management Number of clients getting case management Number of meetings with case manager (staff/ client ratio may be a meaningful measure as well)
Counseling
Number of client session
ITA/ OJT Number of clients with ITA or OJT Training and Education Number of clients receiving training/education
Number of hours of training/ education Support Services Number of clients receiving support services
Placement Assistance Number of clients placed (entered employment) Business Service Activities Rapid Response Assistance Number of employees assisted
Number of employers assisted Mass Hires/ Job Fairs Number of mass hire events
Number of applicants interviewed at mass hire events Number of applicants hired from mass hires events Number of Job Fairs Number of companies participating Number of Job seekers participating in job fair
Workshops
Number of workshops Number of businesses attending

California One-Stop System Cost Study Report
16
Process and Activities Services Produced and Measured Business Consulting Number of companies serviced
Number of hours of consulting Business Center Service
Number of businesses served
Job Development
Number of jobs developed
Youth Service Activities Employment Services
Number of youth placed in any employment
Counseling, Case Management Supportive Services
Number of youth receiving services Number of meetings or appointments
College Preparation Number of youth participating in college preparation events Academic Support
Number of youth participating Number of participants attaining credential
Follow-up Number of youth followed up
Survey Instruments Once we had established standard definitions for processes, activities and services, we turned to designing questionnaires that would collect the needed data. The challenge in designing a survey of 18 One-Stops to collect data on costs, activities and services produced was three fold. First, we needed to develop instruments that were clear enough for sites to complete without a great deal of assistance from us. Second, the instruments had to allow for the existence of various numbers and types of partners and structures. Third, we needed to incorporate the standard set of processes, activities and services so that comparisons could be made across the sites. To meet these challenges we developed the set of survey instruments which are included in the appendices. Here we provide a brief description of each instrument and its purpose. The cover letter sent to participating One-Stops and sample copies of the survey instruments are included in the Appendix D.
• “Sample Cover Letter and Instructions”
• “Expenditure Instrument for Subject One-Stop Center” This instrument allows local areas to take their traditional line item expenditure report and move costs into responsibility centers within the subject One-Stop, so that costs can then be traced to various activities.
• “EDD Financial and Effort Worksheet” Since EDD is the most prevalent partner, with a significant presence in the One-Stops we studied, we developed a specialized instrument on which EDD could report its costs in a standardized manner recognized by local managers. This instrument then shows local managers how to trace staff time and other costs to a standard set of activities. Finally, the EDD managers reported the volume of service produced in standard categories.
California One-Stop System Cost Study Report
17
• “Services Lines Data Collection Instrument” Based on the case study sites, we developed a standard list of services we believed met three conditions: first, they would cover almost all the services produced by One-Stops; second, they would be common across many One-Stops; and third, the One-Stops were likely to have counts of these services or be able to produce counts relatively easily. The service categories were designed to cover the activities of partners as well. We designed the list of service measures so that each service could be traced back to a single activity from the list of activities on the “Effort Allocation Instrument.” This was to solve the problem of joint cost described earlier in the case studies.
• “Effort Allocation Data Collection Instrument” This instrument was designed so that each responsibility center manager could trace the effort of his or her unit back to a set of four standard processes (universal, enrolled, business and youth) with standard activities. This would allow us to calculate the costs within each responsibility center for each activity.
• “Partners Short Survey Form” From our field work we learned that most partners play a limited role in the One-Stops; partners may provide some staffing in the resource room, or offer occasional workshops, or have a counselor on-site a few hours a week. The short form was designed so that partners could, in a single form, report their costs, the activities they were involved in, and the services produced. Sample and Response For the survey, we wanted to create a sample that would represent the wide diversity found among California’s comprehensive One-Stops. We wanted One-Stops that were large and small, located in rural, suburban and urban areas, and ones managed by public and private employees. We began by sending letters to all local areas in the state and asked them to voluntarily participate in the survey portion of our study. In some cases a local area contacted us and expressed interest in participating in the survey, and in other cases an individual One-Stop expressed interest. In all we had sites from 21 local areas volunteer. As we did when deciding the case study locations, we made a list of site characteristics that we wanted to have represented in our survey sample. These characteristics included which area of the state the One-Stop is located in (South, North, or Central California) and the local setting of the One-Stop (rural, suburban or urban). We specifically chose 20 sites from 11 different local areas in order to get a sample that represented all types of One-Stops from all areas of the state.9 During the course of the survey we lost five sites from our original sample because the site either could not or did not want to participate in the survey. We were able to add three replacement
9 We initially chose one One-Stop to be our pilot survey site. This proved beneficial because we found it necessary to make changes to several survey instruments after the pilot site had reviewed them.

California One-Stop System Cost Study Report
18
sites. In the end, we had 18 complete, usable surveys. In the final benchmarking analysis we added in the four case study sites for a final sample of 22 The table below shows the breakdown of how the final sample of 22 survey sites satisfied our requirements. Table II-2: Final Sample of One-Stops By Key Characteristics Urban Suburban Rural Totals: North CA 2 2 3 7 South CA 6 2 2 10 Central CA 2 1 2 5 Totals: 10 5 7 22 After we established our list of survey sites, we contacted the Director of each local area. We sent the Director a letter thanking him/her for volunteering and telling, them which of their sites we wanted to include in the survey. This was then followed up with a telephone call to the Director. Reconnaissance Interview We then contacted each of the volunteer One-Stop site and made arrangements for one of our interviewers to conduct a one-hour phone interview with the One-Stop manager. We refer to this one-hour initial phone interview as the Reconnaissance Interview. We conducted a Reconnaissance Interview with each One-Stop, to get a basic understanding of how the One-Stop was organized and to help customize the surveys to best reflect the particular One-Stop’s operations. There were several purposes to the Reconnaissance Interview:
• Get an overall feel for the One-Stop • Establish a single point of contact (SPOC) at the One-Stop. In some cases we also
identified the key fiscal person at the One-Stop. • Establish the One-Stop’s responsibility centers • Get basic knowledge about the site (One-Stop size, staff size, locale, what the One-Stop
operating agency is, where financial data is kept – locally or at head office, etc.) • Identify who the One-Stop’s partners were that provided services “under the roof”.10
10 Initially we asked the One-Stop to differentiate between Major and Minor partners. Partners who made a significant contribution to the One-Stop were to be considered Major partners and would be requested to complete two survey instruments, the ‘Expenditure Instrument’ and the ‘Effort Allocation Form’. Partners who did not make a significant contribution to the One-Stop were to be considered Minor partners and would be requested to complete one survey instrument, the ‘Secondary Partners Survey Form’. After distributing a complete survey to our survey pilot site we realized that making a distinction between Major and Minor partners was not necessary. We realized that all partners except for EDD need not complete the fiscal instrument, and that the Major partners would have a difficult time completing the two forms because of the complexity of the two forms. Instead we decided that all partners, except EDD, were to be given the ‘Secondary Partners Survey Form’, which we re-named the ‘Partner Short Survey Form’.

California One-Stop System Cost Study Report
19
After completing the Reconnaissance Interview we took the information learned and used it to customize the survey instruments for each One-Stop. Customization of the survey instruments involved inserting the One-Stop’s name where appropriate and adding the One-Stop’s responsibility centers where appropriate. Survey Procedures Each One-Stop was then sent a package containing the full set of customized survey instruments for their site. A typical survey package included:
• Cover Letter and Survey Checklist (addressed to the SPOC, as identified in the Reconnaissance Interview, which was typically the One-Stop manager)
• Expenditure Instrument11 (customization of this form included adding the responsibility centers as identified in the Reconnaissance Interview)
• Expenditure Instrument Instructions12 • EDD Financial and Effort Worksheet • EDD Instructions • Service Lines Data Collection Instrument (one form to be completed by the One-Stop and
to include data from the One-Stop and all partner agencies) • Effort Allocation Data Collection Worksheet (one Effort Allocation form was customized
and sent for each of the One-Stop’s responsibility centers.) • Partner Short Form (one Partner Form was customized and included for each of the One-
Stop’s partners, not including EDD)13 Included with each survey package was a flash drive containing electronic copies14 of all the survey instruments and an overnight delivery return address envelope, postage paid. The single point of contact at each site was asked to oversee the distribution of the survey instruments to whoever they felt was best suited to complete the forms. They were also asked to collect the completed instruments and return them all together to us. In the case of the EDD instrument, the One-Stop’s SPOC was asked to forward the EDD Instrument to the EDD manager at their One-Stop. There were sites where an EDD manager contacted us directly with questions regarding the survey instrument, but typically they were able to complete the form
11 During the survey we found that almost every One-Stop site was having trouble understanding and completing the Expenditure Instrument. We revised it, renamed it the ‘Expenditure Short Form’, and resent it to all the survey sites. We found this new form was much easier for the sites to complete. 12 We found that with the development of the ‘Expenditure Short Form’ the ‘Expenditure Instructions’ were no longer necessary; however, much of the information contained in the instructions remained helpful to the person completing the fiscal form. 13 The California Department of Rehabilitation was not asked to complete a ‘Partner Short Form’ by each One-Stop where they contributed. Instead, this agency provided us information on their contributions to all participant One-Stops from the state level. 14 We requested that the fiscal instruments, the “Expenditure Instrument’ and the ‘EDD Financial and Effort Worksheet’, be completed electronically. This was primarily because each instrument had features that could only be seen and used when viewed electronically. These features took advantage of options specific to Microsoft Excel.
California One-Stop System Cost Study Report
20
without our assistance. The One-Stop’s SPOC was responsible for contacting their partners and having them complete the Partner survey instrument. In many cases the SPOC completed their partner’s forms themselves. In only one case were we contacted with questions directly by a One-Stop’s partner. When the survey package was sent out to each One-Stop we gave them a completion deadline of two weeks. Only one site met that deadline. Some sites were able to complete the survey within one month, but most sites required more than two months to complete the survey. In many cases the instruments that took the most time to complete were the partner’s instruments. This was most likely due to the lack of control each One-Stop has over their partners. Each One-Stop was encouraged to contact us should they have any questions or problems. At one point or another, every site contacted us with questions; some needed help with the fiscal form and others simply had a question regarding one of their partner’s contributions. We contacted local areas by phone and email to encourage responses and to answer questions. In the end it took five months to get all completed surveys in. Once questionnaires were returned we reviewed obvious reporting errors and missing data. Sites were contacted and, to the degree possible, missing data was collected and errors corrected. Data were entered into a series of linked spreadsheets for analysis. While the case studies examined the fiscal year July 1, 2005 – June 30, 2005, the survey happened some time after the case studies were completed. When the survey began, an additional fiscal year had been completed, so we decided in the survey to gather data for what was at that point the most recently closed fiscal year – July 1, 2005 – June 30, 2006. Data Analysis The goal of the data analysis was to answer the research questions posed earlier in the study. To accomplish this, the analysis went forward in two phases. First we defined a set of measures we could calculate from the data. Next we made the calculations for each One-Stop and then arrayed the data to create a benchmark group for each measure. The measures fell in the following four broad categories:
• Overall costs • Partner costs • Costs per activity • Costs per service unit produced.
In the following section we present the results by following the process map introduced earlier. Thus, we look separately at Universal Services, Enrolled Services, Business Services and Youth Services.

California One-Stop System Cost Study Report
21
It is important to note that not all One-Stops provided every activity in our standardized list of activities, and not every One-Stop counted every service we identified. While all One-Stops reported some activities and services for the universal, enrolled and business services processes, most One-Stops did not have a youth program. As a result, we do not have data on every measure for every One-Stop in the sample.
Limits
Every research method has its inherent limits. By combining qualitative case studies with a quantitative survey we tried to reduce limits imposed by each method. Still, there are some limits to our analysis that need to be acknowledged and considered when interpreting the study’s results. Both the case sample and the survey sample are designed to capture the variety of full-service One-Stops found in the state, but it is not a “representational random sample” which could be weighted up to provide estimates for the entire state. Our sample is made up of volunteers and One-Stops who chose to volunteer, which may be systematically different from other One-Stops. We did not include satellite One-Stops or One-Stops that were not full-service. While we included One-Stops of different sizes and in different regions, we did not attempt to do so in proportion to the population. Data are self reported. We did not audit the data provided. We essentially accepted what One-Stops reported about their resources expended and services produced. In some cases where One-Stops had not kept good records, for example had not tracked the number of workshops presented, we encouraged respondents to estimate rather than not report. None of the One-Stops tracked how they spent their time by activity; we had to ask managers to estimate how their staff spent their time. While this approach is commonly used in this type of analysis, it means that the allocation of staff costs is only as good as the managers’ estimates. Most importantly, our study is descriptive not evaluative. There are no standards or benchmarks for how a much One-Stop’s services should cost or how much partners should contribute. We do not attempt in this study to identify “good” or “poor” use of resources. Rather, we establish descriptive benchmarks for how resources were used and for the quantity of resources used. Overall our goal was to create a description of One-Stop costs and services which is “roughly right rather than precisely wrong”.

California One-Stop System Cost Study Report
22
III Results
In this section we use data from our analysis to answer the research questions posed by the study. It is important to remember in interpreting the results that data presented in this report represent all the costs for all the partners that operated “under the roof” of the One-Stop. Partner costs and services delivered away from the One-Stop are not included. Hence, if a participant got training on a nearby community college campus, that cost is not included, but if the client met with a community college counselor in the One-Stop, that cost and that service are included. We will begin each section by describing the median costs for measures discussed in the section. The median is the value at which half the sample was higher and half the sample was lower). We also show the range of costs. Then, we graphically display the full distribution of values for all 22 sites so the reader can see the complete distribution of costs. Readers who are interested in moving through the results quickly can just at the introductory tables and graphics and ignore the complete benchmarking distributions. On some of the following charts there are sites located on the right side of the chart that appear to have a zero value. These are sites where the applicable value was either not reported, not measurable, or not applicable. What resources do California One-Stops have and where do they spend them? In this section we analyze One-Stop costs by process and activity. We examine both the dollars spent by process/activity and the percentage of costs accounted for by each process/activity. Overall, the 22 sites had a total cost of $66.5 million in the study year. As the graph below indicates, across all sites, almost half (48%) of all costs were incurred in the enrolled services process. Universal services was the second-largest cost component at 30%. Business service and Youth service processes accounted for a much smaller proportion of costs. It is important to note that many One-Stops in our sample did not have Youth services. Figure III-1: Total Costs By Process, All Sites
Universal Services
30%
Enrolled Services
48%
Youth Services
9%Business Services
13%

California One-Stop System Cost Study Report
23
Total Costs By Site and Process
In this section, we analyze the range of costs found across all the One-Stops' data and benchmark the One-Stops against each other.
• Total Costs
As expected, we found a wide range of costs across One-Stops. Total costs varied from slightly over $10 million to about $900,000 among the 22 One-Stops. The median total cost was about $2.4 million. This wide variation in cost reflects a similarly wide variation in size of communities served and the number of clients served by the different One Stops. Figure III-2: Total Cost by One-Stop
$0
$2,000,000
$4,000,000
$6,000,000
$8,000,000
$10,000,000
$12,000,000
Survey
10 - N
orth -
Suburb
an
Survey
11 - N
orth -
Urba
n
Survey
2 - S
outh
- Rura
l
Survey
16 - S
outh
- Urba
n
Survey
8 - C
entra
l - Urba
n
Survey
17 - S
outh
- Urba
n
Survey
18 - N
orth -
Suburb
an / R
ural
Survey
3 - N
orth -
Rura
l
Survey
14 - S
outh
- Urba
n
Survey
15 - S
outh
- Urba
n
Survey
5 - S
outh
- Sub
urban
/ Rura
l
Survey
7 - C
entra
l - Rura
l
Survey
4 - N
orth -
Urba
n / R
ural
Case s
tudy 4
- Nort
h - R
ural
Survey
13 - S
outh
- Sub
urban
Survey
12 - S
outh
- Urba
n
Survey
1 - C
entra
l - Rura
l
Case s
tudy 1
- Sou
th - U
rban
Case s
tudy 3
- Cen
tral -
Rural/S
uburb
an
Survey
6 - S
outh
- Sub
urban
Survey
9 - C
entra
l - Urba
n
Case s
tudy 2
- Nort
h - Sub
urban
One-Stop
Tota
l Cos
t
• Cost By Process
Analysis of cost by the four major processes shows that One-Stops make very different decisions in how they spend their funds. This is driven in part by the partners who are under the roof. For example, if a One-Stop has a large Cal-Works project under the roof it may have a high percentage of its costs in enrolled services. The data we collected show that the cost of the universal service process ranges from $2.8 million to less than $200,000. Typically, universal services represented 30% of the total One-Stop cost, but that figure ranged from a high of 47% to low of 19% within our sample of One-Stops.
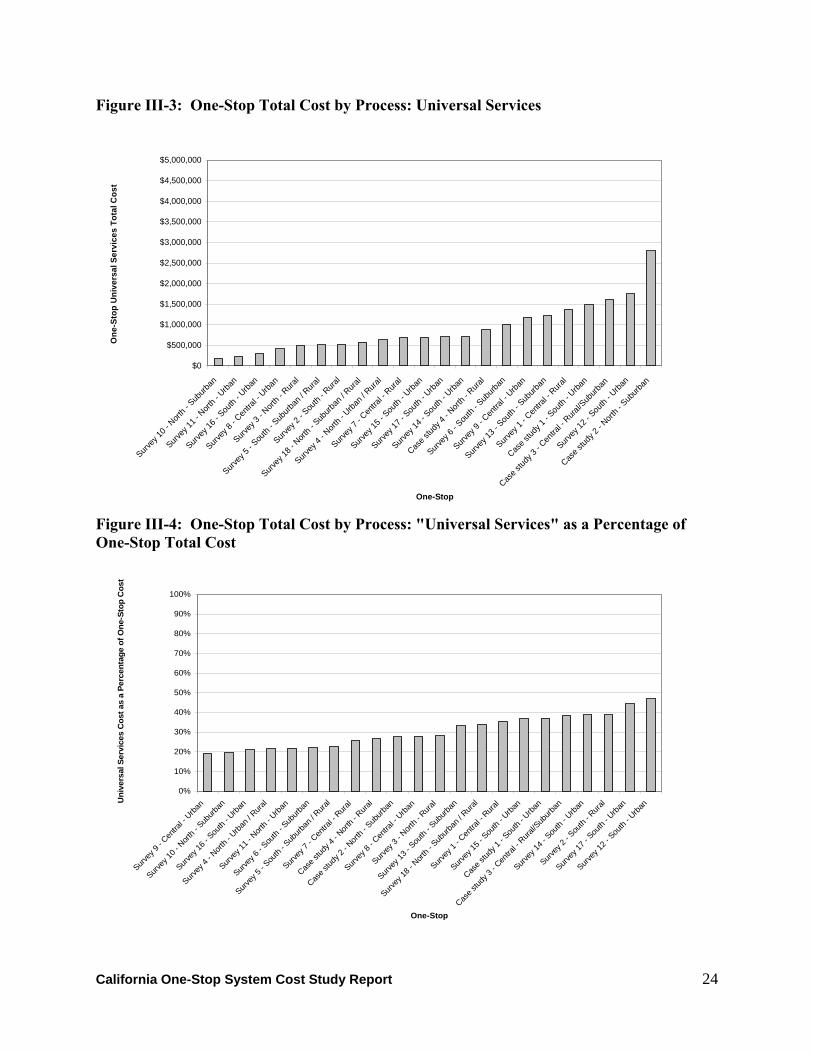
California One-Stop System Cost Study Report
24
Figure III-3: One-Stop Total Cost by Process: Universal Services
$0
$500,000
$1,000,000
$1,500,000
$2,000,000
$2,500,000
$3,000,000
$3,500,000
$4,000,000
$4,500,000
$5,000,000
Survey
10 - N
orth -
Sub
urban
Survey
11 - N
orth -
Urba
n
Survey
16 - S
outh
- Urba
n
Survey
8 - C
entra
l - Urba
n
Survey
3 - N
orth -
Rura
l
Survey
5 - S
outh
- Sub
urban
/ Rura
l
Survey
2 - S
outh
- Rura
l
Survey
18 - N
orth -
Sub
urban
/ Rura
l
Survey
4 - N
orth -
Urba
n / R
ural
Survey
7 - C
entra
l - Rura
l
Survey
15 - S
outh
- Urba
n
Survey
17 - S
outh
- Urba
n
Survey
14 - S
outh
- Urba
n
Case s
tudy 4
- Nort
h - R
ural
Survey
6 - S
outh
- Sub
urban
Survey
9 - C
entra
l - Urba
n
Survey
13 - S
outh
- Sub
urban
Survey
1 - C
entra
l - Rura
l
Case s
tudy 1
- Sou
th - U
rban
Case s
tudy 3
- Cen
tral -
Rural/S
uburb
an
Survey
12 - S
outh
- Urba
n
Case s
tudy 2
- Nort
h - Sub
urban
One-Stop
One
-Sto
p U
nive
rsal
Ser
vice
s To
tal C
ost
Figure III-4: One-Stop Total Cost by Process: "Universal Services" as a Percentage of One-Stop Total Cost
0%
10%
20%
30%
40%
50%
60%
70%
80%
90%
100%
Survey
9 - C
entra
l - Urba
n
Survey
10 - N
orth -
Sub
urban
Survey
16 - S
outh
- Urba
n
Survey
4 - N
orth -
Urba
n / R
ural
Survey
11 - N
orth -
Urba
n
Survey
6 - S
outh
- Sub
urban
Survey
5 - S
outh
- Sub
urban
/ Rura
l
Survey
7 - C
entra
l - Rura
l
Case s
tudy 4
- Nort
h - R
ural
Case s
tudy 2
- Nort
h - S
uburb
an
Survey
8 - C
entra
l - Urba
n
Survey
3 - N
orth -
Rura
l
Survey
13 - S
outh
- Sub
urban
Survey
18 - N
orth -
Sub
urban
/ Rura
l
Survey
1 - C
entra
l - Rura
l
Survey
15 - S
outh
- Urba
n
Case s
tudy 1
- Sou
th - U
rban
Case s
tudy 3
- Cen
tral -
Rural/S
uburb
an
Survey
14 - S
outh
- Urba
n
Survey
2 - S
outh
- Rura
l
Survey
17 - S
outh
- Urba
n
Survey
12 - S
outh
- Urba
n
One-Stop
Uni
vers
al S
ervi
ces
Cos
t as
a Pe
rcen
tage
of O
ne-S
top
Cos
t

California One-Stop System Cost Study Report
25
Enrolled services is where most One-Stops incurred their largest costs. Costs ranged from $4.7 million to about $400,000. Most One-Stops incurred between 40% and 50% of their costs in the enrolled process; the full range was from 31% to 71% of total One-Stop costs. Figure III-5: One-Stop Total Cost by Process: Enrolled Services
$0
$500,000
$1,000,000
$1,500,000
$2,000,000
$2,500,000
$3,000,000
$3,500,000
$4,000,000
$4,500,000
$5,000,000
Surve
y 2 - S
outh
- Rur
al
Surve
y 10 -
Nort
h - S
uburb
an
Surve
y 11 -
Nort
h - U
rban
Surve
y 17 -
Sou
th - U
rban
Surve
y 18 -
Nort
h - S
uburb
an / R
ural
Surve
y 8 - C
entra
l - Urb
an
Surve
y 16 -
Sou
th - U
rban
Surve
y 3 - N
orth -
Rur
al
Surve
y 15 -
Sou
th - U
rban
Surve
y 14 -
Sou
th - U
rban
Surve
y 7 - C
entra
l - Rur
al
Surve
y 5 - S
outh
- Sub
urban
/ Rur
al
Surve
y 1 - C
entra
l - Rur
al
Surve
y 12 -
Sou
th - U
rban
Case s
tudy 1
- Sou
th - U
rban
Case s
tudy 3
- Cen
tral -
Rural/S
uburb
an
Surve
y 4 - N
orth -
Urb
an / R
ural
Surve
y 13 -
Sou
th - S
uburb
an
Surve
y 6 - S
outh
- Sub
urban
Case s
tudy 4
- Nor
th - R
ural
Surve
y 9 - C
entra
l - Urb
an
Case s
tudy 2
- Nor
th - S
ubur
ban
One-Stop
One
-Sto
p En
rolle
d Se
rvic
es T
otal
Cos
t
Figure III-6: One-Stop Total Cost by Process: "Enrolled Services" as a Percentage of One-Stop Total Cost
0%
10%
20%
30%
40%
50%
60%
70%
80%
90%
100%
Survey
2 - S
outh
- Rura
l
Survey
18 - N
orth -
Sub
urban
/ Rura
l
Survey
17 - S
outh
- Urba
n
Survey
9 - C
entra
l - Urba
n
Survey
1 - C
entra
l - Rura
l
Case s
tudy 3
- Cen
tral -
Rural/S
uburb
an
Survey
12 - S
outh
- Urba
n
Case s
tudy 1
- Sou
th - U
rban
Survey
3 - N
orth -
Rura
l
Survey
15 - S
outh
- Urba
n
Survey
8 - C
entra
l - Urba
n
Case s
tudy 2
- Nort
h - S
uburb
an
Survey
7 - C
entra
l - Rura
l
Survey
14 - S
outh
- Urba
n
Survey
6 - S
outh
- Sub
urban
Survey
16 - S
outh
- Urba
n
Survey
13 - S
outh
- Sub
urban
Survey
11 - N
orth -
Urba
n
Survey
5 - S
outh
- Sub
urban
/ Rura
l
Survey
10 - N
orth -
Sub
urban
Survey
4 - N
orth -
Urba
n / R
ural
Case s
tudy 4
- Nort
h - R
ural
One-Stop
Enro
lled
Serv
ices
Cos
t as
a Pe
rcen
tage
of O
ne-S
top
Cos
t
4

California One-Stop System Cost Study Report
26
The costs of the business service process were substantially less than universal or enrolled services. Costs ranged from a few thousand dollars to $1.3 million within the sample. Most One-Stops incurred less than 20% of their total costs in business services, with a substantial number of One-Stops incurring less than 10% of their total cost in business services. Figure III-7: One-Stop Total Cost by Process: Business Services
$0
$500,000
$1,000,000
$1,500,000
$2,000,000
$2,500,000
$3,000,000
$3,500,000
$4,000,000
$4,500,000
$5,000,000
Surve
y 5 - S
outh
- Sub
urban
/ Rur
al
Case s
tudy 4
- Nor
th - R
ural
Surve
y 7 - C
entra
l - Rur
al
Surve
y 10 -
Nort
h - S
uburb
an
Surve
y 4 - N
orth -
Urb
an / R
ural
Surve
y 11 -
Nort
h - U
rban
Surve
y 13 -
Sou
th - S
uburb
an
Surve
y 18 -
Nort
h - S
uburb
an / R
ural
Surve
y 16 -
Sou
th - U
rban
Surve
y 12 -
Sou
th - U
rban
Surve
y 14 -
Sou
th - U
rban
Surve
y 1 - C
entra
l - Rur
al
Surve
y 15 -
Sou
th - U
rban
Surve
y 17 -
Sou
th - U
rban
Surve
y 2 - S
outh
- Rur
al
Surve
y 8 - C
entra
l - Urb
an
Surve
y 3 - N
orth
- Rur
al
Case s
tudy 1
- Sou
th - U
rban
Surve
y 6 - S
outh
- Sub
urban
Case s
tudy 3
- Cen
tral -
Rural/S
uburb
an
Surve
y 9 - C
entra
l - Urb
an
Case s
tudy 2
- Nor
th - S
ubur
ban
One-Stop
One
-Sto
p B
usin
ess
Serv
ices
Tot
al C
ost
Figure III-8: One-Stop Total Cost by Process: "Business Services" as a Percentage of One-Stop Total Cost
0%
10%
20%
30%
40%
50%
60%
70%
80%
90%
100%
Survey
5 - S
outh
- Sub
urba
n / R
ural
Case s
tudy 4
- Nort
h - R
ural
Survey
7 - C
entra
l - Rur
al
Survey
13 -
South
- Sub
urban
Survey
12 -
South
- Urba
n
Survey
4 - N
orth -
Urba
n / R
ural
Survey
1 - C
entra
l - Rur
al
Case s
tudy 2
- Nort
h - S
ubur
ban
Survey
14 -
South
- Urba
n
Survey
18 -
North -
Sub
urba
n / R
ural
Survey
15 -
South
- Urba
n
Survey
16 -
South
- Urba
n
Survey
6 - S
outh
- Sub
urba
n
Survey
9 - C
entra
l - Urb
an
Survey
17 -
South
- Urba
n
Case s
tudy 1
- Sou
th - U
rban
Case s
tudy 3
- Cen
tral -
Rural/S
ubur
ban
Survey
8 - C
entra
l - Urb
an
Survey
10 -
North -
Sub
urba
n
Survey
3 - N
orth -
Rura
l
Survey
11 -
North -
Urba
n
Survey
2 - S
outh
- Rura
l
One-Stop
Bus
ines
s Se
rvic
es C
ost a
s a
Perc
enta
ge o
f One
-Sto
p C
ost

California One-Stop System Cost Study Report
27
Of the 22 sites, fifteen had youth services under the roof. Youth costs ranged from $78,000 to almost $1.5 million. Most One-Stops that had youth services spent between 8% and 20% of their total costs on youth services. Figure III-9: One-Stop Total Cost by Process: Youth Services
$0
$500,000
$1,000,000
$1,500,000
$2,000,000
$2,500,000
$3,000,000
$3,500,000
$4,000,000
$4,500,000
$5,000,000
Surve
y 15 -
Sou
th - U
rban
Surve
y 8 -
Centra
l - Urb
an
Surve
y 3 -
North -
Rur
al
Surve
y 2 - S
outh
- Rur
al
Surve
y 12 -
Sou
th - U
rban
Surve
y 4 - N
orth
- Urb
an / R
ural
Surve
y 13 -
Sou
th - S
ubur
ban
Surve
y 16 -
Sou
th - U
rban
Surve
y 18 -
Nor
th - S
uburb
an / R
ural
Surve
y 5 -
South
- Sub
urba
n / R
ural
Surve
y 7 - C
entra
l - Rur
al
Surve
y 6 -
South
- Sub
urba
n
Surve
y 1 - C
entra
l - Rur
al
Case s
tudy 2
- Nor
th - S
ubur
ban
Surve
y 9 -
Centra
l - Urb
an
Case s
tudy 1
- Sou
th - U
rban
Case s
tudy 3
- Cen
tral -
Rural/
Subur
ban
Case s
tudy 4
- Nor
th - R
ural
Surve
y 10 -
Nor
th - S
ubur
ban
Surve
y 11 -
Nor
th - U
rban
Surve
y 14 -
Sou
th - U
rban
Surve
y 17 -
Sou
th - U
rban
One-Stop
One
-Sto
p Yo
uth
Serv
ices
Tot
al C
ost
Figure III-10: One-Stop Total Cost by Process: "Youth Services" as a Percentage of One-Stop Total Cost
0%
10%
20%
30%
40%
50%
60%
70%
80%
90%
100%
Survey
12 - S
outh
- Urba
n
Survey
13 - S
outh
- Sub
urban
Survey
15 - S
outh
- Urba
n
Survey
4 - N
orth -
Urba
n / R
ural
Survey
3 - N
orth -
Rura
l
Survey
8 - C
entra
l - Urba
n
Survey
2 - S
outh
- Rura
l
Survey
16 - S
outh
- Urba
n
Survey
6 - S
outh
- Sub
urban
Case s
tudy 2
- Nort
h - S
uburb
an
Survey
1 - C
entra
l - Rura
l
Survey
18 - N
orth -
Sub
urban
/ Rura
l
Survey
5 - S
outh
- Sub
urban
/ Rura
l
Survey
7 - C
entra
l - Rura
l
Survey
9 - C
entra
l - Urba
n
Case s
tudy 1
- Sou
th - U
rban
Case s
tudy 3
- Cen
tral -
Rural/S
uburb
an
Case s
tudy 4
- Nort
h - R
ural
Survey
10 - N
orth -
Sub
urba
n
Survey
11 - N
orth -
Urba
n
Survey
14 - S
outh
- Urba
n
Survey
17 - S
outh
- Urba
n
One-Stop
Yout
h Se
rvic
es C
ost a
s a
Perc
enta
ge o
f One
-Sto
p C
ost

California One-Stop System Cost Study Report
28
Total Costs by Site and Activity
We asked One-Stops to trace 100% of their costs to the standard list of activities within the processes that we introduced earlier. To provide a more detailed idea of where costs were incurred, we present here the percent of total costs from each site for each activity, by the four processes. We begin the analysis of each process by showing the median percentage of costs15 for each activity, and the range of percentages across the sites. Then we display the complete benchmarked data for all 22 sites. We begin with universal service activities.
• Universal Process Costs By Activity
Overall, universal services costs accounted for between 19% and 47% of all costs. The median was 28%. Costs were relatively evenly divided across the activities. Seldom did any One-Stop invest more than 20% of its total costs in any particular universal activity. In some activities there was a wide variation in costs. For example, the data show that in “Self Service Job Search Information and Support” costs ranged from 3% to 24 % of total cost, with a median of only 7%. Table III-1: Universal Activities: Median Percent of One-Stop Costs and Range Activity Median Percent Of
Cost Range of Costs
Self Service Job Search Information and Support
7.2% 2.9 – 24.1%
Coaching and 1-on-1 assistance 8.9% 1.9 - 21.2% Orientation to One-Stop 5.0% 1.3 – 16.3% Workshops: Job search and
Support 4.3% 1.4 – 11.7%
Job Seeking Networks 1.0% 0.1 – 11.6% All Universal Activities 28.1% 19.3 – 47.0% A major cost item which we uncovered in the case studies is “Coaching and 1-on-1 Assistance”. It appears that much universal activity is not completely self-service but in fact involves staff spending a good deal of time helping individuals. As Table III-1 indicates, “Coaching and 1-on-1 Assistance” was the most expensive activity in the universal process with a median cost of almost 9% of the total One-Stop cost. About two-thirds of the One-Stops provided job clubs or other networking activities for job seekers. This activity was not very costly overall, with half the One-Stops reporting they spent less than 1% of total costs on this activity. The low costs may be due to the fact that job clubs and networks are largely self-managed by the participants. All but one of the One-Stops provided workshops to clients as part of the universal services process. Costs ranged from 1% to almost 12% of total costs with a median of 4.3%. Orientation
15 In calculating the median and the range we eliminated One-Stops that reported they did not have the particular activity rather than include 0s, hence median and ranges are for the One-Stops that reported some level of activity.

California One-Stop System Cost Study Report
29
to the One-Stops represented a substantial cost, with a median value of 5% of total One-Stop costs. Figure III-11: Activity Cost as a Percentage of Total One-Stop Cost: "Universal - Self Service - Job Search Information and Support"
0.0%
5.0%
10.0%
15.0%
20.0%
25.0%
30.0%
35.0%
40.0%
Survey
5 - S
outh
- Sub
urban
/ Rura
l
Survey
4 - N
orth -
Urba
n / R
ural
Case s
tudy 1
- Sou
th - U
rban
Case s
tudy 3
- Cen
tral -
Rural/S
uburb
an
Survey
10 - N
orth -
Sub
urban
Survey
14 -
South
- Urba
n
Case s
tudy 4
- Nort
h - R
ural
Survey
16 -
South
- Urba
n
Survey
17 -
South
- Urba
n
Survey
13 - S
outh
- Sub
urban
Survey
2 - S
outh
- Rura
l
Survey
18 -
North -
Sub
urban
/ Rura
l
Survey
6 - S
outh
- Sub
urban
Case s
tudy 2
- Nort
h - S
uburb
an
Survey
3 - N
orth -
Rura
l
Survey
11 - N
orth -
Urba
n
Survey
9 - C
entra
l - Urb
an
Survey
8 - C
entra
l - Urb
an
Survey
15 -
South
- Urba
n
Survey
7 - C
entra
l - Rur
al
Survey
1 - C
entra
l - Rur
al
Survey
12 -
South
- Urba
n
One-Stop
"Uni
vers
al -
Self
Serv
ice
- Job
Sea
rch
Info
rmat
ion
and
Supp
ort"
Cos
t as
a Pe
rcen
tage
of T
otal
One
-Sto
p C
ost
Figure III-12: Activity Cost as a Percentage of Total One-Stop Cost: "Universal - Coaching and 1-on-1 Assistance"
0.0%
5.0%
10.0%
15.0%
20.0%
25.0%
30.0%
35.0%
40.0%
Survey
7 - C
entra
l - Rur
al
Survey
14 -
South
- Urba
n
Survey
8 - C
entra
l - Urba
n
Survey
9 - C
entra
l - Urba
n
Survey
6 - S
outh
- Sub
urba
n
Survey
16 -
South
- Urba
n
Survey
17 -
South
- Urba
n
Survey
11 -
North -
Urba
n
Survey
10 -
North -
Sub
urba
n
Survey
5 - S
outh
- Sub
urba
n / R
ural
Survey
4 - N
orth -
Urba
n / R
ural
Case s
tudy 4
- Nort
h - R
ural
Survey
3 - N
orth -
Rura
l
Survey
15 -
South
- Urba
n
Case s
tudy 2
- Nort
h - S
uburb
an
Survey
18 -
North -
Sub
urba
n / R
ural
Survey
2 - S
outh
- Rura
l
Case s
tudy 1
- Sou
th - U
rban
Survey
1 - C
entra
l - Rur
al
Survey
12 -
South
- Urba
n
Survey
13 -
South
- Sub
urban
Case s
tudy 3
- Cen
tral -
Rural/S
ubur
ban
One-Stop
"Uni
vers
al -
Coa
chin
g an
d 1-
on-1
Ass
ista
nce"
Cos
t as
a Pe
rcen
tage
of
Tota
l One
-Sto
p C
ost

California One-Stop System Cost Study Report
30
Figure III-13: Activity Cost as a Percentage of Total One-Stop Cost: "Universal - Orientation to One-Stop"
0.0%
5.0%
10.0%
15.0%
20.0%
25.0%
30.0%
35.0%
40.0%
Case s
tudy 2
- Nort
h - S
uburb
an
Survey
13 - S
outh
- Sub
urban
Survey
7 - C
entra
l - Rura
l
Survey
4 - N
orth -
Urba
n / R
ural
Survey
11 - N
orth -
Urba
n
Survey
10 - N
orth -
Sub
urban
Survey
1 - C
entra
l - Rura
l
Survey
9 - C
entra
l - Urba
n
Case s
tudy 4
- Nort
h - R
ural
Survey
12 - S
outh
- Urba
n
Survey
6 - S
outh
- Sub
urban
Survey
16 - S
outh
- Urba
n
Survey
8 - C
entra
l - Urba
n
Survey
14 - S
outh
- Urba
n
Case s
tudy 1
- Sou
th - U
rban
Survey
15 - S
outh
- Urba
n
Survey
18 - N
orth -
Sub
urban
/ Rura
l
Survey
3 - N
orth -
Rura
l
Survey
2 - S
outh
- Rura
l
Survey
5 - S
outh
- Sub
urban
/ Rura
l
Case s
tudy 3
- Cen
tral -
Rural/S
uburb
an
Survey
17 - S
outh
- Urba
n
One-Stop
"Uni
vers
al -
Orie
ntat
ion
to O
ne-S
top"
Cos
t as
a Pe
rcen
tage
of T
otal
One
-St
op C
ost
Figure III-14: Activity Cost as a Percentage of Total One-Stop Cost: "Universal - Workshops: Job Search and Support"
0.0%
5.0%
10.0%
15.0%
20.0%
25.0%
30.0%
35.0%
40.0%
Case s
tudy 3
- Cen
tral -
Rural/S
uburb
an
Survey
3 - N
orth -
Rura
l
Survey
9 - C
entra
l - Urba
n
Survey
1 - C
entra
l - Rura
l
Survey
12 - S
outh
- Urba
n
Case s
tudy 2
- Nort
h - S
uburb
an
Case s
tudy 1
- Sou
th - U
rban
Survey
15 - S
outh
- Urba
n
Survey
5 - S
outh
- Sub
urban
/ Rura
l
Survey
13 - S
outh
- Sub
urban
Survey
8 - C
entra
l - Urba
n
Survey
16 - S
outh
- Urba
n
Survey
2 - S
outh
- Rura
l
Survey
6 - S
outh
- Sub
urban
Survey
11 - N
orth -
Urba
n
Case s
tudy 4
- Nort
h - R
ural
Survey
10 - N
orth -
Sub
urban
Survey
4 - N
orth -
Urba
n / R
ural
Survey
7 - C
entra
l - Rura
l
Survey
17 - S
outh
- Urba
n
Survey
18 - N
orth -
Sub
urban
/ Rura
l
Survey
14 - S
outh
- Urba
n
One-Stop
"Uni
vers
al -
Wor
ksho
ps: J
ob S
earc
h an
d Su
ppor
t" C
ost a
s a
Perc
enta
ge o
f To
tal O
ne-S
top
Cos
t
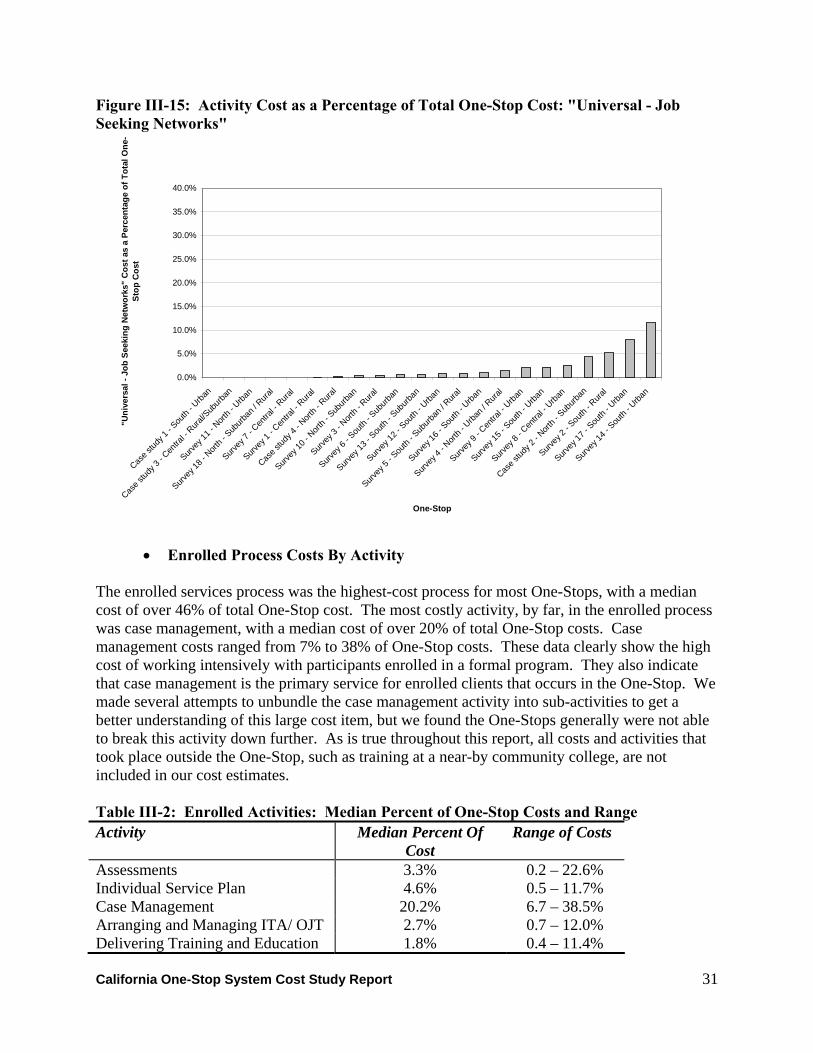
California One-Stop System Cost Study Report
31
Figure III-15: Activity Cost as a Percentage of Total One-Stop Cost: "Universal - Job Seeking Networks"
0.0%
5.0%
10.0%
15.0%
20.0%
25.0%
30.0%
35.0%
40.0%
Case s
tudy 1
- Sou
th - U
rban
Case s
tudy 3
- Cen
tral -
Rural/S
uburb
an
Survey
11 - N
orth -
Urba
n
Survey
18 - N
orth -
Sub
urban
/ Rura
l
Survey
7 - C
entra
l - Rura
l
Survey
1 - C
entra
l - Rura
l
Case s
tudy 4
- Nort
h - R
ural
Survey
10 - N
orth -
Sub
urban
Survey
3 - N
orth -
Rura
l
Survey
6 - S
outh
- Sub
urban
Survey
13 - S
outh
- Sub
urban
Survey
12 - S
outh
- Urba
n
Survey
5 - S
outh
- Sub
urban
/ Rura
l
Survey
16 - S
outh
- Urba
n
Survey
4 - N
orth -
Urba
n / R
ural
Survey
9 - C
entra
l - Urba
n
Survey
15 - S
outh
- Urba
n
Survey
8 - C
entra
l - Urba
n
Case s
tudy 2
- Nort
h - S
uburb
an
Survey
2 - S
outh
- Rura
l
Survey
17 - S
outh
- Urba
n
Survey
14 - S
outh
- Urba
n
One-Stop
"Uni
vers
al -
Job
Seek
ing
Net
wor
ks"
Cos
t as
a Pe
rcen
tage
of T
otal
One
-St
op C
ost
• Enrolled Process Costs By Activity The enrolled services process was the highest-cost process for most One-Stops, with a median cost of over 46% of total One-Stop cost. The most costly activity, by far, in the enrolled process was case management, with a median cost of over 20% of total One-Stop costs. Case management costs ranged from 7% to 38% of One-Stop costs. These data clearly show the high cost of working intensively with participants enrolled in a formal program. They also indicate that case management is the primary service for enrolled clients that occurs in the One-Stop. We made several attempts to unbundle the case management activity into sub-activities to get a better understanding of this large cost item, but we found the One-Stops generally were not able to break this activity down further. As is true throughout this report, all costs and activities that took place outside the One-Stop, such as training at a near-by community college, are not included in our cost estimates. Table III-2: Enrolled Activities: Median Percent of One-Stop Costs and Range Activity Median Percent Of
Cost Range of Costs
Assessments 3.3% 0.2 – 22.6% Individual Service Plan 4.6% 0.5 – 11.7% Case Management 20.2% 6.7 – 38.5% Arranging and Managing ITA/ OJT 2.7% 0.7 – 12.0% Delivering Training and Education 1.8% 0.4 – 11.4%

California One-Stop System Cost Study Report
32
Activity Median Percent Of Cost
Range of Costs
Support Services 1.8% 0.1 – 15.1% Placement Assistance 7.0% 2.0 – 14.0% All Enrolled Activities 45.9% 31.3 – 70.8% Other significant cost items in the enrolled process and found in most One-Stops include: conducting assessments (median cost 2.3% of One-Stop total cost), developing an individual plan (median cost 4.6%), and providing placement assistance (median cost 7.0%). Training costs were much lower and were not found in all the One-Stops. This is probably because much of the training activity was conducted outside the One-Stops. We learned from the case studies that very little training, other than brief workshops and some limited class room training such as ESL training, takes place under the roof of the One-Stops. Most of the costs reported for skill training such as WIA Individual Training Accounts (ITA) or on-the-job Training (OJT) placements probably represent the cost of setting up and managing ITAs and OJT funded under WIA. Support services were also a minor cost item in most One-Stops, with median cost just 1.8%. Only four sites report spending more than 5% of costs on support services. Figure III-16: Activity Cost as a Percentage of Total One-Stop Cost: "Enrolled - Assessment"
0.0%
5.0%
10.0%
15.0%
20.0%
25.0%
30.0%
35.0%
40.0%
Case s
tudy 1
- Sou
th - U
rban
Case s
tudy 3
- Cen
tral -
Rural/S
uburb
an
Survey
12 - S
outh
- Urba
n
Survey
17 - S
outh
- Urba
n
Survey
1 - C
entra
l - Rura
l
Survey
11 - N
orth -
Urba
n
Survey
6 - S
outh
- Sub
urban
Survey
2 - S
outh
- Rura
l
Survey
7 - C
entra
l - Rura
l
Survey
9 - C
entra
l - Urba
n
Survey
10 - N
orth -
Suburb
an
Survey
5 - S
outh
- Sub
urban
/ Rura
l
Survey
14 - S
outh
- Urba
n
Survey
18 - N
orth -
Suburb
an / R
ural
Survey
15 - S
outh
- Urba
n
Case s
tudy 2
- Nort
h - Sub
urban
Survey
13 - S
outh
- Sub
urban
Case s
tudy 4
- Nort
h - R
ural
Survey
8 - C
entra
l - Urba
n
Survey
16 - S
outh
- Urba
n
Survey
3 - N
orth -
Rura
l
Survey
4 - N
orth -
Urba
n / R
ural
One-Stop
"Enr
olle
d - A
sses
smen
t" C
ost a
s a
Perc
enta
ge o
f Tot
al O
ne-S
top
Cos
t

California One-Stop System Cost Study Report
33
Figure III-17: Activity Cost as a Percentage of Total One-Stop Cost: "Enrolled - Individual Service Plan, such as IEP"
0.0%
5.0%
10.0%
15.0%
20.0%
25.0%
30.0%
35.0%
40.0%
Case s
tudy 3
- Cen
tral -
Rural/S
ubur
ban
Case s
tudy 1
- Sou
th - U
rban
Survey
18 -
North -
Sub
urba
n / R
ural
Survey
2 - S
outh
- Rura
l
Survey
6 - S
outh
- Sub
urba
n
Survey
17 -
South
- Urba
n
Survey
5 - S
outh
- Sub
urba
n / R
ural
Survey
12 -
South
- Urba
n
Survey
3 - N
orth -
Rura
l
Survey
9 - C
entra
l - Urb
an
Survey
11 -
North -
Urba
n
Survey
10 -
North -
Sub
urba
n
Case s
tudy 2
- Nort
h - S
uburb
an
Survey
1 - C
entra
l - Rur
al
Survey
14 -
South
- Urba
n
Survey
13 -
South
- Sub
urban
Survey
8 - C
entra
l - Urb
an
Survey
15 -
South
- Urba
n
Survey
7 - C
entra
l - Rur
al
Survey
16 -
South
- Urba
n
Survey
4 - N
orth -
Urba
n / R
ural
Case s
tudy 4
- Nort
h - R
ural
One-Stop
"Enr
olle
d - I
ndiv
idua
l Ser
vice
Pla
n, s
uch
as IE
P" C
ost a
s a
Perc
enta
ge o
f To
tal O
ne-S
top
Cos
t
Figure III-18: Activity Cost as a Percentage of Total One-Stop Cost: "Enrolled - Case Management"
0.0%
5.0%
10.0%
15.0%
20.0%
25.0%
30.0%
35.0%
40.0%
Case s
tudy 3
- Cen
tral -
Rural/S
uburb
an
Survey
16 - S
outh
- Urba
n
Survey
3 - N
orth -
Rura
l
Survey
9 - C
entra
l - Urba
n
Survey
15 - S
outh
- Urba
n
Survey
2 - S
outh
- Rura
l
Survey
18 - N
orth -
Suburb
an / R
ural
Survey
12 - S
outh
- Urba
n
Case s
tudy 2
- Nort
h - Sub
urban
Case s
tudy 4
- Nort
h - R
ural
Survey
8 - C
entra
l - Urba
n
Survey
17 - S
outh
- Urba
n
Survey
14 - S
outh
- Urba
n
Survey
7 - C
entra
l - Rura
l
Case s
tudy 1
- Sou
th - U
rban
Survey
1 - C
entra
l - Rura
l
Survey
6 - S
outh
- Sub
urban
Survey
4 - N
orth -
Urba
n / R
ural
Survey
5 - S
outh
- Sub
urban
/ Rura
l
Survey
11 - N
orth -
Urba
n
Survey
13 - S
outh
- Sub
urban
Survey
10 - N
orth -
Suburb
an
One-Stop
"Enr
olle
d - C
ase
Man
agem
ent"
Cos
t as
a Pe
rcen
tage
of T
otal
One
-Sto
p C
ost

California One-Stop System Cost Study Report
34
Figure III-19: Activity Cost as a Percentage of Total One-Stop Cost: "Enrolled - ITA/ OJT"
0.0%
5.0%
10.0%
15.0%
20.0%
25.0%
30.0%
35.0%
40.0%
Case s
tudy 2
- Nort
h - S
uburb
an
Case s
tudy 4
- Nort
h - R
ural
Survey
13 - S
outh
- Sub
urban
Survey
18 - N
orth -
Sub
urban
/ Rura
l
Survey
3 - N
orth -
Rura
l
Survey
4 - N
orth -
Urba
n / R
ural
Survey
17 - S
outh
- Urba
n
Survey
1 - C
entra
l - Rura
l
Survey
14 - S
outh
- Urba
n
Survey
2 - S
outh
- Rura
l
Case s
tudy 1
- Sou
th - U
rban
Survey
7 - C
entra
l - Rura
l
Survey
8 - C
entra
l - Urba
n
Survey
15 - S
outh
- Urba
n
Survey
9 - C
entra
l - Urba
n
Survey
11 - N
orth -
Urba
n
Survey
16 - S
outh
- Urba
n
Survey
10 - N
orth -
Sub
urban
Survey
6 - S
outh
- Sub
urban
Survey
12 - S
outh
- Urba
n
Survey
5 - S
outh
- Sub
urban
/ Rura
l
Case s
tudy 3
- Cen
tral -
Rural/S
uburb
an
One-Stop
"Enr
olle
d - I
TA/ O
JT"
Cos
t as
a Pe
rcen
tage
of T
otal
One
-Sto
p C
ost
Figure III-20: Activity Cost as a Percentage of Total One-Stop Cost: "Enrolled - Training and Education"
0.0%
5.0%
10.0%
15.0%
20.0%
25.0%
30.0%
35.0%
40.0%
Survey
10 - N
orth -
Sub
urban
Survey
3 - N
orth -
Rura
l
Survey
5 - S
outh
- Sub
urban
/ Rura
l
Survey
6 - S
outh
- Sub
urban
Survey
8 - C
entra
l - Urba
n
Survey
4 - N
orth -
Urba
n / R
ural
Survey
16 - S
outh
- Urba
n
Survey
2 - S
outh
- Rura
l
Survey
1 - C
entra
l - Rura
l
Survey
18 - N
orth -
Sub
urban
/ Rura
l
Survey
11 - N
orth -
Urba
n
Survey
12 - S
outh
- Urba
n
Survey
7 - C
entra
l - Rura
l
Survey
9 - C
entra
l - Urba
n
Survey
13 - S
outh
- Sub
urban
Survey
14 - S
outh
- Urba
n
Case s
tudy 4
- Nort
h - R
ural
Case s
tudy 1
- Sou
th - U
rban
Survey
15 - S
outh
- Urba
n
Survey
17 - S
outh
- Urba
n
Case s
tudy 3
- Cen
tral -
Rural/S
uburb
an
Case s
tudy 2
- Nort
h - S
uburb
an
One-Stop
"Enr
olle
d - T
rain
ing
and
Educ
atio
n" C
ost a
s a
Perc
enta
ge o
f Tot
al O
ne-
Stop
Cos
t
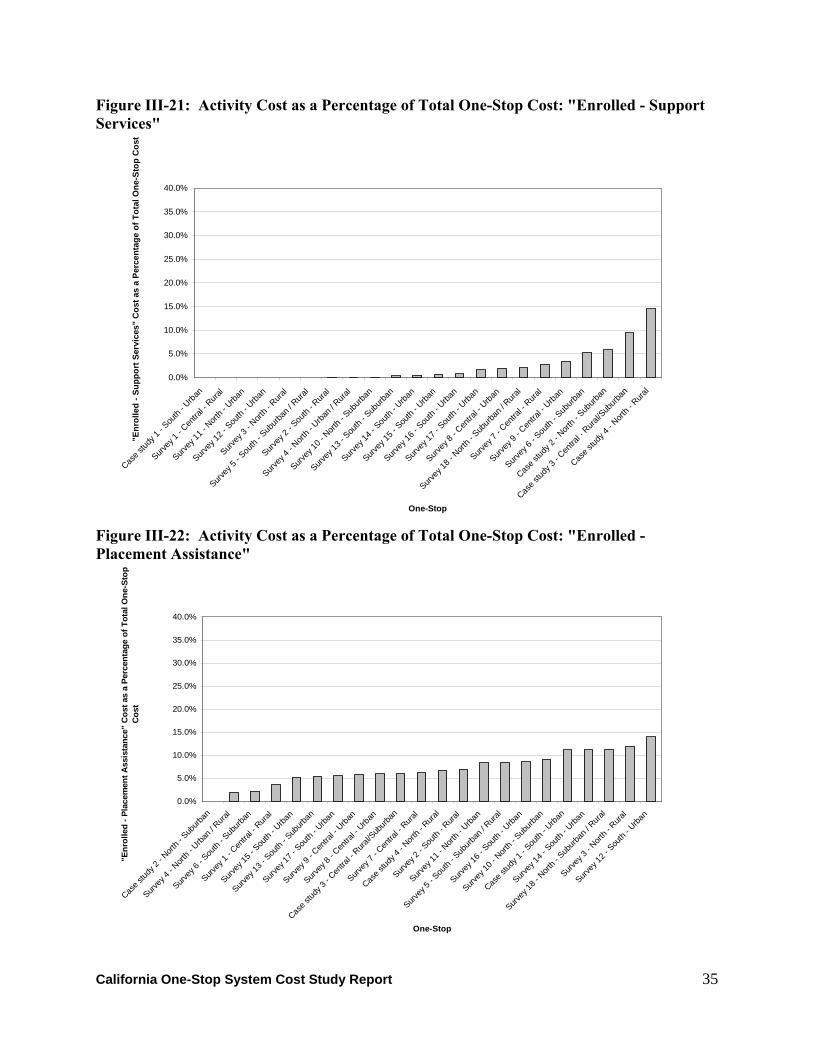
California One-Stop System Cost Study Report
35
Figure III-21: Activity Cost as a Percentage of Total One-Stop Cost: "Enrolled - Support Services"
0.0%
5.0%
10.0%
15.0%
20.0%
25.0%
30.0%
35.0%
40.0%
Case s
tudy 1
- Sou
th - U
rban
Survey
1 - C
entra
l - Rura
l
Survey
11 - N
orth -
Urba
n
Survey
12 - S
outh
- Urba
n
Survey
3 - N
orth -
Rura
l
Survey
5 - S
outh
- Sub
urban
/ Rura
l
Survey
2 - S
outh
- Rura
l
Survey
4 - N
orth -
Urba
n / R
ural
Survey
10 - N
orth -
Sub
urban
Survey
13 - S
outh
- Sub
urban
Survey
14 - S
outh
- Urba
n
Survey
15 - S
outh
- Urba
n
Survey
16 - S
outh
- Urba
n
Survey
17 - S
outh
- Urba
n
Survey
8 - C
entra
l - Urba
n
Survey
18 - N
orth -
Sub
urban
/ Rura
l
Survey
7 - C
entra
l - Rura
l
Survey
9 - C
entra
l - Urba
n
Survey
6 - S
outh
- Sub
urban
Case s
tudy 2
- Nort
h - S
uburb
an
Case s
tudy 3
- Cen
tral -
Rural/S
uburb
an
Case s
tudy 4
- Nort
h - R
ural
One-Stop
"Enr
olle
d - S
uppo
rt S
ervi
ces"
Cos
t as
a Pe
rcen
tage
of T
otal
One
-Sto
p C
ost
Figure III-22: Activity Cost as a Percentage of Total One-Stop Cost: "Enrolled - Placement Assistance"
0.0%
5.0%
10.0%
15.0%
20.0%
25.0%
30.0%
35.0%
40.0%
Case s
tudy 2
- Nort
h - S
uburb
an
Survey
4 - N
orth -
Urba
n / R
ural
Survey
6 - S
outh
- Sub
urban
Survey
1 - C
entra
l - Rura
l
Survey
15 - S
outh
- Urba
n
Survey
13 - S
outh
- Sub
urban
Survey
17 - S
outh
- Urba
n
Survey
9 - C
entra
l - Urba
n
Survey
8 - C
entra
l - Urba
n
Case s
tudy 3
- Cen
tral -
Rural/S
uburb
an
Survey
7 - C
entra
l - Rura
l
Case s
tudy 4
- Nort
h - R
ural
Survey
2 - S
outh
- Rura
l
Survey
11 - N
orth -
Urba
n
Survey
5 - S
outh
- Sub
urban
/ Rura
l
Survey
16 - S
outh
- Urba
n
Survey
10 - N
orth -
Sub
urban
Case s
tudy 1
- Sou
th - U
rban
Survey
14 - S
outh
- Urba
n
Survey
18 - N
orth -
Sub
urban
/ Rura
l
Survey
3 - N
orth -
Rura
l
Survey
12 - S
outh
- Urba
n
One-Stop
"Enr
olle
d - P
lace
men
t Ass
ista
nce"
Cos
t as
a Pe
rcen
tage
of T
otal
One
-Sto
p C
ost

California One-Stop System Cost Study Report
36
• Business Process Cost By Activity Virtually all One-Stops had some business service activities, but for most is was a relatively low cost area; the median percentage of One-Stop total costs spent on business services was 15.3%. The highest cost activity within the business service process was “Job Development”, with a median cost of 5% of One-Stop total cost. Job development was an activity that we located in business services, but which in reality often serves business clients, enrolled clients, and universal clients. Rapid response services were one of the most common business services activities, but it accounted for only small portion of total cost, with a median cost of about 1%. Providing mass hire services or job fairs to match local employers with job seekers was another common activity with median cost of 3.1%. Nine One-Stops reported they spent close to 5% or more of their total costs on this activity. Thirteen of the 22 One-Stops reported costs for business workshops, with typical costs accounting for less than 1% of total costs. Similarly, 14 One-Stops reported providing consulting services for business but typically this represented only of 1% of total costs. Fifteen One-Stops reported having a business center that provided walk-in services to business; median cost of these walk-in services totaled less than 1% of all One-Stop costs. Table III-3: Business Activities: Median Percent of One-Stop Costs and Range Activity Median Percent Of
Cost Range of Costs
Rapid Response Assistance 0.9% 0.0 – 5.9% Mass Hires Job Fairs 3.1% 0.2 – 9.6% Workshops 0.7% 0.2 – 3.6% Business Consulting 1.1% 0.0 – 3.1% Business Center Services 0.7% 0.0 – 10.7% Job Development 5.0% 0.1 – 16.8% All Business Activities 15.3% 1.0 – 21.9% Figure III-23: Activity Cost as a Percentage of Total One-Stop Cost: "Business - Rapid Response Assistance"
0.0%
5.0%
10.0%
15.0%
20.0%
25.0%
30.0%
35.0%
40.0%
Case s
tudy 1
- So
uth - Urb
an
Surve
y 10 -
North
- Sub
urba
n
Surve
y 11 -
North
- Urban
Surve
y 13 -
Sou
th - S
uburba
n
Surve
y 7 - Cen
tral -
Rural
Surve
y 12 -
Sou
th - U
rban
Case s
tudy 4
- Nor
th - R
ura
Surve
y 14 -
Sou
th - U
rban
Surve
y 17 -
Sou
th - U
rban
Surve
y 3 - Nor
th - R
ural
Surve
y 9 - Cen
tral -
Urban
Surve
y 15 -
Sou
th - U
rban
Case s
tudy 3
- Cen
tral -
Rural/
Subu
rba
Surve
y 5 - So
uth - Su
burban
/ Rura
Surve
y 18 -
North
- Sub
urba
n / R
ura
Surve
y 1 - Cen
tral -
Rural
Surve
y 6 - So
uth - Su
burban
Surve
y 2 - So
uth - Rur
al
Surve
y 8 - Cen
tral -
Urban
Surve
y 16 -
Sou
th - U
rban
Surve
y 4 - Nor
th - U
rban
/ Rura
Case s
tudy 2
- Nor
th - S
uburba
n
One-Stop
"Bus
ines
s - R
apid
Res
pons
e Ass
ista
nce"
Cos
t as
a Pe
rcen
tage
of T
otal
O
ne-S
top
Cos
t

California One-Stop System Cost Study Report
37
Figure III-24: Activity Cost as a Percentage of Total One-Stop Cost: "Business - Mass Hires / Job Fairs"
0.0%
5.0%
10.0%
15.0%
20.0%
25.0%
30.0%
35.0%
40.0%
Case s
tudy 1
- Sou
th - U
rban
Case s
tudy 2
- Nort
h - S
uburb
an
Case s
tudy 3
- Cen
tral -
Rural/S
uburb
an
Survey
5 - S
outh
- Sub
urban
/ Rura
l
Survey
4 - N
orth -
Urba
n / R
ural
Case s
tudy 4
- Nort
h - R
ural
Survey
1 - C
entra
l - Rura
l
Survey
13 - S
outh
- Sub
urban
Survey
12 - S
outh
- Urba
n
Survey
7 - C
entra
l - Rura
l
Survey
6 - S
outh
- Sub
urban
Survey
3 - N
orth -
Rura
l
Survey
15 - S
outh
- Urba
n
Survey
8 - C
entra
l - Urba
n
Survey
14 - S
outh
- Urba
n
Survey
18 - N
orth -
Sub
urban
/ Rura
l
Survey
10 - N
orth -
Sub
urban
Survey
11 - N
orth -
Urba
n
Survey
2 - S
outh
- Rura
l
Survey
16 - S
outh
- Urba
n
Survey
9 - C
entra
l - Urba
n
Survey
17 - S
outh
- Urba
n
One-Stop
"Bus
ines
s - M
ass
Hire
s / J
ob F
airs
" C
ost a
s a
Perc
enta
ge o
f Tot
al O
ne-
Stop
Cos
t
Figure III-25: Activity Cost as a Percentage of Total One-Stop Cost: "Business - Workshops"
0.0%
5.0%
10.0%
15.0%
20.0%
25.0%
30.0%
35.0%
40.0%
Case s
tudy 1
- Sou
th - U
rban
Case s
tudy 2
- Nort
h - S
uburb
an
Case s
tudy 3
- Cen
tral -
Rural/S
uburb
an
Survey
10 - N
orth -
Sub
urban
Survey
11 - N
orth -
Urba
n
Survey
4 - N
orth -
Urba
n / R
ural
Survey
5 - S
outh
- Sub
urban
/ Rura
l
Survey
7 - C
entra
l - Rura
l
Survey
8 - C
entra
l - Urba
n
Case s
tudy 4
- Nort
h - R
ural
Survey
13 - S
outh
- Sub
urban
Survey
12 - S
outh
- Urba
n
Survey
16 - S
outh
- Urba
n
Survey
2 - S
outh
- Rura
l
Survey
18 - N
orth -
Sub
urban
/ Rura
l
Survey
1 - C
entra
l - Rura
l
Survey
9 - C
entra
l - Urba
n
Survey
17 - S
outh
- Urba
n
Survey
14 - S
outh
- Urba
n
Survey
6 - S
outh
- Sub
urban
Survey
15 - S
outh
- Urba
n
Survey
3 - N
orth -
Rura
l
One-Stop
"Bus
ines
s - W
orks
hops
" C
ost a
s a
Perc
enta
ge o
f Tot
al O
ne-S
top
Cos
t
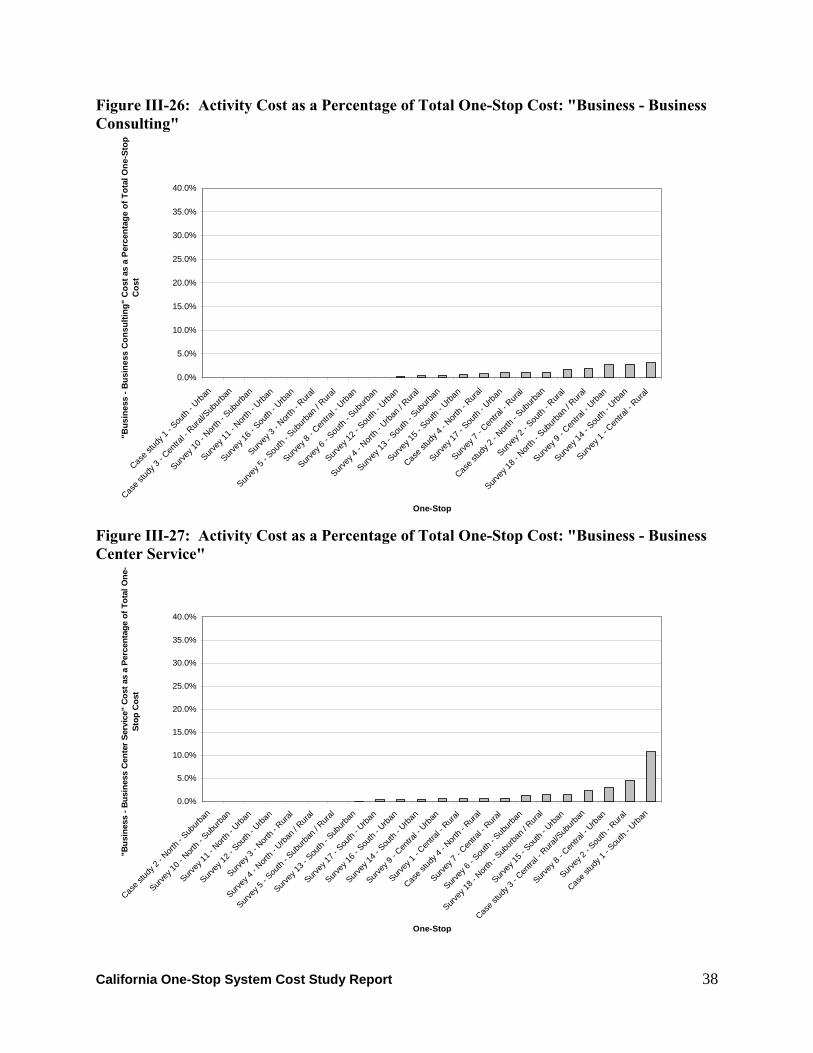
California One-Stop System Cost Study Report
38
Figure III-26: Activity Cost as a Percentage of Total One-Stop Cost: "Business - Business Consulting"
0.0%
5.0%
10.0%
15.0%
20.0%
25.0%
30.0%
35.0%
40.0%
Case s
tudy 1
- Sou
th - U
rban
Case s
tudy 3
- Cen
tral -
Rural/S
uburb
an
Survey
10 - N
orth -
Sub
urban
Survey
11 - N
orth -
Urba
n
Survey
16 - S
outh
- Urba
n
Survey
3 - N
orth -
Rura
l
Survey
5 - S
outh
- Sub
urban
/ Rura
l
Survey
8 - C
entra
l - Urba
n
Survey
6 - S
outh
- Sub
urban
Survey
12 - S
outh
- Urba
n
Survey
4 - N
orth -
Urba
n / R
ural
Survey
13 - S
outh
- Sub
urban
Survey
15 - S
outh
- Urba
n
Case s
tudy 4
- Nort
h - R
ural
Survey
17 - S
outh
- Urba
n
Survey
7 - C
entra
l - Rura
l
Case s
tudy 2
- Nort
h - S
uburb
an
Survey
2 - S
outh
- Rura
l
Survey
18 - N
orth -
Sub
urban
/ Rura
l
Survey
9 - C
entra
l - Urba
n
Survey
14 - S
outh
- Urba
n
Survey
1 - C
entra
l - Rura
l
One-Stop
"Bus
ines
s - B
usin
ess
Con
sulti
ng"
Cos
t as
a Pe
rcen
tage
of T
otal
One
-Sto
p C
ost
Figure III-27: Activity Cost as a Percentage of Total One-Stop Cost: "Business - Business Center Service"
0.0%
5.0%
10.0%
15.0%
20.0%
25.0%
30.0%
35.0%
40.0%
Case s
tudy 2
- Nort
h - S
uburb
an
Survey
10 - N
orth -
Sub
urban
Survey
11 - N
orth -
Urba
n
Survey
12 - S
outh
- Urba
n
Survey
3 - N
orth -
Rura
l
Survey
4 - N
orth -
Urba
n / R
ural
Survey
5 - S
outh
- Sub
urban
/ Rura
l
Survey
13 - S
outh
- Sub
urban
Survey
17 - S
outh
- Urba
n
Survey
16 - S
outh
- Urba
n
Survey
14 - S
outh
- Urba
n
Survey
9 - C
entra
l - Urba
n
Survey
1 - C
entra
l - Rura
l
Case s
tudy 4
- Nort
h - R
ural
Survey
7 - C
entra
l - Rura
l
Survey
6 - S
outh
- Sub
urban
Survey
18 - N
orth -
Sub
urban
/ Rura
l
Survey
15 - S
outh
- Urba
n
Case s
tudy 3
- Cen
tral -
Rural/S
uburb
an
Survey
8 - C
entra
l - Urba
n
Survey
2 - S
outh
- Rura
l
Case s
tudy 1
- Sou
th - U
rban
One-Stop
"Bus
ines
s - B
usin
ess
Cen
ter S
ervi
ce"
Cos
t as
a Pe
rcen
tage
of T
otal
One
-St
op C
ost

California One-Stop System Cost Study Report
39
Figure III-28: Activity Cost as a Percentage of Total One-Stop Cost: "Business - Job Development"
0.0%
5.0%
10.0%
15.0%
20.0%
25.0%
30.0%
35.0%
40.0%
Case s
tudy 4
- Nort
h - R
ural
Survey
5 - S
outh
- Sub
urban
/ Rura
l
Survey
4 - N
orth -
Urba
n / R
ural
Survey
1 - C
entra
l - Rura
l
Survey
7 - C
entra
l - Rura
l
Case s
tudy 2
- Nort
h - Sub
urban
Case s
tudy 1
- Sou
th - U
rban
Survey
18 - N
orth -
Suburb
an / R
ural
Survey
14 - S
outh
- Urba
n
Survey
13 - S
outh
- Sub
urban
Survey
12 - S
outh
- Urba
n
Survey
9 - C
entra
l - Urba
n
Survey
17 - S
outh
- Urba
n
Survey
16 - S
outh
- Urba
n
Survey
2 - S
outh
- Rura
l
Survey
15 - S
outh
- Urba
n
Survey
8 - C
entra
l - Urba
n
Survey
6 - S
outh
- Sub
urban
Case s
tudy 3
- Cen
tral -
Rural/S
uburb
an
Survey
3 - N
orth -
Rura
l
Survey
10 - N
orth -
Suburb
an
Survey
11 - N
orth -
Urba
n
One-Stop
"Bus
ines
s - J
ob D
evel
opm
ent"
Cos
t as
a Pe
rcen
tage
of T
otal
One
-Sto
p C
ost
• Youth Process Costs By Activity
Fifteen of the One-Stops in the sample had a youth process. In those One-Stops, the median percentage of cost accounted for by the youth process was just under 13%. The range was broad, from 3% to 23% of One-Stop total cost. It’s important to note that not every One-Stop with a youth process provided every activity, so data on several activities is limited. “Counseling and Case Management and Supportive Services” was the highest cost activity, with a median cost of 3.5% of One-Stop cost. “Employment Services” and “Follow-up” were the next most costly activities. Table III-4: Youth Activities: Median Percent of One-Stop Costs and Range Activity Median Percent Of
Cost Range of Costs
Employment Services 2.0% 0.9 – 12.6% Counseling, Case Management,
Supportive Services 3.5% 0.2 – 8.6%
College Preparation 0.3% 0.0 – 3.8% Academic Support 0.8% 0.2 – 3.8% Follow-up 1.8% 0.2 – 8.8% All Youth Activities 12.9% 3.3 – 23.3%

California One-Stop System Cost Study Report
40
Figure III-29: Activity Cost as a Percentage of Total One-Stop Cost: "Youth - Employment Services"
0.0%
5.0%
10.0%
15.0%
20.0%
25.0%
30.0%
35.0%
40.0%
Case s
tudy 1
- Sou
th - U
rban
Case s
tudy 3
- Cen
tral -
Rural/S
uburb
an
Case s
tudy 4
- Nort
h - R
ural
Survey
10 - N
orth -
Sub
urban
Survey
11 - N
orth -
Urba
n
Survey
14 - S
outh
- Urba
n
Survey
17 - S
outh
- Urba
n
Survey
12 - S
outh
- Urba
n
Survey
3 - N
orth -
Rura
l
Survey
5 - S
outh
- Sub
urban
/ Rura
l
Survey
8 - C
entra
l - Urba
n
Survey
6 - S
outh
- Sub
urban
Survey
13 - S
outh
- Sub
urban
Survey
2 - S
outh
- Rura
l
Survey
16 - S
outh
- Urba
n
Survey
15 - S
outh
- Urba
n
Case s
tudy 2
- Nort
h - S
uburb
an
Survey
4 - N
orth -
Urba
n / R
ural
Survey
9 - C
entra
l - Urba
n
Survey
18 - N
orth -
Sub
urban
/ Rura
l
Survey
7 - C
entra
l - Rura
l
Survey
1 - C
entra
l - Rura
l
One-Stop
"You
th -
Empl
oym
ent S
ervi
ces"
Cos
t as
a Pe
rcen
tage
of T
otal
One
-Sto
p C
ost
Figure III-30: Activity Cost as a Percentage of Total One-Stop Cost: "Youth - Counseling, Case Management Supportive Services"
0.0%
5.0%
10.0%
15.0%
20.0%
25.0%
30.0%
35.0%
40.0%
Case s
tudy 1
- Sou
th - U
rban
Case s
tudy 3
- Cen
tral -
Rural/S
uburb
an
Case s
tudy 4
- Nort
h - R
ural
Survey
10 - N
orth -
Sub
urban
Survey
11 - N
orth -
Urba
n
Survey
14 - S
outh
- Urba
n
Survey
17 - S
outh
- Urba
n
Survey
4 - N
orth -
Urba
n / R
ural
Survey
12 - S
outh
- Urba
n
Survey
2 - S
outh
- Rura
l
Survey
13 - S
outh
- Sub
urban
Survey
15 - S
outh
- Urba
n
Survey
16 - S
outh
- Urba
n
Survey
8 - C
entra
l - Urba
n
Survey
1 - C
entra
l - Rura
l
Survey
3 - N
orth -
Rura
l
Survey
18 - N
orth -
Sub
urban
/ Rura
l
Survey
6 - S
outh
- Sub
urban
Survey
9 - C
entra
l - Urba
n
Survey
5 - S
outh
- Sub
urban
/ Rura
l
Survey
7 - C
entra
l - Rura
l
Case s
tudy 2
- Nort
h - S
uburb
an
One-Stop
"You
th -
Cou
nsel
ing,
Cas
e M
anag
emen
t Sup
port
ive
Serv
ices
" C
ost a
s a
Perc
enta
ge o
f Tot
al O
ne-S
top
Cos
t

California One-Stop System Cost Study Report
41
Figure III-31: Activity Cost as a Percentage of Total One-Stop Cost: "Youth - College Preparation"
0.0%
5.0%
10.0%
15.0%
20.0%
25.0%
30.0%
35.0%
40.0%
Case s
tudy 1
- Sou
th - U
rban
Case s
tudy 2
- Nort
h - S
uburb
an
Case s
tudy 3
- Cen
tral -
Rural/S
uburb
an
Case s
tudy 4
- Nort
h - R
ural
Survey
1 - C
entra
l - Rura
l
Survey
10 - N
orth -
Sub
urban
Survey
11 - N
orth -
Urba
n
Survey
14 - S
outh
- Urba
n
Survey
15 - S
outh
- Urba
n
Survey
16 - S
outh
- Urba
n
Survey
17 - S
outh
- Urba
n
Survey
2 - S
outh
- Rura
l
Survey
3 - N
orth -
Rura
l
Survey
18 - N
orth -
Sub
urban
/ Rura
l
Survey
7 - C
entra
l - Rura
l
Survey
4 - N
orth -
Urba
n / R
ural
Survey
13 - S
outh
- Sub
urban
Survey
8 - C
entra
l - Urba
n
Survey
12 - S
outh
- Urba
n
Survey
6 - S
outh
- Sub
urban
Survey
5 - S
outh
- Sub
urban
/ Rura
l
Survey
9 - C
entra
l - Urba
n
One-Stop
"You
th -
Col
lege
Pre
para
tion"
Cos
t as
a Pe
rcen
tage
of T
otal
One
-Sto
p C
ost
Figure III-32: Activity Cost as a Percentage of Total One-Stop Cost: "Youth - Academic Support"
0.0%
5.0%
10.0%
15.0%
20.0%
25.0%
30.0%
35.0%
40.0%
Case s
tudy 1
- Sou
th - U
rban
Case s
tudy 2
- Nort
h - S
uburb
an
Case s
tudy 3
- Cen
tral -
Rural/S
uburb
an
Case s
tudy 4
- Nort
h - R
ural
Survey
1 - C
entra
l - Rura
l
Survey
10 - N
orth -
Sub
urban
Survey
11 - N
orth -
Urba
n
Survey
14 - S
outh
- Urba
n
Survey
15 - S
outh
- Urba
n
Survey
16 - S
outh
- Urba
n
Survey
17 - S
outh
- Urba
n
Survey
3 - N
orth -
Rura
l
Survey
4 - N
orth -
Urba
n / R
ural
Survey
13 - S
outh
- Sub
urban
Survey
18 - N
orth -
Sub
urban
/ Rura
l
Survey
12 - S
outh
- Urba
n
Survey
6 - S
outh
- Sub
urban
Survey
5 - S
outh
- Sub
urban
/ Rura
l
Survey
8 - C
entra
l - Urba
n
Survey
7 - C
entra
l - Rura
l
Survey
2 - S
outh
- Rura
l
Survey
9 - C
entra
l - Urba
n
One-Stop
"You
th -
Aca
dem
ic S
uppo
rt"
Cos
t as
a Pe
rcen
tage
of T
otal
One
-Sto
p C
ost

California One-Stop System Cost Study Report
42
Figure III-33: Activity Cost as a Percentage of Total One-Stop Cost: "Youth - Follow-up"
0.0%
5.0%
10.0%
15.0%
20.0%
25.0%
30.0%
35.0%
40.0%
Case s
tudy 1
- Sou
th - U
rban
Case s
tudy 3
- Cen
tral -
Rural/S
uburb
an
Case s
tudy 4
- Nort
h - R
ural
Survey
10 - N
orth -
Sub
urban
Survey
11 - N
orth -
Urba
n
Survey
14 - S
outh
- Urba
n
Survey
15 - S
outh
- Urba
n
Survey
17 - S
outh
- Urba
n
Survey
8 - C
entra
l - Urba
n
Survey
4 - N
orth -
Urba
n / R
ural
Survey
12 - S
outh
- Urba
n
Survey
13 - S
outh
- Sub
urban
Survey
1 - C
entra
l - Rura
l
Survey
3 - N
orth -
Rura
l
Survey
7 - C
entra
l - Rura
l
Survey
18 - N
orth -
Sub
urban
/ Rura
l
Survey
9 - C
entra
l - Urba
n
Case s
tudy 2
- Nort
h - S
uburb
an
Survey
2 - S
outh
- Rura
l
Survey
6 - S
outh
- Sub
urban
Survey
5 - S
outh
- Sub
urban
/ Rura
l
Survey
16 - S
outh
- Urba
n
One-Stop
"You
th -
Follo
w-u
p" C
ost a
s a
Perc
enta
ge o
f Tot
al O
ne-S
top
Cos
t
What do partners contribute to the operation of the One-Stop and how does the pattern vary between sites? One-Stops were designed to bring together a host of federal, state and local programs. Despite this grand vision of service integration, funding sources flow from a variety of distinct pipelines. In our experience, One-Stops generally do not have an integrated budgeting or accounting system. We had to ask each partner to estimate the fully loaded cost of their activities under the One-Stop’s roof in order to calculate partner contributions at each site. Here, we analyze how much partners contributed and what activities those contributions supported in each One-Stop. In determining the amount of partner contributions, it is important to note that different partners have different relationships to the One-Stop. Some partners such as EDD Job Service Division have missions that are closely aligned with One-Stops’ missions, and one might expect to see a lot of joint activity under the One-Stop roof. Other partners such as local housing authorities have missions only tangentially related to One-Stops’ missions and one might not expect to see them play a major role in the One-Stop. Similarly, some partners may provide valuable support to the One-Stop and valuable services to clients, but if they do so away from the physical One-Stop they are not included in our calculations. We want to be very clear in stating that we have not attempted to make, nor have we made, any judgment as to whether or not partners should make contribution “under the roof” of the One-Stop. Our purpose here is simply to describe what partners contributed under the roof of the One-Stops we studied, not to evaluate whether the partner contributions should have been larger or smaller or somehow different.
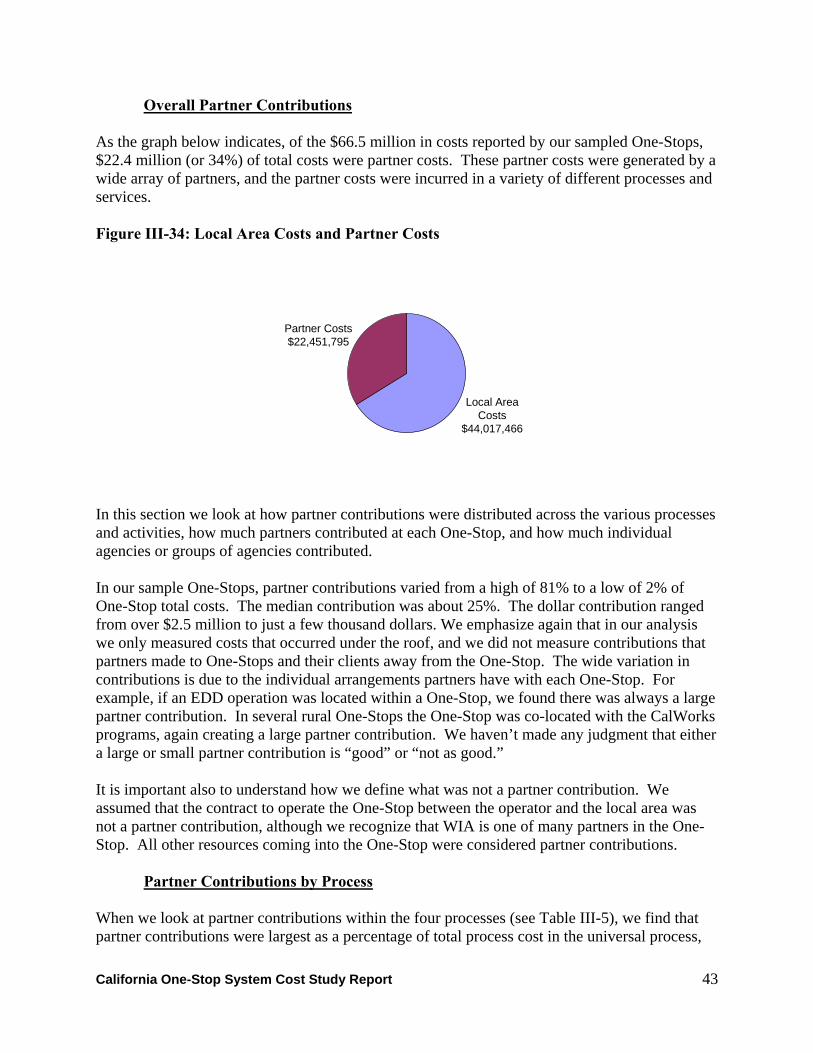
California One-Stop System Cost Study Report
43
Overall Partner Contributions As the graph below indicates, of the $66.5 million in costs reported by our sampled One-Stops, $22.4 million (or 34%) of total costs were partner costs. These partner costs were generated by a wide array of partners, and the partner costs were incurred in a variety of different processes and services. Figure III-34: Local Area Costs and Partner Costs
Local Area Costs
$44,017,466
Partner Costs$22,451,795
In this section we look at how partner contributions were distributed across the various processes and activities, how much partners contributed at each One-Stop, and how much individual agencies or groups of agencies contributed. In our sample One-Stops, partner contributions varied from a high of 81% to a low of 2% of One-Stop total costs. The median contribution was about 25%. The dollar contribution ranged from over $2.5 million to just a few thousand dollars. We emphasize again that in our analysis we only measured costs that occurred under the roof, and we did not measure contributions that partners made to One-Stops and their clients away from the One-Stop. The wide variation in contributions is due to the individual arrangements partners have with each One-Stop. For example, if an EDD operation was located within a One-Stop, we found there was always a large partner contribution. In several rural One-Stops the One-Stop was co-located with the CalWorks programs, again creating a large partner contribution. We haven’t made any judgment that either a large or small partner contribution is “good” or “not as good.” It is important also to understand how we define what was not a partner contribution. We assumed that the contract to operate the One-Stop between the operator and the local area was not a partner contribution, although we recognize that WIA is one of many partners in the One-Stop. All other resources coming into the One-Stop were considered partner contributions.
Partner Contributions by Process When we look at partner contributions within the four processes (see Table III-5), we find that partner contributions were largest as a percentage of total process cost in the universal process,

California One-Stop System Cost Study Report
44
with partner contributions accounting for a median of about 35% of total universal costs. From our field work we know that many partners come into One-Stops and offer services in the resource room to universal clients, thus generating this relatively large contribution in the universal process. EDD is the largest partner by far, and the bulk of the EDD contribution is in the universal process. Table III-5: Partner Contributions as a Percentage of Process Costs: Median Percent of One-Stop Costs and Range Activity Median Percent Of
Cost Range of Costs
Universal Process 34.8% 3.0 – 94.4% Enrolled Process 24.5% 1.3 – 78.1% Business Process 7.2% 0.0 – 100.0% Youth Process 22.4% 0.0 – 100.0% Total One-Stop Costs 25.6% 4.4 – 81.1% Enrolled services was next highest in terms of partner contribution percentage, with a median partner contribution of 24.5% of total enrolled services cost. Partner contributions to enrolled services tended to be large when the One-Stop had other large enrolled programs under the roof, such as a CalWorks program or a large Trade Adjustment Act program managed by EDD. At a number of One-Stops, youth services were often provided primarily by a partner, and thus there are some sites where the partner contribution was 100% of youth costs. It may be that the local area contracted separately for youth services and then located that contractor in the One-Stop, rather than contracting with the agency that operated the One-Stop for youth services. Business services had the lowest median partner contribution, just 7.2% of total business services cost. In many One-Stops, business services were a relatively small operation, with most services being delivered by a few One-Stop staff, with few partners. Below we display the partner contributions overall and by process in both percentage and dollar terms, and by sites to show the full distribution of contributions.

California One-Stop System Cost Study Report
45
Figure III-35: Total Dollar Partner Contribution by One-Stop
$0
$250,000
$500,000
$750,000
$1,000,000
$1,250,000
$1,500,000
$1,750,000
$2,000,000
$2,250,000
$2,500,000
$2,750,000
Survey
10 - N
orth -
Suburb
an
Survey
5 - S
outh
- Subu
rban / R
ural
Survey
8 - Cen
tral -
Urban
Survey 1
6 - Sou
th - U
rban
Survey 2
- South
- Rura
l
Survey
17 - S
outh
- Urba
n
Survey 1
1 - N
orth -
Urba
n
Survey 1
4 - Sou
th - U
rban
Survey 1
5 - Sou
th - U
rban
Survey
4 - Nort
h - U
rban / R
ural
Survey
18 - N
orth -
Suburb
an / R
ural
Case st
udy 1
- Sou
th - U
rban
Case st
udy 3
- Cen
tral -
Rural/S
uburb
an
Case s
tudy 2
- Nort
h - Sub
urban
Survey 3
- Nort
h - R
ural
Survey 6
- South
- Sub
urban
Survey
9 - C
entra
l - Urba
n
Survey
7 - Cen
tral -
Rural
Survey
1 - C
entra
l - Rura
l
Survey 1
3 - Sou
th - S
uburb
an
Case st
udy 4
- Nort
h - R
ural
Survey 1
2 - Sou
th - U
rban
One-Stop
Tota
l Par
tner
Con
trib
utio
n
Figure III-36: Percent of Total Costs Contributed By Partners By One-Stop
0.0%
10.0%
20.0%
30.0%
40.0%
50.0%
60.0%
70.0%
80.0%
90.0%
100.0%
Survey
5 - S
outh
- Sub
urban
/ Rura
l
Survey
8 - C
entra
l - Urba
n
Survey
10 - N
orth -
Sub
urban
Survey
16 - S
outh
- Urba
n
Case s
tudy 2
- Nort
h - S
uburb
an
Survey
17 - S
outh
- Urba
n
Survey
14 - S
outh
- Urba
n
Survey
2 - S
outh
- Rura
l
Survey
4 - N
orth -
Urba
n / R
ural
Survey
9 - C
entra
l - Urba
n
Survey
15 - S
outh
- Urba
n
Case s
tudy 3
- Cen
tral -
Rural/S
uburb
an
Case s
tudy 1
- Sou
th - U
rban
Survey
11 - N
orth -
Urba
n
Survey
6 - S
outh
- Sub
urban
Survey
18 - N
orth -
Sub
urban
/ Rura
l
Survey
1 - C
entra
l - Rura
l
Survey
13 - S
outh
- Sub
urban
Survey
7 - C
entra
l - Rura
l
Survey
12 - S
outh
- Urba
n
Case s
tudy 4
- Nort
h - R
ural
Survey
3 - N
orth -
Rura
l
One-Stop
Tota
l Par
tner
Con
trib
utio
n as
a P
erce
ntag
eof
One
-Sto
p To
tal C
ost
Here we show the full distribution of costs in both dollar and percentage terms that partners contributed to each of the four processes.
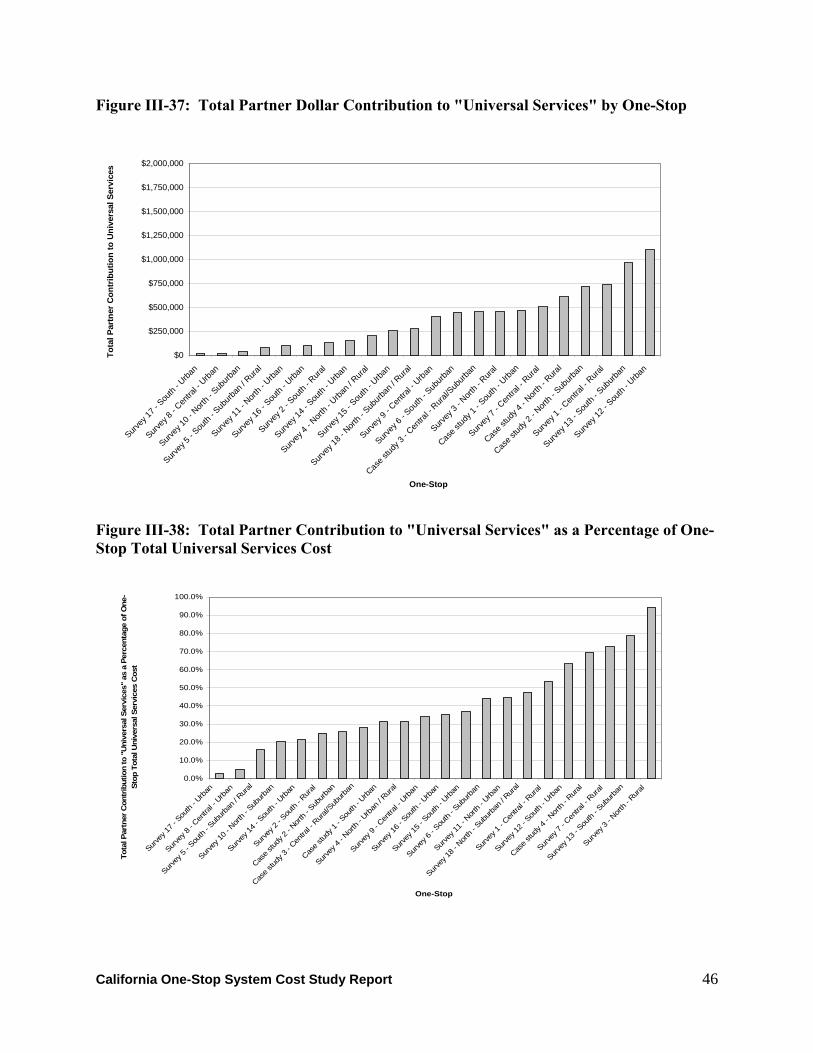
California One-Stop System Cost Study Report
46
Figure III-37: Total Partner Dollar Contribution to "Universal Services" by One-Stop
$0
$250,000
$500,000
$750,000
$1,000,000
$1,250,000
$1,500,000
$1,750,000
$2,000,000
Survey
17 - S
outh
- Urba
n
Survey
8 - C
entra
l - Urba
n
Survey
10 - N
orth -
Sub
urban
Survey
5 - S
outh
- Sub
urban
/ Rura
l
Survey
11 - N
orth -
Urba
n
Survey
16 - S
outh
- Urba
n
Survey
2 - S
outh
- Rura
l
Survey
14 - S
outh
- Urba
n
Survey
4 - N
orth -
Urba
n / R
ural
Survey
15 - S
outh
- Urba
n
Survey
18 - N
orth -
Sub
urban
/ Rura
l
Survey
9 - C
entra
l - Urba
n
Survey
6 - S
outh
- Sub
urban
Case s
tudy 3
- Cen
tral -
Rural/S
uburb
an
Survey
3 - N
orth -
Rura
l
Case s
tudy 1
- Sou
th - U
rban
Survey
7 - C
entra
l - Rura
l
Case s
tudy 4
- Nort
h - R
ural
Case s
tudy 2
- Nort
h - S
uburb
an
Survey
1 - C
entra
l - Rura
l
Survey
13 - S
outh
- Sub
urban
Survey
12 - S
outh
- Urba
n
One-Stop
Tota
l Par
tner
Con
trib
utio
n to
Uni
vers
al S
ervi
ces
Figure III-38: Total Partner Contribution to "Universal Services" as a Percentage of One-Stop Total Universal Services Cost
0.0%
10.0%
20.0%
30.0%
40.0%
50.0%
60.0%
70.0%
80.0%
90.0%
100.0%
Surve
y 17 -
Sou
th - U
rban
Surve
y 8 - C
entra
l - Urb
an
Surve
y 5 - S
outh
- Sub
urban
/ Rur
al
Survey
10 - N
orth -
Sub
urban
Surve
y 14 -
Sou
th - U
rban
Survey
2 - S
outh
- Rura
l
Case s
tudy 2
- Nor
th - S
ubur
ban
Case s
tudy 3
- Cen
tral -
Rural/S
uburb
an
Case s
tudy 1
- Sou
th - U
rban
Surve
y 4 - N
orth -
Urb
an / R
ural
Surve
y 9 - C
entra
l - Urb
an
Surve
y 16 -
Sou
th - U
rban
Surve
y 15 -
Sou
th - U
rban
Surve
y 6 - S
outh
- Sub
urban
Surve
y 11 -
Nort
h - U
rban
Survey
18 - N
orth -
Sub
urban
/ Rur
al
Surve
y 1 - C
entra
l - Rur
al
Surve
y 12 -
Sou
th - U
rban
Case s
tudy 4
- Nort
h - R
ural
Surve
y 7 - C
entra
l - Rur
al
Surve
y 13 -
Sou
th - S
uburb
an
Survey
3 - N
orth -
Rur
al
One-Stop
Tota
l Par
tner
Con
trib
utio
n to
"U
nive
rsal
Ser
vice
s" a
s a
Perc
enta
ge o
f One
-St
op T
otal
Uni
vers
al S
ervi
ces
Cos
t

California One-Stop System Cost Study Report
47
Figure III-39: Total Partner Dollar Contribution to "Enrolled Services" by One-Stop
$0
$250,000
$500,000
$750,000
$1,000,000
$1,250,000
$1,500,000
$1,750,000
$2,000,000
Survey
5 - S
outh
- Sub
urban
/ Rura
l
Survey
10 - N
orth -
Sub
urban
Survey
16 - S
outh
- Urba
n
Survey
8 - C
entra
l - Urba
n
Survey
2 - S
outh
- Rura
l
Survey
11 - N
orth -
Urba
n
Survey
15 - S
outh
- Urba
n
Survey
14 - S
outh
- Urba
n
Survey
18 - N
orth -
Sub
urban
/ Rura
l
Survey
17 - S
outh
- Urba
n
Survey
4 - N
orth -
Urba
n / R
ural
Case s
tudy 3
- Cen
tral -
Rural/S
uburb
an
Case s
tudy 1
- Sou
th - U
rban
Survey
3 - N
orth -
Rura
l
Survey
6 - S
outh
- Sub
urban
Case s
tudy 2
- Nort
h - S
uburb
an
Survey
7 - C
entra
l - Rura
l
Survey
1 - C
entra
l - Rura
l
Survey
9 - C
entra
l - Urba
n
Survey
13 - S
outh
- Sub
urban
Survey
12 - S
outh
- Urba
n
Case s
tudy 4
- Nort
h - R
ural
One-Stop
Tota
l Par
tner
Con
trib
utio
n to
Enr
olle
d Se
rvic
es
Figure III-40: Total Partner Contribution to "Enrolled Services" as a Percentage of One-Stop Total Enrolled Services Cost
0.0%
10.0%
20.0%
30.0%
40.0%
50.0%
60.0%
70.0%
80.0%
90.0%
100.0%
Survey
5 - S
outh
- Sub
urban
/ Rura
l
Survey
10 - N
orth -
Sub
urban
Survey
16 - S
outh
- Urba
n
Case s
tudy 2
- Nort
h - S
uburb
an
Survey
8 - C
entra
l - Urba
n
Survey
4 - N
orth -
Urba
n / R
ural
Survey
11 - N
orth -
Urba
n
Survey
6 - S
outh
- Sub
urban
Case s
tudy 3
- Cen
tral -
Rural/S
uburb
an
Survey
14 - S
outh
- Urba
n
Case s
tudy 1
- Sou
th - U
rban
Survey
15 - S
outh
- Urba
n
Survey
9 - C
entra
l - Urba
n
Survey
2 - S
outh
- Rura
l
Survey
18 - N
orth -
Sub
urban
/ Rura
l
Survey
1 - C
entra
l - Rura
l
Survey
17 - S
outh
- Urba
n
Survey
7 - C
entra
l - Rura
l
Survey
13 - S
outh
- Sub
urban
Survey
3 - N
orth -
Rura
l
Case s
tudy 4
- Nort
h - R
ural
Survey
12 - S
outh
- Urba
n
One-Stop
Tota
l Par
tner
Con
trib
utio
n to
"En
rolle
d Se
rvic
es"
as a
Per
cent
age
of O
ne-
Stop
Tot
al E
nrol
led
Serv
ices
Cos
t

California One-Stop System Cost Study Report
48
Figure III-41: Total Partner Contribution to "Business Services" by One-Stop
$0
$250,000
$500,000
$750,000
$1,000,000
$1,250,000
$1,500,000
$1,750,000
$2,000,000
Survey
5 - S
outh
- Sub
urban
/ Rura
l
Survey
7 - C
entra
l - Rura
l
Survey
8 - C
entra
l - Urba
n
Survey
2 - S
outh
- Rura
l
Survey
15 - S
outh
- Urba
n
Survey
1 - C
entra
l - Rura
l
Survey
14 - S
outh
- Urba
n
Survey
16 - S
outh
- Urba
n
Survey
4 - N
orth -
Urba
n / R
ural
Case s
tudy 4
- Nort
h - R
ural
Survey
17 - S
outh
- Urba
n
Case s
tudy 2
- Nort
h - S
uburb
an
Survey
10 - N
orth -
Sub
urban
Survey
18 - N
orth -
Sub
urban
/ Rura
l
Survey
11 - N
orth -
Urba
n
Survey
13 - S
outh
- Sub
urban
Case s
tudy 1
- Sou
th - U
rban
Survey
12 - S
outh
- Urba
n
Case s
tudy 3
- Cen
tral -
Rural/S
uburb
an
Survey
3 - N
orth -
Rura
l
Survey
9 - C
entra
l - Urba
n
Survey
6 - S
outh
- Sub
urban
One-Stop
Tota
l Par
tner
Con
trib
utio
n to
Bus
ines
s Se
rvic
es
Figure III-42: Total Partner Contribution to "Business Services" as a Percentage of One-Stop Total Business Services Cost
0.0%
10.0%
20.0%
30.0%
40.0%
50.0%
60.0%
70.0%
80.0%
90.0%
100.0%
Survey
5 - S
outh
- Sub
urban
/ Rura
l
Survey
7 - C
entra
l - Rura
l
Survey
8 - C
entra
l - Urba
n
Survey
2 - S
outh
- Rura
l
Survey
15 - S
outh
- Urba
n
Survey
1 - C
entra
l - Rura
l
Case s
tudy 2
- Nort
h - S
uburb
an
Survey
14 - S
outh
- Urba
n
Survey
16 - S
outh
- Urba
n
Survey
17 - S
outh
- Urba
n
Survey
4 - N
orth -
Urba
n / R
ural
Survey
10 - N
orth -
Sub
urban
Survey
18 - N
orth -
Sub
urban
/ Rura
l
Case s
tudy 4
- Nort
h - R
ural
Case s
tudy 1
- Sou
th - U
rban
Case s
tudy 3
- Cen
tral -
Rural/S
uburb
an
Survey
11 - N
orth -
Urba
n
Survey
9 - C
entra
l - Urba
n
Survey
13 - S
outh
- Sub
urban
Survey
6 - S
outh
- Sub
urban
Survey
12 - S
outh
- Urba
n
Survey
3 - N
orth -
Rura
l
One-Stop
Tota
l Par
tner
Con
trib
utio
n to
"B
usin
ess
Serv
ices
" as
a P
erce
ntag
e of
One
-St
op T
otal
Bus
ines
s Se
rvic
es C
ost

California One-Stop System Cost Study Report
49
Figure III-43: Total Partner Contribution to "Youth Services" by One-Stop
$0
$250,000
$500,000
$750,000
$1,000,000
$1,250,000
$1,500,000
$1,750,000
$2,000,000
Case s
tudy 2
- Nort
h - S
uburb
an
Survey
5 - S
outh
- Sub
urban
/ Rura
l
Survey
8 - C
entra
l - Urba
n
Survey
6 - S
outh
- Sub
urban
Survey
9 - C
entra
l - Urba
n
Survey
15 - S
outh
- Urba
n
Survey
16 - S
outh
- Urba
n
Survey
2 - S
outh
- Rura
l
Survey
12 - S
outh
- Urba
n
Survey
13 - S
outh
- Sub
urban
Survey
3 - N
orth -
Rura
l
Survey
4 - N
orth -
Urba
n / R
ural
Survey
18 - N
orth -
Sub
urban
/ Rura
l
Survey
7 - C
entra
l - Rura
l
Survey
1 - C
entra
l - Rura
l
Case s
tudy 1
- Sou
th - U
rban
Case s
tudy 3
- Cen
tral -
Rural/S
uburb
an
Case s
tudy 4
- Nort
h - R
ural
Survey
10 - N
orth -
Suburb
an
Survey
11 - N
orth -
Urba
n
Survey
14 - S
outh
- Urba
n
Survey
17 - S
outh
- Urba
n
One-Stop
Tota
l Par
tner
Con
trib
utio
n to
You
th S
ervi
ces
Figure III-44: Total Partner Contribution to "Youth Services" as a Percentage of One-Stop Total Youth Services Cost
0.0%
10.0%
20.0%
30.0%
40.0%
50.0%
60.0%
70.0%
80.0%
90.0%
100.0%
Case s
tudy 2
- Nort
h - S
uburb
an
Survey
5 - S
outh
- Sub
urban
/ Rura
l
Survey
8 - C
entra
l - Urba
n
Survey
9 - C
entra
l - Urba
n
Survey
6 - S
outh
- Sub
urban
Survey
16 - S
outh
- Urba
n
Survey
15 - S
outh
- Urba
n
Survey
2 - S
outh
- Rura
l
Survey
12 - S
outh
- Urba
n
Survey
13 - S
outh
- Sub
urban
Survey
4 - N
orth -
Urba
n / R
ural
Survey
1 - C
entra
l - Rura
l
Survey
3 - N
orth -
Rura
l
Survey
7 - C
entra
l - Rura
l
Survey
18 - N
orth -
Sub
urban
/ Rura
l
Case s
tudy 1
- Sou
th - U
rban
Case s
tudy 3
- Cen
tral -
Rural/S
uburb
an
Case s
tudy 4
- Nort
h - R
ural
Survey
10 - N
orth -
Sub
urban
Survey
11 - N
orth -
Urba
n
Survey
14 - S
outh
- Urba
n
Survey
17 - S
outh
- Urba
n
One-Stop
Tota
l Par
tner
Con
trib
utio
n to
"Yo
uth
Serv
ices
" as
a P
erce
ntag
e of
One
-St
op T
otal
You
th S
ervi
ces
Cos
t

California One-Stop System Cost Study Report
50
Specific Partner Contributions The next aspect of partnership we examined was the contribution of specific partners or types of partners. To do this, we identified federal and state agencies that appeared in our sample One-Stops, such as the Department of Rehabilitation and EDD. We put local partners such as local adult education agencies together as a group, as well. The figure below shows the number of sites in which each agency made a measurable contribution. EDD was by far the most common partner, appearing in 20 our f 22 One-Stops, followed by a variety of local programs ranging from Goodwill to local tribal councils to housing associations. The Department of Rehabilitation was active in 14 sites. Community Colleges or other higher education institutions were found in about half the sites. Local educational agencies and local adult education programs each were found in fewer than 10 One-Stops. Figure III-45: Number of One-Stops Served by Partners
0
2
4
6
8
10
12
14
16
18
20
22
Veterans
Admin.
ABLESBDC
AARP
Aging a
nd Adu
lt
Job C
orps
HHSA
Loca
l Adult
Schoo
l
Other L
ocal S
chool
Loca
l Colle
ge / U
nivers
ity DOR
Other Lo
cal P
artne
rsEDD
Partner
Num
ber o
f One
-Sto
ps S
erve
d by
Par
tner

California One-Stop System Cost Study Report
51
The dollar contributions of partners shed more light on these relationships. We looked at dollar contributions from two different angles. First we looked at the actual dollar value of contributions and next as a percentage of total One-Stop costs. Again EDD is by far the largest contributor to One-Stops, with costs of over $12 million in the 22 One-Stops studied. The next largest group of partners was the mixed local agencies which contributed slightly less than $4 million. Health and Human Service Agencies, including many local CalWorks programs contributed over $2 million in costs. No other partner contributed even $1 million across all the 22 sample sites. Figure III-46: Total Partner Contribution for All One-Stops in the Sample
$0
$2,000,000
$4,000,000
$6,000,000
$8,000,000
$10,000,000
$12,000,000
$14,000,000
Veteran
s Adm
in.AARP
SBDC
Job C
orps
ABLE
Aging a
nd Adu
lt
Loca
l Adu
lt Sch
ool
DOR
Loca
l Coll
ege /
Univ
ersity
Other L
ocal
Schoo
l
HHSA
Other L
ocal
Partne
rsEDD
Partner Type
Part
ner C
ontr
ibut
ion
to O
ne-S
top
Cos
ts
Looking at these contributions as a percent of the total $66.5 million in our sampled One-Stops' costs, we see that EDD accounted for almost 20% of all the costs in the sampled One-Stops. The next largest contribution was 6% by a mixed group of local agencies. Health and Human services accounted for almost 4% of total costs, while all other partners accounted for less than 2% of total costs.

California One-Stop System Cost Study Report
52
Figure III- 47: Partner Contributions as a Percent of All One-Stop Costs
0.0%
2.0%
4.0%
6.0%
8.0%
10.0%
12.0%
14.0%
16.0%
18.0%
20.0%
Veteran
s Adm
in.
AARPSBDC
Job C
orps
ABLE
Aging a
nd A
dult
Loca
l Adu
lt Sch
ool
DOR
Loca
l Coll
ege /
Univ
ersity
Other L
ocal
Schoo
l
HHSA
Other L
ocal
Partne
rsEDD
Partner Type
Part
ner C
ontr
ibut
ion
as a
Per
cent
age
of O
ne-S
top
Cos
ts
In the following figures, we show the contribution of key partners to each of the survey sites in dollar amount to illustrate how costs varied across the sites.
Figure III-48: Partner Contribution by One-Stop: EDD
$0
$500,000
$1,000,000
$1,500,000
$2,000,000
$2,500,000
Survey
5 - S
outh
- Sub
urban
/ Rura
l
Survey
17 - S
outh
- Urba
n
Survey
10 - N
orth -
Sub
urban
Survey
16 - S
outh
- Urba
n
Survey
14 - S
outh
- Urba
n
Survey
11 - N
orth -
Urba
n
Survey
4 - N
orth -
Urba
n / R
ural
Survey
18 - N
orth -
Sub
urban
/ Rura
l
Survey
7 - C
entra
l - Rura
l
Survey
15 - S
outh
- Urba
n
Case s
tudy 4
- Nort
h - R
ural
Case s
tudy 3
- Cen
tral -
Rural/S
uburb
an
Case s
tudy 1
- Sou
th - U
rban
Survey
13 - S
outh
- Sub
urban
Survey
9 - C
entra
l - Urba
n
Survey
3 - N
orth -
Rura
l
Case s
tudy 2
- Nort
h - S
uburb
an
Survey
1 - C
entra
l - Rura
l
Survey
6 - S
outh
- Sub
urban
Survey
12 - S
outh
- Urba
n
One-Stop
EDD
Con
trib
utio
n

California One-Stop System Cost Study Report
53
Figure III-49: Partner Contribution by One-Stop: Partners Not Otherwise Categorized
$0
$500,000
$1,000,000
$1,500,000
$2,000,000
$2,500,000
Survey 1
0 - N
orth -
Suburb
an
Case s
tudy 2
- Nort
h - Sub
urban
Survey 3
- Nort
h - R
ural
Survey
16 - S
outh
- Urba
n
Survey
11 - N
orth -
Urba
n
Survey
14 - S
outh
- Urba
n
Survey
5 - S
outh
- Sub
urban
/ Rura
l
Survey
9 - C
entra
l - Urba
n
Survey
8 - C
entra
l - Urba
n
Survey 6
- Sou
th - S
uburba
n
Survey
4 - N
orth -
Urba
n / R
ural
Survey
2 - S
outh - R
ural
Case s
tudy 4
- Nort
h - R
ural
Survey
13 - S
outh
- Sub
urban
Survey 1
- Cen
tral -
Rural
Case s
tudy 3
- Cen
tral -
Rural/S
uburb
an
Survey
12 - S
outh
- Urba
n
Survey
18 - N
orth -
Suburb
an / R
ural
Survey
7 - C
entra
l - Rura
l
One-Stop
Con
trib
utio
n by
Oth
er P
artn
ers
Figure III-50: Partner Contribution by One-Stop: Health and Human Services Agency (HHSA)
$2,236$91,500
$134,310$212,116
$372,572
$1,719,219
$0
$200,000
$400,000
$600,000
$800,000
$1,000,000
$1,200,000
$1,400,000
$1,600,000
Survey 3 - North -Rural
Case study 3 -Central -
Rural/Suburban
Survey 1 - Central -Rural
Survey 4 - North -Urban / Rural
Survey 13 - South -Suburban
Case study 4 - North- Rural
One-Stop
HH
SA C
ontr
ibut
ion

California One-Stop System Cost Study Report
54
Figure III-51: Partner Contribution by One-Stop: Local College or University
$1,461$20,404 $23,850
$34,500$44,880
$56,200
$129,333 $138,674
$198,940
$0
$50,000
$100,000
$150,000
$200,000
$250,000
$300,000
$350,000
$400,000
$450,000
$500,000
Survey 3 -North - Rural
Survey 7 -Central -
Rural
Survey 15 -South - Urban
Survey 14 -South - Urban
Survey 4 -North - Urban
/ Rural
Survey 12 -South - Urban
Survey 17 -South - Urban
Survey 9 -Central -
Urban
Survey 13 -South -
Suburban
One-Stop
Loca
l Col
lege
or U
nive
rsity
Con
trib
utio
n
Figure III-52: Partner Contribution by One-Stop: Department of Rehabilitation
$5,069 $5,677 $10,138 $10,138 $11,485 $12,189 $16,220 $18,951 $20,275 $20,276 $25,641 $30,413 $32,465 $42,191
$0
$50,000
$100,000
$150,000
$200,000
$250,000
$300,000
$350,000
$400,000
$450,000
$500,000
Survey 7
- Cen
tral -
Rural
Survey
2 - S
outh
- Rura
l
Case s
tudy 1
- Sou
th - U
rban
Case st
udy 4
- Nort
h - R
ural
Survey
12 - S
outh
- Urba
n
Survey
6 - S
outh
- Subu
rban
Survey 9
- Cen
tral -
Urban
Survey
13 - Sou
th - S
uburb
an
Survey
14 - Sou
th - U
rban
Survey
10 - N
orth -
Suburb
an
Survey 4
- Nort
h - U
rban / R
ural
Case st
udy 3
- Cen
tral -
Rural/S
uburba
n
Survey
1 - C
entra
l - Rura
l
Case st
udy 2
- Nort
h - Sub
urban
One-Stop
Dep
artm
ent o
f Reh
abili
tatio
n C
ontr
ibut
ion

California One-Stop System Cost Study Report
55
Figure III-53: Partner Contribution by One-Stop: Local Adult School
$9,200$21,679 $23,460 $25,200 $29,321
$149,000
$0
$50,000
$100,000
$150,000
$200,000
$250,000
$300,000
$350,000
$400,000
$450,000
$500,000
Case study 2 - North- Suburban
Survey 8 - Central -Urban
Survey 1 - Central -Rural
Survey 10 - North -Suburban
Survey 7 - Central -Rural
Case study 1 - South- Urban
One-Stop
Loca
l Adu
lt Sc
hool
Con
trib
utio
n
What do different One-Stop services cost to produce and how do costs vary between sites? How much service do One-Stops produce and how does volume vary by site?
A key objective of our study was to develop some “cost per unit” measures for One-Stops to better understand their cost structures and to begin to develop some measures of efficiency that managers could use to improve. Most industries have standardized cost per unit measures, auto companies know the cost per car produced, airlines know the cost per passenger mile flown, public libraries know the cost of purchasing and shelving a new book and colleges know the cost per enrolled student. Knowing these “cost-pers” allows organizations to compare their performance to other similar organizations and track their performance over time, and identify areas where improvement is needed. In this section we make the first effort to define and measure cost per unit of service produced in One-Stops. Because this is a first effort, we attempted to measure everything we could. Over time, through feedback and discussion, we expect the field will arrive at a limited number of cost per unit of service measures which will become standard management indicators recognized and used throughout the system.
We have organized our measures around the four processes as we have other sections.
Universal Services
Universal services accounted for about 25% of the costs in One-Stops surveyed. These services are open to anyone who walks into a One-Stop. In theory, Universal services are provided on a

California One-Stop System Cost Study Report
56
self-service basis, but much like the public library, many clients need help and One-Stops provide it by providing orientations on how to use the available services. Most sites provide some One-on-one coaching, such as reviewing resumes or help with computers, and most One-Stops provide various workshops which may serve both universal and enrolled clients. From our case study experience we found that there were two key cost per-unit measures for universal services: cost per universal client and cost per universal visit. The median cost per universal client was $166, with a range of $33 to $554. The cost per client visit clustered around $40 per visit, with a few outliers at higher and lower costs. This relatively tight clustering in cost per universal access visit is not surprising in retrospect, as we found in our case studies that most universal access processes deliver roughly the same types of services, and hence might be expected to have similar cost structure. The variance in cost per client is explained by the average number of visits made by clients. As we see in the figure below, the average number of visits by clients varies from one to twelve. Obviously clients who visit many times on average will cost more to service than clients who come a few times. The management insight here is that managing the number of client visits is a way to manage universal costs. Table III-6: Universal Services: Median Cost and Range Of Cost Per-Unit of Service and Range Unit of Service Median Cost Per Range Per Universal Client $166 $33 - $554 Per Universal Visit $41 $8 - $146 Per Universal Service Event $8 $2 - $30 Per Coaching and 1-on-1 assistance
Event $20 $6 - 145
Per Client Orientated to One-Stop $34 $8 - $308 Per Workshop $942 $135 - $5,838 Per Client Attending Workshop $118 $23 - $612 Per Attendee at Job Club or Networking Event
$61 $10 - $318
Within the universal process we were able to cost some additional activities, the median cost of a self-service event was only $8, median cost of orienting a new client to universal services was $34, while coaching clients in universal services had a median cost of $20 per coaching event. Workshops had a median cost of $942 per workshop and a median cost of $118 per attendee. The substantial range in workshop costs is driven largely by the length of the workshop which could be one hour or several days, and the number of clients attending. Most One-Stops have job clubs or other types of networking activities where job seekers meet and help each other search for employment and build skills. Only a few survey sites could provide data on this activity. Most of these activities are run by volunteers and require little staff assistance but the median cost is still $61 per attendee at an event.

California One-Stop System Cost Study Report
57
In the next section we present the complete cost distributions the universal services produced in most One-Stops, which we could measure. In most cases there are a substantial range of costs which are driven in part by the number of clients who receive the service, so we have included the volume of service produced by each One-Stop and matched it with the costs Figure III-54: Total Cost per Universal Client
$0
$100
$200
$300
$400
$500
$600
Survey
10 - N
orth -
Sub
urban
Survey
3 - N
orth -
Rura
l
Survey
11 -
North -
Urba
n
Survey
15 -
South
- Urba
n
Survey
14 -
South
- Urba
n
Survey
16 -
South
- Urba
n
Survey
1 - C
entra
l - Rur
al
Survey
8 - C
entra
l - Urb
an
Survey
18 -
North -
Sub
urba
n / R
ural
Survey
4 - N
orth -
Urba
n / R
ural
Survey
9 - C
entra
l - Urb
an
Survey
17 -
South
- Urba
n
Survey
2 - S
outh
- Rura
l
Survey
13 -
South
- Sub
urban
Case s
tudy 1
- Sou
th - U
rban
Survey
7 - C
entra
l - Rur
al
Survey
6 - S
outh
- Sub
urba
n
Survey
5 - S
outh
- Sub
urba
n / R
ural
Case s
tudy 2
- Nort
h - S
uburb
an
Case s
tudy 4
- Nort
h - R
ural
Survey
12 -
South
- Urba
n
Case s
tudy 3
- Cen
tral -
Rural/S
ubur
ban
One-Stop
Tota
l Cos
t per
Uni
vers
al C
lient
Figure III-55: Total Number of Unique Universal Clients
0
2,000
4,000
6,000
8,000
10,000
12,000
14,000
16,000
Survey
12 - S
outh
- Urba
n
Survey
5 - S
outh
- Sub
urba
n / R
ural
Case s
tudy 4
- Nort
h - R
ural
Survey
2 - S
outh
- Rura
l
Survey
7 - C
entra
l - Rura
l
Survey
6 - S
outh
- Sub
urban
Survey
16 - S
outh
- Urba
n
Survey
17 - S
outh
- Urba
n
Survey
8 - C
entra
l - Urba
n
Survey
18 -
North -
Sub
urban
/ Rura
l
Survey
4 - N
orth -
Urba
n / R
ural
Survey
10 - N
orth -
Sub
urban
Survey
13 - S
outh
- Sub
urban
Survey
11 - N
orth -
Urba
n
Survey
9 - C
entra
l - Urba
n
Case s
tudy 1
- Sou
th - U
rban
Case s
tudy 2
- Nort
h - S
uburb
an
Survey
14 - S
outh
- Urba
n
Survey
15 - S
outh
- Urba
n
Survey
3 - N
orth -
Rura
l
Survey
1 - C
entra
l - Rura
l
Case s
tudy 3
- Cen
tral -
Rural/S
ubur
ban
One-Stop
Num
ber o
f Uni
que
Uni
vers
al C
lient
s

California One-Stop System Cost Study Report
58
Figure III-56: Total Cost per Universal Visit
$0
$20
$40
$60
$80
$100
$120
$140
$160
Survey
11 - N
orth -
Urba
n
Survey
10 - N
orth -
Suburb
an
Survey
16 - S
outh
- Urba
n
Survey
15 - S
outh
- Urba
n
Survey
3 - N
orth -
Rura
l
Survey
9 - C
entra
l - Urba
n
Survey
2 - S
outh
- Rura
l
Survey
4 - N
orth -
Urba
n / R
ural
Survey
6 - S
outh - S
uburba
n
Survey
5 - S
outh
- Sub
urban
/ Rura
l
Case s
tudy 1
- Sou
th - U
rban
Survey
8 - C
entra
l - Urba
n
Survey
18 - N
orth -
Suburb
an / R
ural
Case s
tudy 4
- Nort
h - R
ural
Survey
17 - S
outh
- Urba
n
Case s
tudy 2
- Nort
h - Sub
urban
Survey
1 - C
entra
l - Rura
l
Survey
14 - S
outh
- Urba
n
Case s
tudy 3
- Cen
tral -
Rural/S
uburb
an
Survey
7 - C
entra
l - Rura
l
Survey
12 - S
outh
- Urba
n
Survey
13 - S
outh
- Sub
urban
One-Stop
Tota
l Cos
t per
Uni
vers
al V
isit
Figure III-57: Total Number of Universal Visits
0
10,000
20,000
30,000
40,000
50,000
60,000
Survey
7 - C
entra
l - Rura
l
Survey
8 - C
entra
l - Urba
n
Survey
12 - S
outh
- Urba
n
Survey
14 - S
outh
- Urba
n
Survey
5 - S
outh
- Sub
urban
/ Rura
l
Survey
18 - N
orth -
Suburb
an / R
ural
Survey
17 - S
outh
- Urba
n
Survey
16 - S
outh
- Urba
n
Survey
2 - S
outh
- Rura
l
Case s
tudy 4
- Nort
h - R
ural
Survey
4 - N
orth -
Urba
n / R
ural
Survey
10 - N
orth -
Suburb
an
Survey
6 - S
outh
- Sub
urban
Survey
1 - C
entra
l - Rura
l
Case s
tudy 3
- Cen
tral -
Rural/S
uburb
an
Survey
3 - N
orth -
Rura
l
Survey
11 - N
orth -
Urba
n
Case s
tudy 1
- Sou
th - U
rban
Survey
15 - S
outh
- Urba
n
Survey
9 - C
entra
l - Urba
n
Case s
tudy 2
- Nort
h - Sub
urban
Survey
13 - S
outh
- Sub
urban
One-Stop
Num
ber o
f Uni
vers
al V
isits

California One-Stop System Cost Study Report
59
Figure III-58: Average Number of Visits per Universal Client
0
2
4
6
8
10
12
14
Survey
14 - S
outh
- Urba
n
Survey
1 - C
entra
l - Rura
l
Survey
3 - N
orth -
Rura
l
Survey
7 - C
entra
l - Rura
l
Survey
8 - C
entra
l - Urba
n
Survey
18 - N
orth -
Sub
urban
/ Rura
l
Survey
10 - N
orth -
Sub
urban
Survey
17 - S
outh
- Urba
n
Survey
15 - S
outh
- Urba
n
Survey
4 - N
orth -
Urba
n / R
ural
Survey
16 - S
outh
- Urba
n
Survey
11 - N
orth -
Urba
n
Case s
tudy 1
- Sou
th - U
rban
Survey
6 - S
outh
- Sub
urban
Survey
2 - S
outh
- Rura
l
Survey
9 - C
entra
l - Urba
n
Case s
tudy 2
- Nort
h - S
uburb
an
Survey
5 - S
outh
- Sub
urban
/ Rura
l
Case s
tudy 4
- Nort
h - R
ural
Survey
12 - S
outh
- Urba
n
Case s
tudy 3
- Cen
tral -
Rural/S
uburb
an
Survey
13 - S
outh
- Sub
urban
One-Stop
Num
ber o
f Vis
its P
er U
nive
rsal
Clie
nt

California One-Stop System Cost Study Report
60
Figure III-59: Cost per Self-Service Activity: Universal Service Event (e.g. fax a resume, access career information on internet)
$0.00
$5.00
$10.00
$15.00
$20.00
$25.00
$30.00
Survey
2 - S
outh
- Rura
l
Case s
tudy 1
- Sou
th - U
rban
Survey
10 - N
orth -
Sub
urban
Survey
3 - N
orth -
Rura
l
Survey
15 - S
outh
- Urba
n
Survey
11 - N
orth -
Urba
n
Survey
16 - S
outh
- Urba
n
Survey
18 - N
orth -
Sub
urban
/ Rura
l
Survey
12 - S
outh
- Urba
n
Survey
9 - C
entra
l - Urba
n
Survey
14 - S
outh
- Urba
n
Survey
17 - S
outh
- Urba
n
Case s
tudy 2
- Nort
h - S
uburb
an
Case s
tudy 4
- Nort
h - R
ural
Survey
5 - S
outh
- Sub
urban
/ Rura
l
Survey
1 - C
entra
l - Rura
l
Survey
6 - S
outh
- Sub
urban
Survey
7 - C
entra
l - Rura
l
Survey
8 - C
entra
l - Urba
n
Survey
4 - N
orth -
Urba
n / R
ural
Survey
13 - S
outh
- Sub
urban
Case s
tudy 3
- Cen
tral -
Rural/S
uburb
an
One-Stop
Cos
t per
Uni
vers
al S
ervi
ce E
vent
(e.g
. fax
a re
sum
e, a
cces
s ca
reer
in
form
atio
n on
inte
rnet
)
Figure III-60: Volume of Universal Service Events (e.g. faxed a resume, accessed career information on internet)
0
20,000
40,000
60,000
80,000
100,000
120,000
140,000
Survey
5 - S
outh
- Sub
urban
/ Rura
l
Survey
8 - C
entra
l - Urba
n
Survey
17 - S
outh
- Urba
n
Survey
14 - S
outh
- Urba
n
Survey
10 - N
orth -
Sub
urban
Survey
7 - C
entra
l - Rura
l
Case s
tudy 4
- Nort
h - R
ural
Survey
6 - S
outh
- Sub
urban
Survey
16 - S
outh
- Urba
n
Survey
18 - N
orth -
Sub
urban
/ Rura
l
Survey
11 - N
orth -
Urba
n
Survey
1 - C
entra
l - Rura
l
Survey
2 - S
outh
- Rura
l
Survey
3 - N
orth -
Rura
l
Survey
9 - C
entra
l - Urba
n
Case s
tudy 1
- Sou
th - U
rban
Case s
tudy 2
- Nort
h - S
uburb
an
Survey
15 - S
outh
- Urba
n
Survey
12 - S
outh
- Urba
n
Survey
13 - S
outh
- Sub
urban
Survey
4 - N
orth -
Urba
n / R
ural
Case s
tudy 3
- Cen
tral -
Rural/S
uburb
an
One-Stop
Num
ber o
f Uni
vers
al S
ervi
ce E
vent
s (e
.g. f
axed
a re
sum
e, a
cces
sed
care
er
info
rmat
ion
on in
tern
et)

California One-Stop System Cost Study Report
61
Figure III-61: Cost per Universal One-on-one Coaching Event
$0.00
$20.00
$40.00
$60.00
$80.00
$100.00
$120.00
$140.00
$160.00
Survey
14 - S
outh
- Urba
n
Survey
17 - S
outh
- Urba
n
Survey
15 - S
outh
- Urba
n
Survey
6 - S
outh
- Sub
urban
Survey
5 - S
outh
- Sub
urban
/ Rura
l
Survey
11 - N
orth -
Urba
n
Survey
3 - N
orth -
Rura
l
Survey
10 - N
orth -
Suburb
an
Survey
16 - S
outh
- Urba
n
Survey
12 - S
outh
- Urba
n
Survey
18 - N
orth -
Sub
urban
/ Rura
l
Case s
tudy 1
- Sou
th - U
rban
Survey
1 - C
entra
l - Rura
l
Case s
tudy 2
- Nort
h - S
uburb
an
Survey
7 - C
entra
l - Rura
l
Case s
tudy 3
- Cen
tral -
Rural/S
uburb
an
Survey
2 - S
outh
- Rura
l
Survey
9 - C
entra
l - Urba
n
Survey
4 - N
orth -
Urba
n / R
ural
Survey
8 - C
entra
l - Urba
n
Survey
13 - S
outh
- Sub
urban
Case s
tudy 4
- Nort
h - R
ural
One-Stop
Cos
t per
One
-on-
one
Coa
chin
g Ev
ent
Figure III-62: Volume of Universal One-on-one Coaching Events
0
5,000
10,000
15,000
20,000
25,000
30,000
Survey 7
- Cen
tral -
Rural
Survey 2
- South
- Rura
l
Survey 9
- Cen
tral -
Urban
Survey 1
0 - N
orth -
Suburb
an
Survey
16 - Sou
th - U
rban
Survey 1
1 - N
orth -
Urba
n
Survey 1
8 - N
orth -
Suburb
an / R
ural
Survey
14 - S
outh
- Urba
n
Case s
tudy 3
- Cen
tral -
Rural/S
uburb
an
Survey 3
- Nort
h - R
ural
Survey
5 - South
- Subu
rban /
Rura
l
Survey
17 - Sou
th - U
rban
Survey
6 - Sou
th - S
uburba
n
Survey
1 - Cen
tral -
Rural
Case st
udy 2
- Nort
h - Sub
urban
Case st
udy 1
- Sou
th - U
rban
Survey 1
5 - Sou
th - U
rban
Survey 1
2 - Sou
th - U
rban
Survey
13 - S
outh
- Sub
urban
Survey 4
- Nort
h - U
rban /
Rural
Survey 8
- Cen
tral -
Urban
Case s
tudy 4
- Nort
h - R
ural
One-Stop
Uni
vers
al -
Num
ber o
f Tim
es O
ne-o
n-on
e C
oach
ing
Even
ts O
ccur

California One-Stop System Cost Study Report
62
Figure III-63: Cost per New Universal Client
$0.00
$50.00
$100.00
$150.00
$200.00
$250.00
$300.00
$350.00
Survey
10 - N
orth -
Suburb
an
Survey
13 - S
outh
- Sub
urban
Survey
11 - N
orth -
Urba
n
Survey
15 - S
outh
- Urba
n
Survey
7 - C
entra
l - Rura
l
Survey
1 - C
entra
l - Rura
l
Survey
16 - S
outh
- Urba
n
Survey
4 - N
orth -
Urba
n / R
ural
Survey
8 - C
entra
l - Urba
n
Survey
14 - S
outh
- Urba
n
Survey
3 - N
orth -
Rura
l
Survey
18 - N
orth -
Sub
urban
/ Rura
l
Survey
2 - S
outh
- Rura
l
Survey
6 - S
outh
- Sub
urban
Survey
9 - C
entra
l - Urba
n
Survey
17 - S
outh
- Urba
n
Survey
5 - S
outh
- Sub
urban
/ Rura
l
Case s
tudy 1
- Sou
th - U
rban
Case s
tudy 3
- Cen
tral -
Rural/S
uburb
an
Survey
12 - S
outh
- Urba
n
Case s
tudy 2
- Nort
h - S
uburb
an
Case s
tudy 4
- Nort
h - R
ural
One-Stop
Cos
t per
New
Uni
vers
al C
lient
Figure III-64: Volume of New Universal Clients
0
2,000
4,000
6,000
8,000
10,000
12,000
Survey
12 - S
outh
- Urba
n
Survey
5 - S
outh
- Sub
urban
/ Rura
l
Case s
tudy 1
- Sou
th - U
rban
Survey
11 - N
orth -
Urba
n
Survey
2 - S
outh
- Rura
l
Survey
9 - C
entra
l - Urba
n
Survey
10 - N
orth -
Sub
urban
Survey
4 - N
orth -
Urba
n / R
ural
Case s
tudy 3
- Cen
tral -
Rural/S
uburb
an
Survey
7 - C
entra
l - Rura
l
Survey
6 - S
outh
- Sub
urban
Survey
18 - N
orth -
Sub
urban
/ Rura
l
Survey
14 - S
outh
- Urba
n
Survey
16 - S
outh
- Urba
n
Survey
17 - S
outh
- Urba
n
Survey
3 - N
orth -
Rura
l
Survey
8 - C
entra
l - Urba
n
Survey
1 - C
entra
l - Rura
l
Case s
tudy 2
- Nort
h - Sub
urban
Survey
13 - S
outh
- Sub
urban
Survey
15 - S
outh
- Urba
n
Case s
tudy 4
- Nort
h - R
ural
One-Stop
Num
ber o
f New
Uni
vers
al C
lient
s
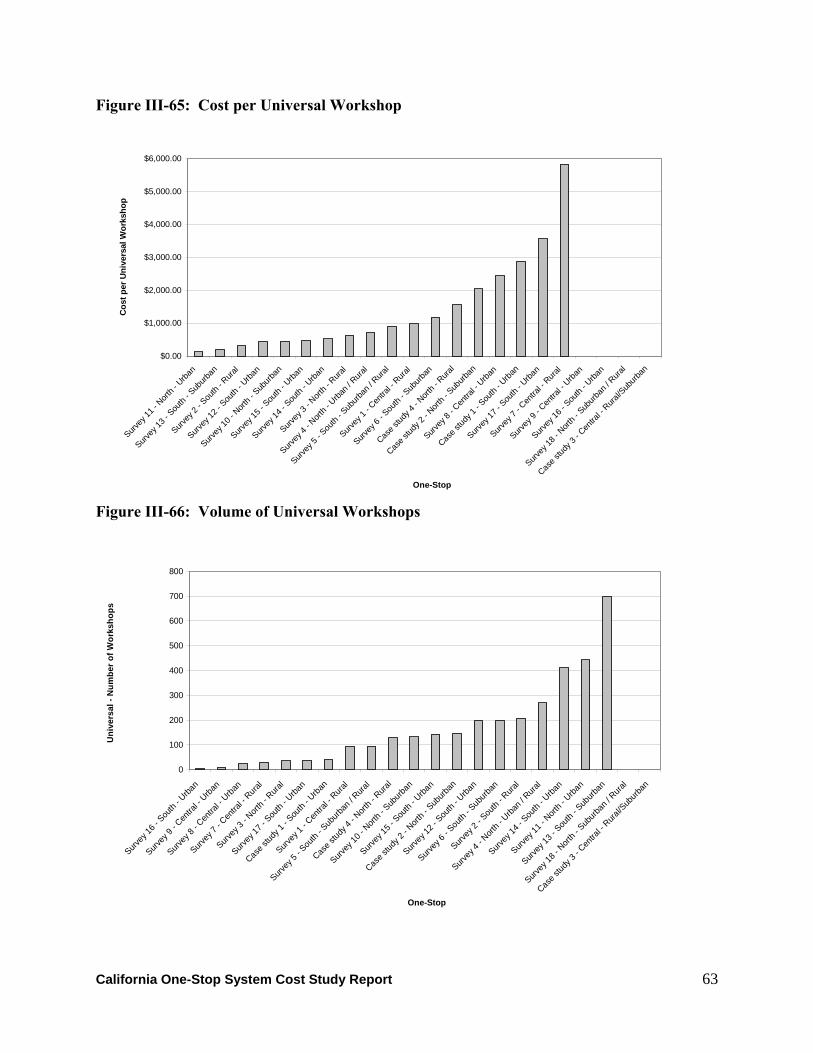
California One-Stop System Cost Study Report
63
Figure III-65: Cost per Universal Workshop
$0.00
$1,000.00
$2,000.00
$3,000.00
$4,000.00
$5,000.00
$6,000.00
Survey
11 - N
orth -
Urba
n
Survey
13 - S
outh
- Sub
urban
Survey
2 - S
outh
- Rura
l
Survey
12 - S
outh
- Urba
n
Survey
10 - N
orth -
Sub
urban
Survey
15 - S
outh
- Urba
n
Survey
14 - S
outh
- Urba
n
Survey
3 - N
orth -
Rura
l
Survey
4 - N
orth -
Urba
n / R
ural
Survey
5 - S
outh
- Sub
urban
/ Rura
l
Survey
1 - C
entra
l - Rura
l
Survey
6 - S
outh
- Sub
urban
Case s
tudy 4
- Nort
h - R
ural
Case s
tudy 2
- Nort
h - S
uburb
an
Survey
8 - C
entra
l - Urba
n
Case s
tudy 1
- Sou
th - U
rban
Survey
17 - S
outh
- Urba
n
Survey
7 - C
entra
l - Rura
l
Survey
9 - C
entra
l - Urba
n
Survey
16 - S
outh
- Urba
n
Survey
18 - N
orth -
Sub
urban
/ Rura
l
Case s
tudy 3
- Cen
tral -
Rural/S
uburb
an
One-Stop
Cos
t per
Uni
vers
al W
orks
hop
Figure III-66: Volume of Universal Workshops
0
100
200
300
400
500
600
700
800
Survey
16 - S
outh
- Urba
n
Survey
9 - C
entra
l - Urba
n
Survey
8 - C
entra
l - Urba
n
Survey
7 - C
entra
l - Rura
l
Survey
3 - N
orth -
Rura
l
Survey
17 - S
outh
- Urba
n
Case s
tudy 1
- Sou
th - U
rban
Survey
1 - C
entra
l - Rura
l
Survey
5 - S
outh
- Sub
urban
/ Rura
l
Case s
tudy 4
- Nort
h - R
ural
Survey
10 - N
orth -
Sub
urban
Survey
15 - S
outh
- Urba
n
Case s
tudy 2
- Nort
h - Sub
urban
Survey
12 - S
outh
- Urba
n
Survey
6 - S
outh
- Sub
urban
Survey
2 - S
outh
- Rura
l
Survey
4 - N
orth -
Urba
n / R
ural
Survey
14 - S
outh
- Urba
n
Survey
11 - N
orth -
Urba
n
Survey
13 - S
outh
- Sub
urban
Survey
18 - N
orth -
Sub
urban
/ Rura
l
Case s
tudy 3
- Cen
tral -
Rural/S
uburb
an
One-Stop
Uni
vers
al -
Num
ber o
f Wor
ksho
ps
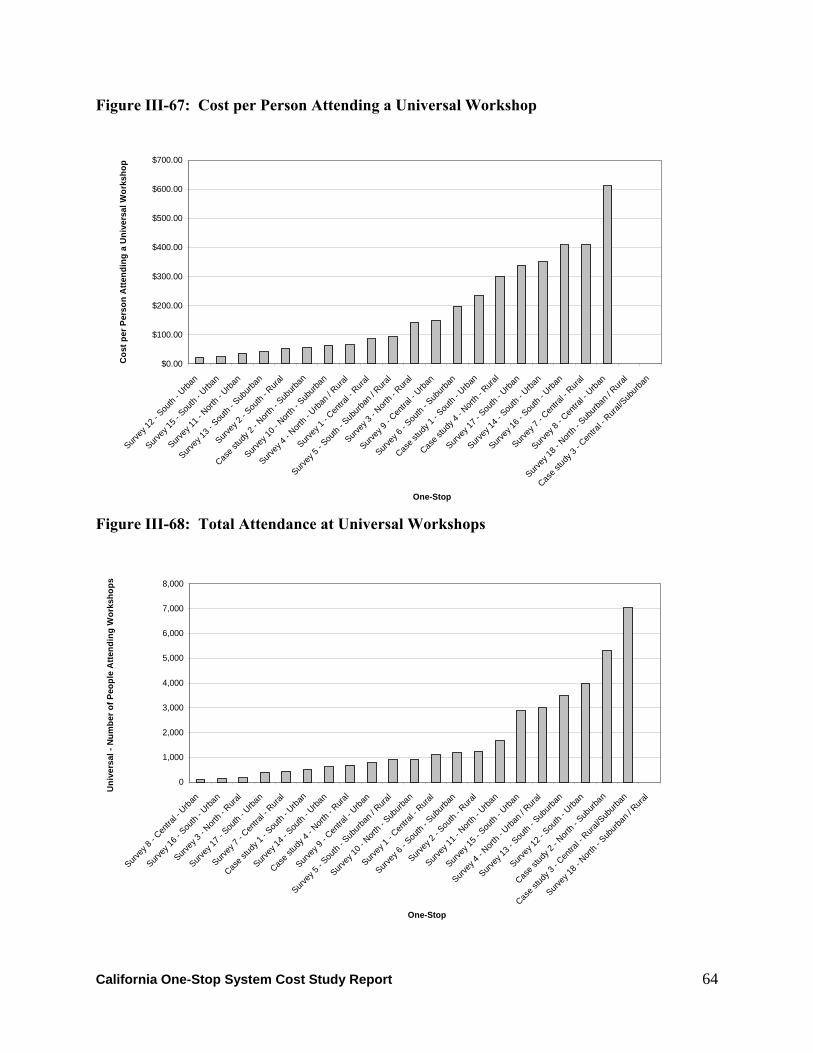
California One-Stop System Cost Study Report
64
Figure III-67: Cost per Person Attending a Universal Workshop
$0.00
$100.00
$200.00
$300.00
$400.00
$500.00
$600.00
$700.00
Survey
12 - S
outh
- Urba
n
Survey
15 - S
outh
- Urba
n
Survey
11 - N
orth -
Urba
n
Survey
13 - S
outh
- Sub
urban
Survey
2 - S
outh
- Rura
l
Case s
tudy 2
- Nort
h - S
uburb
an
Survey
10 - N
orth -
Suburb
an
Survey
4 - N
orth -
Urba
n / R
ural
Survey
1 - C
entra
l - Rura
l
Survey
5 - S
outh
- Sub
urban
/ Rura
l
Survey
3 - N
orth -
Rura
l
Survey
9 - C
entra
l - Urba
n
Survey
6 - S
outh
- Sub
urban
Case s
tudy 1
- Sou
th - U
rban
Case s
tudy 4
- Nort
h - R
ural
Survey
17 - S
outh
- Urba
n
Survey
14 - S
outh
- Urba
n
Survey
16 - S
outh
- Urba
n
Survey
7 - C
entra
l - Rura
l
Survey
8 - C
entra
l - Urba
n
Survey
18 - N
orth -
Sub
urban
/ Rura
l
Case s
tudy 3
- Cen
tral -
Rural/S
uburb
an
One-Stop
Cos
t per
Per
son
Atte
ndin
g a
Uni
vers
al W
orks
hop
Figure III-68: Total Attendance at Universal Workshops
0
1,000
2,000
3,000
4,000
5,000
6,000
7,000
8,000
Survey
8 - C
entra
l - Urba
n
Survey
16 - S
outh
- Urba
n
Survey
3 - N
orth -
Rura
l
Survey
17 - S
outh
- Urba
n
Survey
7 - C
entra
l - Rura
l
Case s
tudy 1
- Sou
th - U
rban
Survey
14 - S
outh
- Urba
n
Case s
tudy 4
- Nort
h - R
ural
Survey
9 - C
entra
l - Urba
n
Survey
5 - S
outh
- Sub
urban
/ Rura
l
Survey
10 - N
orth -
Sub
urban
Survey
1 - C
entra
l - Rura
l
Survey
6 - S
outh
- Sub
urban
Survey
2 - S
outh
- Rura
l
Survey
11 - N
orth -
Urba
n
Survey
15 - S
outh
- Urba
n
Survey
4 - N
orth -
Urba
n / R
ural
Survey
13 - S
outh
- Sub
urban
Survey
12 - S
outh
- Urba
n
Case s
tudy 2
- Nort
h - Sub
urban
Case s
tudy 3
- Cen
tral -
Rural/S
uburb
an
Survey
18 - N
orth -
Sub
urban
/ Rura
l
One-Stop
Uni
vers
al -
Num
ber o
f Peo
ple
Atte
ndin
g W
orks
hops

California One-Stop System Cost Study Report
65
Figure III-69: Cost per Universal Job Club or Network Attendee
$0.00
$50.00
$100.00
$150.00
$200.00
$250.00
$300.00
$350.00
Survey
8 - C
entra
l - Urba
n
Case s
tudy 4
- Nort
h - R
ural
Survey
15 - S
outh
- Urba
n
Survey
6 - S
outh
- Sub
urban
Survey
5 - S
outh
- Sub
urban
/ Rura
l
Survey
3 - N
orth -
Rura
l
Survey
4 - N
orth -
Urba
n / R
ural
Case s
tudy 2
- Nort
h - S
uburb
an
Survey
14 - S
outh
- Urba
n
Survey
9 - C
entra
l - Urba
n
Survey
17 - S
outh
- Urba
n
Survey
1 - C
entra
l - Rura
l
Survey
2 - S
outh
- Rura
l
Survey
7 - C
entra
l - Rura
l
Survey
10 - N
orth -
Suburb
an
Survey
11 - N
orth -
Urba
n
Survey
12 - S
outh
- Urba
n
Survey
13 - S
outh
- Sub
urban
Survey
16 - S
outh
- Urba
n
Case s
tudy 1
- Sou
th - U
rban
Case s
tudy 3
- Cen
tral -
Rural/S
uburb
an
Survey
18 - N
orth -
Sub
urban
/ Rura
l
One-Stop
Cos
t per
Uni
vers
al J
ob C
lub
or N
etw
ork
Atte
ndee
Figure III-70: Volume of Universal Job Club or Network Attendance
0
500
1,000
1,500
2,000
2,500
3,000
3,500
4,000
Survey
17 - S
outh
- Urba
n
Survey
3 - N
orth -
Rura
l
Survey
5 - S
outh
- Sub
urban
/ Rura
l
Survey
4 - N
orth -
Urba
n / R
ural
Survey
9 - C
entra
l - Urba
n
Case s
tudy 4
- Nort
h - R
ural
Survey
14 - S
outh
- Urba
n
Survey
6 - S
outh
- Sub
urban
Survey
18 - N
orth -
Sub
urban
/ Rura
l
Survey
15 - S
outh
- Urba
n
Case s
tudy 2
- Nort
h - S
uburb
an
Survey
8 - C
entra
l - Urba
n
Survey
1 - C
entra
l - Rura
l
Survey
10 - N
orth -
Suburb
an
Survey
11 - N
orth -
Urba
n
Survey
12 - S
outh
- Urba
n
Survey
13 - S
outh
- Sub
urban
Survey
16 - S
outh
- Urba
n
Survey
2 - S
outh
- Rura
l
Survey
7 - C
entra
l - Rura
l
Case s
tudy 1
- Sou
th - U
rban
Case s
tudy 3
- Cen
tral -
Rural/S
uburb
an
One-Stop
Uni
vers
al -
Tota
l Job
Clu
b or
Net
wor
k A
ttend
ance
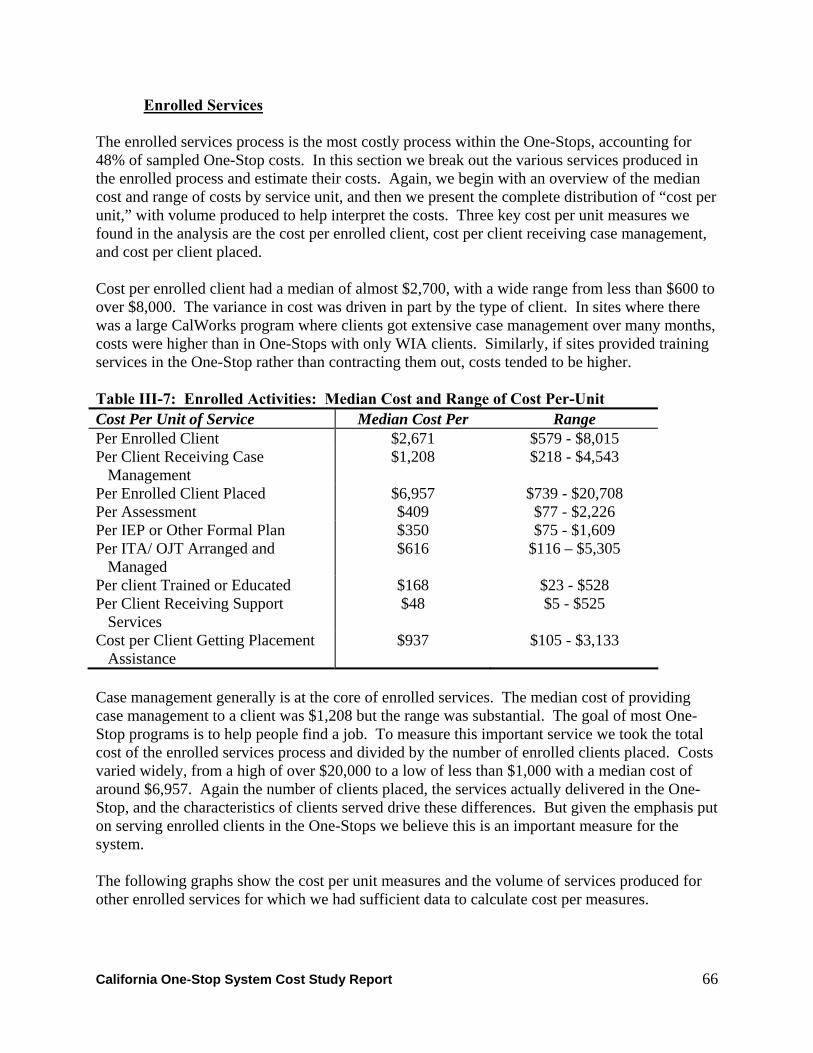
California One-Stop System Cost Study Report
66
Enrolled Services
The enrolled services process is the most costly process within the One-Stops, accounting for 48% of sampled One-Stop costs. In this section we break out the various services produced in the enrolled process and estimate their costs. Again, we begin with an overview of the median cost and range of costs by service unit, and then we present the complete distribution of “cost per unit,” with volume produced to help interpret the costs. Three key cost per unit measures we found in the analysis are the cost per enrolled client, cost per client receiving case management, and cost per client placed. Cost per enrolled client had a median of almost $2,700, with a wide range from less than $600 to over $8,000. The variance in cost was driven in part by the type of client. In sites where there was a large CalWorks program where clients got extensive case management over many months, costs were higher than in One-Stops with only WIA clients. Similarly, if sites provided training services in the One-Stop rather than contracting them out, costs tended to be higher. Table III-7: Enrolled Activities: Median Cost and Range of Cost Per-Unit Cost Per Unit of Service Median Cost Per Range Per Enrolled Client $2,671 $579 - $8,015 Per Client Receiving Case
Management $1,208 $218 - $4,543
Per Enrolled Client Placed $6,957 $739 - $20,708 Per Assessment $409 $77 - $2,226 Per IEP or Other Formal Plan $350 $75 - $1,609 Per ITA/ OJT Arranged and
Managed $616 $116 – $5,305
Per client Trained or Educated $168 $23 - $528 Per Client Receiving Support
Services $48 $5 - $525
Cost per Client Getting Placement Assistance
$937 $105 - $3,133
Case management generally is at the core of enrolled services. The median cost of providing case management to a client was $1,208 but the range was substantial. The goal of most One-Stop programs is to help people find a job. To measure this important service we took the total cost of the enrolled services process and divided by the number of enrolled clients placed. Costs varied widely, from a high of over $20,000 to a low of less than $1,000 with a median cost of around $6,957. Again the number of clients placed, the services actually delivered in the One-Stop, and the characteristics of clients served drive these differences. But given the emphasis put on serving enrolled clients in the One-Stops we believe this is an important measure for the system. The following graphs show the cost per unit measures and the volume of services produced for other enrolled services for which we had sufficient data to calculate cost per measures.

California One-Stop System Cost Study Report
67
Figure III-71: Cost per Enrolled Client
$0
$1,000
$2,000
$3,000
$4,000
$5,000
$6,000
$7,000
$8,000
$9,000
Survey
2 - S
outh
- Rura
l
Survey
8 - C
entra
l - Urba
n
Case s
tudy 3
- Cen
tral -
Rural/S
uburb
an
Case s
tudy 4
- Nort
h - R
ural
Survey
17 - S
outh
- Urba
n
Survey
7 - C
entra
l - Rura
l
Survey
9 - C
entra
l - Urba
n
Survey
3 - N
orth -
Rura
l
Survey
16 - S
outh
- Urba
n
Survey
15 - S
outh
- Urba
n
Survey
11 - N
orth -
Urba
n
Survey
14 - S
outh
- Urba
n
Survey
4 - N
orth -
Urba
n / R
ural
Survey
10 - N
orth -
Sub
urban
Case s
tudy 1
- Sou
th - U
rban
Survey
5 - S
outh
- Sub
urban
/ Rura
l
Survey
18 - N
orth -
Sub
urban
/ Rura
l
Survey
13 - S
outh
- Sub
urban
Survey
6 - S
outh
- Sub
urban
Survey
12 - S
outh
- Urba
n
Survey
1 - C
entra
l - Rura
l
Case s
tudy 2
- Nort
h - S
uburb
an
One-Stop
Tota
l Cos
t per
Enr
olle
d C
lient
Figure III-72: Cost per Client Receiving Case Management
$0
$500
$1,000
$1,500
$2,000
$2,500
$3,000
$3,500
$4,000
$4,500
$5,000
Case s
tudy 3
- Cen
tral -
Rural/S
uburb
an
Survey
2 - S
outh
- Rura
l
Case s
tudy 4
- Nort
h - R
ural
Survey
8 - C
entra
l - Urba
n
Survey
16 - S
outh
- Urba
n
Survey
3 - N
orth -
Rura
l
Survey
9 - C
entra
l - Urba
n
Survey
17 - S
outh
- Urba
n
Survey
7 - C
entra
l - Rura
l
Survey
15 - S
outh
- Urba
n
Survey
14 - S
outh
- Urba
n
Survey
11 - N
orth -
Urba
n
Survey
4 - N
orth -
Urba
n / R
ural
Survey
10 - N
orth -
Sub
urban
Survey
18 - N
orth -
Sub
urban
/ Rura
l
Survey
5 - S
outh
- Sub
urban
/ Rura
l
Survey
12 - S
outh
- Urba
n
Case s
tudy 1
- Sou
th - U
rban
Survey
13 - S
outh
- Sub
urban
Survey
6 - S
outh
- Sub
urban
Survey
1 - C
entra
l - Rura
l
Case s
tudy 2
- Nort
h - S
uburb
an
One-Stop
Tota
l Cos
t per
Clie
nt R
ecei
ving
Cas
e M
anag
emen
t

California One-Stop System Cost Study Report
68
Figure III-73: Volume of Enrolled Clients Receiving Case Management
0
200
400
600
800
1,000
1,200
1,400
1,600
1,800
Survey 1
8 - N
orth -
Suburba
n / R
ural
Survey 1
0 - N
orth -
Suburb
an
Survey 1
2 - Sou
th - U
rban
Survey
11 - N
orth -
Urba
n
Survey 5
- Sou
th - S
uburba
n / Rura
l
Survey 1
6 - Sou
th - U
rban
Survey
6 - S
outh - S
uburba
n
Survey 1
5 - Sou
th - U
rban
Survey 1
4 - Sou
th - U
rban
Case st
udy 1
- Sou
th - U
rban
Survey
3 - Nort
h - R
ural
Survey 1
3 - Sou
th - S
uburb
an
Survey 1
7 - Sou
th - U
rban
Survey 4
- Nort
h - U
rban /
Rural
Survey
8 - Cen
tral -
Urban
Survey
2 - S
outh - R
ural
Survey 7
- Cen
tral -
Rural
Case s
tudy 3
- Cen
tral -
Rural/S
uburba
n
Survey 9
- Cen
tral -
Urban
Case st
udy 4
- Nort
h - R
ural
Survey 1
- Cen
tral -
Rural
Case s
tudy 2
- Nort
h - Sub
urban
One-Stop
Enro
lled
- Num
ber o
f Clie
nts
Rec
eivi
ng C
ase
Man
agem
ent

California One-Stop System Cost Study Report
69
Figure III-74: Total Cost per Enrolled Client Placed in Employment
$0
$5,000
$10,000
$15,000
$20,000
$25,000
Case s
tudy 3
- Cen
tral -
Rural/S
uburb
an
Survey
2 - S
outh
- Rura
l
Survey
17 - S
outh
- Urba
n
Survey
8 - C
entra
l - Urba
n
Survey
15 - S
outh
- Urba
n
Case s
tudy 4
- Nort
h - R
ural
Survey
14 - S
outh
- Urba
n
Survey
16 - S
outh
- Urba
n
Survey
9 - C
entra
l - Urba
n
Survey
3 - N
orth -
Rura
l
Case s
tudy 1
- Sou
th - U
rban
Survey
7 - C
entra
l - Rura
l
Survey
5 - S
outh
- Sub
urban
/ Rura
l
Survey
11 - N
orth -
Urba
n
Survey
18 - N
orth -
Sub
urban
/ Rura
l
Survey
4 - N
orth -
Urba
n / R
ural
Survey
10 - N
orth -
Suburb
an
Survey
6 - S
outh
- Sub
urban
Survey
1 - C
entra
l - Rura
l
Survey
13 - S
outh
- Sub
urban
Survey
12 - S
outh
- Urba
n
Case s
tudy 2
- Nort
h - S
uburb
an
One-Stop
Tota
l Cos
t per
Enr
olle
d C
lient
Pla
ced
in E
mpl
oym
ent
Figure III-75: Volume of Enrolled Clients Placed in Employment
0
500
1,000
1,500
2,000
2,500
3,000
Survey
10 - N
orth -
Sub
urban
Survey
12 - S
outh
- Urba
n
Survey
18 - N
orth -
Sub
urban
/ Rura
l
Survey
11 - N
orth -
Urba
n
Survey
1 - C
entra
l - Rura
l
Survey
13 - S
outh
- Sub
urban
Survey
3 - N
orth -
Rura
l
Survey
5 - S
outh
- Sub
urban
/ Rura
l
Survey
4 - N
orth -
Urba
n / R
ural
Survey
7 - C
entra
l - Rura
l
Survey
16 - S
outh
- Urba
n
Survey
6 - S
outh
- Sub
urban
Survey
17 - S
outh
- Urba
n
Survey
2 - S
outh
- Rura
l
Survey
14 - S
outh
- Urba
n
Survey
8 - C
entra
l - Urba
n
Case s
tudy 1
- Sou
th - U
rban
Survey
15 - S
outh
- Urba
n
Survey
9 - C
entra
l - Urba
n
Case s
tudy 4
- Nort
h - R
ural
Case s
tudy 3
- Cen
tral -
Rural/S
uburb
an
Case s
tudy 2
- Nort
h - Sub
urban
One-Stop
Enro
lled
- Num
ber o
f Clie
nts
Get
ting
Plac
emen
t Ass
ista
nce

California One-Stop System Cost Study Report
70
Figure III-76: Cost per Enrolled Assessment
$0.00
$500.00
$1,000.00
$1,500.00
$2,000.00
$2,500.00
Survey
9 - C
entra
l - Urba
n
Survey
7 - C
entra
l - Rura
l
Survey
2 - S
outh
- Rura
l
Survey
8 - C
entra
l - Urba
n
Survey
14 - S
outh
- Urba
n
Survey
15 - S
outh
- Urba
n
Survey
5 - S
outh
- Sub
urban
/ Rura
l
Survey
6 - S
outh
- Sub
urban
Survey
11 - N
orth -
Urba
n
Survey
10 - N
orth -
Suburb
an
Survey
18 - N
orth -
Sub
urban
/ Rura
l
Case s
tudy 4
- Nort
h - R
ural
Survey
3 - N
orth -
Rura
l
Survey
16 - S
outh
- Urba
n
Survey
13 - S
outh
- Sub
urban
Survey
4 - N
orth -
Urba
n / R
ural
Survey
1 - C
entra
l - Rura
l
Survey
17 - S
outh
- Urba
n
Case s
tudy 1
- Sou
th - U
rban
Case s
tudy 2
- Nort
h - S
uburb
an
Case s
tudy 3
- Cen
tral -
Rural/S
uburb
an
Survey
12 - S
outh
- Urba
n
One-Stop
Cos
t per
Enr
olle
d A
sses
smen
t
Figure III-77: Volume of Enrolled Assessments
0
500
1,000
1,500
2,000
2,500
Survey
1 - C
entra
l - Rura
l
Survey
10 - N
orth -
Suburb
an
Survey
11 - N
orth -
Urba
n
Survey
16 - S
outh
- Urba
n
Survey
13 - S
outh
- Sub
urban
Survey
18 - N
orth -
Sub
urban
/ Rura
l
Survey
12 - S
outh
- Urba
n
Survey
5 - S
outh
- Sub
urban
/ Rura
l
Survey
6 - S
outh
- Sub
urban
Survey
2 - S
outh
- Rura
l
Case s
tudy 4
- Nort
h - R
ural
Survey
4 - N
orth -
Urba
n / R
ural
Survey
3 - N
orth -
Rura
l
Survey
14 - S
outh
- Urba
n
Survey
15 - S
outh
- Urba
n
Survey
7 - C
entra
l - Rura
l
Survey
8 - C
entra
l - Urba
n
Survey
9 - C
entra
l - Urba
n
Survey
17 - S
outh
- Urba
n
Case s
tudy 1
- Sou
th - U
rban
Case s
tudy 2
- Nort
h - S
uburb
an
Case s
tudy 3
- Cen
tral -
Rural/S
uburb
an
One-Stop
Enro
lled
- Num
ber o
f Ass
essm
ents

California One-Stop System Cost Study Report
71
Figure III-78: Cost per Enrolled IEP or Other Formal Plan
$0.00
$200.00
$400.00
$600.00
$800.00
$1,000.00
$1,200.00
$1,400.00
$1,600.00
$1,800.00
Survey
2 - S
outh
- Rura
l
Survey
17 - S
outh
- Urba
n
Case s
tudy 1
- Sou
th - U
rban
Survey
8 - C
entra
l - Urba
n
Survey
18 - N
orth -
Suburb
an / R
ural
Survey
3 - N
orth -
Rura
l
Survey
6 - S
outh
- Sub
urban
Survey
9 - C
entra
l - Urba
n
Survey
5 - S
outh
- Sub
urban
/ Rura
l
Survey
14 - S
outh
- Urba
n
Survey
15 - S
outh
- Urba
n
Survey
7 - C
entra
l - Rural
Case s
tudy 2
- Nort
h - Sub
urban
Survey
16 - S
outh
- Urba
n
Survey
12 - S
outh
- Urba
n
Survey
11 - N
orth -
Urba
n
Survey
10 - N
orth -
Suburb
an
Survey
13 - S
outh
- Sub
urban
Case s
tudy 4
- Nort
h - R
ural
Survey
4 - N
orth -
Urba
n / R
ural
Survey
1 - C
entra
l - Rura
l
Case s
tudy 3
- Cen
tral -
Rural/S
uburb
an
One-Stop
Cos
t per
Enr
olle
d IE
P or
Oth
er F
orm
al P
lan
Figure III-79: Volume of Enrolled IEPs or Other Formal Plans
0
200
400
600
800
1,000
1,200
Survey
10 - N
orth -
Sub
urban
Survey
11 - N
orth -
Urba
n
Survey
18 -
North -
Sub
urban
/ Rura
l
Survey
1 - C
entra
l - Rura
l
Case s
tudy 1
- Sou
th - U
rban
Survey
13 - S
outh
- Sub
urban
Survey
12 - S
outh
- Urba
n
Survey
4 - N
orth -
Urba
n / R
ural
Survey
3 - N
orth -
Rura
l
Survey
5 - S
outh
- Sub
urba
n / R
ural
Survey
16 - S
outh
- Urba
n
Survey
2 - S
outh
- Rura
l
Case s
tudy 4
- Nort
h - R
ural
Survey
15 - S
outh
- Urba
n
Survey
14 - S
outh
- Urba
n
Survey
17 - S
outh
- Urba
n
Survey
6 - S
outh
- Sub
urban
Survey
7 - C
entra
l - Rura
l
Survey
8 - C
entra
l - Urba
n
Survey
9 - C
entra
l - Urba
n
Case s
tudy 2
- Nort
h - S
uburb
an
Case s
tudy 3
- Cen
tral -
Rural/S
ubur
ban
One-Stop
Enro
lled
- Num
ber o
f IEP
s or
Oth
er F
orm
al P
lans

California One-Stop System Cost Study Report
72
Figure III-80: Cost per Enrolled Client with ITA or OJT
$0.00
$1,000.00
$2,000.00
$3,000.00
$4,000.00
$5,000.00
$6,000.00
Survey
17 - S
outh
- Urba
n
Survey
2 - S
outh
- Rura
l
Survey
15 - S
outh
- Urba
n
Survey
1 - C
entra
l - Rura
l
Survey
14 - S
outh
- Urba
n
Survey
9 - C
entra
l - Urba
n
Survey
10 - N
orth -
Sub
urban
Survey
11 - N
orth -
Urba
n
Survey
6 - S
outh
- Sub
urban
Survey
16 - S
outh
- Urba
n
Survey
8 - C
entra
l - Urba
n
Survey
7 - C
entra
l - Rura
l
Survey
5 - S
outh
- Sub
urban
/ Rura
l
Survey
12 - S
outh
- Urba
n
Case s
tudy 1
- Sou
th - U
rban
Case s
tudy 2
- Nort
h - S
uburb
an
Case s
tudy 3
- Cen
tral -
Rural/S
uburb
an
Case s
tudy 4
- Nort
h - R
ural
Survey
3 - N
orth -
Rura
l
Survey
4 - N
orth -
Urba
n / R
ural
Survey
13 - S
outh
- Sub
urban
Survey
18 - N
orth -
Sub
urban
/ Rura
l
One-Stop
Cos
t per
Enr
olle
d C
lient
with
ITA
or O
JT
Figure III-81: Volume of Enrolled Clients with ITA or OJT
0
200
400
600
800
1,000
1,200
1,400
1,600
Survey
7 - C
entra
l - Rura
l
Survey
8 - C
entra
l - Urba
n
Survey
14 - S
outh
- Urba
n
Survey
12 - S
outh
- Urba
n
Survey
5 - S
outh
- Sub
urban
/ Rura
l
Survey
11 - N
orth -
Urba
n
Survey
13 - S
outh
- Sub
urban
Survey
16 - S
outh
- Urba
n
Survey
10 - N
orth -
Sub
urban
Survey
17 - S
outh
- Urba
n
Survey
18 - N
orth -
Sub
urban
/ Rura
l
Survey
2 - S
outh
- Rura
l
Survey
1 - C
entra
l - Rura
l
Survey
15 - S
outh
- Urba
n
Survey
4 - N
orth -
Urba
n / R
ural
Survey
3 - N
orth -
Rura
l
Survey
6 - S
outh
- Sub
urban
Survey
9 - C
entra
l - Urba
n
Case s
tudy 2
- Nort
h - S
uburb
an
Case s
tudy 4
- Nort
h - R
ural
Case s
tudy 1
- Sou
th - U
rban
Case s
tudy 3
- Cen
tral -
Rural/S
uburb
an
One-Stop
Enro
lled
- Num
ber o
f Clie
nts
with
ITA
or O
JT

California One-Stop System Cost Study Report
73
Figure III-82: Cost per Enrolled Client Receiving Training / Education
$0.00
$100.00
$200.00
$300.00
$400.00
$500.00
$600.00
Survey
12 - S
outh
- Urba
n
Case s
tudy 4
- Nort
h - R
ural
Survey
7 - C
entra
l - Rura
l
Survey
14 - S
outh
- Urba
n
Survey
1 - C
entra
l - Rura
l
Survey
15 - S
outh
- Urba
n
Survey
2 - S
outh
- Rura
l
Survey
4 - N
orth -
Urba
n / R
ural
Survey
5 - S
outh
- Sub
urban
/ Rura
l
Survey
6 - S
outh
- Sub
urban
Survey
8 - C
entra
l - Urba
n
Survey
9 - C
entra
l - Urba
n
Survey
10 - N
orth -
Suburb
an
Survey
11 - N
orth -
Urba
n
Survey
13 - S
outh
- Sub
urban
Survey
17 - S
outh
- Urba
n
Survey
18 - N
orth -
Sub
urban
/ Rura
l
Case s
tudy 1
- Sou
th - U
rban
Case s
tudy 2
- Nort
h - S
uburb
an
Case s
tudy 3
- Cen
tral -
Rural/S
uburb
an
Survey
3 - N
orth -
Rura
l
Survey
16 - S
outh
- Urba
n
One-Stop
Cos
t per
Enr
olle
d C
lient
Rec
eivi
ng T
rain
ing
/ Edu
catio
n
Figure III-83: Volume of Enrolled Clients Receiving Training / Education
0
500
1,000
1,500
2,000
2,500
Survey
16 - S
outh
- Urba
n
Survey
15 - S
outh
- Urba
n
Survey
1 - C
entra
l - Rura
l
Survey
14 - S
outh
- Urba
n
Survey
7 - C
entra
l - Rura
l
Survey
3 - N
orth -
Rura
l
Case s
tudy 4
- Nort
h - R
ural
Survey
12 - S
outh
- Urba
n
Survey
10 - N
orth -
Sub
urban
Survey
11 - N
orth -
Urba
n
Survey
13 - S
outh
- Sub
urban
Survey
17 - S
outh
- Urba
n
Survey
18 - N
orth -
Sub
urban
/ Rura
l
Survey
2 - S
outh
- Rura
l
Survey
4 - N
orth -
Urba
n / R
ural
Survey
5 - S
outh
- Sub
urban
/ Rura
l
Survey
6 - S
outh
- Sub
urban
Survey
8 - C
entra
l - Urba
n
Survey
9 - C
entra
l - Urba
n
Case s
tudy 1
- Sou
th - U
rban
Case s
tudy 2
- Nort
h - Sub
urban
Case s
tudy 3
- Cen
tral -
Rural/S
uburb
an
One-Stop
Enro
lled
- Num
ber o
f Clie
nts
Rec
eivi
ng T
rain
ing/
Educ
atio
n

California One-Stop System Cost Study Report
74
Figure III-84: Cost per Enrolled Client Receiving Support Services
$0.00
$100.00
$200.00
$300.00
$400.00
$500.00
$600.00
Survey
4 - N
orth -
Urba
n / R
ural
Survey
2 - S
outh
- Rura
l
Survey
16 - S
outh
- Urba
n
Survey
14 - S
outh
- Urba
n
Survey
15 - S
outh
- Urba
n
Survey
9 - C
entra
l - Urba
n
Case s
tudy 4
- Nort
h - R
ural
Survey
1 - C
entra
l - Rura
l
Survey
5 - S
outh
- Sub
urban
/ Rura
l
Survey
6 - S
outh
- Sub
urban
Survey
7 - C
entra
l - Rura
l
Survey
8 - C
entra
l - Urba
n
Survey
10 - N
orth -
Sub
urban
Survey
11 - N
orth -
Urba
n
Survey
12 - S
outh
- Urba
n
Survey
13 - S
outh
- Sub
urban
Survey
17 - S
outh
- Urba
n
Survey
18 - N
orth -
Sub
urban
/ Rura
l
Case s
tudy 1
- Sou
th - U
rban
Case s
tudy 2
- Nort
h - S
uburb
an
Case s
tudy 3
- Cen
tral -
Rural/S
uburb
an
Survey
3 - N
orth -
Rura
l
One-Stop
Cos
t per
Enr
olle
d C
lient
Rec
eivi
ng S
uppo
rt S
ervi
ces
Figure III-85: Volume of Enrolled Clients Receiving Support Services
0
100
200
300
400
500
600
700
800
900
1,000
Survey
2 - S
outh
- Rura
l
Survey
14 - S
outh
- Urba
n
Survey
15 - S
outh
- Urba
n
Survey
3 - N
orth -
Rura
l
Survey
4 - N
orth -
Urba
n / R
ural
Survey
16 - S
outh
- Urba
n
Survey
9 - C
entra
l - Urba
n
Case s
tudy 4
- Nort
h - R
ural
Survey
1 - C
entra
l - Rura
l
Survey
10 - N
orth -
Sub
urban
Survey
11 - N
orth -
Urba
n
Survey
12 - S
outh
- Urba
n
Survey
13 - S
outh
- Sub
urban
Survey
17 - S
outh
- Urba
n
Survey
18 - N
orth -
Sub
urban
/ Rura
l
Survey
5 - S
outh
- Sub
urban
/ Rura
l
Survey
6 - S
outh
- Sub
urban
Survey
7 - C
entra
l - Rura
l
Survey
8 - C
entra
l - Urba
n
Case s
tudy 1
- Sou
th - U
rban
Case s
tudy 2
- Nort
h - S
uburb
an
Case s
tudy 3
- Cen
tral -
Rural/S
uburb
an
One-Stop
Enro
lled
- Num
ber o
f Clie
nts
Rec
eivi
ng S
uppo
rt S
ervi
ces

California One-Stop System Cost Study Report
75
Figure III-86: Cost per Enrolled Client Getting Placement Assistance
$0.00
$500.00
$1,000.00
$1,500.00
$2,000.00
$2,500.00
$3,000.00
$3,500.00
Case s
tudy 3
- Cen
tral -
Rural/S
uburb
an
Survey
4 - N
orth -
Urba
n / R
ural
Case s
tudy 4
- Nort
h - R
ural
Survey
15 - S
outh
- Urba
n
Survey
8 - C
entra
l - Urba
n
Survey
17 - S
outh
- Urba
n
Survey
2 - S
outh
- Rura
l
Survey
6 - S
outh
- Sub
urban
Survey
16 - S
outh
- Urba
n
Survey
9 - C
entra
l - Urba
n
Survey
14 - S
outh
- Urba
n
Survey
7 - C
entra
l - Rura
l
Survey
5 - S
outh
- Sub
urban
/ Rura
l
Survey
11 - N
orth -
Urba
n
Survey
3 - N
orth -
Rura
l
Survey
1 - C
entra
l - Rura
l
Case s
tudy 1
- Sou
th - U
rban
Survey
10 - N
orth -
Sub
urban
Survey
13 - S
outh
- Sub
urban
Survey
18 - N
orth -
Sub
urban
/ Rura
l
Survey
12 - S
outh
- Urba
n
Case s
tudy 2
- Nort
h - S
uburb
an
One-Stop
Cos
t per
Enr
olle
d C
lient
Get
ting
Plac
emen
t Ass
ista
nce
Business Services
The business services process is the area where One-Stops differ the most from each other in both the amount of costs and the variety of services offered. So the number of One-Stops reported costs and services produced vary substantially from one service to another. The key cost per unit measures we found in this area are related to Rapid Response, which is the service most commonly produced. We looked at rapid response from two perspectives: the number of employers assisted and number of employees assisted. As the table below indicates, the median cost of providing rapid response services to a business was $964, but cost ranged widely. When we look at the cost of assisting an employee with rapid response service the median cost was $157, again with a wide range. The wide variation is due to the range of interventions offered and the size of the companies. In one case the One-Stop may just provide some routine information to the company and in another they may set up extensive on-site services. Similarly the number of companies served affects the cost per company served; the number of companies served ranged from 450 to a handful. In the table below we show the services for which we could estimate costs. Overall we can see that on a per unit basis Business services tend to cost more than services to individual job seekers.

California One-Stop System Cost Study Report
76
Table III-8: Business Services: Median and Range of Costs Per-Unit of Service Unit of Service Median Cost Per Range Per Rapid Response Employer
Assisted $964 $62 - $18,127
Per Rapid Response Employee Assisted
$157 $3 - $4,671
Per Mass Hire Event $2,934 $355 - $11,524 Per Applicant interviewed at Mass
Hire Event $48 $18 - $1,148
Per Job Fair Event $17,778 $354 - $38,380 Per Business Participating In Job
Fair $1,423 $468 - $17,286
Per Job Seeker Participating in Job Fair
$205 $9 - $2,427
Per Business Services Workshop $4,285 $565 - $12,905 Per Business Attending Workshop $344 $28 - $912 Per Business Receiving Consulting
Services $313 $0.27 - $1,127
Per Business Using Business Center Services
$536 $47 - $12,504
Per Job Developed $161 $63 - $987 Many One-Stops provide mass hire events where a large business such as a big box retailer is seeking a number of employees, and the One-Stop will advertise and provide a facility to the employer to meet and interview employees. The median cost of one of these events was $2,934, with a median cost per applicant interviewed of $48. The wide range in costs is driven by the number of clients interviewed and the amount of marketing and logistics that go into the event. Similarly, One-Stops host job fairs where various employers and training agencies will have booths and disseminate information. The median cost of a Job Fair was substantial at $17,778, the median cost per business participating was $1,443, and median cost per job seeker was $205. Finally, job development-the process by which One-Stops communicate with employers to uncover the need for employees, finding out about what skills are needed for the job, and disseminating such information--is a service we placed in the business services process. We found the median cost to develop a job was about $161. In the following graphs the reader can look in detail at distribution of cost per service and the volume produced for all Business services. One-stops provide an array of business services we described earlier, here we present the best cost per unit estimates we could calculate for the One-Stops which reported data; both the costs and the volume of services produced.
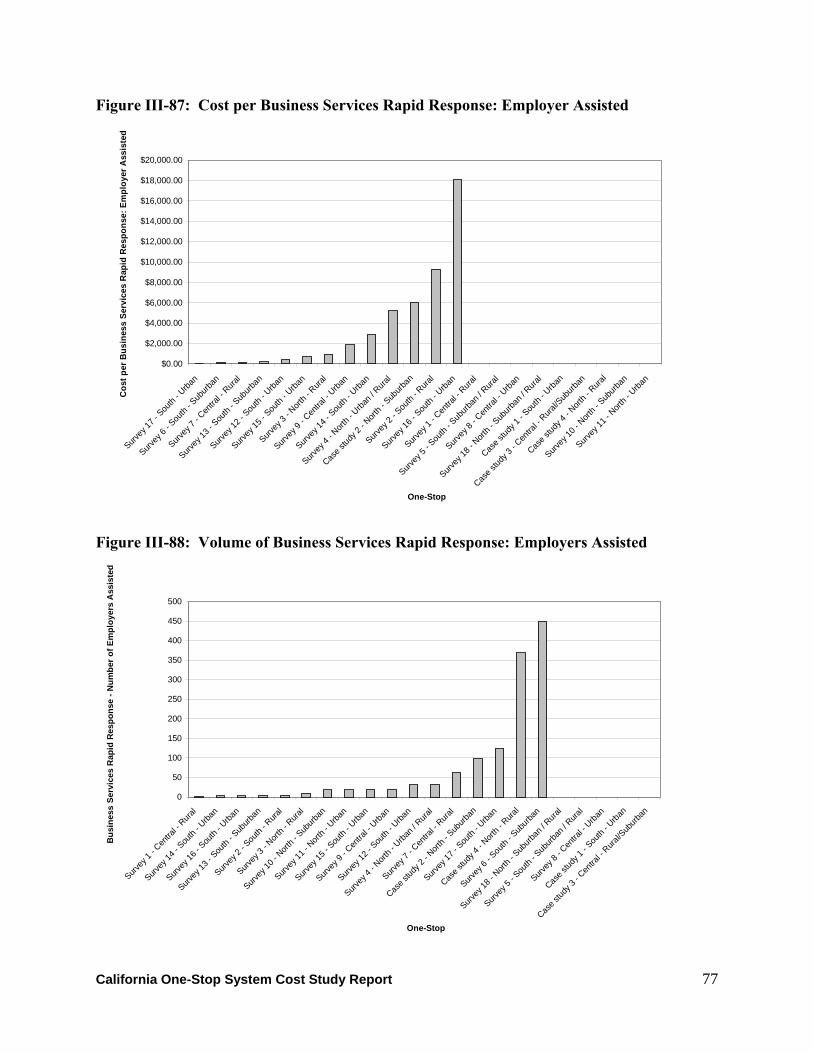
California One-Stop System Cost Study Report
77
Figure III-87: Cost per Business Services Rapid Response: Employer Assisted
$0.00
$2,000.00
$4,000.00
$6,000.00
$8,000.00
$10,000.00
$12,000.00
$14,000.00
$16,000.00
$18,000.00
$20,000.00
Survey
17 - S
outh
- Urba
n
Survey
6 - S
outh
- Sub
urban
Survey
7 - C
entra
l - Rura
l
Survey
13 - S
outh
- Sub
urban
Survey
12 - S
outh
- Urba
n
Survey
15 - S
outh
- Urba
n
Survey
3 - N
orth -
Rura
l
Survey
9 - C
entra
l - Urba
n
Survey
14 - S
outh
- Urba
n
Survey
4 - N
orth -
Urba
n / R
ural
Case s
tudy 2
- Nort
h - S
uburb
an
Survey
2 - S
outh
- Rura
l
Survey
16 - S
outh
- Urba
n
Survey
1 - C
entra
l - Rura
l
Survey
5 - S
outh
- Sub
urban
/ Rura
l
Survey
8 - C
entra
l - Urba
n
Survey
18 - N
orth -
Sub
urban
/ Rura
l
Case s
tudy 1
- Sou
th - U
rban
Case s
tudy 3
- Cen
tral -
Rural/S
uburb
an
Case s
tudy 4
- Nort
h - R
ural
Survey
10 - N
orth -
Suburb
an
Survey
11 - N
orth -
Urba
n
One-Stop
Cos
t per
Bus
ines
s Se
rvic
es R
apid
Res
pons
e: E
mpl
oyer
Ass
iste
d
Figure III-88: Volume of Business Services Rapid Response: Employers Assisted
0
50
100
150
200
250
300
350
400
450
500
Survey
1 - C
entra
l - Rura
l
Survey
14 - S
outh
- Urba
n
Survey
16 - S
outh
- Urba
n
Survey
13 - S
outh
- Sub
urban
Survey
2 - S
outh
- Rura
l
Survey
3 - N
orth -
Rura
l
Survey
10 - N
orth -
Suburb
an
Survey
11 - N
orth -
Urba
n
Survey
15 - S
outh
- Urba
n
Survey
9 - C
entra
l - Urba
n
Survey
12 - S
outh
- Urba
n
Survey
4 - N
orth -
Urba
n / R
ural
Survey
7 - C
entra
l - Rura
l
Case s
tudy 2
- Nort
h - S
uburb
an
Survey
17 - S
outh
- Urba
n
Case s
tudy 4
- Nort
h - R
ural
Survey
6 - S
outh
- Sub
urban
Survey
18 - N
orth -
Sub
urban
/ Rura
l
Survey
5 - S
outh
- Sub
urban
/ Rura
l
Survey
8 - C
entra
l - Urba
n
Case s
tudy 1
- Sou
th - U
rban
Case s
tudy 3
- Cen
tral -
Rural/S
uburb
an
One-Stop
Bus
ines
s Se
rvic
es R
apid
Res
pons
e - N
umbe
r of E
mpl
oyer
s A
ssis
ted

California One-Stop System Cost Study Report
78
Figure III-89: Cost per Business Services Rapid Response: Employee Assisted
$0.00
$500.00
$1,000.00
$1,500.00
$2,000.00
$2,500.00
$3,000.00
$3,500.00
$4,000.00
$4,500.00
$5,000.00
Survey
13 - S
outh
- Sub
urban
Survey
12 - S
outh
- Urba
n
Survey
3 - N
orth -
Rura
l
Survey
15 - S
outh
- Urba
n
Survey
14 - S
outh
- Urba
n
Survey
9 - C
entra
l - Urba
n
Survey
4 - N
orth -
Urba
n / R
ural
Survey
6 - S
outh
- Sub
urban
Case s
tudy 2
- Nort
h - S
uburb
an
Survey
2 - S
outh
- Rura
l
Case s
tudy 4
- Nort
h - R
ural
Survey
16 - S
outh
- Urba
n
Survey
8 - C
entra
l - Urba
n
Survey
17 - S
outh
- Urba
n
Survey
1 - C
entra
l - Rura
l
Case s
tudy 3
- Cen
tral -
Rural/S
uburb
an
Survey
7 - C
entra
l - Rura
l
Survey
5 - S
outh
- Sub
urban
/ Rura
l
Survey
18 - N
orth -
Sub
urban
/ Rura
l
Case s
tudy 1
- Sou
th - U
rban
Survey
10 - N
orth -
Sub
urban
Survey
11 - N
orth -
Urba
n
One-Stop
Cos
t per
Bus
ines
s Se
rvic
es R
apid
Res
pons
e: E
mpl
oyee
Ass
iste
d
Figure III-90: Volume of Business Services Rapid Response: Employees Assisted
0
500
1,000
1,500
2,000
2,500
3,000
3,500
4,000
Survey
7 - C
entra
l - Rura
l
Case s
tudy 3
- Cen
tral -
Rural/S
uburb
an
Survey
17 - S
outh
- Urba
n
Survey
1 - C
entra
l - Rura
l
Case s
tudy 4
- Nort
h - R
ural
Survey
8 - C
entra
l - Urba
n
Survey
16 - S
outh
- Urba
n
Survey
14 - S
outh
- Urba
n
Survey
2 - S
outh
- Rura
l
Survey
10 - N
orth -
Suburb
an
Survey
11 - N
orth -
Urba
n
Survey
13 - S
outh
- Sub
urban
Survey
15 - S
outh
- Urba
n
Survey
9 - C
entra
l - Urba
n
Survey
3 - N
orth -
Rura
l
Survey
6 - S
outh
- Sub
urban
Survey
4 - N
orth -
Urba
n / R
ural
Survey
12 - S
outh
- Urba
n
Case s
tudy 2
- Nort
h - S
uburb
an
Survey
18 - N
orth -
Sub
urban
/ Rura
l
Survey
5 - S
outh
- Sub
urban
/ Rura
l
Case s
tudy 1
- Sou
th - U
rban
One-Stop
Bus
ines
s Se
rvic
es R
apid
Res
pons
e - N
umbe
r of E
mpl
oyee
s A
ssis
ted

California One-Stop System Cost Study Report
79
Figure III-91: Cost per Business Services Mass Hire Event
$0.00
$2,000.00
$4,000.00
$6,000.00
$8,000.00
$10,000.00
$12,000.00
Survey
14 - S
outh
- Urba
n
Survey
12 - S
outh
- Urba
n
Case s
tudy 4
- Nort
h - R
ural
Survey
13 - S
outh
- Sub
urban
Survey
15 - S
outh
- Urba
n
Survey
18 - N
orth -
Sub
urban
/ Rura
l
Survey
7 - C
entra
l - Rura
l
Survey
8 - C
entra
l - Urba
n
Survey
17 - S
outh
- Urba
n
Survey
16 - S
outh
- Urba
n
Survey
1 - C
entra
l - Rura
l
Survey
2 - S
outh
- Rura
l
Survey
9 - C
entra
l - Urba
n
Survey
3 - N
orth -
Rura
l
Survey
4 - N
orth -
Urba
n / R
ural
Survey
6 - S
outh
- Sub
urban
Survey
10 - N
orth -
Sub
urban
Survey
11 - N
orth -
Urba
n
Case s
tudy 1
- Sou
th - U
rban
Case s
tudy 2
- Nort
h - S
uburb
an
Case s
tudy 3
- Cen
tral -
Rural/S
uburb
an
Survey
5 - S
outh
- Sub
urban
/ Rura
l
One-Stop
Cos
t per
Bus
ines
s Se
rvic
es M
ass
Hire
Eve
nt
Figure III-92: Volume of Business Services Mass Hire Events
0
50
100
150
200
250
Survey
1 - C
entra
l - Rura
l
Survey
5 - S
outh
- Sub
urban
/ Rura
l
Survey
2 - S
outh
- Rura
l
Case s
tudy 4
- Nort
h - R
ural
Survey
7 - C
entra
l - Rura
l
Survey
9 - C
entra
l - Urba
n
Survey
16 - S
outh
- Urba
n
Survey
8 - C
entra
l - Urba
n
Case s
tudy 1
- Sou
th - U
rban
Survey
15 - S
outh
- Urba
n
Survey
13 - S
outh
- Sub
urban
Survey
18 - N
orth -
Sub
urban
/ Rura
l
Case s
tudy 2
- Nort
h - S
uburb
an
Survey
17 - S
outh
- Urba
n
Survey
12 - S
outh
- Urba
n
Survey
14 - S
outh
- Urba
n
Case s
tudy 3
- Cen
tral -
Rural/S
uburb
an
Survey
10 - N
orth -
Suburb
an
Survey
11 - N
orth -
Urba
n
Survey
3 - N
orth -
Rura
l
Survey
4 - N
orth -
Urba
n / R
ural
Survey
6 - S
outh
- Sub
urban
One-Stop
Bus
ines
s Se
rvic
es -
Num
ber o
f Mas
s H
ire E
vent
s

California One-Stop System Cost Study Report
80
Figure III-93: Cost per Business Services: Applicant Interviewed at Mass Hire Event
$0.00
$200.00
$400.00
$600.00
$800.00
$1,000.00
$1,200.00
Survey
15 - S
outh
- Urba
n
Survey
12 - S
outh
- Urba
n
Survey
6 - S
outh
- Sub
urban
Survey
2 - S
outh
- Rura
l
Case s
tudy 4
- Nort
h - R
ural
Survey
7 - C
entra
l - Rura
l
Survey
18 - N
orth -
Sub
urban
/ Rura
l
Survey
1 - C
entra
l - Rura
l
Survey
16 - S
outh
- Urba
n
Survey
8 - C
entra
l - Urba
n
Survey
17 - S
outh
- Urba
n
Survey
14 - S
outh
- Urba
n
Survey
9 - C
entra
l - Urba
n
Survey
3 - N
orth -
Rura
l
Survey
4 - N
orth -
Urba
n / R
ural
Survey
10 - N
orth -
Suburb
an
Survey
11 - N
orth -
Urba
n
Survey
13 - S
outh
- Sub
urban
Case s
tudy 1
- Sou
th - U
rban
Case s
tudy 2
- Nort
h - S
uburb
an
Case s
tudy 3
- Cen
tral -
Rural/S
uburb
an
Survey
5 - S
outh
- Sub
urban
/ Rura
l
One-Stop
Cos
t per
Bus
ines
s Se
rvic
es A
pplic
ant I
nter
view
ed a
t Mas
s H
ire E
vent
Figure III-94: Volume of Business Services: Applicants Interviewed at Mass Hire Events
0
500
1,000
1,500
2,000
2,500
3,000
3,500
Survey
14 - S
outh
- Urba
n
Survey
8 - C
entra
l - Urba
n
Survey
9 - C
entra
l - Urba
n
Survey
1 - C
entra
l - Rura
l
Case s
tudy 4
- Nort
h - R
ural
Survey
16 - S
outh
- Urba
n
Survey
17 - S
outh
- Urba
n
Case s
tudy 2
- Nort
h - S
uburb
an
Survey
7 - C
entra
l - Rura
l
Survey
5 - S
outh
- Sub
urban
/ Rura
l
Survey
18 - N
orth -
Sub
urban
/ Rura
l
Survey
12 - S
outh
- Urba
n
Survey
15 - S
outh
- Urba
n
Survey
2 - S
outh
- Rura
l
Survey
6 - S
outh
- Sub
urban
Survey
10 - N
orth -
Suburb
an
Survey
11 - N
orth -
Urba
n
Survey
13 - S
outh
- Sub
urban
Survey
3 - N
orth -
Rura
l
Survey
4 - N
orth -
Urba
n / R
ural
Case s
tudy 1
- Sou
th - U
rban
Case s
tudy 3
- Cen
tral -
Rural/S
uburb
an
One-Stop
Bus
ines
s Se
rvic
es -
Num
ber o
f App
lican
ts In
terv
iew
ed a
t Mas
s H
ire E
vent
s

California One-Stop System Cost Study Report
81
Figure III-95: Cost per Business Services Job Fair Event
$0.00
$5,000.00
$10,000.00
$15,000.00
$20,000.00
$25,000.00
$30,000.00
$35,000.00
$40,000.00
Survey
13 - S
outh
- Sub
urban
Case s
tudy 4
- Nort
h - R
ural
Survey
15 - S
outh
- Urba
n
Survey
6 - S
outh
- Sub
urban
Survey
16 - S
outh
- Urba
n
Survey
2 - S
outh
- Rura
l
Survey
12 - S
outh
- Urba
n
Survey
8 - C
entra
l - Urba
n
Survey
7 - C
entra
l - Rura
l
Survey
17 - S
outh
- Urba
n
Survey
18 - N
orth -
Sub
urban
/ Rura
l
Survey
14 - S
outh
- Urba
n
Survey
9 - C
entra
l - Urba
n
Survey
1 - C
entra
l - Rura
l
Survey
3 - N
orth -
Rura
l
Survey
4 - N
orth -
Urba
n / R
ural
Survey
5 - S
outh
- Sub
urban
/ Rura
l
Survey
10 - N
orth -
Sub
urban
Survey
11 - N
orth -
Urba
n
Case s
tudy 1
- Sou
th - U
rban
Case s
tudy 2
- Nort
h - S
uburb
an
Case s
tudy 3
- Cen
tral -
Rural/S
uburb
an
One-Stop
Cos
t per
Bus
ines
s Se
rvic
es J
ob F
air E
vent
Figure III-96: Number of Business Services Job Fair Events
0
10
20
30
40
50
60
70
80
90
Survey
14 - S
outh
- Urba
n
Survey
18 - N
orth -
Sub
urban
/ Rura
l
Survey
7 - C
entra
l - Rura
l
Survey
12 - S
outh
- Urba
n
Survey
8 - C
entra
l - Urba
n
Survey
17 - S
outh
- Urba
n
Survey
2 - S
outh
- Rura
l
Survey
9 - C
entra
l - Urba
n
Survey
16 - S
outh
- Urba
n
Survey
6 - S
outh
- Sub
urban
Case s
tudy 4
- Nort
h - R
ural
Survey
15 - S
outh
- Urba
n
Survey
13 - S
outh
- Sub
urban
Survey
1 - C
entra
l - Rura
l
Survey
10 - N
orth -
Sub
urban
Survey
11 - N
orth -
Urba
n
Survey
3 - N
orth -
Rura
l
Survey
4 - N
orth -
Urba
n / R
ural
Survey
5 - S
outh
- Sub
urban
/ Rura
l
Case s
tudy 1
- Sou
th - U
rban
Case s
tudy 2
- Nort
h - S
uburb
an
Case s
tudy 3
- Cen
tral -
Rural/S
uburb
an
One-Stop
Bus
ines
s Se
rvic
es -
Num
ber o
f Job
Fai
r Eve
nts
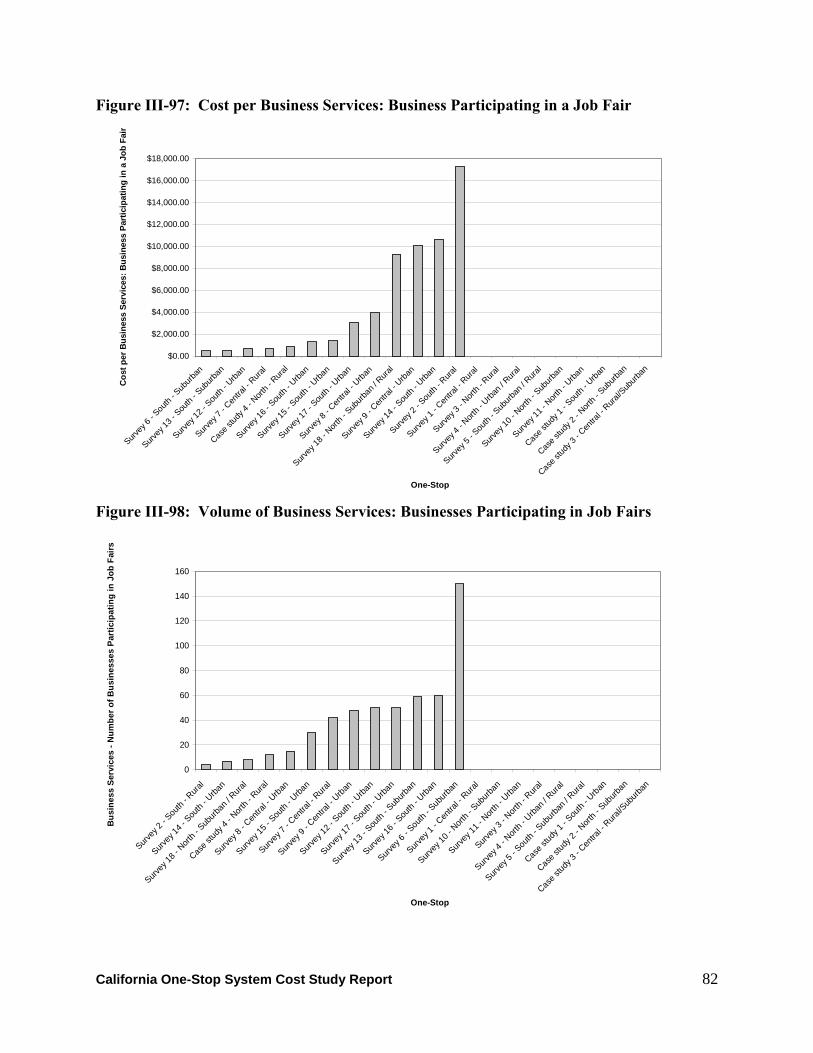
California One-Stop System Cost Study Report
82
Figure III-97: Cost per Business Services: Business Participating in a Job Fair
$0.00
$2,000.00
$4,000.00
$6,000.00
$8,000.00
$10,000.00
$12,000.00
$14,000.00
$16,000.00
$18,000.00
Survey
6 - S
outh
- Sub
urban
Survey
13 - S
outh
- Sub
urban
Survey
12 - S
outh
- Urba
n
Survey
7 - C
entra
l - Rura
l
Case s
tudy 4
- Nort
h - R
ural
Survey
16 - S
outh
- Urba
n
Survey
15 - S
outh
- Urba
n
Survey
17 - S
outh
- Urba
n
Survey
8 - C
entra
l - Urba
n
Survey
18 - N
orth -
Sub
urban
/ Rura
l
Survey
9 - C
entra
l - Urba
n
Survey
14 - S
outh
- Urba
n
Survey
2 - S
outh
- Rura
l
Survey
1 - C
entra
l - Rura
l
Survey
3 - N
orth -
Rura
l
Survey
4 - N
orth -
Urba
n / R
ural
Survey
5 - S
outh
- Sub
urban
/ Rura
l
Survey
10 - N
orth -
Sub
urban
Survey
11 - N
orth -
Urba
n
Case s
tudy 1
- Sou
th - U
rban
Case s
tudy 2
- Nort
h - S
uburb
an
Case s
tudy 3
- Cen
tral -
Rural/S
uburb
an
One-Stop
Cos
t per
Bus
ines
s Se
rvic
es: B
usin
ess
Part
icip
atin
g in
a J
ob F
air
Figure III-98: Volume of Business Services: Businesses Participating in Job Fairs
0
20
40
60
80
100
120
140
160
Survey
2 - S
outh
- Rura
l
Survey
14 - S
outh
- Urba
n
Survey
18 - N
orth -
Sub
urban
/ Rura
l
Case s
tudy 4
- Nort
h - R
ural
Survey
8 - C
entra
l - Urba
n
Survey
15 - S
outh
- Urba
n
Survey
7 - C
entra
l - Rura
l
Survey
9 - C
entra
l - Urba
n
Survey
12 - S
outh
- Urba
n
Survey
17 - S
outh
- Urba
n
Survey
13 - S
outh
- Sub
urban
Survey
16 - S
outh
- Urba
n
Survey
6 - S
outh
- Sub
urban
Survey
1 - C
entra
l - Rura
l
Survey
10 - N
orth -
Sub
urban
Survey
11 - N
orth -
Urba
n
Survey
3 - N
orth -
Rura
l
Survey
4 - N
orth -
Urba
n / R
ural
Survey
5 - S
outh
- Sub
urban
/ Rura
l
Case s
tudy 1
- Sou
th - U
rban
Case s
tudy 2
- Nort
h - Sub
urban
Case s
tudy 3
- Cen
tral -
Rural/S
uburb
an
One-Stop
Bus
ines
s Se
rvic
es -
Num
ber o
f Bus
ines
ses
Part
icip
atin
g in
Job
Fai
rs

California One-Stop System Cost Study Report
83
Figure III-99: Cost per Business Services: Job Seeker Participating in a Job Fair
$0.00
$500.00
$1,000.00
$1,500.00
$2,000.00
$2,500.00
Survey
15 - S
outh
- Urba
n
Survey
16 - S
outh
- Urba
n
Survey
2 - S
outh
- Rura
l
Survey
12 - S
outh
- Urba
n
Survey
7 - C
entra
l - Rura
l
Survey
14 - S
outh
- Urba
n
Survey
8 - C
entra
l - Urba
n
Survey
17 - S
outh
- Urba
n
Survey
18 - N
orth -
Sub
urban
/ Rura
l
Survey
9 - C
entra
l - Urba
n
Survey
1 - C
entra
l - Rura
l
Survey
3 - N
orth -
Rura
l
Survey
4 - N
orth -
Urba
n / R
ural
Survey
5 - S
outh
- Sub
urban
/ Rura
l
Survey
6 - S
outh
- Sub
urban
Survey
10 - N
orth -
Sub
urban
Survey
11 - N
orth -
Urba
n
Survey
13 - S
outh
- Sub
urban
Case s
tudy 1
- Sou
th - U
rban
Case s
tudy 2
- Nort
h - S
uburb
an
Case s
tudy 3
- Cen
tral -
Rural/S
uburb
an
Case s
tudy 4
- Nort
h - R
ural
One-Stop
Cos
t per
Bus
ines
s Se
rvic
es: J
ob S
eeke
r Par
ticip
atin
g in
a J
ob F
air
Figure III-100: Volume of Business Services Mass Hires/Job Fairs: Job Seekers Participating in Job Fairs
0
1,000
2,000
3,000
4,000
5,000
6,000
Survey
18 - N
orth -
Sub
urban
/ Rura
l
Survey
8 - C
entra
l - Urba
n
Survey
7 - C
entra
l - Rura
l
Survey
9 - C
entra
l - Urba
n
Survey
17 - S
outh
- Urba
n
Survey
12 - S
outh
- Urba
n
Survey
14 - S
outh
- Urba
n
Survey
2 - S
outh
- Rura
l
Survey
16 - S
outh
- Urba
n
Survey
15 - S
outh
- Urba
n
Survey
1 - C
entra
l - Rura
l
Survey
10 - N
orth -
Sub
urban
Survey
11 - N
orth -
Urba
n
Survey
13 - S
outh
- Sub
urban
Survey
3 - N
orth -
Rura
l
Survey
4 - N
orth -
Urba
n / R
ural
Survey
5 - S
outh
- Sub
urban
/ Rura
l
Survey
6 - S
outh
- Sub
urban
Case s
tudy 1
- Sou
th - U
rban
Case s
tudy 2
- Nort
h - S
uburb
an
Case s
tudy 3
- Cen
tral -
Rural/S
uburb
an
Case s
tudy 4
- Nort
h - R
ural
One-Stop
Bus
ines
s Se
rvic
es -
Num
ber o
f Job
See
kers
Par
ticip
atin
g in
Job
Fai
rs

California One-Stop System Cost Study Report
84
Figure III-101: Cost per Business Services Workshop
$0.00
$2,000.00
$4,000.00
$6,000.00
$8,000.00
$10,000.00
$12,000.00
$14,000.00
Survey
12 - S
outh
- Urba
n
Survey
6 - S
outh
- Sub
urban
Survey
13 - S
outh
- Sub
urban
Survey
1 - C
entra
l - Rura
l
Survey
15 - S
outh
- Urba
n
Survey
17 - S
outh
- Urba
n
Survey
14 - S
outh
- Urba
n
Survey
9 - C
entra
l - Urba
n
Survey
2 - S
outh
- Rura
l
Survey
3 - N
orth -
Rura
l
Survey
4 - N
orth -
Urba
n / R
ural
Survey
7 - C
entra
l - Rura
l
Survey
8 - C
entra
l - Urba
n
Survey
10 - N
orth -
Suburb
an
Survey
11 - N
orth -
Urba
n
Survey
16 - S
outh
- Urba
n
Survey
18 - N
orth -
Sub
urban
/ Rura
l
Case s
tudy 1
- Sou
th - U
rban
Case s
tudy 2
- Nort
h - S
uburb
an
Case s
tudy 3
- Cen
tral -
Rural/S
uburb
an
Case s
tudy 4
- Nort
h - R
ural
Survey
5 - S
outh
- Sub
urban
/ Rura
l
One-Stop
Cos
t per
Bus
ines
s Se
rvic
es W
orks
hop
Figure III-102: Volume of Business Services Workshops
0
20
40
60
80
100
120
Survey
14 - S
outh
- Urba
n
Survey
17 - S
outh
- Urba
n
Survey
13 - S
outh
- Sub
urban
Survey
9 - C
entra
l - Urba
n
Survey
15 - S
outh
- Urba
n
Survey
1 - C
entra
l - Rura
l
Survey
12 - S
outh
- Urba
n
Survey
5 - S
outh
- Sub
urban
/ Rura
l
Survey
6 - S
outh
- Sub
urban
Survey
10 - N
orth -
Sub
urban
Survey
11 - N
orth -
Urba
n
Survey
16 - S
outh
- Urba
n
Survey
18 - N
orth -
Sub
urban
/ Rura
l
Survey
2 - S
outh
- Rura
l
Survey
3 - N
orth -
Rura
l
Survey
4 - N
orth -
Urba
n / R
ural
Survey
7 - C
entra
l - Rura
l
Survey
8 - C
entra
l - Urba
n
Case s
tudy 1
- Sou
th - U
rban
Case s
tudy 2
- Nort
h - S
uburb
an
Case s
tudy 3
- Cen
tral -
Rural/S
uburb
an
Case s
tudy 4
- Nort
h - R
ural
One-Stop
Bus
ines
s Se
rvic
es -
Num
ber o
f Wor
ksho
ps
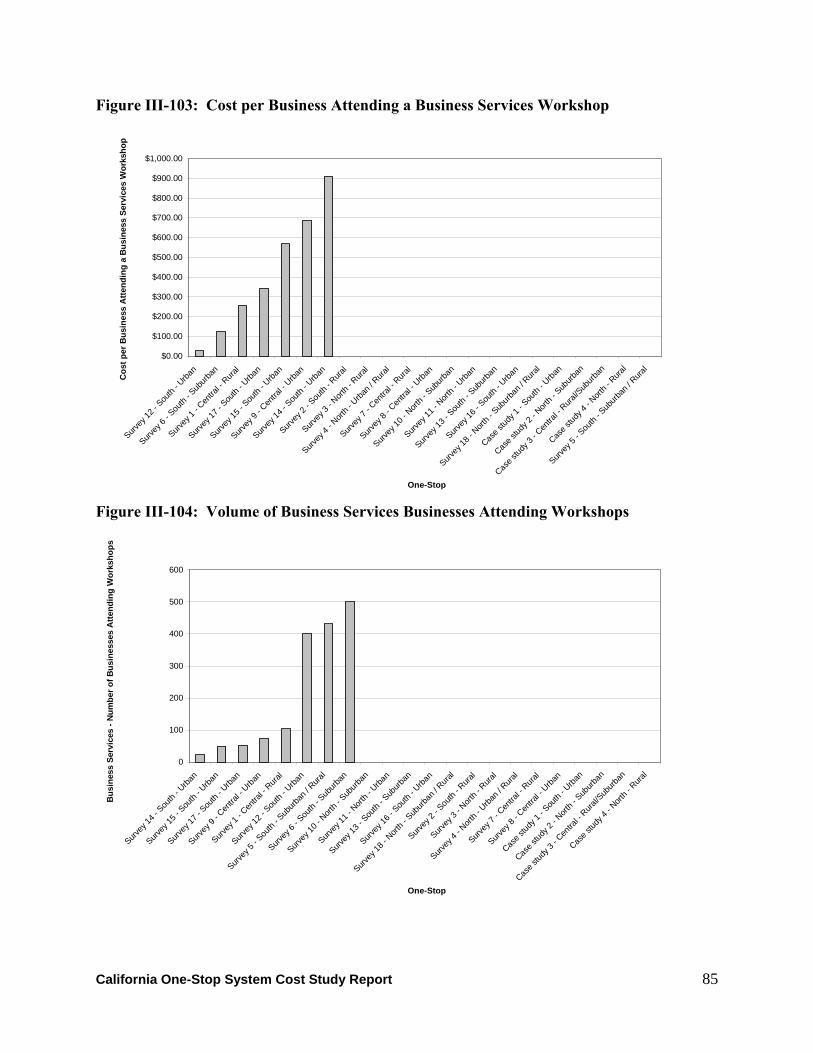
California One-Stop System Cost Study Report
85
Figure III-103: Cost per Business Attending a Business Services Workshop
$0.00
$100.00
$200.00
$300.00
$400.00
$500.00
$600.00
$700.00
$800.00
$900.00
$1,000.00
Survey
12 - S
outh
- Urba
n
Survey
6 - S
outh
- Sub
urban
Survey
1 - C
entra
l - Rura
l
Survey
17 - S
outh
- Urba
n
Survey
15 - S
outh
- Urba
n
Survey
9 - C
entra
l - Urba
n
Survey
14 - S
outh
- Urba
n
Survey
2 - S
outh
- Rura
l
Survey
3 - N
orth -
Rura
l
Survey
4 - N
orth -
Urba
n / R
ural
Survey
7 - C
entra
l - Rura
l
Survey
8 - C
entra
l - Urba
n
Survey
10 - N
orth -
Sub
urban
Survey
11 - N
orth -
Urba
n
Survey
13 - S
outh
- Sub
urban
Survey
16 - S
outh
- Urba
n
Survey
18 - N
orth -
Sub
urban
/ Rura
l
Case s
tudy 1
- Sou
th - U
rban
Case s
tudy 2
- Nort
h - S
uburb
an
Case s
tudy 3
- Cen
tral -
Rural/S
uburb
an
Case s
tudy 4
- Nort
h - R
ural
Survey
5 - S
outh
- Sub
urban
/ Rura
l
One-Stop
Cos
t per
Bus
ines
s A
ttend
ing
a B
usin
ess
Serv
ices
Wor
ksho
p
Figure III-104: Volume of Business Services Businesses Attending Workshops
0
100
200
300
400
500
600
Survey
14 - S
outh
- Urba
n
Survey
15 - S
outh
- Urba
n
Survey
17 - S
outh
- Urba
n
Survey
9 - C
entra
l - Urba
n
Survey
1 - C
entra
l - Rura
l
Survey
12 - S
outh
- Urba
n
Survey
5 - S
outh
- Sub
urban
/ Rura
l
Survey
6 - S
outh
- Sub
urban
Survey
10 - N
orth -
Sub
urban
Survey
11 - N
orth -
Urba
n
Survey
13 - S
outh
- Sub
urban
Survey
16 - S
outh
- Urba
n
Survey
18 - N
orth -
Sub
urban
/ Rura
l
Survey
2 - S
outh
- Rura
l
Survey
3 - N
orth -
Rura
l
Survey
4 - N
orth -
Urba
n / R
ural
Survey
7 - C
entra
l - Rura
l
Survey
8 - C
entra
l - Urba
n
Case s
tudy 1
- Sou
th - U
rban
Case s
tudy 2
- Nort
h - S
uburb
an
Case s
tudy 3
- Cen
tral -
Rural/S
uburb
an
Case s
tudy 4
- Nort
h - R
ural
One-Stop
Bus
ines
s Se
rvic
es -
Num
ber o
f Bus
ines
ses
Atte
ndin
g W
orks
hops

California One-Stop System Cost Study Report
86
Figure III-105: Cost per Business Receiving Consulting Services
$0.00
$200.00
$400.00
$600.00
$800.00
$1,000.00
$1,200.00
Survey
6 - S
outh
- Sub
urban
Case s
tudy 4
- Nort
h - R
ural
Survey
14 - S
outh
- Urba
n
Survey
15 - S
outh
- Urba
n
Survey
13 - S
outh
- Sub
urban
Survey
17 - S
outh
- Urba
n
Survey
7 - C
entra
l - Rura
l
Survey
1 - C
entra
l - Rura
l
Survey
9 - C
entra
l - Urba
n
Survey
18 - N
orth -
Sub
urban
/ Rura
l
Survey
2 - S
outh
- Rura
l
Survey
3 - N
orth -
Rura
l
Survey
4 - N
orth -
Urba
n / R
ural
Survey
8 - C
entra
l - Urba
n
Survey
10 - N
orth -
Suburb
an
Survey
11 - N
orth -
Urba
n
Survey
12 - S
outh
- Urba
n
Case s
tudy 1
- Sou
th - U
rban
Case s
tudy 2
- Nort
h - S
uburb
an
Case s
tudy 3
- Cen
tral -
Rural/S
uburb
an
Survey
5 - S
outh
- Sub
urban
/ Rura
l
Survey
16 - S
outh
- Urba
n
One-Stop
Cos
t per
Bus
ines
s R
ecei
ving
Con
sulti
ng S
ervi
ces
Figure III-106: Volume of Businesses Receiving Consulting Services
0
500
1,000
1,500
2,000
2,500
3,000
Survey
18 - N
orth -
Sub
urban
/ Rura
l
Survey
16 - S
outh
- Urba
n
Survey
9 - C
entra
l - Urba
n
Survey
17 - S
outh
- Urba
n
Survey
7 - C
entra
l - Rura
l
Survey
15 - S
outh
- Urba
n
Survey
13 - S
outh
- Sub
urban
Survey
1 - C
entra
l - Rura
l
Survey
14 - S
outh
- Urba
n
Case s
tudy 4
- Nort
h - R
ural
Survey
5 - S
outh
- Sub
urban
/ Rura
l
Case s
tudy 3
- Cen
tral -
Rural/S
uburb
an
Survey
6 - S
outh
- Sub
urban
Survey
10 - N
orth -
Sub
urban
Survey
11 - N
orth -
Urba
n
Survey
12 - S
outh
- Urba
n
Survey
2 - S
outh
- Rura
l
Survey
3 - N
orth -
Rura
l
Survey
4 - N
orth -
Urba
n / R
ural
Survey
8 - C
entra
l - Urba
n
Case s
tudy 1
- Sou
th - U
rban
Case s
tudy 2
- Nort
h - S
uburb
an
One-Stop
Bus
ines
s Se
rvic
es -
Num
ber o
f Bus
ines
ses
Rec
eivi
ng C
onsu
lting
Ser
vice
s
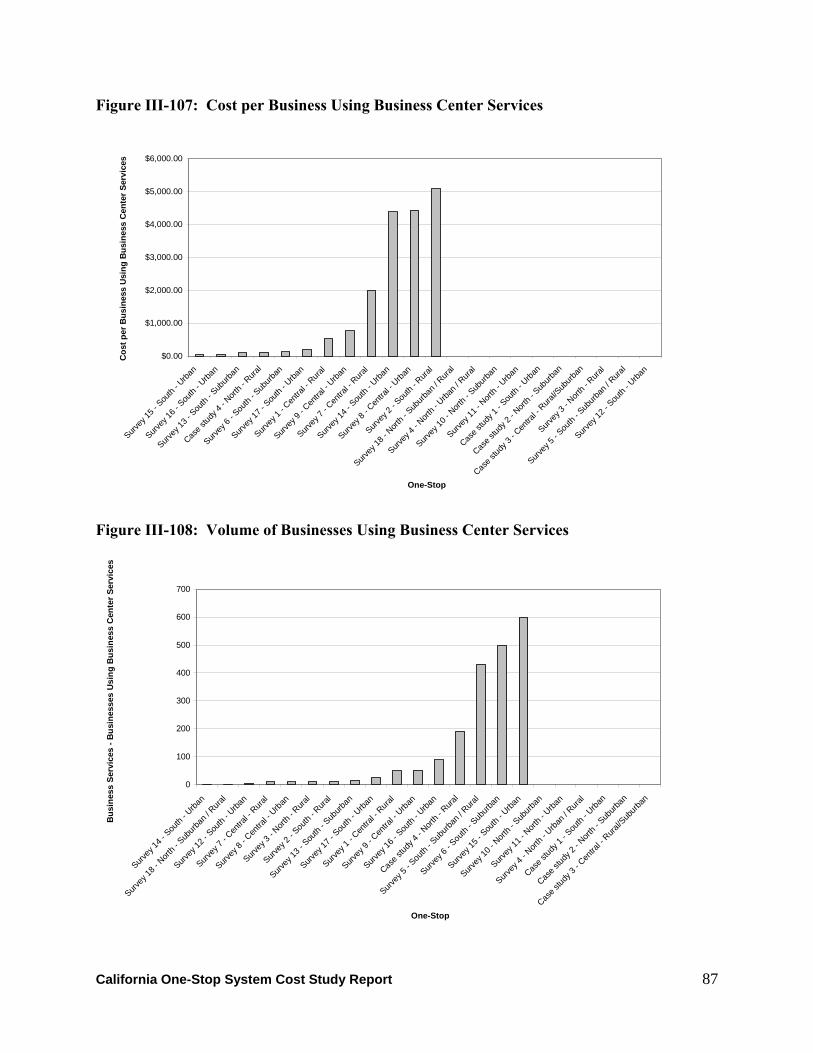
California One-Stop System Cost Study Report
87
Figure III-107: Cost per Business Using Business Center Services
$0.00
$1,000.00
$2,000.00
$3,000.00
$4,000.00
$5,000.00
$6,000.00
Survey
15 - S
outh
- Urba
n
Survey
16 - S
outh
- Urba
n
Survey
13 - S
outh
- Sub
urban
Case s
tudy 4
- Nort
h - R
ural
Survey
6 - S
outh
- Sub
urban
Survey
17 - S
outh
- Urba
n
Survey
1 - C
entra
l - Rura
l
Survey
9 - C
entra
l - Urba
n
Survey
7 - C
entra
l - Rura
l
Survey
14 - S
outh
- Urba
n
Survey
8 - C
entra
l - Urba
n
Survey
2 - S
outh
- Rura
l
Survey
18 - N
orth -
Sub
urban
/ Rura
l
Survey
4 - N
orth -
Urba
n / R
ural
Survey
10 - N
orth -
Sub
urban
Survey
11 - N
orth -
Urba
n
Case s
tudy 1
- Sou
th - U
rban
Case s
tudy 2
- Nort
h - S
uburb
an
Case s
tudy 3
- Cen
tral -
Rural/S
uburb
an
Survey
3 - N
orth -
Rura
l
Survey
5 - S
outh
- Sub
urban
/ Rura
l
Survey
12 - S
outh
- Urba
n
One-Stop
Cos
t per
Bus
ines
s U
sing
Bus
ines
s C
ente
r Ser
vice
s
Figure III-108: Volume of Businesses Using Business Center Services
0
100
200
300
400
500
600
700
Survey
14 - S
outh
- Urba
n
Survey
18 - N
orth -
Sub
urban
/ Rura
l
Survey
12 - S
outh
- Urba
n
Survey
7 - C
entra
l - Rura
l
Survey
8 - C
entra
l - Urba
n
Survey
3 - N
orth -
Rura
l
Survey
2 - S
outh
- Rura
l
Survey
13 - S
outh
- Sub
urban
Survey
17 - S
outh
- Urba
n
Survey
1 - C
entra
l - Rura
l
Survey
9 - C
entra
l - Urba
n
Survey
16 - S
outh
- Urba
n
Case s
tudy 4
- Nort
h - R
ural
Survey
5 - S
outh
- Sub
urban
/ Rura
l
Survey
6 - S
outh
- Sub
urban
Survey
15 - S
outh
- Urba
n
Survey
10 - N
orth -
Suburb
an
Survey
11 - N
orth -
Urba
n
Survey
4 - N
orth -
Urba
n / R
ural
Case s
tudy 1
- Sou
th - U
rban
Case s
tudy 2
- Nort
h - S
uburb
an
Case s
tudy 3
- Cen
tral -
Rural/S
uburb
an
One-Stop
Bus
ines
s Se
rvic
es -
Bus
ines
ses
Usi
ng B
usin
ess
Cen
ter S
ervi
ces

California One-Stop System Cost Study Report
88
Figure III-109: Cost per Business Services: Job Developed
$0.00
$200.00
$400.00
$600.00
$800.00
$1,000.00
$1,200.00
Survey
14 - S
outh
- Urba
n
Survey
1 - C
entra
l - Rura
l
Survey
15 - S
outh
- Urba
n
Survey
6 - S
outh
- Sub
urban
Survey
18 - N
orth -
Sub
urban
/ Rura
l
Survey
2 - S
outh
- Rura
l
Survey
16 - S
outh
- Urba
n
Survey
9 - C
entra
l - Urba
n
Case s
tudy 1
- Sou
th - U
rban
Survey
13 - S
outh
- Sub
urban
Survey
12 - S
outh
- Urba
n
Survey
17 - S
outh
- Urba
n
Survey
8 - C
entra
l - Urba
n
Survey
3 - N
orth -
Rura
l
Survey
4 - N
orth -
Urba
n / R
ural
Survey
7 - C
entra
l - Rura
l
Survey
10 - N
orth -
Sub
urban
Survey
11 - N
orth -
Urba
n
Case s
tudy 2
- Nort
h - S
uburb
an
Case s
tudy 3
- Cen
tral -
Rural/S
uburb
an
Case s
tudy 4
- Nort
h - R
ural
Survey
5 - S
outh
- Sub
urban
/ Rura
l
One-Stop
Cos
t per
Bus
ines
s Se
rvic
es: J
ob D
evel
oped
Figure III-110: Volume of Business Services: Jobs Developed
0
1,000
2,000
3,000
4,000
5,000
6,000
Survey
17 - S
outh
- Urba
n
Survey
8 - C
entra
l - Urba
n
Survey
12 - S
outh
- Urba
n
Survey
1 - C
entra
l - Rura
l
Survey
13 - S
outh
- Sub
urban
Case s
tudy 1
- Sou
th - U
rban
Survey
16 - S
outh
- Urba
n
Survey
18 - N
orth -
Sub
urban
/ Rura
l
Survey
2 - S
outh
- Rura
l
Survey
9 - C
entra
l - Urba
n
Survey
14 - S
outh
- Urba
n
Survey
15 - S
outh
- Urba
n
Survey
5 - S
outh
- Sub
urban
/ Rura
l
Survey
6 - S
outh
- Sub
urban
Survey
10 - N
orth -
Sub
urban
Survey
11 - N
orth -
Urba
n
Survey
3 - N
orth -
Rura
l
Survey
4 - N
orth -
Urba
n / R
ural
Survey
7 - C
entra
l - Rura
l
Case s
tudy 2
- Nort
h - S
uburb
an
Case s
tudy 3
- Cen
tral -
Rural/S
uburb
an
Case s
tudy 4
- Nort
h - R
ural
One-Stop
Bus
ines
s Se
rvic
es -
Num
ber o
f Job
s D
evel
oped

California One-Stop System Cost Study Report
89
Youth Services
Half the One-Stops surveyed had a youth program under their roof, so our measures in this process are more limited and more variable. We saw two key cost-per indicators here. The first was the cost per youth served, which is simply the total number of youth served divided by the total cost of the youth process. The second was the cost of placing a youth in any type of employment experience. The median cost per youth receiving services was $3,837 substantially higher than the median cost for enrolled adults. The costs varied widely from only $546 to over $20,000, but most sites had costs between $2,000 and $7,000 per youth. Again the wide variation in volume of service delivered may account for the different costs in large part. The median cost per youth who got placed in some type of employment (work experience, summer job, and regular employment) was $2,526. The median cost of providing a case management and counseling to youth as $1,260, with a wide range, showing again the intensity of these services probably varies a great deal from site to site. College preparation was a more costly item, median cost per youth of $3,350 because relatively few youth participated. Providing academic support had a median cost of $1,425 per youth. Finally following up youth cost $522 per youth. Table III-9: Youth Services: Median Costs and Range Per-Unit of Service Service Unit Median Cost Per Range Per Youth Served $3,837 $546 - $20,178 Per Youth Placed in Employment $2,526 $617 - $6,328 Per Youth receiving Counseling,
Case Management, Supportive Services
$1,260 $28 - $5,709
Per Youth Participating in a College Preparation Event
$3,350 $32 - $4,976
Per Youth Participating in Academic Support
$1,426 $265 - $5,825
Per Youth Followed-up $522 $146 - $2,468
Again, the following graphs provide a complete distribution of costs and volume of service for the site which had youth programs.

California One-Stop System Cost Study Report
90
Figure III-111: Cost per Youth Served
$0.00
$5,000.00
$10,000.00
$15,000.00
$20,000.00
$25,000.00
Survey
5 - S
outh
- Sub
urban
/ Rura
l
Survey
4 - N
orth -
Urba
n / R
ural
Survey
6 - S
outh
- Sub
urban
Survey
8 - C
entra
l - Urba
n
Survey
7 - C
entra
l - Rura
l
Survey
3 - N
orth -
Rura
l
Survey
18 - N
orth -
Sub
urban
/ Rura
l
Survey
16 - S
outh
- Urba
n
Survey
15 - S
outh
- Urba
n
Survey
13 - S
outh
- Sub
urban
Survey
9 - C
entra
l - Urba
n
Survey
12 - S
outh
- Urba
n
Case s
tudy 1
- Sou
th - U
rban
Case s
tudy 2
- Nort
h - S
uburb
an
Case s
tudy 3
- Cen
tral -
Rural/S
uburb
an
Case s
tudy 4
- Nort
h - R
ural
Survey
1 - C
entra
l - Rura
l
Survey
2 - S
outh
- Rura
l
Survey
10 - N
orth -
Sub
urban
Survey
11 - N
orth -
Urba
n
Survey
14 - S
outh
- Urba
n
One-Stop
Cos
t per
You
th S
erve
d
Figure III-112: Volume of Youth Served
0
100
200
300
400
500
600
700
800
900
Survey
12 - S
outh
- Urba
n
Survey
15 - S
outh
- Urba
n
Survey
13 - S
outh
- Sub
urban
Survey
3 - N
orth -
Rura
l
Survey
16 - S
outh
- Urba
n
Survey
8 - C
entra
l - Urba
n
Survey
18 - N
orth -
Sub
urban
/ Rura
l
Survey
9 - C
entra
l - Urba
n
Survey
4 - N
orth -
Urba
n / R
ural
Survey
7 - C
entra
l - Rura
l
Survey
6 - S
outh
- Sub
urban
Survey
5 - S
outh
- Sub
urban
/ Rura
l
Survey
1 - C
entra
l - Rura
l
Survey
10 - N
orth -
Sub
urban
Survey
11 - N
orth -
Urba
n
Survey
14 - S
outh
- Urba
n
Survey
17 - S
outh
- Urba
n
Survey
2 - S
outh
- Rura
l
Case s
tudy 1
- Sou
th - U
rban
Case s
tudy 2
- Nort
h - S
uburb
an
Case s
tudy 3
- Cen
tral -
Rural/S
uburb
an
Case s
tudy 4
- Nort
h - R
ural
One-Stop
Yout
h - N
umbe
r Ser
ved

California One-Stop System Cost Study Report
91
Figure III-113: Cost per Youth Placed in Any Employment
$0.00
$1,000.00
$2,000.00
$3,000.00
$4,000.00
$5,000.00
$6,000.00
$7,000.00
Survey
16 - S
outh
- Urba
n
Survey
8 - C
entra
l - Urba
n
Survey
7 - C
entra
l - Rura
l
Survey
15 - S
outh
- Urba
n
Survey
5 - S
outh
- Sub
urban
/ Rura
l
Survey
18 - N
orth -
Sub
urban
/ Rura
l
Survey
3 - N
orth -
Rura
l
Survey
9 - C
entra
l - Urba
n
Survey
4 - N
orth -
Urba
n / R
ural
Survey
13 - S
outh
- Sub
urban
Survey
12 - S
outh
- Urba
n
Survey
1 - C
entra
l - Rura
l
Survey
2 - S
outh
- Rura
l
Survey
6 - S
outh
- Sub
urban
Survey
10 - N
orth -
Suburb
an
Survey
11 - N
orth -
Urba
n
Survey
14 - S
outh
- Urba
n
Survey
17 - S
outh
- Urba
n
Case s
tudy 1
- Sou
th - U
rban
Case s
tudy 2
- Nort
h - S
uburb
an
Case s
tudy 3
- Cen
tral -
Rural/S
uburb
an
Case s
tudy 4
- Nort
h - R
ural
One-Stop
Cos
t per
You
th P
lace
d in
Any
Em
ploy
men
t
Figure III-114: Volume of Youth Placed in Any Employment
0
20
40
60
80
100
120
140
160
180
Survey
12 - S
outh
- Urba
n
Survey
3 - N
orth -
Rura
l
Survey
5 - S
outh
- Sub
urban
/ Rura
l
Survey
13 - S
outh
- Sub
urban
Survey
15 - S
outh
- Urba
n
Survey
8 - C
entra
l - Urba
n
Survey
4 - N
orth -
Urba
n / R
ural
Survey
16 - S
outh
- Urba
n
Survey
18 - N
orth -
Sub
urban
/ Rura
l
Survey
9 - C
entra
l - Urba
n
Survey
7 - C
entra
l - Rura
l
Survey
1 - C
entra
l - Rura
l
Survey
10 - N
orth -
Suburb
an
Survey
11 - N
orth -
Urba
n
Survey
14 - S
outh
- Urba
n
Survey
17 - S
outh
- Urba
n
Survey
2 - S
outh
- Rura
l
Survey
6 - S
outh
- Sub
urban
Case s
tudy 1
- Sou
th - U
rban
Case s
tudy 2
- Nort
h - S
uburb
an
Case s
tudy 3
- Cen
tral -
Rural/S
uburb
an
Case s
tudy 4
- Nort
h - R
ural
One-Stop
Yout
h - N
umbe
r Pla
ced
in A
ny E
mpl
oym
ent

California One-Stop System Cost Study Report
92
Figure III-115: Cost per Youth Receiving Counseling, Case Management Supportive Services
$0.00
$1,000.00
$2,000.00
$3,000.00
$4,000.00
$5,000.00
$6,000.00
Survey
4 - N
orth -
Urba
n / R
ural
Survey
5 - S
outh
- Sub
urban
/ Rura
l
Survey
16 - S
outh
- Urba
n
Survey
7 - C
entra
l - Rura
l
Survey
6 - S
outh
- Sub
urban
Survey
8 - C
entra
l - Urba
n
Survey
18 - N
orth -
Sub
urban
/ Rura
l
Survey
3 - N
orth -
Rura
l
Survey
13 - S
outh
- Sub
urban
Survey
15 - S
outh
- Urba
n
Survey
9 - C
entra
l - Urba
n
Survey
12 - S
outh
- Urba
n
Survey
1 - C
entra
l - Rura
l
Survey
2 - S
outh
- Rura
l
Survey
10 - N
orth -
Sub
urban
Survey
11 - N
orth -
Urba
n
Survey
14 - S
outh
- Urba
n
Survey
17 - S
outh
- Urba
n
Case s
tudy 1
- Sou
th - U
rban
Case s
tudy 2
- Nort
h - S
uburb
an
Case s
tudy 3
- Cen
tral -
Rural/S
uburb
an
Case s
tudy 4
- Nort
h - R
ural
One-Stop
Cos
t per
You
th R
ecei
ving
Cou
nsel
ing,
Cas
e M
anag
emen
t Sup
port
ive
Serv
ices
Figure III-116: Volume of Youth Receiving Counseling, Case Management Supportive Services
0
100
200
300
400
500
600
700
800
900
Survey
12 - S
outh
- Urba
n
Survey
15 - S
outh
- Urba
n
Survey
13 - S
outh
- Sub
urban
Survey
3 - N
orth -
Rura
l
Survey
16 - S
outh
- Urba
n
Survey
8 - C
entra
l - Urba
n
Survey
18 - N
orth -
Sub
urban
/ Rura
l
Survey
9 - C
entra
l - Urba
n
Survey
4 - N
orth -
Urba
n / R
ural
Survey
7 - C
entra
l - Rura
l
Survey
6 - S
outh
- Sub
urban
Survey
5 - S
outh
- Sub
urban
/ Rura
l
Survey
1 - C
entra
l - Rura
l
Survey
10 - N
orth -
Sub
urban
Survey
11 - N
orth -
Urba
n
Survey
14 - S
outh
- Urba
n
Survey
17 - S
outh
- Urba
n
Survey
2 - S
outh
- Rura
l
Case s
tudy 1
- Sou
th - U
rban
Case s
tudy 2
- Nort
h - S
uburb
an
Case s
tudy 3
- Cen
tral -
Rural/S
uburb
an
Case s
tudy 4
- Nort
h - R
ural
One-Stop
Yout
h - N
umbe
r Rec
eivi
ng C
ouns
elin
g, C
ase
Man
agem
ent S
uppo
rtiv
e Se
rvic
es

California One-Stop System Cost Study Report
93
Figure III-117: Cost per Youth Participating in a College Preparation Event
$0.00
$500.00
$1,000.00
$1,500.00
$2,000.00
$2,500.00
$3,000.00
$3,500.00
$4,000.00
$4,500.00
$5,000.00
Survey
7 - C
entra
l - Rura
l
Survey
6 - S
outh
- Sub
urban
Survey
5 - S
outh
- Sub
urban
/ Rura
l
Survey
9 - C
entra
l - Urba
n
Survey
12 - S
outh
- Urba
n
Survey
13 - S
outh
- Sub
urban
Survey
1 - C
entra
l - Rura
l
Survey
2 - S
outh
- Rura
l
Survey
3 - N
orth -
Rura
l
Survey
4 - N
orth -
Urba
n / R
ural
Survey
8 - C
entra
l - Urba
n
Survey
10 - N
orth -
Sub
urban
Survey
11 - N
orth -
Urba
n
Survey
14 - S
outh
- Urba
n
Survey
15 - S
outh
- Urba
n
Survey
16 - S
outh
- Urba
n
Survey
17 - S
outh
- Urba
n
Survey
18 - N
orth -
Sub
urban
/ Rura
l
Case s
tudy 1
- Sou
th - U
rban
Case s
tudy 2
- Nort
h - S
uburb
an
Case s
tudy 3
- Cen
tral -
Rural/S
uburb
an
Case s
tudy 4
- Nort
h - R
ural
One-Stop
Cos
t per
You
th P
artic
ipat
ing
in a
Col
lege
Pre
para
tion
Even
t
Figure III-118: Volume of Youth Participating in a College Preparation Event
0
20
40
60
80
100
120
140
Survey
13 - S
outh
- Sub
urban
Survey
12 - S
outh
- Urba
n
Survey
5 - S
outh
- Sub
urban
/ Rura
l
Survey
6 - S
outh
- Sub
urban
Survey
9 - C
entra
l - Urba
n
Survey
7 - C
entra
l - Rura
l
Survey
1 - C
entra
l - Rura
l
Survey
10 - N
orth -
Suburb
an
Survey
11 - N
orth -
Urba
n
Survey
14 - S
outh
- Urba
n
Survey
15 - S
outh
- Urba
n
Survey
16 - S
outh
- Urba
n
Survey
17 - S
outh
- Urba
n
Survey
18 - N
orth -
Suburb
an / R
ural
Survey
2 - S
outh
- Rura
l
Survey
3 - N
orth -
Rura
l
Survey
4 - N
orth -
Urba
n / Rura
l
Survey
8 - C
entra
l - Urba
n
Case s
tudy 1
- Sou
th - U
rban
Case s
tudy 2
- Nort
h - Sub
urban
Case s
tudy 3
- Cen
tral -
Rural/S
uburb
an
Case s
tudy 4
- Nort
h - R
ural
One-Stop
Yout
h - N
umbe
r Par
ticip
atin
g in
a C
olle
ge P
repa
ratio
n Ev
ent

California One-Stop System Cost Study Report
94
Figure III-119: Cost per Youth Participating in Academic Support
$0.00
$1,000.00
$2,000.00
$3,000.00
$4,000.00
$5,000.00
$6,000.00
Survey
7 - C
entra
l - Rura
l
Survey
8 - C
entra
l - Urba
n
Survey
6 - S
outh
- Sub
urban
Survey
5 - S
outh
- Sub
urban
/ Rura
l
Survey
9 - C
entra
l - Urba
n
Survey
12 - S
outh
- Urba
n
Survey
13 - S
outh
- Sub
urban
Survey
1 - C
entra
l - Rura
l
Survey
2 - S
outh
- Rura
l
Survey
3 - N
orth -
Rura
l
Survey
4 - N
orth -
Urba
n / R
ural
Survey
10 - N
orth -
Suburb
an
Survey
11 - N
orth -
Urba
n
Survey
14 - S
outh
- Urba
n
Survey
15 - S
outh
- Urba
n
Survey
17 - S
outh
- Urba
n
Survey
18 - N
orth -
Sub
urban
/ Rura
l
Case s
tudy 1
- Sou
th - U
rban
Case s
tudy 2
- Nort
h - S
uburb
an
Case s
tudy 3
- Cen
tral -
Rural/S
uburb
an
Case s
tudy 4
- Nort
h - R
ural
Survey
16 - S
outh
- Urba
n
One-Stop
Cos
t per
You
th P
artic
ipat
ing
in A
cade
mic
Sup
port
Figure III-120: Volume of Youth Participating in Academic Support
0
20
40
60
80
100
120
140
160
180
200
Survey
13 - S
outh
- Sub
urban
Survey
12 - S
outh
- Urba
n
Survey
5 - S
outh
- Sub
urban
/ Rura
l
Survey
16 - S
outh
- Urba
n
Survey
8 - C
entra
l - Urba
n
Survey
6 - S
outh
- Sub
urban
Survey
9 - C
entra
l - Urba
n
Survey
7 - C
entra
l - Rura
l
Survey
1 - C
entra
l - Rura
l
Survey
10 - N
orth -
Sub
urban
Survey
11 - N
orth -
Urba
n
Survey
14 - S
outh
- Urba
n
Survey
15 - S
outh
- Urba
n
Survey
17 - S
outh
- Urba
n
Survey
18 - N
orth -
Sub
urban
/ Rura
l
Survey
2 - S
outh
- Rura
l
Survey
3 - N
orth -
Rura
l
Survey
4 - N
orth -
Urba
n / R
ural
Case s
tudy 1
- Sou
th - U
rban
Case s
tudy 2
- Nort
h - S
uburb
an
Case s
tudy 3
- Cen
tral -
Rural/S
uburb
an
Case s
tudy 4
- Nort
h - R
ural
One-Stop
Yout
h - N
umbe
r of Y
outh
Par
ticip
atin
g in
Aca
dem
ic S
uppo
rt
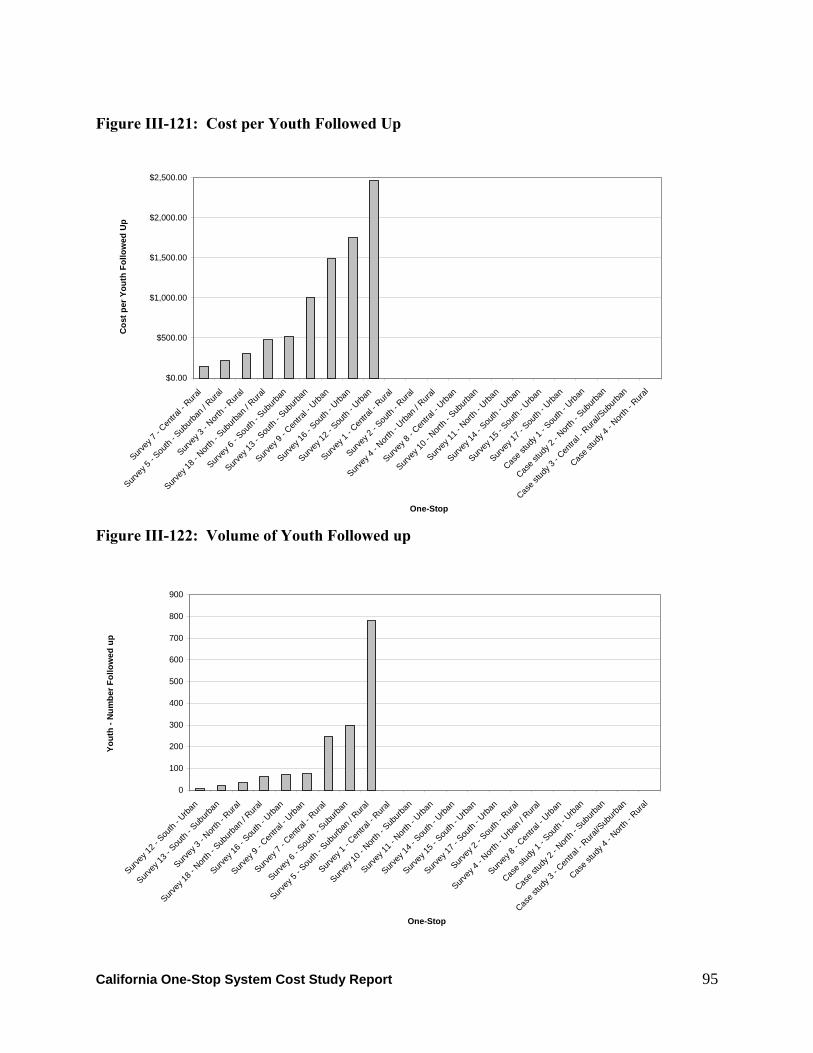
California One-Stop System Cost Study Report
95
Figure III-121: Cost per Youth Followed Up
$0.00
$500.00
$1,000.00
$1,500.00
$2,000.00
$2,500.00
Survey
7 - C
entra
l - Rura
l
Survey
5 - S
outh
- Sub
urban
/ Rura
l
Survey
3 - N
orth -
Rura
l
Survey
18 - N
orth -
Sub
urban
/ Rura
l
Survey
6 - S
outh
- Sub
urban
Survey
13 - S
outh
- Sub
urban
Survey
9 - C
entra
l - Urba
n
Survey
16 - S
outh
- Urba
n
Survey
12 - S
outh
- Urba
n
Survey
1 - C
entra
l - Rura
l
Survey
2 - S
outh
- Rura
l
Survey
4 - N
orth -
Urba
n / R
ural
Survey
8 - C
entra
l - Urba
n
Survey
10 - N
orth -
Sub
urban
Survey
11 - N
orth -
Urba
n
Survey
14 - S
outh
- Urba
n
Survey
15 - S
outh
- Urba
n
Survey
17 - S
outh
- Urba
n
Case s
tudy 1
- Sou
th - U
rban
Case s
tudy 2
- Nort
h - S
uburb
an
Case s
tudy 3
- Cen
tral -
Rural/S
uburb
an
Case s
tudy 4
- Nort
h - R
ural
One-Stop
Cos
t per
You
th F
ollo
wed
Up
Figure III-122: Volume of Youth Followed up
0
100
200
300
400
500
600
700
800
900
Survey
12 - S
outh
- Urba
n
Survey
13 - S
outh
- Sub
urban
Survey
3 - N
orth -
Rura
l
Survey
18 - N
orth -
Sub
urban
/ Rura
l
Survey
16 - S
outh
- Urba
n
Survey
9 - C
entra
l - Urba
n
Survey
7 - C
entra
l - Rura
l
Survey
6 - S
outh
- Sub
urban
Survey
5 - S
outh
- Sub
urban
/ Rura
l
Survey
1 - C
entra
l - Rura
l
Survey
10 - N
orth -
Sub
urban
Survey
11 - N
orth -
Urba
n
Survey
14 - S
outh
- Urba
n
Survey
15 - S
outh
- Urba
n
Survey
17 - S
outh
- Urba
n
Survey
2 - S
outh
- Rura
l
Survey
4 - N
orth -
Urba
n / R
ural
Survey
8 - C
entra
l - Urba
n
Case s
tudy 1
- Sou
th - U
rban
Case s
tudy 2
- Nort
h - S
uburb
an
Case s
tudy 3
- Cen
tral -
Rural/S
uburb
an
Case s
tudy 4
- Nort
h - R
ural
One-Stop
Yout
h - N
umbe
r Fol
low
ed u
p
California One-Stop System Cost Study Report
96
IV Conclusions As we noted before, this project is the first Activity Based Cost Accounting (ABC) analysis of One-Stops Career Center (One-Stops) and their finances, and as such this project raises as many questions as it answers. Our goal was not to evaluate how the One-Stops manage their costs but to describe objectively what is happening in the field in terms of operations and finances. Here we present our conclusions about One-Stops and their costs that emerged from our research.
• Traditional federal, state and local funding streams still drive how One-Stops conceptualize costs and services.
While One-Stops are charged with bringing together a host of federal, state and local programs, they still must account separately for the money received from and the services produced for each program. The system brings together several programmatic responsibility centers, independently managed to accomplish specific goals. So a client served by multiple programs will be counted multiple times, and will often have multiple records. There is no unified accounting of costs incurred under the One-Stop roof. To make a reasonable accounting of costs, we often had to contact six or seven partner agencies who themselves did not know what they had spent in the One-Stop since they often deliver their services in-kind by locating staff in the One-Stop or by delivering services such as a workshop in the One-Stop. We had to take these partners through the steps of estimating the costs they incurred in the One-Stop to get a full accounting of their costs. So we found, literally, at every site that no one knew what the total costs of operating the One-Stop were. Similarly, partners often report the services they produced to managers not attached to the One-Stop and not to the One-Stop manager. One-Stop and non-One-Stop activities were often co-mingled, so if a community college counselor enrolls students at the One-Stop those enrollments will be reported to the Community College but often not to the One-Stop Manager.
This arrangement creates rigidities in operating the One-Stops. It is not realistic to expect One-Stop managers to make cost efficient decisions when they don’t know their costs and don’t control all the resources under their roof. Similarly, we found mangers often don’t know all the activities that are taking place in the One-Stop or what services were produced by partners. We found a number of managers and fiscal staff who had difficulty understanding the ABC framework and the analysis and information it would produce.
• There are few standard measures for units of service produced.
We found that each One-Stop had their own methods for counting, or frankly, not counting the services produced. Different One-Stops had invested in different client tracking software and had a wide variety of paper and pencil tracking systems for measuring services produced. Complicating this is the reality that One-Stops and their partners must report to a variety of funding sources each with their own requirements. To calculate the total volume of service produced at any One-Stop we needed to collect service data from multiple partners. For example, to get the number of clients receiving case management service we needed to collect the number of clients getting case management in the WIA program, in EDD programs such as the Trade Adjustment Act, in CalWorks program (if it was in the One-Stop) and any other

California One-Stop System Cost Study Report
97
programs that provided case management. At none of the case study sites was there a central location which collected all this data, rather, each program was maintaining the records for their funding stream. Similarly, One-Stops could usually tell us how many businesses they served with WIA funds, but were likely not to know how many businesses were reached by other programs, such as a small business development corporation, if it was in the One-Stop. The capability of One-Stops to produce counts of services delivered varied widely. Some One-Stops, for example, had readily available counts of workshops delivered, with number of attendees, while at other sites staff had to go back through their personal calendars to create a count of workshops and then estimate the number of attendees. We were particularly struck by the fact that the universal process consumed substantial resources at every One-Stop yet there were no performance measures for this aspect of the program, and no standard measures of service produced, not even the simple counting of clients. Fortunately, we found that each One-Stop did have some measures of universal services produced. In two of our case studies, the One-Stops had software for maintaining case records on enrolled clients but the software could not produce a count of the number of case management meetings. Some local areas could not break down WIA performance measures to the individual One-Stops since they are collectively held accountable to the state as a local area, making it impossible to link cost and performance at the One-Stop level. As noted before, business services varied the most, with one site counting every flyer sent out and others having difficulty counting up the number of Rapid Response events that occurred in the year.
• Partner relations vary widely Our analysis showed clearly that partner contributions vary widely. This is largely driven by the strategic decision to co-locate. Most partner relationships appear to be driven by the local context, institutional arrangements and history. For example, in a case where the CalWorks program is co-located with the One-Stop, it is because both the One-Stop and CalWorks are county programs in a small county. Similarly, if there is a history of subcontracting WIA to local Non-profits, many services may take place away from the site. Even if partners are under the One-Stop roof, the actual management of services varies a great deal. We saw some sites where EDD and WIA jointly provided services, and were well integrated and seamless to the client. Managers worked closely together and were aware of each others activities. In another site, WIA and EDD managers seldom spoke, staff of the two agencies worked in separate areas and there was little integration of services.
• One-Stops tend to structure their processes around the WIA program. We did find some substantial commonalities in how One-Stops were structured. Since the WIA program dominated three of the four case study sites, we found the service process was built around the WIA service categories of universal services, registered services (adult and dislocated

California One-Stop System Cost Study Report
98
worker) and business services. Services provided by partners usually fit into one of these processes. For example, if EDD provided a resume writing workshop, it fit naturally in the “universal services process” if it was open to everyone. English-as-a-Second-Language (ESL) classes provided by the local educational agency fit into the “enrolled services process”, as students had to enroll in school to attend the class. If a small business development corporation provided training on business plan writing, that was a natural fit for business services. Thus, despite the wide variance in size, local economic conditions, and partner relations, we found that these processes could be used to classify activities and costs. It is important to note the emphasis and scope of each of these common processes did vary dramatically across the sites, but all three processes were present at each site.
• One-Stop services were customized to local needs. The UC Davis evaluation cited earlier16 found that under WIA local areas did adapt their programs to local conditions. We made a similar observation. The mix and types of services developed within the One-Stops varied based on the community the One-Stop served, while staying with a fairly common framework of the three processes described before. Thus the Central California Urban One-Stop Case Study, which served a large number of agricultural workers, contracted a substantial amount of case management out to a local non-profit that specialized in this population. In the NoCal Rural One-Stop Case Study, where the market is dominated by very small businesses, there was a walk-in service for small business owners. Thus this customization to local needs may account in part for the variation in costs and volume of service we observed.
16 Campbell, et.al. (2006)

California One-Stop System Cost Study Report
99
V Recommendations for Policy and Further Research
One-Stops began with a bold vision of bringing together a host of federal, state, and local programs under one roof, with common goals, to better serve people seeking to improve their lives through education, training or employment. Realizing this vision requires new ways of thinking and managing. Unfortunately, agencies managing One-Stops and their partners are still supported by a traditional system of rigidly separated funding streams and accountability systems. Real integration of services can only be achieved voluntarily at the local level by local WIBs, One-Stop Managers and local partners. Recent research has found that local history and even local personal relationships drives these partnerships17. Given the ad hoc local nature of partnerships and the traditional funding streams that finance One-Stops it is not surprising that most of the One-Stops studied did not have a good grasp on what it cost to produce specific services or how they could most efficiently share costs with partners. Further, these managers have little or no data available on the costs of comparable One-Stops on which to benchmark their performance or identify best practices. The typical One-Stop manager we encountered had no idea if it cost more for her One-Stop to serve a universal client than the next One-Stop down the road. Similarly, One-Stop managers have little information about what factors drive their costs. In short, One-Stop managers are – in a strategic sense—managing in the dark. They do not have reliable and valid fiscal data and the accounting tools to perform effective analysis to improve their performance. Similarly, policymakers at the state and local level are frustrated by a lack of information about costs and partner contributions. Local WIB members work with budgets that cover only a portion of the services actually delivered in their One-Stops and know little about the costs of producing services. This lack of information makes it difficult for them to make strategic choices based on good evidence. The situation at the state level is similar. This study represents a first step towards creating some industry standards for One-Stops that will allow individual One-Stops to systematically measure how they spend their resources and what those resources produce. One-Stop Managers will now have some benchmarks to see if they are generating more support or less support from their partners than their peers. They will be able to know if the services they produce are more costly or less costly than other One-Stops. Policymakers will similarly have a rough picture of how partners contribute to One-Stops, what services One-Stops produce, and at what cost. We believe the analysis produced by this report will provide a foundation for a vigorous discussion on how to improve One-Stop operations and develop effective policies at the state and local level. But this is a first step. Here we recommend some next steps to build on this study. 17 Campbell, et.al. (2006
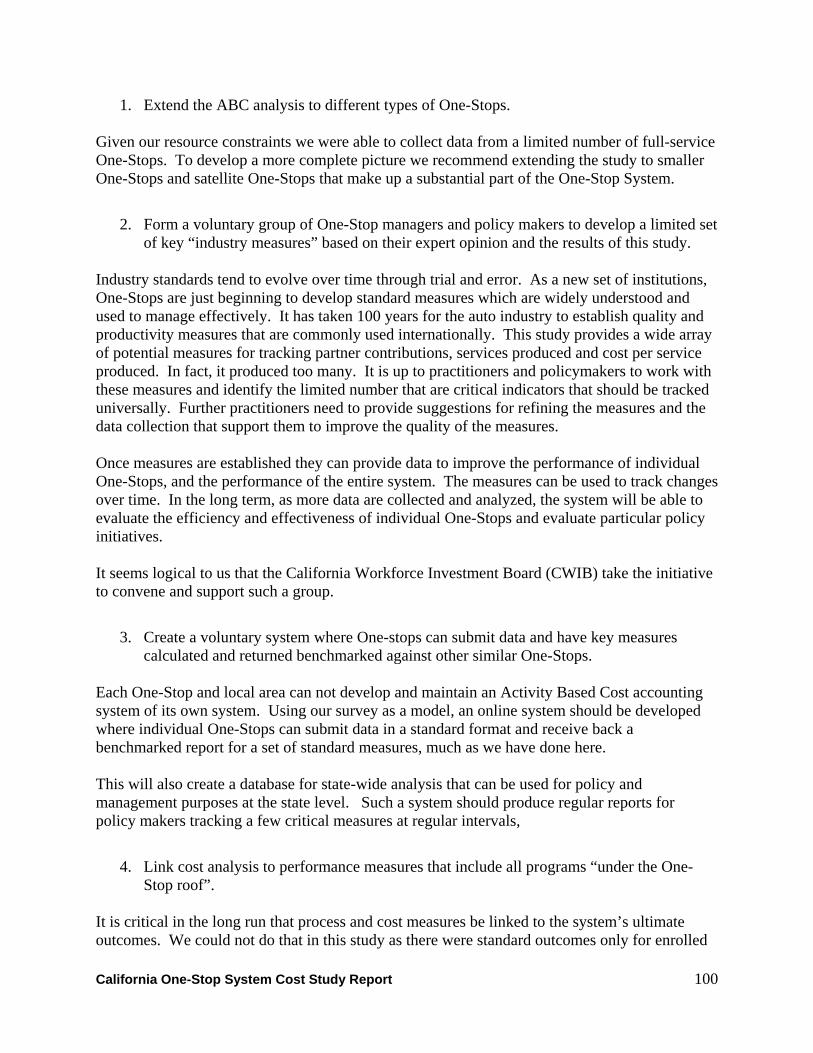
California One-Stop System Cost Study Report
100
1. Extend the ABC analysis to different types of One-Stops. Given our resource constraints we were able to collect data from a limited number of full-service One-Stops. To develop a more complete picture we recommend extending the study to smaller One-Stops and satellite One-Stops that make up a substantial part of the One-Stop System.
2. Form a voluntary group of One-Stop managers and policy makers to develop a limited set of key “industry measures” based on their expert opinion and the results of this study.
Industry standards tend to evolve over time through trial and error. As a new set of institutions, One-Stops are just beginning to develop standard measures which are widely understood and used to manage effectively. It has taken 100 years for the auto industry to establish quality and productivity measures that are commonly used internationally. This study provides a wide array of potential measures for tracking partner contributions, services produced and cost per service produced. In fact, it produced too many. It is up to practitioners and policymakers to work with these measures and identify the limited number that are critical indicators that should be tracked universally. Further practitioners need to provide suggestions for refining the measures and the data collection that support them to improve the quality of the measures. Once measures are established they can provide data to improve the performance of individual One-Stops, and the performance of the entire system. The measures can be used to track changes over time. In the long term, as more data are collected and analyzed, the system will be able to evaluate the efficiency and effectiveness of individual One-Stops and evaluate particular policy initiatives. It seems logical to us that the California Workforce Investment Board (CWIB) take the initiative to convene and support such a group.
3. Create a voluntary system where One-stops can submit data and have key measures calculated and returned benchmarked against other similar One-Stops.
Each One-Stop and local area can not develop and maintain an Activity Based Cost accounting system of its own system. Using our survey as a model, an online system should be developed where individual One-Stops can submit data in a standard format and receive back a benchmarked report for a set of standard measures, much as we have done here. This will also create a database for state-wide analysis that can be used for policy and management purposes at the state level. Such a system should produce regular reports for policy makers tracking a few critical measures at regular intervals,
4. Link cost analysis to performance measures that include all programs “under the One-Stop roof”.
It is critical in the long run that process and cost measures be linked to the system’s ultimate outcomes. We could not do that in this study as there were standard outcomes only for enrolled

California One-Stop System Cost Study Report
101
WIA participants. Participants in Universal services or in other programs did not share the same outcome measures. For example, we could not calculate cost for every universal access client who found a job as we did not how many of the universal clients found a job. The federal government is promoting a system of “common measures” which are to cut across all federal training programs, this is a start. The CWIB should consider developing outcome measures that apply to all participants who pass through a One-Stop and incorporate such measures into a benchmarking system.

California One-Stop System Cost Study Report
102
Appendix A: Other Partner Contributions

California One-Stop System Cost Study Report
103
Table A-1: Partner Presence Across all Sites
EDD Other Local Partner
DOR Local College / University
Other Local School
Local Adult School
HHSA Job Corps
Aging/Adult
AARP SBDC ABLE V.A.
Case Study 1 x x x x Case Study 2 x x x x x Case Study 3 x x x x x Case Study 4 x x x x Survey 1 x x x x x x x x Survey 2 x x x x Survey 3 x x x x x x x Survey 4 x x x x x x x Survey 5 x x x Survey 6 x x x x Survey 7 x x x x x Survey 8 x x Survey 9 x x x x x x Survey 10 x x x x Survey 11 x x Survey 12 x x x x x x Survey 13 x x x x x x x x Survey 14 x x x x x Survey 15 x x x x Survey 16 x x x Survey 17 x x x Survey 18 x x x – denotes partner presence in subject One-Stop

California One-Stop System Cost Study Report
104
Figure A-1: Partner Contribution by One-Stop: Aging & Adult
$8,000 $16,950 $16,950
$150,000
$0
$50,000
$100,000
$150,000
$200,000
$250,000
$300,000
$350,000
$400,000
$450,000
$500,000
Survey 14 - South - Urban Survey 5 - South - Suburban /Rural
Survey 6 - South - Suburban Survey 17 - South - Urban
One-Stop
Agi
ng &
Adu
lt C
ontr
ibut
ion
Figure A-2: Partner Contribution by One-Stop: ABLE
$5,460
$159,519
$0
$50,000
$100,000
$150,000
$200,000
$250,000
$300,000
$350,000
$400,000
$450,000
$500,000
Survey 1 - Central - Rural Survey 13 - South - Suburban
One-Stop
AB
LE C
ontr
ibut
ion

California One-Stop System Cost Study Report
105
Figure A-3: Partner Contribution by One-Stop: SBDC
$900$12,000
$137,612
$0
$50,000
$100,000
$150,000
$200,000
$250,000
$300,000
$350,000
$400,000
$450,000
$500,000
Survey 3 - North - Rural Case study 1 - South - Urban Survey 9 - Central - Urban
One-Stop
SBD
C C
ontr
ibut
ion
Figure A-4: Partner Contribution by One-Stop: Job Corps.
$3,500$18,720 $21,947 $30,000
$76,500
$0
$50,000
$100,000
$150,000
$200,000
$250,000
$300,000
$350,000
$400,000
$450,000
$500,000
Survey 12 - South -Urban
Survey 15 - South -Urban
Case study 2 - North -Suburban
Survey 13 - South -Suburban
Survey 2 - South - Rural
One-Stop
Job
Cor
ps. C
ontr
ibut
ion
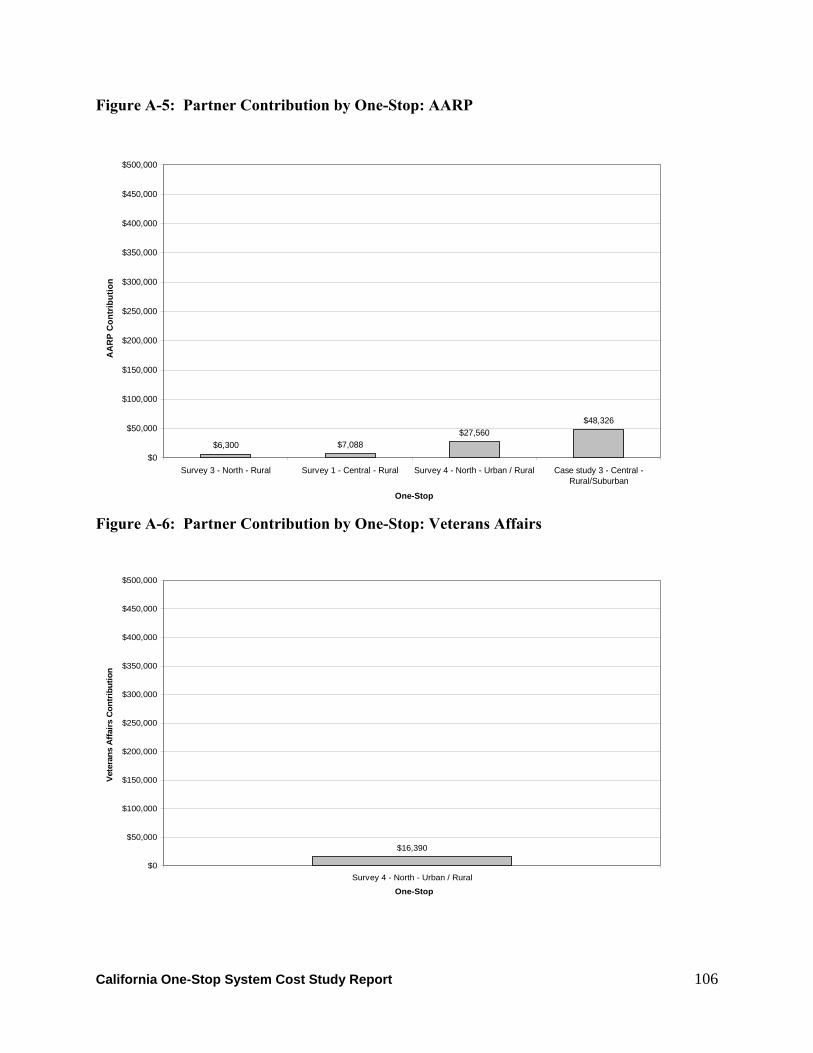
California One-Stop System Cost Study Report
106
Figure A-5: Partner Contribution by One-Stop: AARP
$6,300 $7,088$27,560
$48,326
$0
$50,000
$100,000
$150,000
$200,000
$250,000
$300,000
$350,000
$400,000
$450,000
$500,000
Survey 3 - North - Rural Survey 1 - Central - Rural Survey 4 - North - Urban / Rural Case study 3 - Central -Rural/Suburban
One-Stop
AA
RP
Con
trib
utio
n
Figure A-6: Partner Contribution by One-Stop: Veterans Affairs
$16,390
$0
$50,000
$100,000
$150,000
$200,000
$250,000
$300,000
$350,000
$400,000
$450,000
$500,000
Survey 4 - North - Urban / Rural
One-Stop
Vete
rans
Affa
irs C
ontr
ibut
ion

California One-Stop System Cost Study Report
107
Appendix B: Other Cost-Per Measures

California One-Stop System Cost Study Report
108
Figure B-1: Cost per Enrolled Client Meeting with Case Manager
$0.00
$200.00
$400.00
$600.00
$800.00
$1,000.00
$1,200.00
$1,400.00
Survey
16 - S
outh
- Urba
n
Case s
tudy 4
- Nort
h - R
ural
Survey
14 - S
outh
- Urba
n
Survey
3 - N
orth -
Rura
l
Survey
15 - S
outh
- Urba
n
Survey
17 - S
outh
- Urba
n
Survey
7 - C
entra
l - Rura
l
Survey
5 - S
outh
- Sub
urban
/ Rura
l
Survey
9 - C
entra
l - Urba
n
Survey
12 - S
outh
- Urba
n
Survey
1 - C
entra
l - Rura
l
Survey
6 - S
outh
- Sub
urban
Survey
2 - S
outh
- Rura
l
Survey
4 - N
orth -
Urba
n / R
ural
Survey
8 - C
entra
l - Urba
n
Survey
10 - N
orth -
Suburb
an
Survey
11 - N
orth -
Urba
n
Survey
13 - S
outh
- Sub
urban
Survey
18 - N
orth -
Sub
urban
/ Rura
l
Case s
tudy 1
- Sou
th - U
rban
Case s
tudy 2
- Nort
h - S
uburb
an
Case s
tudy 3
- Cen
tral -
Rural/S
uburb
an
One-Stop
Cos
t per
Enr
olle
d C
lient
Mee
ting
with
Cas
e M
anag
er
Figure B-2: Volume of Enrolled Client Meetings with Case Manager
0
1,000
2,000
3,000
4,000
5,000
6,000
7,000
8,000
9,000
10,000
Survey
3 - N
orth -
Rura
l
Survey
6 - S
outh
- Sub
urban
Survey
12 - S
outh
- Urba
n
Survey
1 - C
entra
l - Rura
l
Survey
5 - S
outh
- Sub
urban
/ Rura
l
Survey
9 - C
entra
l - Urba
n
Survey
17 - S
outh
- Urba
n
Survey
7 - C
entra
l - Rura
l
Survey
15 - S
outh
- Urba
n
Survey
16 - S
outh
- Urba
n
Survey
14 - S
outh
- Urba
n
Case s
tudy 4
- Nort
h - R
ural
Survey
10 - N
orth -
Suburb
an
Survey
11 - N
orth -
Urba
n
Survey
13 - S
outh
- Sub
urban
Survey
18 - N
orth -
Sub
urban
/ Rura
l
Survey
2 - S
outh
- Rura
l
Survey
4 - N
orth -
Urba
n / R
ural
Survey
8 - C
entra
l - Urba
n
Case s
tudy 1
- Sou
th - U
rban
Case s
tudy 2
- Nort
h - S
uburb
an
Case s
tudy 3
- Cen
tral -
Rural/S
uburb
an
One-Stop
Enro
lled
- Num
ber o
f Clie
nt M
eetin
gs w
ith C
ase
Man
ager

California One-Stop System Cost Study Report
109
Figure B-3: Cost per Business Services: Applicant Hired from Mass Hire Event
$0.00
$200.00
$400.00
$600.00
$800.00
$1,000.00
$1,200.00
$1,400.00
$1,600.00
$1,800.00
Case s
tudy 4
- Nort
h - R
ural
Survey
2 - S
outh
- Rura
l
Survey
7 - C
entra
l - Rura
l
Survey
1 - C
entra
l - Rura
l
Survey
12 - S
outh
- Urba
n
Survey
18 - N
orth -
Sub
urban
/ Rura
l
Survey
8 - C
entra
l - Urba
n
Survey
16 - S
outh
- Urba
n
Survey
14 - S
outh
- Urba
n
Survey
17 - S
outh
- Urba
n
Survey
9 - C
entra
l - Urba
n
Survey
3 - N
orth -
Rura
l
Survey
4 - N
orth -
Urba
n / R
ural
Survey
5 - S
outh
- Sub
urban
/ Rura
l
Survey
6 - S
outh
- Sub
urban
Survey
10 - N
orth -
Suburb
an
Survey
11 - N
orth -
Urba
n
Survey
13 - S
outh
- Sub
urban
Survey
15 - S
outh
- Urba
n
Case s
tudy 1
- Sou
th - U
rban
Case s
tudy 2
- Nort
h - S
uburb
an
Case s
tudy 3
- Cen
tral -
Rural/S
uburb
an
One-Stop
Cos
t per
Bus
ines
s Se
rvic
es: A
pplic
ant H
ired
from
Mas
s H
ire E
vent
Figure B-4: Volume of Business Services Mass Hires/Job Fairs: Applicants Hired From Mass Hire Events
0
100
200
300
400
500
600
700
800
Case s
tudy 2
- Nort
h - S
uburb
an
Survey
14 - S
outh
- Urba
n
Survey
17 - S
outh
- Urba
n
Survey
9 - C
entra
l - Urba
n
Survey
8 - C
entra
l - Urba
n
Survey
16 - S
outh
- Urba
n
Case s
tudy 4
- Nort
h - R
ural
Survey
1 - C
entra
l - Rura
l
Survey
12 - S
outh
- Urba
n
Survey
7 - C
entra
l - Rura
l
Survey
18 - N
orth -
Sub
urban
/ Rura
l
Survey
2 - S
outh
- Rura
l
Survey
10 - N
orth -
Suburb
an
Survey
11 - N
orth -
Urba
n
Survey
13 - S
outh
- Sub
urban
Survey
15 - S
outh
- Urba
n
Survey
3 - N
orth -
Rura
l
Survey
4 - N
orth -
Urba
n / R
ural
Survey
5 - S
outh
- Sub
urban
/ Rura
l
Survey
6 - S
outh
- Sub
urban
Case s
tudy 1
- Sou
th - U
rban
Case s
tudy 3
- Cen
tral -
Rural/S
uburb
an
One-Stop
Bus
ines
s Se
rvic
es -
Num
ber o
f App
lican
ts H
ired
From
Mas
s H
ire E
vent
s

California One-Stop System Cost Study Report
110
Figure B-5: Cost per Youth Academic Support Participant Attaining Credential
$0.00
$1,000.00
$2,000.00
$3,000.00
$4,000.00
$5,000.00
$6,000.00
$7,000.00
Survey
4 - N
orth -
Urba
n / R
ural
Survey
7 - C
entra
l - Rura
l
Survey
5 - S
outh
- Sub
urban
/ Rura
l
Survey
8 - C
entra
l - Urba
n
Survey
9 - C
entra
l - Urba
n
Survey
12 - S
outh
- Urba
n
Survey
1 - C
entra
l - Rura
l
Survey
2 - S
outh
- Rura
l
Survey
3 - N
orth -
Rura
l
Survey
6 - S
outh
- Sub
urban
Survey
10 - N
orth -
Suburb
an
Survey
11 - N
orth -
Urba
n
Survey
13 - S
outh
- Sub
urban
Survey
14 - S
outh
- Urba
n
Survey
15 - S
outh
- Urba
n
Survey
17 - S
outh
- Urba
n
Survey
18 - N
orth -
Sub
urban
/ Rura
l
Case s
tudy 1
- Sou
th - U
rban
Case s
tudy 2
- Nort
h - S
uburb
an
Case s
tudy 3
- Cen
tral -
Rural/S
uburb
an
Case s
tudy 4
- Nort
h - R
ural
Survey
16 - S
outh
- Urba
n
One-Stop
Cos
t per
You
th A
cade
mic
Sup
port
Par
ticip
ant A
ttain
ing
Cre
dent
ial
Figure B-6: Volume of Youth Academic Support Participants Attaining Credential
0
10
20
30
40
50
60
70
80
90
Survey
12 - S
outh
- Urba
n
Survey
8 - C
entra
l - Urba
n
Survey
5 - S
outh
- Sub
urban
/ Rura
l
Survey
4 - N
orth -
Urba
n / R
ural
Survey
16 - S
outh
- Urba
n
Survey
9 - C
entra
l - Urba
n
Survey
7 - C
entra
l - Rura
l
Survey
1 - C
entra
l - Rura
l
Survey
10 - N
orth -
Sub
urban
Survey
11 - N
orth -
Urba
n
Survey
13 - S
outh
- Sub
urban
Survey
14 - S
outh
- Urba
n
Survey
15 - S
outh
- Urba
n
Survey
17 - S
outh
- Urba
n
Survey
18 - N
orth -
Sub
urban
/ Rura
l
Survey
2 - S
outh
- Rura
l
Survey
3 - N
orth -
Rura
l
Survey
6 - S
outh
- Sub
urban
Case s
tudy 1
- Sou
th - U
rban
Case s
tudy 2
- Nort
h - Sub
urban
Case s
tudy 3
- Cen
tral -
Rural/S
uburb
an
Case s
tudy 4
- Nort
h - R
ural
One-Stop
Yout
h - N
umbe
r of A
cade
mic
Sup
port
Par
ticip
ants
Atta
inin
g C
rede
ntia
l
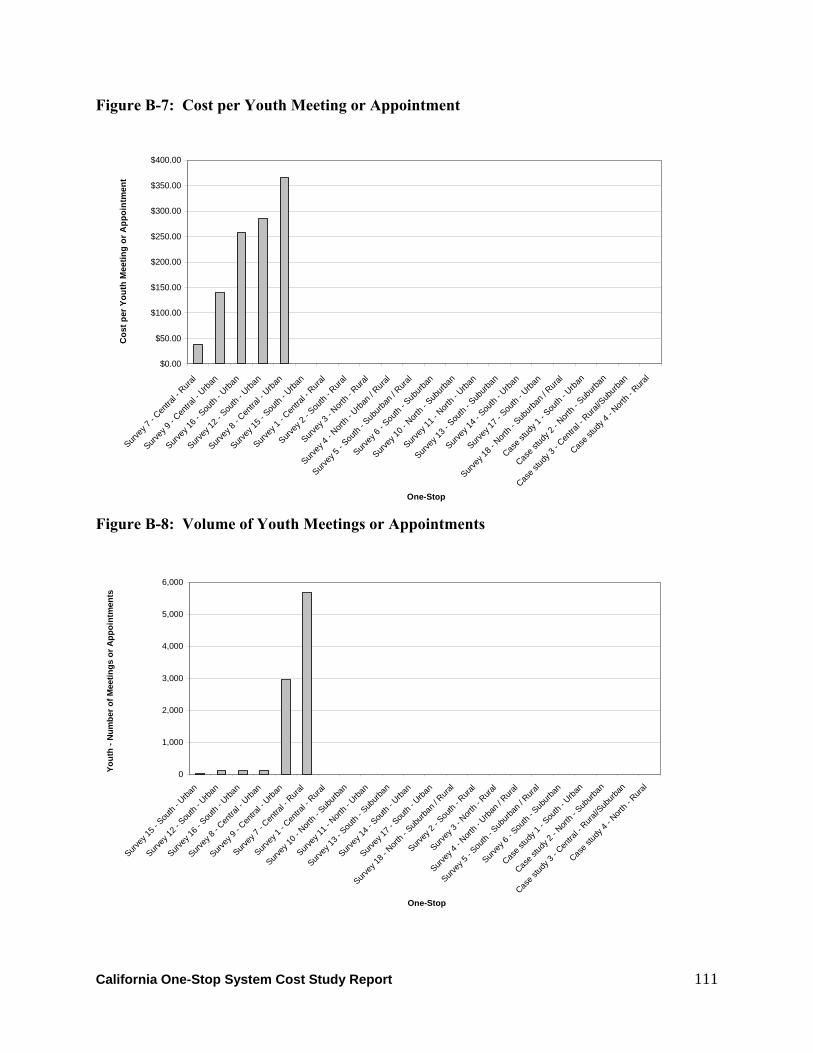
California One-Stop System Cost Study Report
111
Figure B-7: Cost per Youth Meeting or Appointment
$0.00
$50.00
$100.00
$150.00
$200.00
$250.00
$300.00
$350.00
$400.00
Survey
7 - C
entra
l - Rura
l
Survey
9 - C
entra
l - Urba
n
Survey
16 - S
outh
- Urba
n
Survey
12 - S
outh
- Urba
n
Survey
8 - C
entra
l - Urba
n
Survey
15 - S
outh
- Urba
n
Survey
1 - C
entra
l - Rura
l
Survey
2 - S
outh
- Rura
l
Survey
3 - N
orth -
Rura
l
Survey
4 - N
orth -
Urba
n / R
ural
Survey
5 - S
outh
- Sub
urban
/ Rura
l
Survey
6 - S
outh
- Sub
urban
Survey
10 - N
orth -
Suburb
an
Survey
11 - N
orth -
Urba
n
Survey
13 - S
outh
- Sub
urban
Survey
14 - S
outh
- Urba
n
Survey
17 - S
outh
- Urba
n
Survey
18 - N
orth -
Sub
urban
/ Rura
l
Case s
tudy 1
- Sou
th - U
rban
Case s
tudy 2
- Nort
h - S
uburb
an
Case s
tudy 3
- Cen
tral -
Rural/S
uburb
an
Case s
tudy 4
- Nort
h - R
ural
One-Stop
Cos
t per
You
th M
eetin
g or
App
oint
men
t
Figure B-8: Volume of Youth Meetings or Appointments
0
1,000
2,000
3,000
4,000
5,000
6,000
Survey
15 - S
outh
- Urba
n
Survey
12 - S
outh
- Urba
n
Survey
16 - S
outh
- Urba
n
Survey
8 - C
entra
l - Urba
n
Survey
9 - C
entra
l - Urba
n
Survey
7 - C
entra
l - Rura
l
Survey
1 - C
entra
l - Rura
l
Survey
10 - N
orth -
Sub
urban
Survey
11 - N
orth -
Urba
n
Survey
13 - S
outh
- Sub
urban
Survey
14 - S
outh
- Urba
n
Survey
17 - S
outh
- Urba
n
Survey
18 - N
orth -
Sub
urban
/ Rura
l
Survey
2 - S
outh
- Rura
l
Survey
3 - N
orth -
Rura
l
Survey
4 - N
orth -
Urba
n / R
ural
Survey
5 - S
outh
- Sub
urban
/ Rura
l
Survey
6 - S
outh
- Sub
urban
Case s
tudy 1
- Sou
th - U
rban
Case s
tudy 2
- Nort
h - S
uburb
an
Case s
tudy 3
- Cen
tral -
Rural/S
uburb
an
Case s
tudy 4
- Nort
h - R
ural
One-Stop
Yout
h - N
umbe
r of M
eetin
gs o
r App
oint
men
ts

California One-Stop System Cost Study Report
112
Appendix C: Individual Case Study Reports

California One-Stop System Cost Study Report
113
Appendix C-1: Case Study 1 – Southern California Urban One-Stop
Report

California One-Stop System Cost Study Report
114
SoCal Urban One-Stop Case Report Background The SoCal Urban One-Stop is part of a local area which includes eight cities and some county territory in a large metropolitan area in Southern California. The local area, which we will call the Multi-City WIB, operates four full service One-Stops. Three are operated by contracting with local cities, and a fourth (SoCal Urban One-Stop) is managed by the city government which also manages the WIB and the local area.
The Multi-City local area is very entrepreneurial. It has won contracts and grants from a number of agencies at the State and county level. While the Multi-City formula grant from WIA in 2004-05 was less than 44 million, the WIB’s total revenues were over $14 million. SoCal Urban One-Stop Description The SoCal Urban One-Stop serves three cities and a piece of county territory with a diverse population. It is located in a multi-story office building, on a busy street in the center of the largest of the cities. The One-Stop is spread out over three floors within the building. The facilities include a large resource room, a computer lab, numerous offices for counselors, and several classrooms and meeting rooms. The One-Stop is busy, averaging 100 visits a day to its resource room. The list below shows the agencies which are official partners of the One-Stop. The agencies in bold are agencies which provide significant measurable contributions to the One-Stop’s operations and are featured in our analysis.
Table C1-1: Partners Who Contribute and Do Not Contribute in the One-Stop
Measurable Contributions In One-Stop • State of California Employment Development
Department, • California Department of Rehabilitation, • Small Business Development Corporation (at
local Community College) • City Adult School
Without Measurable Contributions in One-Stop • Local Community College, • California State University, Local, • County Department of Social Services, • City Housing Services, • US Veterans Administration, • City Action Agency, • Regional Occupation Center , • the Youth Collaborative, and the • Regional Native American Center.
California One-Stop System Cost Study Report
115
Defining the One-Stop Boundaries For the purposes of our analysis we had to define what was inside and what was outside the One-Stop. For example, down the street from the One-Stop was a Salvation Army facility to which the One-Stop referred people. Should the costs of that operation be in our analysis? Similarly, the Community College operated programs in the One-Stop building, but these programs did not serve One-Stop customers except incidentally, while the City Adult Education unit in the One-Stop ran General Education Development (GED) and other programs just for One-Stop Clients in the One-Stop. To make these decisions consistent we developed an “operational definition” of what was and what was not considered a One-Stop activity for the purpose of our analysis:
Activities and agencies are included in the analysis if they provide workforce services to One-Stop clients and if the services meet one of the following conditions: (1) under the One-Stop’s Roof or (2) Provide customized services to One-Stop clients based on a formal agreement.
Based on this definition the Community College operation is excluded and the City Adult Education operation is included. It is also important to note that while the local area’s youth program was under the supervision of the One-Stop manager, it was not physically in the One-Stop in the year studied, so it is excluded. Similarly most training is provided through ITAs (Individual Training Accounts) where the One-Stop will contract with another agency to train a client. Hence, we included in our analysis the cost of assessing the client and supervising the ITA, but the actual cost of training - because it occurred outside the One-Stop - was excluded. One-Stop Structure The One-Stop is managed by a center director. Based on our observations and discussion with WIB and One-Stop staff we broke the work of the center into five responsibility centers18:
1. The Resource Room: The operation provides walk-in services such as on-line job searching, computers and printers for producing resumes and letters, career information, and referral information. Most clients self-serve, but staff from the One-Stop and the on-site EDD unit are available for brief one-on-one assistance. Any one who walks in and provides their name, address and social security number may use these services.
2. Registered Services: The registered services area provides one-on-one case management and referral to training and other services for clients who are formally registered in WIA or a county funded employment program for welfare recipients.
3. Employer and Placement Services: This unit markets the One-Stop’s services to employers while it also develops job prospects for clients. Members of this unit also provide direct placement assistance to clients as well as deliver services directly to employers, including rapid response services.
18 In the 2004-05 fiscal year, which was studied, the One-Stop director was also responsible for a Youth program which was housed at a separate site, with its own supervisor. While the payroll for this program was included in the One-Stop’s budget it is not included in our analysis.

California One-Stop System Cost Study Report
116
4. Director’s Office and Administration: The Director and her staff administer the One-Stop, manage relations with the central office and partner agencies, and interact with the public on behalf of the One-Stop.
5. Partners: Partners with significant operations under the One-Stop’s roof such as EDD and the Local Adult Education program were treated as their own responsibility center in the fiscal analysis.
In the year we studied, 2004-05, the One-Stop had 32 people on its payroll. In addition there were EDD employees who worked under the One-Stop’s roof providing services to clients. The local Adult Education unit had an operation in the One-Stop that included two classrooms and four staff that provided basic education to One-Stop clients. A Department of Rehabilitation (DOR) counselor was as at the center one morning a week. A Local Community College sub-let a substantial amount of space from the One-Stop. Its space included a computer lab and classroom which were used for various college activities, but since these activities were not specifically for One-Stop participants we did not include the space or the activities in our analysis.
Activity data gives an additional sense of the level of activity of the One-Stop. In the 2004-05 year studied there were over 24,500 visits to the One-Stop; about 100 visits a day. Over 6,600 individuals used the One-Stop. One thousand sixty-eight individuals were registered into various programs, 455 exited a program and 253 were placed. The One-Stop contacted 4,297 companies, and visited 480. Staff conducted 21 on-site recruiting events in which 2,441 job seekers participated leading to 280 being hired into jobs. One-Stop Processes and Activities We began our analysis by mapping the processes we observed in the One-Stop. We asked the One-Stop staff to validate this process map and help us define specific activities. Figure C1-1 shows the final process map, with the key measures of what the processes produce. This process map was the framework we used for estimating the costs of each activity and ultimately the costs of producing different products.
We found three major processes in the One-Stop:
1. Universal Access Process: This process served any citizen who came to the One-Stop seeking help. It provided a wide range of resources in a resource room, including career and labor market information, access to computers for job searching and resume preparation, access to phones and fax machines, limited one-on-one coaching and advice, and career oriented workshops.
2. Registered Services Process: This process provided longer-term services for clients who were registered in any of the various WIA or County funded workforce programs offered by the center.
3. Employer Services Process: This process provided a variety of services to businesses including ‘Rapid Response Services’ to businesses who were closing or laying off a significant number of workers, help hiring through referrals or setting up on site screening interviews, and referrals to other business assistance services.

California One-Stop System Cost Study Report
117
Figure C1-1: SoCal Urban One-Stop Process Map
Outreach / Recruitment
Reception / Orientation
Self Service
Counseling /1-on-1 assist.
Group Workshops
04-05 Labor Market
Outcomes
Support Activities
Employer Outreach Employer Services
PlanningIntakeIEP
Core / IntensiveCase Mgmt.
Basic Skills
Placement
Job Development
TrainingOJTITA
IndividualJob
Development
SoCal Urban One-Stop Process MapUniversal Access Process (mass service)
Enrolled Clients Process (service shop)
Employer Services Process (service shop)
• 6,631 Universal Clients
• 24,537 Client Visits
• 253 Placements• $11.50 Average
Wage Placed
• 21 On-Site Recruiting Events Adult
• 2,441 Job Participants
• 280 Hired• 13 Small Business
Workshops
LAB
OR
MA
RK
ET

California One-Stop System Cost Study Report
118
Process Cost Analysis
We began by taking the traditional line item budget for the One-Stop and the costs assigned to the One-Stop for support services and putting them into “responsibility centers”. These centers were recognized organizational units to which personnel and other costs could be assigned. Other responsibility centers were identified when there were significant shared resources such as classrooms, or in-house partners with significant contributions. Table C1-2 shows the total cost by responsibility center.
Partner Contributions We attempted to measure the cost of each partner’s activities within the One-Stop. We found five partners that seemed to make a substantial contribution within the One-Stop. For DPSS, we were unable to get data on their contribution, but we expect that these contributions were relatively small. As the table indicates, while partners make a substantial contribution—over a quarter of all costs, the bulk of the resources come from a single partner, EDD. Other partners’ contributions are relatively small.
Table C1-2: Costs by Responsibility Center Responsibility Center* Cost Percent of
All Costs Resource Room $534,639 13.4% Case Management (Registered, Dislocated) $1,277,836 31.8% Job Dev / Employer services $723,210 18.1% Admin Directors Office $392,436 9.9% EDD $888,918 22.1% Local Adult Education Program $149,000 3.7% Local CC- SBDC $12,000 0.3% Rehab $10,138 0.3% Classrooms $16,387 0.4% Total $4,004,564 100.0% *The WIB administers the county’s welfare to work program. The funds expended in the One-Stop have been accounted for, but we attempted to get the costs of DPSS for administering the contract, but were unable to get an estimate.
As the table indicates, total cost for the 2004-05 program year was slightly above $4 million dollars. In establishing these responsibility centers and costs, we distributed all support costs, such as accounting or rent, to the cost centers listed above, so is there is no responsibility center for support costs.
Figure C1-2 below indicates the percent of cost attributable to each responsibility center. As the Figure shows local area costs were 74% of all costs with partners making up the remaining 24%. EDD was the largest partner by far, accounting for 22% of all costs. Minor partners (Department of Rehabilitation and Local Community College) were less than one percent and are not portrayed in the figure.

California One-Stop System Cost Study Report
119
Figure C1-2: Percent of Costs by Responsibility Center
Resource Room13%
Admin Directors Office10%
EDD22%
Inglewoood Adult4%
Job Dev/ Employer Services
18%
Case Mgt/ Registered/Dislocated
33%
Cost By Process and Activity
Our next step was to trace the costs of each responsibility center back to the activities that generated the costs. To understand the cost of each process, and the activities within each process we identified a number of “cost drivers” that allowed us to trace costs back to activities. The most important cost driver was staff time, since that was the largest budget item. We asked managers and many staff members to estimate the time they spent on different activities. We also looked at the physical space used for various activities and traced the cost of that space back to the various activities. We used the judgment of senior managers to distribute support cost across the activities. We used the same process with partners who made significant contributions to the One-Stop. Table 1-3 shows the cost of each activity, and also shows how much of those costs were supported directly by the One-Stop and WIB, as well as the portion attributable to partner contributions.

California One-Stop System Cost Study Report
120
Table C1-3: Costs by Activity, One-Stop and Partner
Activity Total cost One-Stop + WIB Support
cost
Partner
Universal Activities Outreach / Recruitment / Eligibility workshops $353,758 $277,094 $76,664Reception Orientation $251,048 $225,868 $25,180Self Service $179,289 $167,693 $11,596Counseling 1-on-1 Assistance $577,882 $262,537 $315,345Group Workshops $121,196 $83,383 $37,813Universal Total $1,483,173 $1,016,575 $466,598 Registered Activities Planning / Intake / IEP $19,622 $19,622 $0Core and Intensive Services (Case Mgt.) $1,081,158 $892,815 $188,343Basic Skills $156,692 $7,692 $149,000Training / OJT / ITA $69,867 $46,864 $23,003Placement $446,804 $373,436 $73,368Job Development $160,421 $124,250 $36,171Registered Activities Total $1,934,564 $1,464,679 $469,885 Business Services Outreach $157,189 $138,632 $18,556Services to Employers $429,461 $324,445 $105,017Business Services Total $586,650 $463,077 $123,573 Grand Total $4,004,387 $2,944,331 $1,060,056
This table adds some valuable insights into how this One-Stop’s costs are structured. Of the roughly $4 million of costs, about $1 million came from partner contributions. The great bulk of that came from EDD, which contributed over $800,000, and much smaller contributions from three other partners. In a later section we look at partner contributions in more detail.
As Figure C1-3 below indicates, the largest investment was made in the registered services process, which consumed almost half of all costs, followed by universal activities, which consumed a little more than a third of all costs, and lastly business services, which consumed less than 15%.

California One-Stop System Cost Study Report
121
Figure C1-3: Percent of Costs by Major Process
Universal Services
37%
Registered Services
48%
Business Services & Outreach
15%
When we look at the cost of specific activities, we find that the highest costs in the Universal Access process were generated by “counseling and one-on-one assistance”. We can see that both One-Stop staff and EDD staff put substantial time into this activity, generating high costs. Outreach, recruitment and eligibility workshops were the second highest cost activity in this process.
In the registered process the largest costs by far were in core and intensive services activity, which generated well over half the costs in this process. It appears these large costs reflect the labor intensive nature of case management across all the various programs.
In the business services process the bulk of the costs were generated by providing services to businesses.
Cost By Product
The final step in our analysis is to estimate the costs of particular One-Stop products that are produced by processes and activities described before. One-Stops are a service business and it is often hard to distinguish between activities and products. For example, when a client has a one-on-one session with a counselor to review her resume, is the product a counseling session or is this event merely an activity leading to a product such as placement in a job? We did not worry too much about this distinction. In this case we were constrained by what the One-Stop measured; we could only estimate costs for products which were measured by the One-Stop. We could also only estimate costs when One-Stop staff could assign cost drivers – usually their time – to specific products. We were also interested in products that were likely to be found in other One-Stops, such as a universal access visit, or a workshop. The list of products in Table C1-4
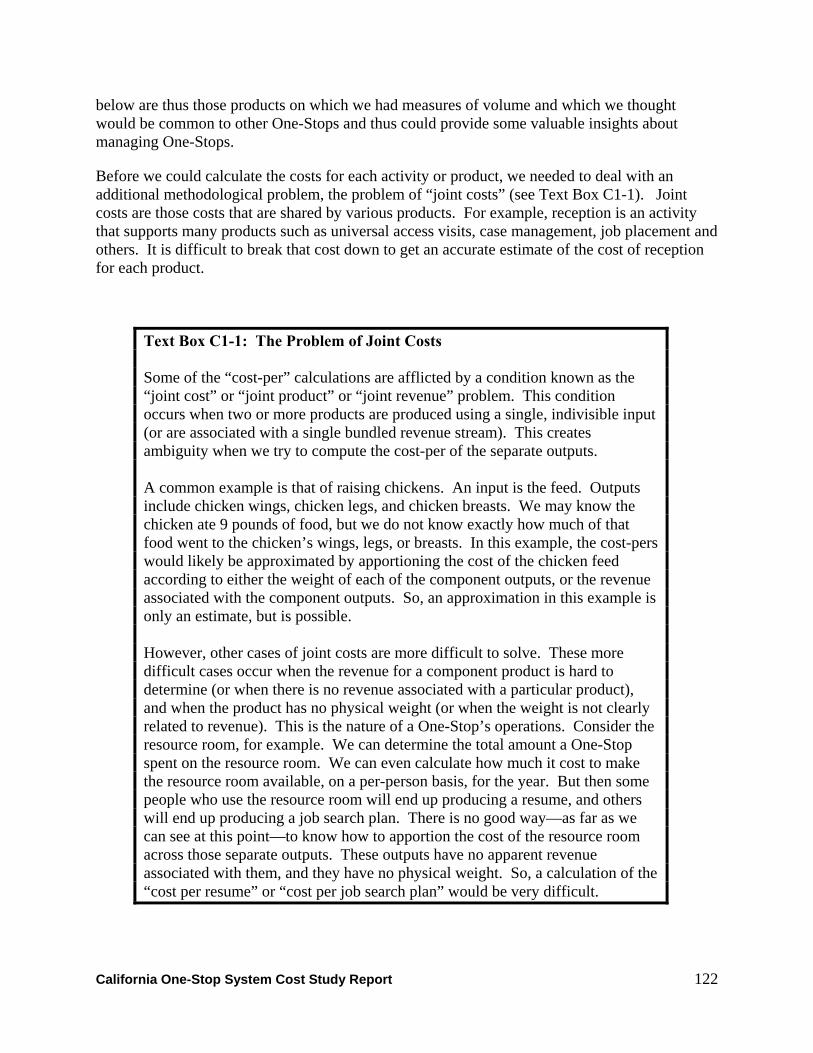
California One-Stop System Cost Study Report
122
below are thus those products on which we had measures of volume and which we thought would be common to other One-Stops and thus could provide some valuable insights about managing One-Stops.
Before we could calculate the costs for each activity or product, we needed to deal with an additional methodological problem, the problem of “joint costs” (see Text Box C1-1). Joint costs are those costs that are shared by various products. For example, reception is an activity that supports many products such as universal access visits, case management, job placement and others. It is difficult to break that cost down to get an accurate estimate of the cost of reception for each product.
Text Box C1-1: The Problem of Joint Costs Some of the “cost-per” calculations are afflicted by a condition known as the “joint cost” or “joint product” or “joint revenue” problem. This condition occurs when two or more products are produced using a single, indivisible input (or are associated with a single bundled revenue stream). This creates ambiguity when we try to compute the cost-per of the separate outputs. A common example is that of raising chickens. An input is the feed. Outputs include chicken wings, chicken legs, and chicken breasts. We may know the chicken ate 9 pounds of food, but we do not know exactly how much of that food went to the chicken’s wings, legs, or breasts. In this example, the cost-pers would likely be approximated by apportioning the cost of the chicken feed according to either the weight of each of the component outputs, or the revenue associated with the component outputs. So, an approximation in this example is only an estimate, but is possible. However, other cases of joint costs are more difficult to solve. These more difficult cases occur when the revenue for a component product is hard to determine (or when there is no revenue associated with a particular product), and when the product has no physical weight (or when the weight is not clearly related to revenue). This is the nature of a One-Stop’s operations. Consider the resource room, for example. We can determine the total amount a One-Stop spent on the resource room. We can even calculate how much it cost to make the resource room available, on a per-person basis, for the year. But then some people who use the resource room will end up producing a resume, and others will end up producing a job search plan. There is no good way—as far as we can see at this point—to know how to apportion the cost of the resource room across those separate outputs. These outputs have no apparent revenue associated with them, and they have no physical weight. So, a calculation of the “cost per resume” or “cost per job search plan” would be very difficult.
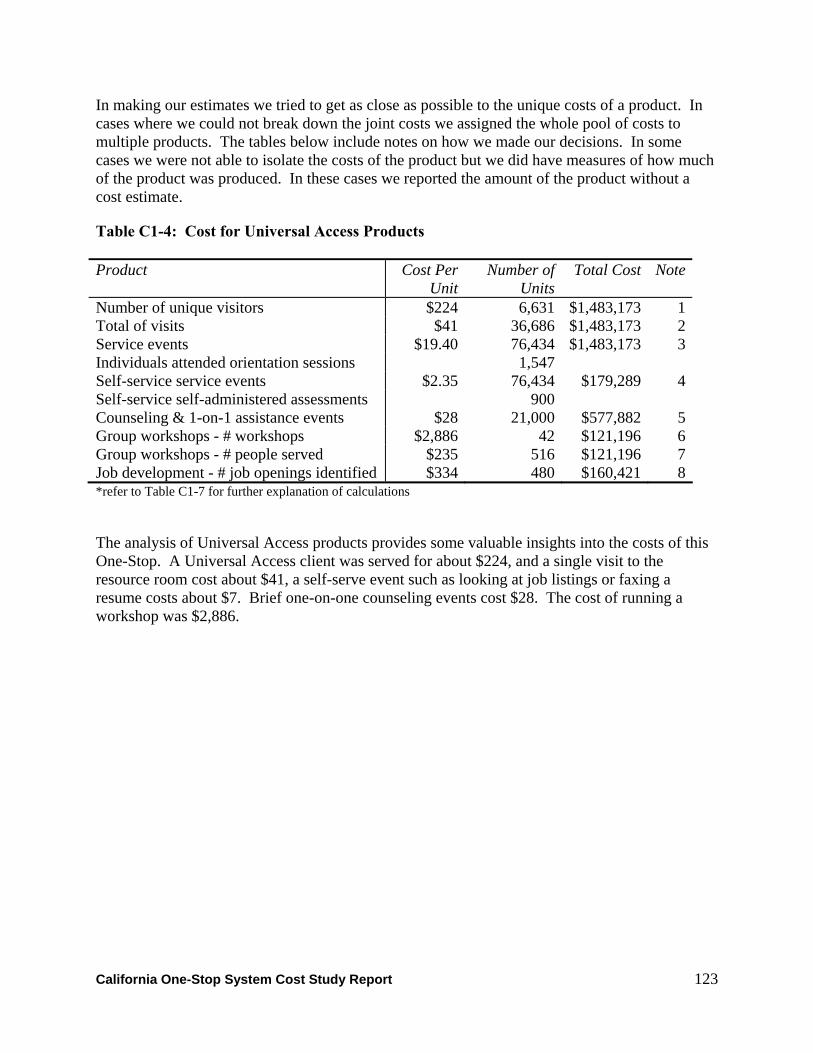
California One-Stop System Cost Study Report
123
In making our estimates we tried to get as close as possible to the unique costs of a product. In cases where we could not break down the joint costs we assigned the whole pool of costs to multiple products. The tables below include notes on how we made our decisions. In some cases we were not able to isolate the costs of the product but we did have measures of how much of the product was produced. In these cases we reported the amount of the product without a cost estimate.
Table C1-4: Cost for Universal Access Products Product Cost Per
UnitNumber of
UnitsTotal Cost Note
Number of unique visitors $224 6,631 $1,483,173 1Total of visits $41 36,686 $1,483,173 2Service events $19.40 76,434 $1,483,173 3Individuals attended orientation sessions 1,547 Self-service service events $2.35 76,434 $179,289 4Self-service self-administered assessments 900 Counseling & 1-on-1 assistance events $28 21,000 $577,882 5Group workshops - # workshops $2,886 42 $121,196 6Group workshops - # people served $235 516 $121,196 7Job development - # job openings identified $334 480 $160,421 8*refer to Table C1-7 for further explanation of calculations
The analysis of Universal Access products provides some valuable insights into the costs of this One-Stop. A Universal Access client was served for about $224, and a single visit to the resource room cost about $41, a self-serve event such as looking at job listings or faxing a resume costs about $7. Brief one-on-one counseling events cost $28. The cost of running a workshop was $2,886.
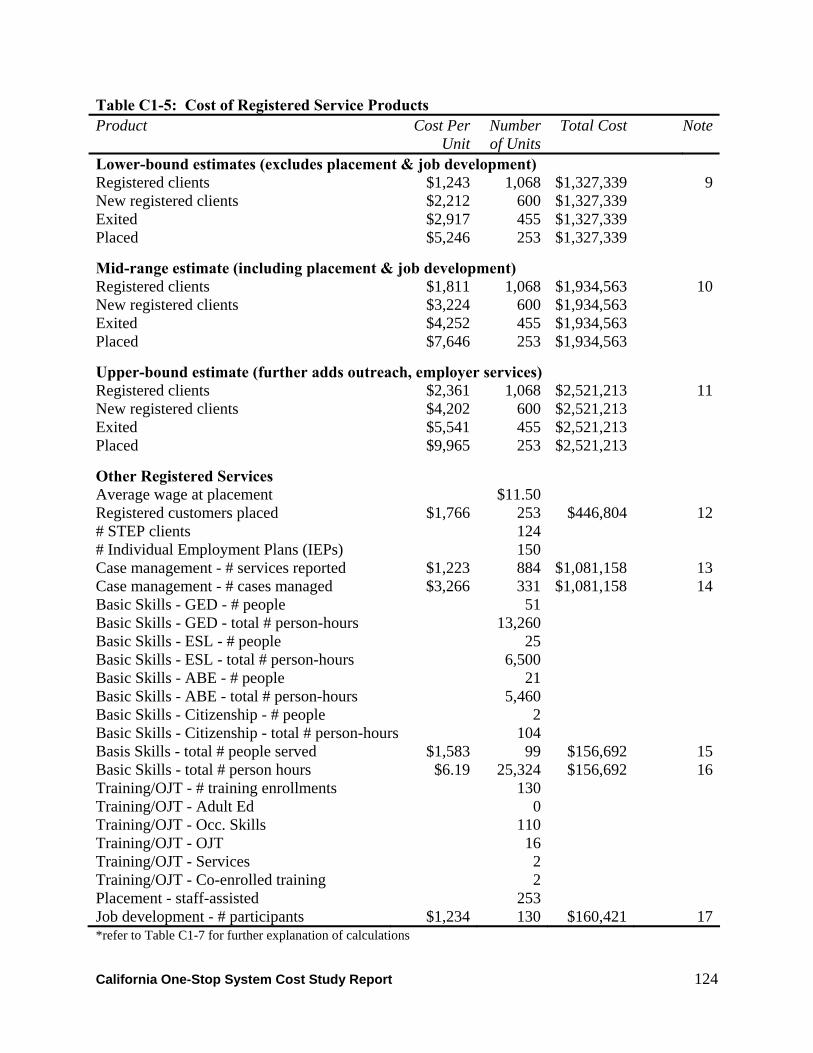
California One-Stop System Cost Study Report
124
Table C1-5: Cost of Registered Service Products Product Cost Per
UnitNumber of Units
Total Cost Note
Lower-bound estimates (excludes placement & job development) Registered clients $1,243 1,068 $1,327,339 9New registered clients $2,212 600 $1,327,339 Exited $2,917 455 $1,327,339 Placed $5,246 253 $1,327,339 Mid-range estimate (including placement & job development) Registered clients $1,811 1,068 $1,934,563 10New registered clients $3,224 600 $1,934,563 Exited $4,252 455 $1,934,563 Placed $7,646 253 $1,934,563 Upper-bound estimate (further adds outreach, employer services) Registered clients $2,361 1,068 $2,521,213 11New registered clients $4,202 600 $2,521,213 Exited $5,541 455 $2,521,213 Placed $9,965 253 $2,521,213
Other Registered Services Average wage at placement $11.50 Registered customers placed $1,766 253 $446,804 12# STEP clients 124 # Individual Employment Plans (IEPs) 150 Case management - # services reported $1,223 884 $1,081,158 13Case management - # cases managed $3,266 331 $1,081,158 14Basic Skills - GED - # people 51 Basic Skills - GED - total # person-hours 13,260 Basic Skills - ESL - # people 25 Basic Skills - ESL - total # person-hours 6,500 Basic Skills - ABE - # people 21 Basic Skills - ABE - total # person-hours 5,460 Basic Skills - Citizenship - # people 2 Basic Skills - Citizenship - total # person-hours 104 Basis Skills - total # people served $1,583 99 $156,692 15Basic Skills - total # person hours $6.19 25,324 $156,692 16Training/OJT - # training enrollments 130 Training/OJT - Adult Ed 0 Training/OJT - Occ. Skills 110 Training/OJT - OJT 16 Training/OJT - Services 2 Training/OJT - Co-enrolled training 2 Placement - staff-assisted 253 Job development - # participants $1,234 130 $160,421 17*refer to Table C1-7 for further explanation of calculations

California One-Stop System Cost Study Report
125
For a variety of reasons we found it much more difficult to estimate the cost of Registered products, in part because it was not possible to completely break down the mix of services received by each individual and hence we could not solve the joint cost problem. We have estimated that on the whole, it cost between $1,243 and $2,361 to serve a registered client and about $3,266 to provide case management services to a single client. The cost per case managed is based on JTA data indicating the number of cases managed; however, it is not completely clear that only 331 cases were managed during the year. Table C1-6: Cost of Employer Services Product Cost Per
UnitNumber of
Units Total Cost Note
Companies contacted 4,297 Companies visited 480 Business expos & job fairs 23 Mixers & events 75 Phone contacts re: rapid response 900 Flyers / newsletters mailed 3,760 On-site recruiting events 21 Job-seekers participated in on-site recruiting events
2,441
Jobs Developed 496 Job-seekers hired thru on-site recruiting events 280 *refer to Table C1-7 for further explanation of calculations Business services was the area where it was hardest to trace costs back to products because staff was unable to estimate the time they spent on various products. While we were able to estimate the total costs of business services we could not trace cost to individual outreach or service activities. This final table presents our notes on how our calculations were made and serves as a reference for tables C1-4, C1-5 and C1-6.
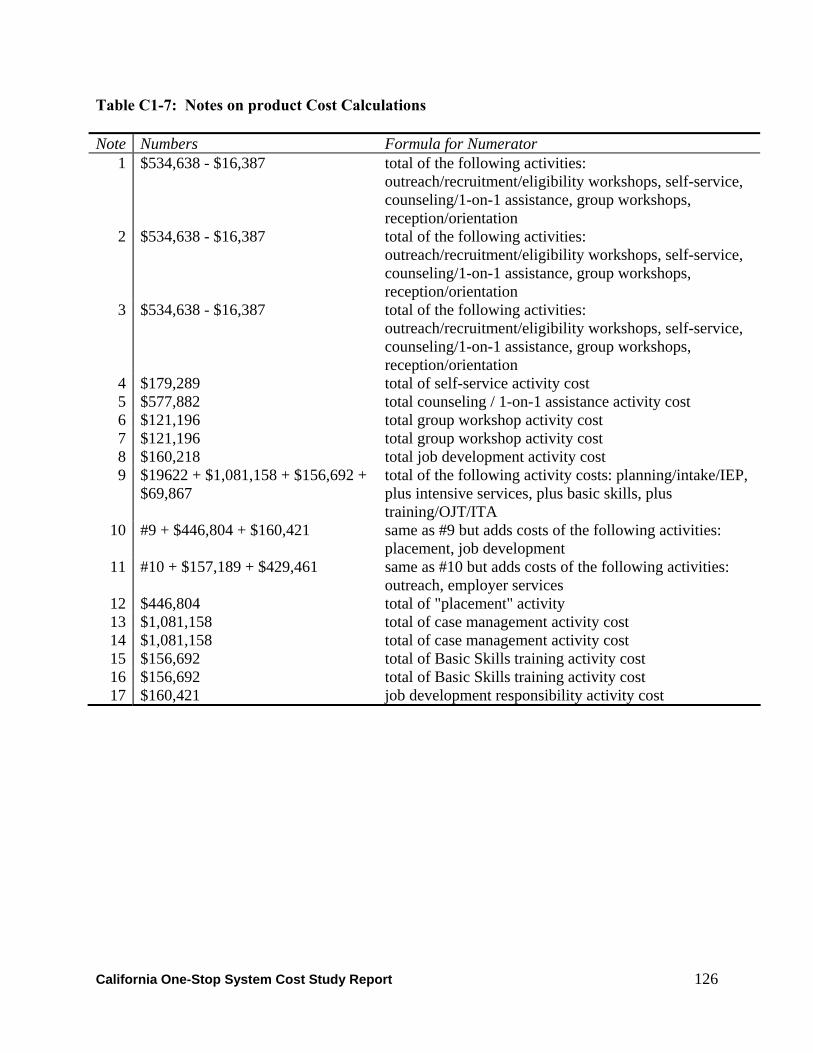
California One-Stop System Cost Study Report
126
Table C1-7: Notes on product Cost Calculations Note Numbers Formula for Numerator
1 $534,638 - $16,387 total of the following activities: outreach/recruitment/eligibility workshops, self-service, counseling/1-on-1 assistance, group workshops, reception/orientation
2 $534,638 - $16,387 total of the following activities: outreach/recruitment/eligibility workshops, self-service, counseling/1-on-1 assistance, group workshops, reception/orientation
3 $534,638 - $16,387 total of the following activities: outreach/recruitment/eligibility workshops, self-service, counseling/1-on-1 assistance, group workshops, reception/orientation
4 $179,289 total of self-service activity cost 5 $577,882 total counseling / 1-on-1 assistance activity cost 6 $121,196 total group workshop activity cost 7 $121,196 total group workshop activity cost 8 $160,218 total job development activity cost 9 $19622 + $1,081,158 + $156,692 +
$69,867 total of the following activity costs: planning/intake/IEP, plus intensive services, plus basic skills, plus training/OJT/ITA
10 #9 + $446,804 + $160,421 same as #9 but adds costs of the following activities: placement, job development
11 #10 + $157,189 + $429,461 same as #10 but adds costs of the following activities: outreach, employer services
12 $446,804 total of "placement" activity 13 $1,081,158 total of case management activity cost 14 $1,081,158 total of case management activity cost 15 $156,692 total of Basic Skills training activity cost 16 $156,692 total of Basic Skills training activity cost 17 $160,421 job development responsibility activity cost

California One-Stop System Cost Study Report 127
Table C1-8 – SoCal Urban One-Stop Cost Tracing Worksheet - Dollars
ACTIVITIES
Responsibility Center
Tota
l Cos
ts fo
r Eac
h R
espo
nsib
ility
Cen
ter
Out
reac
h / R
ecru
itmen
t /
elig
ibili
ty w
orks
hops
Rec
eptio
n O
rient
atio
n
Self
Serv
ice
Cou
nsel
ing
1-1
Ass
ista
nce
Gro
up W
orks
hops
Plan
ning
/ Int
ake/
IEP
Cor
e an
d In
tens
ive
Serv
ices
(c
ase
mgt
)
Bas
ic S
kills
Trai
ning
/ O
JT /
ITA
Plac
emen
t
Job
Dev
elop
men
t
Out
reac
h
Serv
ices
to E
mpl
oyer
s
One-Stop Resource Room $534,639 $84,636 $157,593 $136,887 $58,220 $22,137 $0 $16,554 $0 $675 $20,078 $6,090 $3,393 $27,957 Classrooms $16,387 $16,387 Case mgt/ Registered/Dislocated $1,277,836 $17,010 $26,284 $0 $142,705 $29,476 $0 $830,071 $0 $0 $157,172 $4,645 $21,723 $48,718 Job Dev/ Employer services $723,210 $144,642 $0 $0 $0 $0 $0 $0 $0 $0 $180,803 $90,401 $90,401 $216,963 Admin Directors Office $392,436 $30,806 $41,991 $30,806 $61,612 $15,383 $19,622 $46,190 $7,692 $46,190 $15,383 $23,114 $23,114 $30,806 One-Stop subtotal $2,944,508 $277,094 $225,868 $167,693 $262,537 $83,383 $19,622 $892,815 $7,692 $46,864 $373,436 $124,250 $138,632 $324,445 Expense by activity as % 100.0% 9.4% 7.7% 5.7% 8.9% 2.8% 0.7% 30.3% 0.3% 1.6% 12.7% 4.2% 4.7% 11.0% Partner Contributions EDD $888,918 $76,258 $24,775 $11,596 $306,221 $37,813 $0 $188,343 $0 $23,003 $73,368 $35,968 $18,556 $93,017 Rehab Local Adult Education $149,000 $0 $0 $0 $0 $0 $0 $0 $0 $149,000 $0 $0 $0 $0 Local- SBDC $12,000 $0 $0 $0 $0 $0 $0 $0 $0 $0 $0 $0 $0 $12,000 DPSS- Step Indirect Partner contribution subtotal $1,049,918 $76,258 $24,775 $11,596 $306,221 $37,813 $0 $188,343 $0 $172,003 $73,368 $35,968 $18,556 $105,017 Partner contribution by activity as % 100.0% 7.3% 2.4% 1.1% 29.2% 3.6% 0.0% 17.9% 0.0% 16.4% 7.0% 3.4% 1.8% 10.0% Total cost for activity $3,994,426 $353,353 $250,642 $179,289 $568,758 $121,196 $19,622 $1,081,158 $7,692 $218,867 $446,804 $160,218 $157,189 $429,461 Total cost by activity as % 100.0% 8.8% 6.3% 4.5% 14.2% 3.0% 0.5% 27.1% 0.2% 5.5% 11.2% 4.0% 3.9% 10.8%

California One-Stop System Cost Study Report
128
Table C1-9 – SoCal Urban One-Stop Cost Tracing Worksheet – Percent of Effort ACTIVITIES
Responsibility Center To
tal C
osts
for E
ach
Res
pons
ibili
ty C
ente
r
Out
reac
h / R
ecru
itmen
t /
elig
ibili
ty w
orks
hops
Rec
eptio
n O
rient
atio
n
Self
Serv
ice
Cou
nsel
ing
1-1
Ass
ista
nce
Gro
up W
orks
hops
Plan
ning
/ Int
ake/
IEP
Cor
e an
d In
tens
ive
Serv
ices
(c
ase
mgt
)
Bas
ic S
kills
Trai
ning
/ O
JT /
ITA
Plac
emen
t
Job
Dev
elop
men
t
Out
reac
h
Serv
ices
to E
mpl
oyer
s
One-Stop Resource Room $534,639 15.8% 29.5% 25.6% 10.9% 4.1% 0.0% 3.1% 0.0% 0.1% 3.8% 1.1% 0.6% 5.2% Classrooms $16,387 Case mgt/ Registered/Dislocated $1,277,836 1.3% 2.1% 0.0% 11.2% 2.3% 0.0% 65.0% 0.0% 0.0% 12.3% 0.4% 1.7% 3.8% Job Dev/ Employer services $723,210 20.0% 25.0% 12.5% 12.5% 30.0% Admin Directors Office $392,436 7.9% 10.7% 7.9% 15.7% 3.9% 5.0% 11.8% 2.0% 11.8% 3.9% 5.9% 5.9% 7.9% One-Stop subtotal $2,944,508 Partner Contributions EDD $888,918 8.6% 2.8% 1.3% 34.4% 4.3% 21.2% 0.0% 2.6% 8.3% 4.0% 2.1% 10.5% Rehab $10,138 Local Adult School $149,000 100.0% Local- SBDC $12,000 100.0% DPSS- Step Indirect Partner contribution subtotal $1,060,056

California One-Stop System Cost Study Report
129
Appendix C-2: Case Study 2 – Northern California Suburban One-Stop Report

California One-Stop System Cost Study Report
130
NoCal Suburban One-Stop Case Report
Background The NoCal Suburban One-Stop serves a consortium of several largely suburban cities in Northern California. The local economy is characterized by a large number of high-tech companies and a manufacturing sector that has experienced substantial change in the last 10 years. A Workforce Investment Board provides policy direction. The vision of the center focuses on serving as a hub to bring together a large array of public agencies and private employers to promote economic growth and opportunity in the region. . The One-Stop has been aggressive in seeking funding beyond its formula grant. Overall One-Stop costs in 2004-05 were slightly less that $10 million, including the costs of all partners. NoCal Suburban One-Stop Description The One-Stop has a large welcoming facility. The One-Stop is adjacent to a civic center and on several bus lines. Staff take great pride in the One-Stop and the quality of its services. The One-Stop operates, in a sense, under two brands or two organizations. The first is the NoCal Suburban Training Association, which is an employment and training agency. The second is an association of over 30 partner agencies which serves businesses and individuals through the One-Stop. The local WIB leads both programs. The programs are marketed to the community separately but delivered through the One-Stop. The One-Stop prides itself in being at the hub of a large network of local agencies, public and private. The list below shows the agencies which are official partners of the One-Stop. The agencies in the first section are agencies which provide significant measurable contributions “under the roof” of the One-Stop in the 2004-05 program year and are featured in our analysis. The rest are agencies that partner with the One-Stop in various ways but do not provide services in the One-Stop which we were able to measure.
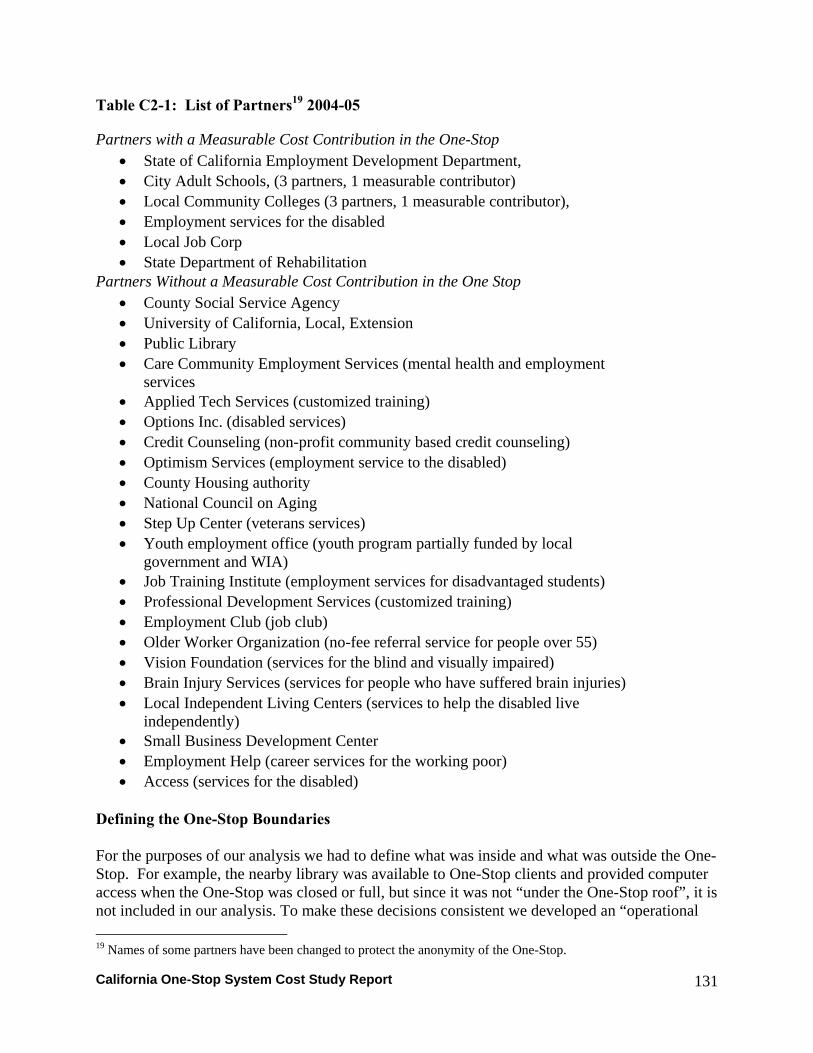
California One-Stop System Cost Study Report
131
Table C2-1: List of Partners19 2004-05
Partners with a Measurable Cost Contribution in the One-Stop • State of California Employment Development Department, • City Adult Schools, (3 partners, 1 measurable contributor) • Local Community Colleges (3 partners, 1 measurable contributor), • Employment services for the disabled • Local Job Corp • State Department of Rehabilitation
Partners Without a Measurable Cost Contribution in the One Stop • County Social Service Agency • University of California, Local, Extension • Public Library • Care Community Employment Services (mental health and employment
services • Applied Tech Services (customized training) • Options Inc. (disabled services) • Credit Counseling (non-profit community based credit counseling) • Optimism Services (employment service to the disabled) • County Housing authority • National Council on Aging • Step Up Center (veterans services) • Youth employment office (youth program partially funded by local
government and WIA) • Job Training Institute (employment services for disadvantaged students) • Professional Development Services (customized training) • Employment Club (job club) • Older Worker Organization (no-fee referral service for people over 55) • Vision Foundation (services for the blind and visually impaired) • Brain Injury Services (services for people who have suffered brain injuries) • Local Independent Living Centers (services to help the disabled live
independently) • Small Business Development Center • Employment Help (career services for the working poor) • Access (services for the disabled)
Defining the One-Stop Boundaries For the purposes of our analysis we had to define what was inside and what was outside the One-Stop. For example, the nearby library was available to One-Stop clients and provided computer access when the One-Stop was closed or full, but since it was not “under the One-Stop roof”, it is not included in our analysis. To make these decisions consistent we developed an “operational 19 Names of some partners have been changed to protect the anonymity of the One-Stop.

California One-Stop System Cost Study Report
132
definition” of what was and what was not considered a One-Stop activity for the purpose of our analysis:
Activities and agencies are included in the analysis if they provide workforce services to One-Stop clients and if the services are provided in the One-Stop facility.
Based on this definition the activities of many partners are not included in this analysis because they take place away from the facility. While these partnerships are real, we were not able to put a cost on the services provided. To do so would mean tracing costs of services received by One-Stop clients through a large system of support agencies, requiring us to analyze innumerable budgets. For example, if a client walks to the local library and uses a computer to search for jobs, we would have to calculate the cost of that event and somehow count the number of times this happened. Or in another case, a housing agency may have given a client advice about how to find housing; again we would have to find out how many such events took place and attempt to cost the event. This type of tracing through the large complex employment and social service network found in the county was simply not possible.
We analyzed the youth services differently. Youth services are mostly delivered away from the One-Stop center, but by staff that are often housed in and managed by staff in the One-Stop. Since this is viewed by the staff as core program, and managed as part of the One-Stop, it is included in our analysis, even though much of the activity did not take place “under the roof”. Doing this also allowed us to include a youth program in one of case studies which we viewed as important for setting up the larger survey which would come later in study, and would need to include youth.
One-Stop Structure The local area has an Executive Director in the One-Stop but the One-Stop itself is managed by the One-Stop manager. The graphic below shows our initial map of the One-Stop, as the local staff saw it. Units inside the oval are “inside” the One-Stop and units outside the One-Stop are outside the oval. The goal of our analysis was to understand the costs of each unit and what they produced. After discussion with staff and analysis of available data we reduced this map to seven responsibility centers for which we could reliably identify costs and services produced. The responsibility centers are the units through which the city-paid One-Stop staff deliver services and the partners who have measurable operations under the roof. The final list of responsibility centers used in our analysis is:
• Universal Services Unit ( includes staff and facilities providing universal services) • Enrolled Services Unit (includes staff and facilities providing WIA Adult and Dislocated
workers services) • Business Services (includes staff and facilities providing business services) • Youth Services (includes staff and facilities providing youth services) • EDD (includes EDD staff and facilities “under the One-Stop roof”) • Local Adult Education (includes local school district staff providing ESL classes) • Local Job Core (includes staff providing information about Job Corp and serving
participants).

California One-Stop System Cost Study Report
133
Figure C2-1: NoCal Suburban One-Stop Organization Map 04/05
Executive Director One-Stop Manager
Operations (Support)
Universal Services & Partner Outreach
Enrolled Services (Registered) Adult & Dislocated
Job Development & Employment Recruitment
Business Services
City HR (Payroll)
Labor Market Information
County TANF
Public Library
Youth EDD
04/05
NoCal Suburban One-Stop Organization Map 04/05

California One-Stop System Cost Study Report
134
In the year we studied, 2004-05, the One-Stop had 99 people directly on its WIA funded payroll and spent a total of $8.6 million. In addition there were 10-12 EDD employees who worked under the One-Stop’s roof providing services to clients, who accounted for about $1.2 million in costs. Other partners occasionally had staff working under roof, seeing clients, offering workshops, participating in job fairs etc.; these costs totaled about $77,000.
Activity data gives an additional sense of the level of activity of the One-Stop. We look at activities as taking place within four processes (defined later): A “Universal Services Process”, “Enrolled Services Process”, “Youth Services Process” and “Business Services Process”. Below we provide some of the key indicators of level activity for each process. The One-Stop is a busy place. In the 2004-05 year studied in the “Universal Process” there were over 53,000 visits to the One-Stop; over 200 visits a day. Over 6,600 individuals used the One-Stop, and over 77,000 service events took place. The One-stop has a swipe card system which it uses to keep track of visits and attendance at various activities.
Universal Service Process Activities
• 6,676 unique clients visited center • 5,688 new members joined the center • 53,614 unique center visits (one visit per client per day) • 77,355 member services provided (includes Job Club attendance)
In Enrolled Services almost 2,000 clients received some form of individualized services.
Enrolled Services Activities
• 1,838 registered clients (including 1,090 new clients) • 964 exiters • 1,424 intake interviews • 1,090 Individual Employment Plans (IEPs) developed • 1,547 clients got intensive case management
The Business Services reached over 140 businesses.
Business Services Activities • 115 new business clients established a strategic alliance with the One-Stop and received
multiple services • 24 returning clients got new service • 98 rapid response events, reached 3,802 employees
Youth activities reached a over 3,000 youth while approximately 300 formally enrolled in WIA
Youth Activities

California One-Stop System Cost Study Report
135
• 3,078 youth attended workshops • 313 formally enrolled in WIA • 133 placed in work experience • 120 youth exited program
One-Stop Processes and Activities Analysis We began our analysis by mapping the processes we observed in the One-Stop. We asked the One-Stop staff to validate this process map and help us define specific activities. Figure C2-2 shows the final process map, with the key measures of what the processes produced. This process map was the framework we used for estimating the costs of each activity and ultimately the costs of producing different products. As we said previously, we found four major processes in the One-Stop:
1. Universal Access Service Process: This process served any citizen who came to the One-Stop seeking help. It provided a wide range of resources in a resource room, including career and labor market information, access to computers for job searching and resume preparation, access to phones and fax machines, limited one-on-one coaching and advice, career oriented workshops and a large job club.
Within the Universal Access Service Process are a number of activities, as indicated on the process map. After passing through reception, clients may participate in any or all of these activities in any order. Key activities we identified included EDD help, where clients received help accessing EDD services such as filing an unemployment insurance claim, posting a resume on Cal Jobs, and getting information about specialized programs such as the Trade Adjustment Act or veterans programs. The center has touch screen kiosks which provide information about jobs and related programs services. Staff have drop-in appointments with clients where they orient new clients (or members as they are called) to the center’s services and also provide information about enrolling in WIA funded programs, or other programs. The center offers a wide range of workshops, ranging from personal finance to interviewing skills to job search strategies. There is also self-service, where clients use the resources of the center to look for and apply for jobs. This is the most common activity. Clients search job listings, and they use computers to prepare letters and resumes. Clients also use phones and email to contact employers. While clients are self-serving they may seek and get some quick one-on-one assistance from staff who work in the center. One-on-one assistance may include help with writing a resume, help resolving a computer problem, or how to locate resources in the center. Finally, the center has a large job club which holds regular meetings. In the meetings job seekers help each other search for a job and learn from experts who make presentations to the club.
2. Enrolled Services Process: This process provided longer-term services for clients who were registered in any of the various WIA, EDD or County funded workforce programs offered by the center.
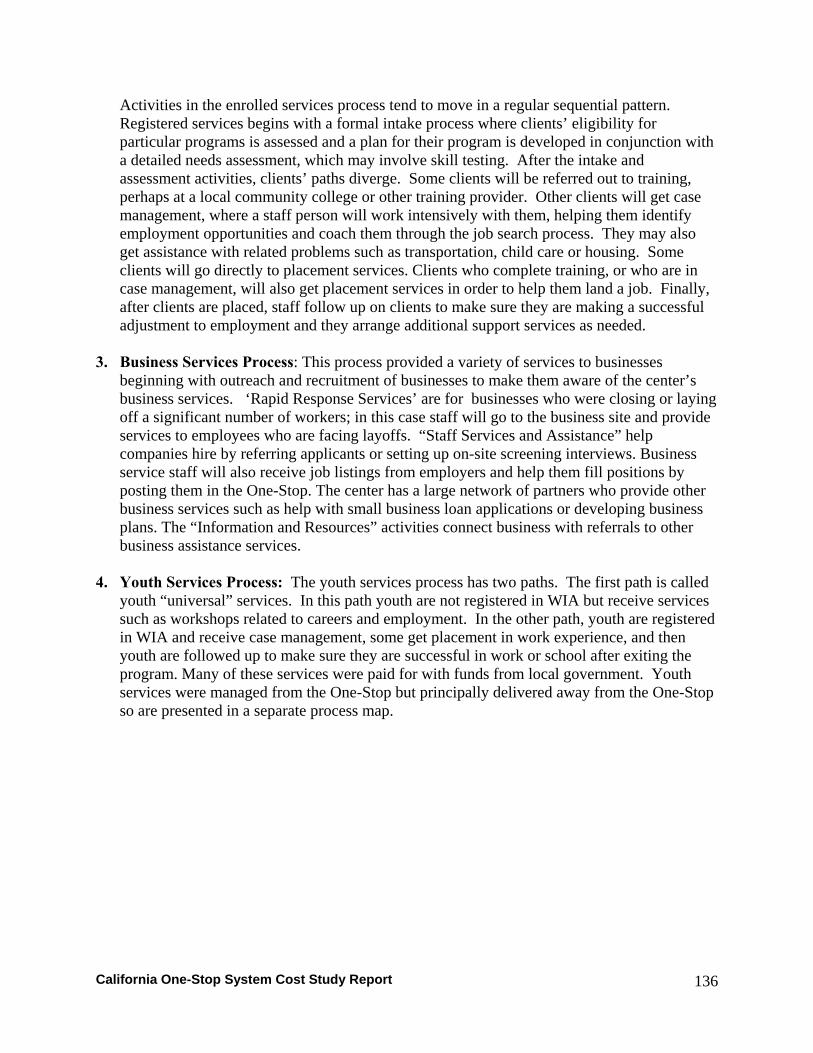
California One-Stop System Cost Study Report
136
Activities in the enrolled services process tend to move in a regular sequential pattern. Registered services begins with a formal intake process where clients’ eligibility for particular programs is assessed and a plan for their program is developed in conjunction with a detailed needs assessment, which may involve skill testing. After the intake and assessment activities, clients’ paths diverge. Some clients will be referred out to training, perhaps at a local community college or other training provider. Other clients will get case management, where a staff person will work intensively with them, helping them identify employment opportunities and coach them through the job search process. They may also get assistance with related problems such as transportation, child care or housing. Some clients will go directly to placement services. Clients who complete training, or who are in case management, will also get placement services in order to help them land a job. Finally, after clients are placed, staff follow up on clients to make sure they are making a successful adjustment to employment and they arrange additional support services as needed.
3. Business Services Process: This process provided a variety of services to businesses beginning with outreach and recruitment of businesses to make them aware of the center’s business services. ‘Rapid Response Services’ are for businesses who were closing or laying off a significant number of workers; in this case staff will go to the business site and provide services to employees who are facing layoffs. “Staff Services and Assistance” help companies hire by referring applicants or setting up on-site screening interviews. Business service staff will also receive job listings from employers and help them fill positions by posting them in the One-Stop. The center has a large network of partners who provide other business services such as help with small business loan applications or developing business plans. The “Information and Resources” activities connect business with referrals to other business assistance services.
4. Youth Services Process: The youth services process has two paths. The first path is called
youth “universal” services. In this path youth are not registered in WIA but receive services such as workshops related to careers and employment. In the other path, youth are registered in WIA and receive case management, some get placement in work experience, and then youth are followed up to make sure they are successful in work or school after exiting the program. Many of these services were paid for with funds from local government. Youth services were managed from the One-Stop but principally delivered away from the One-Stop so are presented in a separate process map.

California One-Stop System Cost Study Report
137
Figure C2-2: NoCal Suburban One-Stop Process Map
Reception-Multiple receptions
Drop in Appt.
Kiosks
Self Service
Workshops Job Club
One-on-One Asst.
EDD Help
EDD One-on-one Veterans Asst.
Planning / Intake Initial Needs Assessment /Develop IEP
Core / IntensiveCase Mgmt.
Training-WIA-TAA- ESL
Follow-up on Placed and Exited Participants
Placement
Universal Access Process (mass service)
Enrolled Clients Process (service shop)
Marketing and Outreach Rapid Response Information and ResourcesStaff Services & Assistance
Support Activities
Employer Services Process (service shop)
NoCal Suburban One-Stop Process Map04-05
Labor Market Outcomes
LAB
OR
MAR
KE
T
• 6,676 Unique Client Visits
• 53,614 Center Visits
• 84,266 Total Services Provided
• 1,838 Total Enrolled Clients
• 964 Exiters
• 98 Rapid Response Events
• 32 Recruitment Events
• 497 Job Seekers Attended

California One-Stop System Cost Study Report
138
Figure C2-2: NoCal Suburban One-Stop Process Map - Youth
NoCal Suburban One-Stop Process Map - Youth
Youth Reception
Recruitment
Universal Services
Case Management
Recruitment of employers for Work Experience
Placement in Work Experience
Follow-Up
Labor Market and
Education
Support Activities
• 3,078 Youth Attended Recruiting Events
• 45 Employers Contacted for Youth
• 133 Placed in Work Experience
• 120 Exits
04-05 Outcomes

California One-Stop System Cost Study Report
139
We attempted to measure what was produced by each activity we identified in the activity mapping exercise. In Table C2-2 we show the activity identified and the best available measures of services produced. This One-Stop kept much better track of its activities than most other sites but still, as the table indicates, we were unable to identify output measures for some activities, and we found multiple measures for others.
Table C2-2: NoCal Suburban One-Stop Processes and Activities with Measures of Services
Activity Service Unit Measure 2004-05
Universal Service Process 6,676 unique clients visited center 53,614 unique center visits by clients (one visit per client per day) 5,688 new members 6,911 non-member services provided 58,408 member services provided 77,355 member services provided (including Job Club) 84,266 services provided 39,924 career center visits
Reception: Receiving of visitors/ Scheduling appointments in-person/ Answering phone inquiries
60 local college appointments. 124 DOR appointments. 117 disability navigator appointments. 171 IAW 365 PJSA 936 intake appointments. 43 Project Hired appointments
Self Service: Clients use resources of One-Stop to search for jobs, write resumes and letters, contact employers
6,676 unique clients visited center 53,614 unique center visits by clients (one visit per client per day)
One-on-one assistance: Drop-in appointments Orientation/ help completing One-Stop membership applications/ Referrals to partners and outside agencies. Help with Labor Market Information and EDD programs such as registering in CalJobs, checking out & troubleshooting computers, website maintenance
4,798 appointments 2,996 first appointments 1,802 repeat appointments 282 people not seen 25 BPAO appointments (Social Security issues) 2,593 service events 7,553 registered in CalJobs 20,049 total one-on-one assistance events
Job club activities: 18,947 Job Club services provided

California One-Stop System Cost Study Report
140
Activity Service Unit Measure 2004-05
Scheduling and arranging job club meetings, managing volunteers
2,402 member visits 200 meetings 72 orientation sessions 342 members reporting return to work 3,120 member volunteer hours Estimated 8,000 peer advising volunteer hours
Workshops Developing , delivering and supporting workshops Workshop Topics: Job Search Skills Workshops (Ace the Interview, Career Exploration, Holiday Job Search, Job Applications, Planning Your Job Search, Resume Facts, Strategize Your Job Search) Labor Market Info Workshops, Employment Shift: Public / Private, Entrepreneurship (SCORE) Self Assessment Workshops – (workshops – Discover You, Managing Your Bills, New Employee Success Tactics, Who Am I) Resume Critique Workshop
793 people attended Foundations workshop 5,316 people attended Universal workshops 148 EDD provided workshops
Job Development: Receive job listings and enter into CalJobs
12,624 jobs entered into CalJobs
Activities for Enrolled Clients (Adult, Dislocated, Other EDD Program, etc.)
Enrolled WIA services 1,838 total registered clients 1,090 new registered clients 964 exiters
Planning/ intake/ developing IEP WIA participants
1,424 intake interviews
Initial needs assessment: Developing Individual Employment Plans (IEP) Soft skills assessment
1,090 IEPs developed 127 soft skills assessment
Managing cases / delivering other 1,441 core case management enrollments

California One-Stop System Cost Study Report
141
Activity Service Unit Measure 2004-05
core and intensive services WIA participants
1,547 intensive case management enrollments 1,061 veterans served by EDD Staff
Providing training services
465 new ITAs 85 ITAs carried over from previous year Trained adult school: 57 adult, 224 dislocated workers 173 soft skills workshop participants 14 clients x 216 hours of instruction = 2,024 hrs of ESL training 100 clients served with training from Trade Adjustment Act by EDD
Following up placed and exited WIA participants.
964 exiters
Activities for Youth Marketing and outreach for youth participants
160 new WIA youth enrollments 3,078 youth attended workshops
Managing cases 2986 visits 391 universal appointments
Managing work experience program
133 Youth placed in work experience
Recruiting employers for work experience
45 employers contacted 17 employers recruited
Universal services: Designing and delivering training and workshops
3 youth communication skills tutoring 4 youth 279 youth job search (universal) 3,078 attended off site workshops
Follow up participants 120 exiters followed up Business Services
• Marketing and Outreach
Marketing and outreach to new and existing business clients
115 new recruited and received services. 65 marketing events for rapid response 24 existing clients receive new service
• Rapid Response
Planning a Rapid Response Delivery of Rapid Response Services
98 companies served 3,802 employees served
Reporting and Follow-up • Network Services
Network: Building partnerships with providers
Assessing Business needs and matching resources
3 existing business clients referred to SBDC 8 new businesses referred to SBDC
Ongoing Account Management and Follow-up
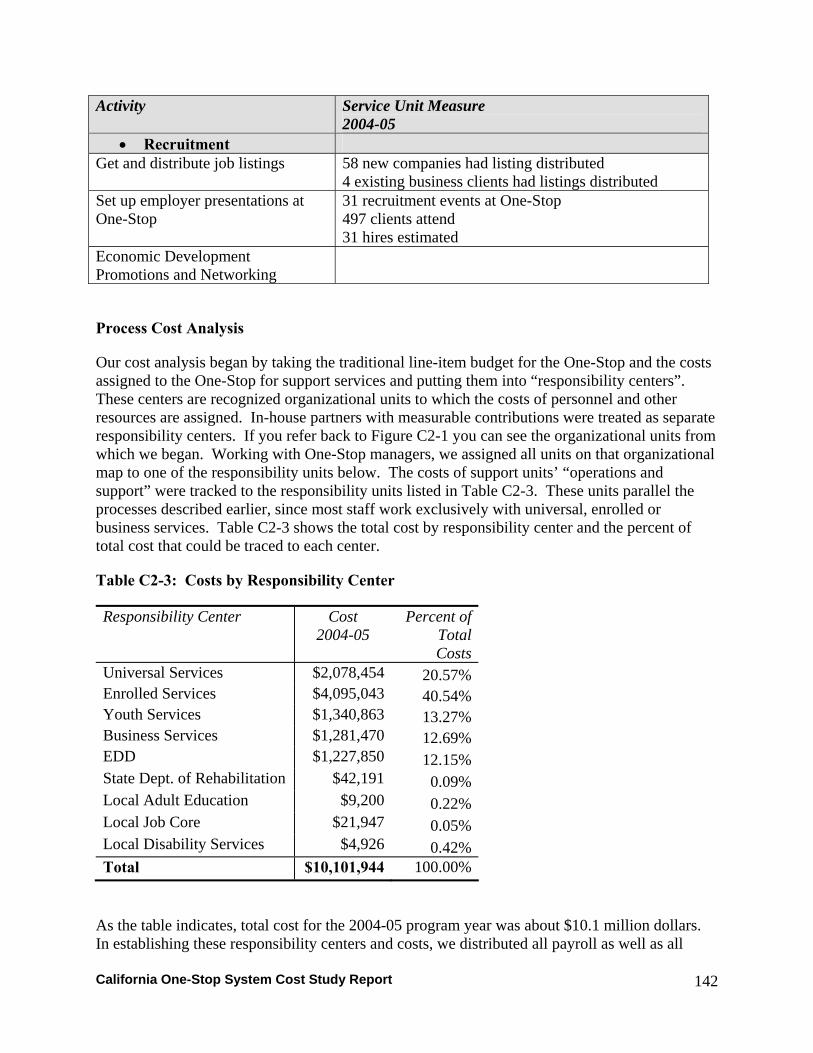
California One-Stop System Cost Study Report
142
Activity Service Unit Measure 2004-05
• Recruitment Get and distribute job listings 58 new companies had listing distributed
4 existing business clients had listings distributed Set up employer presentations at One-Stop
31 recruitment events at One-Stop 497 clients attend 31 hires estimated
Economic Development Promotions and Networking
Process Cost Analysis
Our cost analysis began by taking the traditional line-item budget for the One-Stop and the costs assigned to the One-Stop for support services and putting them into “responsibility centers”. These centers are recognized organizational units to which the costs of personnel and other resources are assigned. In-house partners with measurable contributions were treated as separate responsibility centers. If you refer back to Figure C2-1 you can see the organizational units from which we began. Working with One-Stop managers, we assigned all units on that organizational map to one of the responsibility units below. The costs of support units’ “operations and support” were tracked to the responsibility units listed in Table C2-3. These units parallel the processes described earlier, since most staff work exclusively with universal, enrolled or business services. Table C2-3 shows the total cost by responsibility center and the percent of total cost that could be traced to each center.
Table C2-3: Costs by Responsibility Center
Responsibility Center Cost 2004-05
Percent of Total Costs
Universal Services $2,078,454 20.57%Enrolled Services $4,095,043 40.54%Youth Services $1,340,863 13.27%Business Services $1,281,470 12.69%EDD $1,227,850 12.15%State Dept. of Rehabilitation $42,191 0.09%Local Adult Education $9,200 0.22%Local Job Core $21,947 0.05%Local Disability Services $4,926 0.42%Total $10,101,944 100.00%
As the table indicates, total cost for the 2004-05 program year was about $10.1 million dollars. In establishing these responsibility centers and costs, we distributed all payroll as well as all

California One-Stop System Cost Study Report
143
support costs, such as accounting or rent, to the responsibility centers listed above; so is there is no responsibility center for support costs. Figure C2-3 shows graphically the distribution of costs across responsibility centers.
Figure C2-3: Cost By Responsibility Center
Enrolled Services
41%
Business Services
12%
EDD12%
Youth Services13%
Universal Services
21%
Other Partners1%
The graph above shows that Enrolled Services consumed about 40% of all the costs with Universal services consuming about half as much, around 20%. EDD was the most significant partner by far, accounting for over 12% of all costs, while all other partners accounted for less than 1% of One-Stop costs
Cost By Process and Activity
Our next step was to trace the costs of each responsibility center back to the processes and activities that generated the costs. To understand the cost of each process, and the activities within each process, we identified a number of cost drivers that allowed us to trace costs back to activities. The most important cost driver was staff time, since that was the largest budget item. To identify how staff time was spent we asked managers and many staff members to estimate the time they spent on different activities. We also estimated the amount of physical space used for various activities and traced the cost of that space back to the various activities. We used the judgment of senior managers to distribute support cost across the activities.
We used the same process with EDD and the Department of Rehabilitation, we asked senior managers to attribute staff time to the processes and activities we had mapped, then we had them estimate how support costs were used. In the case of smaller partners such as the Adult Education District, which were involved in only one or two activities, we had partners simply calculate their fully loaded costs for activities in which they were involved.

California One-Stop System Cost Study Report
144
Our mapping of the processes and activities permits us to look at how resources are used at different levels of aggregations and how they relate to different outputs. For example, we can estimate the entire cost of the universal service process and calculate the average cost of serving a universal client. At a more disaggregated level we can look at the specific costs of job club activity and estimate the cost of serving a single job club member.
Figure C2-4 shows a highly aggregated analysis of the costs by each major process: universal service process, enrolled services process, business services process, and youth services process. Remember that we have now combined the costs of all responsibility centers and partners by process.
Figure C2-4: Percent of Cost By Process
Universal Services
28%
Enrolled Services
46%
Business Services
13%
Youth Services13%
As the figure indicates, the enrolled services process accounted for almost half the costs, while universal services process accounted for a bit more than a quarter. Youth and business services were each about one-eighth.
Table C2-4 shows a more disaggregated analysis of costs. Here you can see the cost of each activity. It also shows how much of those costs were supported directly by the local area, EDD and other partners. It’s important to note that here we put partner costs into the processes and activities they support, unlike in the responsibility centers, where we broke out partner costs independent of activity. The activities here go into greater level of detail than in the original process map, as we found managers were able to trace costs, in some cases, to specific sub-activities. For example, within the enrolled services process, managers could trace the cost of providing case management activities to veterans in a specific EDD program. In this analysis we went to the most disaggregated level for which managers could estimate.

California One-Stop System Cost Study Report
145
Table C2-4 shows a detailed break down of costs by processes, specific activities, and the contribution of various partners. A reminder: costs presented include labor, space, supplies and expenses, and support costs such as accounting. The table is broken out to show the costs of the local area, EDD and smaller partners. Overall the One-Stop had costs of about $10 million in 2004-05.
Table C2-4: Cost Detail by Process and Activity
Local Area Cost
EDD Costs Other Partner
Costs
Total Cost
Universal Services Process
$2,078,454 $684,270 $34,038 $2,796,762
Outreach and recruitment for participants $843 $843Reception: Answer point coverage – non-Job Seeker Center
$332,553 $332,553
Reception: At Job Seeker Center: receiving visitors, scheduling appointments, answering phone
$374,122 $1,668 $375,810
Drop-in appointments $374,122 $374,122Information and referral Kiosks $62,354 $62,354One-on-one assistance in the resource room, help with LMI and EDD programs, checking out & troubleshooting computers, website maintenance
$290,984 $243,012 $27,288 $561,284
Assistance with CalJobs $127,901 $127,901Developing, delivering and supporting workshops
$270,199 $31,976 $302,175
Job Development $140,691 $4,219 $144,910Supporting job club activities $311,768 $127,900 $439,668One-Stop support and administration for Universal activities
$62,354 $12,790 $75,144
Activities for Enrolled Clients (Adult, Dislocated, Other EDD Program, etc.)
$4,095,043 $530,790 $43,805 $4,669,638
Planning / Intake $491,405 $491,405Initial Needs Assessment / Developing IEP $491,405 $491,405Managing cases / Delivering other core and intensive services (non EDD programs)
$1,105,662 $12,658 $1,118,320
Providing training services $1,023,761 $1,023,761Soft Skills assessment / Training (PEP) $286,653 $286,653One-on-one services to Veterans $332,543 $332,543Trade Adjustment Act participant services $198,247 $198,247Learning Lab $122,851 $122,851ESL training (Adult Ed) $9,200 $9,200Following up placed and exited participants. $573,306 $21,947 $595,253

California One-Stop System Cost Study Report
146
Local Area Cost
EDD Costs Other Partner
Costs
Total Cost
Business Services $1,281,470 $12,790 $421 $1,294,681Marketing and Outreach (Subtotal) $291,243 $291,243Marketing and outreach to new business clients $232,995 $232,995Marketing to existing clients $58,249 $58,249Rapid Response (Subtotal) $582,486 $12,790 $595,276Planning a Rapid Response $104,848 $104,848Delivery of Rapid Response services $122,322 $122,322Reporting and Follow-up $122,322 $122,322Information and resources $232,995 $232,995Building partnerships with providers (Subtotal)
$116,497 $421 $116,918
Assessing Business needs and matching resources
$46,599 $46,599
Ongoing Account Management and Follow-up $69,898 $421 $70,319Staffing (Subtotal) $291,243 $291,243Get and distribute job listings $101,935 $101,935Recruiter Services $87,373 $87,373Set up employer presentations at One-Stop for adult, dislocated worker and universal clients
$72,811 $72,811
Economic Development Promotions and Networking
$29,124 $29,124
Activities for Youth $1,340,863 $1,340,863Youth Answerpoint $67,043 $67,043Recruitment of youth participants $268,173 $268,173Universal Services for Youth $134,086 $134,086Managing cases $536,345 $536,345Recruitment of employers for work experience 67,043 $67,043Placement in work experience 67,043 $67,043Following up youth 201,129 $201,129 TOTAL $8,795,830 $1,227,850 $78,264 $10,101,944
Looking within the processes we gain some additional insights about where the $10 million in costs were generated. Within the Enrolled Services Process, the largest costs were generated by case management and the provision of training services, over $1 million each, out of total costs of $4.6 million. (It is important to note that training costs do not include the costs of Individual Training Accounts (ITAs) and the vouchers that pay for training in the WIA system, because training is not provided “under the roof”). The costs of bringing clients into the programs were substantial, the cost developing plans and assessing clients amounts to almost $1 million.
The next highest cost process was Universal Services at nearly $2.8 million. Simply receiving clients, answering questions and managing the high volume of clients in the Universal Process

California One-Stop System Cost Study Report
147
was the highest cost activity, with over $700,000 in costs. It is important to note that due to the facility’s structure and setting there are several reception areas and walk up stations where clients can get questions answered. Another high cost activity was the job club, which had costs of $439,668. Job club costs include substantial investments from both the local area, over $311,000, and EDD, about $128,000. Providing workshops cost about $300,000 dollars.
The Business Service Process had almost $1.3 million in costs. In that area the highest costs were found in Rapid Response services, with costs over $595,000. General marketing and outreach to businesses cost $291,000 while marketing to new clients cost $233,000.
In the Youth Services Process, case management was the most costly activity by far, $536,000 out of a total cost of $1.3 million. Recruitment of participants cost $268,000 and follow-up cost an additional $201,000.
Cost By Service Line
The final step in our analysis was to estimate the costs of particular One-Stop services produced by processes and activities described before. One-Stops are a service business and it is often hard to distinguish between activities and services. For example, when a client has a one-on-one session with a counselor to review her resume, is the product a counseling session or is this event merely an activity leading to a product such as placement in a job? We did not worry too much about this distinction. In this case we were constrained by what the One-Stop measured, we could only estimate costs for services which were measured by the One-Stop. We could also only calculate costs for specific services when One-Stop staff could assign cost drivers – usually their time – to specific activities that directly linked to measured service lines. We were also interested in services that were likely to be found in other One-Stops, such as a universal access visit, or a workshop. We begin our cost-per-service estimates with the services that we view as produced by a whole process, not just an individual activity, we also focus on services we thought would be common to other One-Stops and thus could provide some valuable insights about managing One-Stops.
Before we could calculate the costs for each service, we needed to deal with an additional methodological problem, the problem of “joint costs” (see Text Box C2-2). Joint costs are those costs that are shared by various products. For example, reception is an activity that supports many products such as universal access visits, case management, job placement and others. It is impossible to actually break that cost down to get an accurate estimate of the cost of reception for each product.
Text Box C2-2: The Problem of Joint Costs Some of the “cost-per” calculations are afflicted by a condition known as the “joint cost” or “joint product” or “joint revenue” problem. This condition occurs when two or more products are produced using a single, indivisible input (or are associated with a single bundled revenue stream). This creates ambiguity when we try to compute the cost-per of the separate outputs.

California One-Stop System Cost Study Report
148
A common example is that of raising chickens. An input is the feed. Outputs include chicken wings, chicken legs, and chicken breasts. We may know the chicken ate 9 pounds of food, but we do not know exactly how much of that food went to the chicken’s wings, legs, or breasts. In this example, the cost-pers would likely be approximated by apportioning the cost of the chicken feed according to either the weight of each of the component outputs, or the revenue associated with the component outputs. So, an approximation in this example is only an estimate, but is possible. However, other cases of joint costs are more difficult to solve. These more difficult cases occur when the revenue for a component product is hard to determine (or when there is no revenue associated with a particular product), and when the product has no physical weight (or when the weight is not clearly related to revenue). This is the nature of a One-Stop’s operations. Consider the resource room, for example. We can determine the total amount a One-Stop spent on the resource room. We can even calculate how much it cost to make the resource room available, on a per-person basis, for the year. But then some people who use the resource room will end up producing a resume, and others will end up producing a job search plan. There is no good way—as far as we can see at this point—to know how to apportion the valid cost of the resource room across those separate outputs. These outputs have no apparent revenue associated with them, and they have no physical weight. So, a calculation of the “cost per resume” or “cost per job search plan” would be very difficult.
In making our estimates we tried to get as close as possible to the unique costs of a service. In cases where we could not break down the joint costs, we only assigned the costs directly attributable to the product. Table C2-9 below includes notes on how we made our calculations. In some cases we were able to identify costs that went with a particular activity but did not have measures of the services produced by that activity so no cost per service calculations were possible. The tables below show the best cost per service calculations we could make by the four processes identified earlier.
Universal services are produced in a high volume at relatively low cost. You can see in Table C2-5 that if we take all universal costs and simply divide by all universal clients we get a cost per client of $419, if we look further and track the number of visits made for universal services we get a cost per of $52 per visit. Providing one-on-one assistance in the resource room was a significant cost item and costs per service were $28 an event.
A significant universal activity at this One-Stop, in which EDD was a major partner, is the large and active job club. The cost of planning and hosting a job club meeting as $2,198, and it cost $183 per job club member visit. Similarly developing and delivering a workshop cost $2,042. EDD provides a service which benefits both businesses and job seekers in that it enters jobs into the internet based job bank CalJobs, we calculate it costs about $11 to enter a job into the system.

California One-Stop System Cost Study Report
149
Table C2-5: Cost of Universal Access Services Universal Services Cost Units Cost Per
Unit Notes*
Serving a Universal Access client $2,796,762 6,676 $419 1Providing a Universal Access visit $2,796,762 53,614 $52 1Job club member visit $439,668 2,402 $183 2Providing a Job Club meeting $439,668 200 $2,198 3One-on-on assistance in resource room $561,284 20,049 $28 4Developing and delivering workshops $302,175 148 $2,042 5Serving a client in a workshop $302,175 6,109 $49 6Enter job into CalJobs 140,697 12,624 $11 6a*refer to Table C2-9 for further explanation of calculations It was, not surprisingly, much more costly to serve clients formally enrolled in a WIA or EDD program. If we consider the costs of recruiting, assessing, and providing case management and other intensive services to WIA clients we find a per client cost of $2,252. The cost of case management alone averages $715. Placing clients in training and managing them during training cost $1,861 for a client receiving training; remember this does not include the direct cost of training usually paid for through and ITA (voucher). Following up participants who have completed their planned program cost $595 per participant. Participants receive different packages of services and these cost-per measures help us understand the costs of the various packages. For example, a client who went through initial enrollment and got case management and related intensive services and who was followed up cost $2,212. A client who got those services plus training cost $4,073. Similarly, we are able to estimate the costs of servicing enrolled clients in two EDD programs, Veterans Services and Trade Adjustment Act (TAA). Veteran client services were less costly averaging only $313 per veteran, while TAA clients were more similar to WIA clients in case management, averaging costs of $1,982 per client. Some training services were provided in the One-Stop by partners “under the roof” of the One-Stop. The local adult education program provided ESL training, the costs of serving an ESL student was $657 per student and the cost of an hour of instruction was $43. Table C2-6: Cost of Enrolled Services Enrolled Service Cost Number of
UnitsCost Per
Unit Note*
Serving an Enrolled WIA client $4,138,848 1,838 $2,252 7Enrolling a client and developing and Individual Plan
$982,810 1,090 $902 7a
Providing case management and other intensive services
$1,105,662 1,547 $715 7b
Providing training services $1,023,761 550 $1,861 7cProviding soft skills assessment and training
$122,851 173 $710 7e

California One-Stop System Cost Study Report
150
Enrolled Service Cost Number of Units
Cost Per Unit
Note*
Follow up exited participants $573,306 964 $595 7dEDD serving a veteran $332,543 1,061 $313 8Serving an EDD Trade Adjustment Act client
$198,247 100 $1,982 9
Providing ESL training per client $9,200 14 $657 10Providing ESL training per instructional hour
$9,200 216 $43 11
*refer to Table C2-9 for further explanation of calculations Business services account for about 13% of the One-Stop’s costs. The data available on services provided allowed us to make a number of cost calculations. Recruitment costs are estimated at $232,995 spent to recruit 115 business clients, yielding a client acquisition cost of $2,427. Similarly outreach to existing clients cost of $2,427 per existing client who received additional services. We estimate providing Rapid Response Services, which is usually done in conjunction with EDD, cost $3,697 per company served and $95 per worker reached. The One-Stop gets and distributes job listings for companies; we estimate costs of serving each company that used this service at $1,644. In addition the One-Stop host events where multiple companies can come into the One-Stop and recruit employees, we estimate the cost of these events at $2,349, and cost per individual job seeker who attends these events is $147. Table C2-7: Cost of Employer Services Business Service Produced Cost Per
UnitNumber of Units
Total Cost Note*
New business clients recruited $232,995 115 $2,026 12Existing clients recruited for service $58,249 24 $2,427 13Provide Rapid Response service for a company $362,282 98 $3,697 14Provide Rapid Response services to an individual worker
$362,282 3,802 $95 15
Distribute companies job listings per company $101,935 62 $1,644 16Provide recruitment event at One-Stop $72,811 31 $2,349 17Serve an individual client at recruitment event $72,811 497 $147 18*refer to Table C2-9 for further explanation of calculations This One-Stop runs an active youth program. The program serves both youth who are formally enrolled in WIA and youth who are not. The program is funded with money from both WIA and local government. Overall the average cost of serving a youth in the program is $414. A major program expense is case management where staff work one-on-one with youth. We were able to get the number of case management visits made and we estimate the cost of a case management visit at $159. An important service for enrolled clients is work experience. We estimate the cost of finding work experience jobs and placing students in them at $1,008 per youth participant.
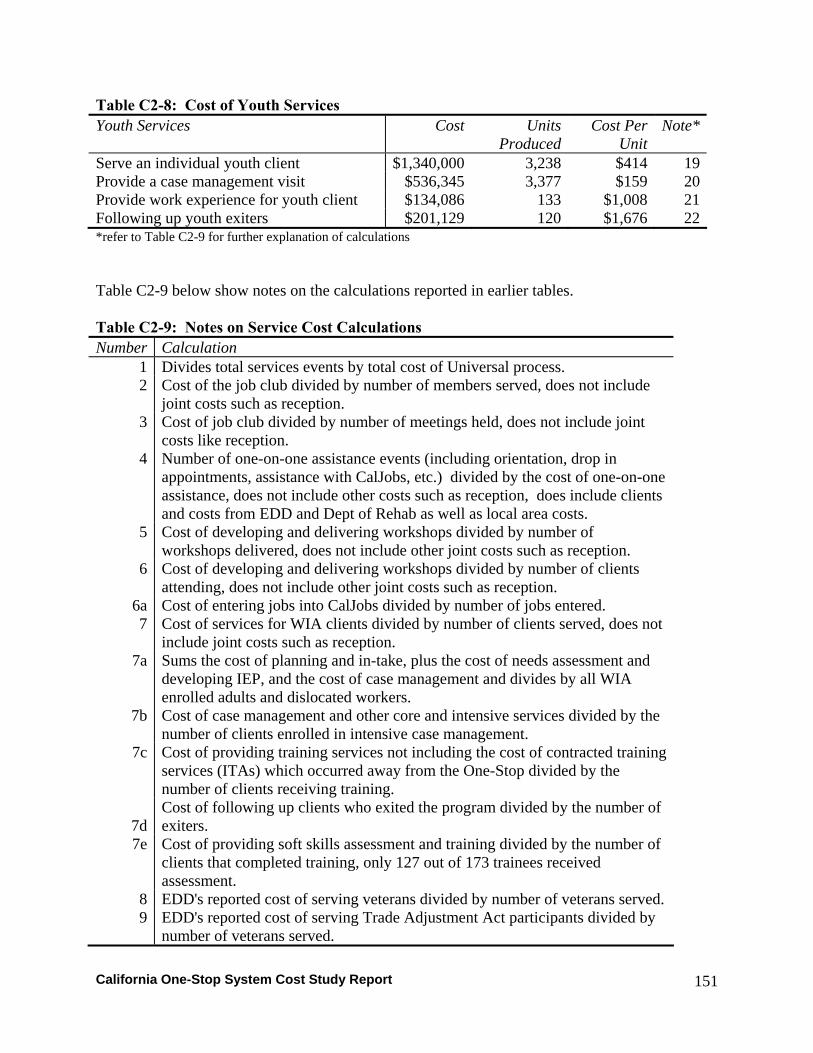
California One-Stop System Cost Study Report
151
Table C2-8: Cost of Youth Services Youth Services Cost Units
ProducedCost Per
Unit Note*
Serve an individual youth client $1,340,000 3,238 $414 19Provide a case management visit $536,345 3,377 $159 20Provide work experience for youth client $134,086 133 $1,008 21Following up youth exiters $201,129 120 $1,676 22*refer to Table C2-9 for further explanation of calculations Table C2-9 below show notes on the calculations reported in earlier tables. Table C2-9: Notes on Service Cost Calculations Number Calculation
1 Divides total services events by total cost of Universal process. 2 Cost of the job club divided by number of members served, does not include
joint costs such as reception. 3 Cost of job club divided by number of meetings held, does not include joint
costs like reception. 4 Number of one-on-one assistance events (including orientation, drop in
appointments, assistance with CalJobs, etc.) divided by the cost of one-on-one assistance, does not include other costs such as reception, does include clients and costs from EDD and Dept of Rehab as well as local area costs.
5 Cost of developing and delivering workshops divided by number of workshops delivered, does not include other joint costs such as reception.
6 Cost of developing and delivering workshops divided by number of clients attending, does not include other joint costs such as reception.
6a Cost of entering jobs into CalJobs divided by number of jobs entered. 7 Cost of services for WIA clients divided by number of clients served, does not
include joint costs such as reception. 7a Sums the cost of planning and in-take, plus the cost of needs assessment and
developing IEP, and the cost of case management and divides by all WIA enrolled adults and dislocated workers.
7b Cost of case management and other core and intensive services divided by the number of clients enrolled in intensive case management.
7c Cost of providing training services not including the cost of contracted training services (ITAs) which occurred away from the One-Stop divided by the number of clients receiving training.
7d Cost of following up clients who exited the program divided by the number of exiters.
7e Cost of providing soft skills assessment and training divided by the number of clients that completed training, only 127 out of 173 trainees received assessment.
8 EDD's reported cost of serving veterans divided by number of veterans served. 9 EDD's reported cost of serving Trade Adjustment Act participants divided by
number of veterans served.
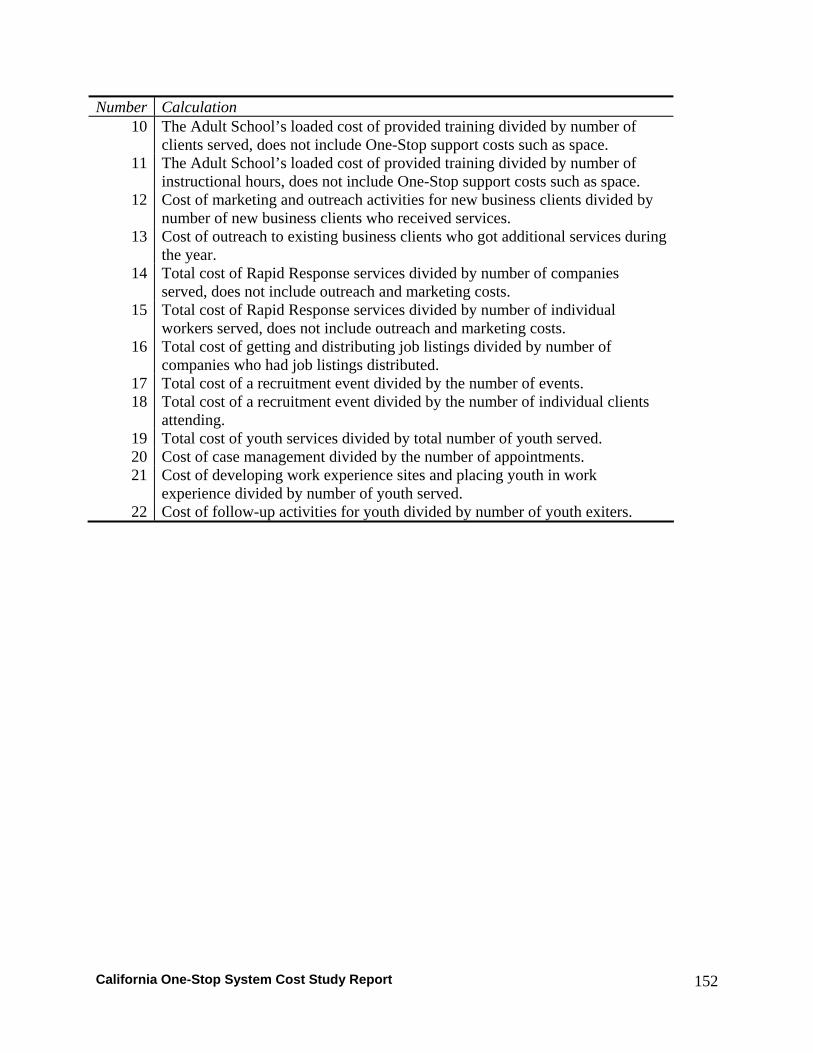
California One-Stop System Cost Study Report
152
Number Calculation 10 The Adult School’s loaded cost of provided training divided by number of
clients served, does not include One-Stop support costs such as space. 11 The Adult School’s loaded cost of provided training divided by number of
instructional hours, does not include One-Stop support costs such as space. 12 Cost of marketing and outreach activities for new business clients divided by
number of new business clients who received services. 13 Cost of outreach to existing business clients who got additional services during
the year. 14 Total cost of Rapid Response services divided by number of companies
served, does not include outreach and marketing costs. 15 Total cost of Rapid Response services divided by number of individual
workers served, does not include outreach and marketing costs. 16 Total cost of getting and distributing job listings divided by number of
companies who had job listings distributed. 17 Total cost of a recruitment event divided by the number of events. 18 Total cost of a recruitment event divided by the number of individual clients
attending. 19 Total cost of youth services divided by total number of youth served. 20 Cost of case management divided by the number of appointments. 21 Cost of developing work experience sites and placing youth in work
experience divided by number of youth served. 22 Cost of follow-up activities for youth divided by number of youth exiters.

California One-Stop System Cost Study Report
153
Appendix C-3: Case Study 3 – Central California Rural/Suburban One-Stop Report

California One-Stop System Cost Study Report
154
Central California Rural One-Stop Case Report Background The Central California Urban One-Stop is part of a local area, which we will call the Central Valley WIB, which operates multiple full-service One-Stops. The WIB works in very close partnership with the County government. One-Stop employees are County employees, and some of the space in the One-Stop’s building is used for County activities other than those typically performed by One-Stops. On the whole, the working relationship between the One-Stop and the County appears very close and seamless. Central California Urban One-Stop Description The Central California Urban One-Stop serves an area whose population is growing fairly rapidly, and in which the agriculture industry is a major economic force. The region served by the One-Stop is economically well below the rest of the state, and the workforce on the whole is not highly skilled; English as a Second Language (“ESL”) training is popular in the area. The One-Stop itself occupies two buildings. One building is a multi-story structure that houses One-Stop administration and some other County services. The other building is a single-story structure in which the bulk of the One-Stop’s services occur. The multi-story structure does contain some classroom and conference-room space that is sometimes used for providing One-Stop services. The single-story structure is quite expansive, and contains the full range of facilities normally associated with a good-size One-Stop. For example, there is a large resource room, which was buzzing with activity during our visit, right at the building’s entrance, and there is classroom space toward the back of the building. The One-Stop is busy, averaging over 100 visits a day to its resource room and also over 100 visits per day of various other types (e.g., enrolled customers, businesses). The costs generated by this operation during the year studied were about $4.2 million. The Central California Urban One-Stop is unique in its relatively heavy use of subcontracts to provide some enrolled services. Specifically, what is typically called “case management” at a One-Stop is largely outsourced to a number of specialized partners, and occurs largely away from the One-Stop’s building and therefore those costs are excluded by definition from our analysis. The list below shows the agencies which are official partners of the One-Stop. Table C3-1 lists agencies that provided measurable contributions on One-Stop premises and are featured in our analysis. The table also lists partners in the WIA program that may provide valuable service to clients but do not provide services “under the one-stop roof” and hence are outside the scope of our analysis.

California One-Stop System Cost Study Report
155
Table C3-1: Central California Rural One-Stop Partner List
Partners Providing Measurable Contribution to the One-Stop, On-Premises
• State of California Employment Development Department, • Community Services and Training Agency • Farm Workers Assistance • Department of Rehabilitation • Deaf and Hard of Hearing • American Association of Retired People • Department of Health and Human Services • Employment Services Agency
Partners Contributing to the One-Stop, Off-Premises
• Services to Individuals with Disabilities • Local Community College, • County Child Support Services • Job Training for ex-Offenders • Small Business Development Center
Defining the One-Stop Boundaries For the purposes of our analysis we had to define what was inside and what was outside the One-Stop. More so than any of our other three case study sites, this One-Stop tested our definition of what is included in the cost study and what is excluded. This One-Stop—more specifically, the WIB—has significantly large contracts with a number of third-party partners to provide “enrolled services” to One-Stop customers.
Our study team had previously developed an “operational definition” of what was and what was not considered a One-Stop activity for the purpose of our analysis:
Activities and agencies are included in the analysis if they provide workforce services to One-Stop clients and if the services are provided under the roof of the One-Stop.
Based on this definition, partners’ activities that are performed on One-Stop premises are included in our calculations. However, partners’ activities that occur off One-Stop premises are excluded from our calculations. This rule is not intended to make any judgment one way or the other about the effectiveness of these contracting arrangements toward achieving either a cost-efficiency or a quality objective. We implemented the rule strictly as a way of treating the various One-Stops in our study in a way that is consistent and that therefore can provide useful benchmarking data. The Local Area has more than one One-Stop and, on behalf of the set of One-Stops, engages in contracts with a series of off-site service providers, primarily to provide services to enrolled

California One-Stop System Cost Study Report
156
customers (e.g., case management, job search assistance, some workshops and training). The service providers are differentiated from one another by their focus on specific and distinct sub-groups of the One-Stop’s customers. The dollar amounts of the contracts between the Local Area and the off-site service providers are significant in size, which might be expected since “enrolled services” tend to be considerably more costly on a per-person basis than “universal services.” One-Stop Structure The One-Stop is managed by a center director. Based our observations and discussion with WIB and One-Stop staff, we broke the work of the center into four responsibility centers.20
• Universal Services Unit • Enrolled Services • Business Services • Administrative Director Office
The responsibility centers are the units through which the city-paid One-Stop staff delivers services and the partners who have a measurable contribution operate under the roof. A responsibility center has one person who, on a One-Stop’s organization chart, is primarily responsible for operations within that responsibility center.
In the year we studied, 2004-05, the One-Stop had 29 people on its payroll, not including personnel listed as being WIB administration. These 29 people generally are those who are on the floor providing services to customers. In addition, a series of partners had personnel working in the One-Stop’s building to serve One-Stop clients, and therefore these partners are treated as responsibility centers in our study:
• EDD: seven FTE • Employment Services Agency: one person full-time, a second person three days a week • Services to Individuals with Disabilities: one person, two hours per week • Department of Health and Human Services: two full-time employees • Department of Rehabilitation: one person, twelve hours per week • Deaf and Hard of Hearing: one FTE • American Association of Retired People: one full-time employee • Farm workers Assistance: 0.75 FTE
Activity data gives an additional sense of the level of activity of the One-Stop. In the 2004-05 year studied there were a total of over 60,000 visits to the One-Stop, which works out to about 240 visits per day. There were about 14,400 first-time visits to the One-Stop, which are about 58 per day.
20 In the 2004-05 fiscal year, which was studied, the One-Stop director was also responsible for a Youth program which was housed at a separate site, with its own supervisor. While the payroll for this program was included in the One-Stop’s budget it is not included in our analysis.

California One-Stop System Cost Study Report
157
A total of 1,282 individuals were served as “WIA enrolled” customers. Of these, 788 were new registrants and 845 exited. There were 860 new visitors to the “Business Services” function, and a total of 1,355 visitors during the year. It is not clear how many of these visitors represented businesses and how many were individual job-seekers. One-Stop Processes and Activities We began our analysis by mapping the processes we observed in the One-Stop. We asked the One-Stop staff to validate this process map and help us define specific activities. Figure C3-1 shows the final process map, with the key measures of what the processes produce. This process map was the framework we used for estimating the costs of each activity and ultimately the costs of producing different products. We found three major processes in the One-Stop: One-Stop Processes and Activities Analysis We began our analysis by mapping the processes we observed in the One-Stop. We asked the One-Stop staff to validate this process map and help us define specific activities. Figure C3-1 shows the final process map, with the key measures of what the processes produced. This process map was the framework we used for estimating the costs of each activity and ultimately the costs of producing different products. As we said previously, we found four major processes in the One-Stop:
1. Universal Services Process: The operation provides walk-in services such as on-line job searching, computers and printers for producing resumes and letters, career information, and referral information. Most clients engage in self service, but at any given time there are multiple staff members from the One-Stop, the EDD unit, and other partners, engaged in one-on-one assistance. Anyone who walks in and provides their name, address and social security number may use these services.
Within the Universal Access Service Process are a number of activities, as indicated on the process map. After passing through reception, clients may participate in any or all of these activities in any order. While most activity is self-service, where clients access information or work on resumes and cover letters, staff is available for one-on-one assistance. The assistance ranged from help accessing the internet, to feedback on resumes and letters, to quick referrals for other types of help. The center offers a range of workshops, and generally runs in the range of five to ten workshops monthly. The Universal Services process incorporates the daily activities of a wide array of One-Stop personnel; some One-Stop personnel work more or less full-time on Universal Services activities, and many others that are assigned primarily to other activities also spend some portion of their time contributing to the Universal Access Process. Partly

California One-Stop System Cost Study Report
158
for this reason, the Universal Access Process also includes Outreach and Recruitment activities.
2. Enrolled Services Process: The enrolled services area provides some training and case management activities, though a large portion of the case management activity is sourced to a series of local subcontractors who specialize in serving various identifiable sub-groups who can benefit from services customized to their particular needs and the particular industry/ies in which they seek work. This is a key way in which the Central California Urban One-Stop differs in a major way from other case study sites. Much of the activity performed as “enrolled services” at the Central California Urban One-Stop is performed by partners under contract, off-premises. Placement activities are conducted in close cooperation with the “Business Services” process, as Business Services includes reaching out to employers to define employer needs and to define opportunities for One-Stop customers.
3. Business Services Process: This unit markets the One-Stop’s services to employers, develops job prospects for clients, and compiles information and reports intended to be useful to businesses. Members of this unit also conduct outreach activities and sometimes provide Rapid Response services. Rapid Response services are customized for businesses that are considering closing or laying-off a significant number of workers.
Other “Employer services” include generating reports that provide information on local economic trends and provide economic forecasts. These reports are designed to be useful for local business, most of which who lack the resources and capacity to do such research themselves.

California One-Stop System Cost Study Report
159
Figure C3-1: Central CA Urban One-Stop Process Map
Outreach / Recruitment
Reception / Orientation
Self Service
Coaching /1-on-1 assist.
Group Workshops
04-05 Labor Market
Outcomes
Support Activities)
Employer Outreach Employer Services
PlanningIntakeIEP
Core / IntensiveCase Mgmt.
Basic Skills
Placement
Job Development
TrainingOJTITA
IndividualJob
Development
Central CA Urban One-Stop Process MapUniversal Access Process (mass service)
Registered Clients Process (service shop)
Business Services Process
• 60,732 totalclient visits
• 26,013 Universalvisits
• 8,892 one-on-oneinteractions inResource Room
• 1,282 WIA Registered clients
• 788 new WIARegistered
• 845 exiters
• 860 visitors• 495 new visitors• 273 field visits• 1,818 instances oftechnical asst.860 hired through“on-site recruiting’events
LAB
OR
MA
RK
ET
Off-site 3rd-party subcontractors

California One-Stop System Cost Study Report
160
Process Cost Analysis
We began by taking the traditional line item budget for the One-Stop and the costs assigned to the One-Stop for support services and putting them into “responsibility centers”. These centers were recognized organizational units to which personnel and other costs could be assigned. Other responsibility centers were identified when there were significant shared resources such as classrooms, or in-house partners with significant contributions. Table C3-2 shows the total cost by responsibility center.
Table C3-2: Costs by Responsibility Center
Responsibility Center Cost Percent of total
Resource Room $1,684,732 40.1% Enrolled Services $612,525 14.6% Business Resources $379,788 9.1% Admin Directors Office $417,805 10.0% EDD $617,692 14.7% Community Services and Training Agency $149,037 3.6% Employment Services Agency $77,322 1.8% Job Training for ex-offenders $1,560 0.0% HHSA $91,500 2.2% Dept. of Rehab $30,413 0.7% Deaf and Hard of Hearing $46,323 1.1% AARP $48,326 1.2% Farm workers Assistance $36,245 0.9% Total $4,193,268 100.0%
As the table indicates, total cost for the 2004-05 program year was slightly above $4 million dollars. In establishing these responsibility centers and costs, we distributed all support costs, such as accounting and rent, to the responsibility centers listed above, so is there is no cost center for “support costs.”
Partners listed on Table C3-1 are all lines from “EDD” downward. The total partner contribution to the One-Stop’s operations is $1,098,417. Figure C3-2 shows the amount each partner contributed to the One-Stop’s operations, as a percentage of the total partner contribution.
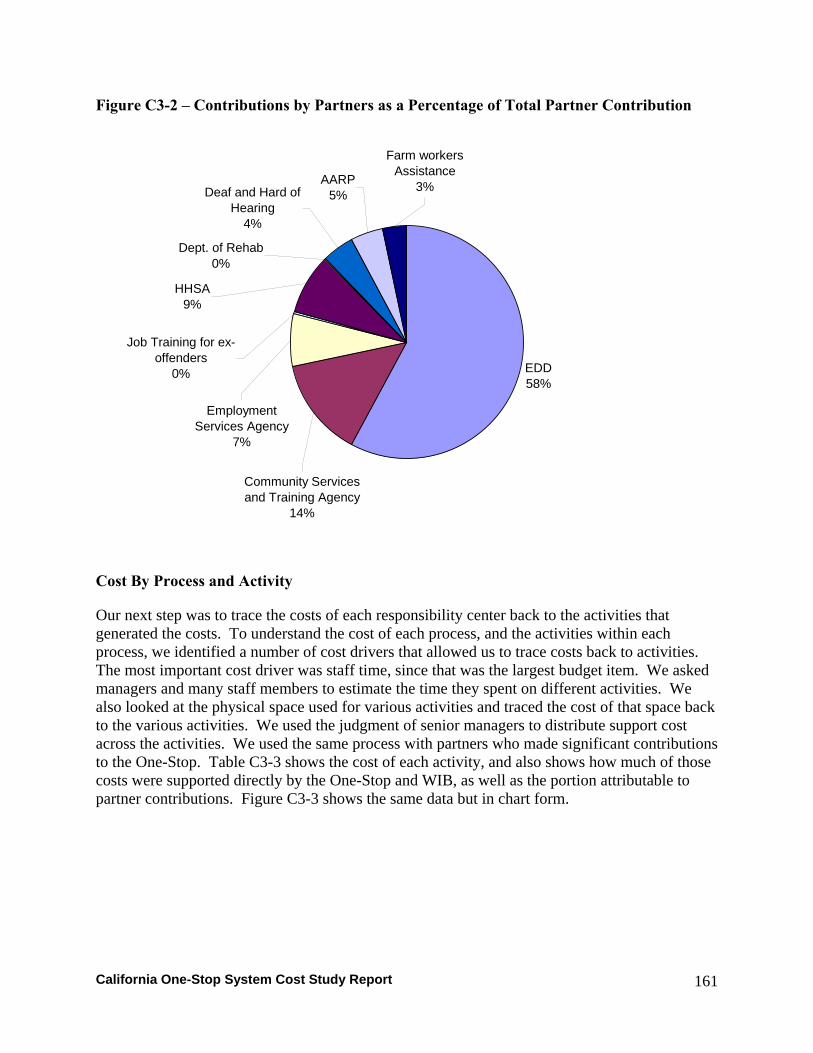
California One-Stop System Cost Study Report
161
Figure C3-2 – Contributions by Partners as a Percentage of Total Partner Contribution
EDD58%
AARP5%
Farm workers Assistance
3%
Community Services and Training Agency
14%
Employment Services Agency
7%
Job Training for ex-offenders
0%
HHSA9%
Dept. of Rehab0%
Deaf and Hard of Hearing
4%
Cost By Process and Activity
Our next step was to trace the costs of each responsibility center back to the activities that generated the costs. To understand the cost of each process, and the activities within each process, we identified a number of cost drivers that allowed us to trace costs back to activities. The most important cost driver was staff time, since that was the largest budget item. We asked managers and many staff members to estimate the time they spent on different activities. We also looked at the physical space used for various activities and traced the cost of that space back to the various activities. We used the judgment of senior managers to distribute support cost across the activities. We used the same process with partners who made significant contributions to the One-Stop. Table C3-3 shows the cost of each activity, and also shows how much of those costs were supported directly by the One-Stop and WIB, as well as the portion attributable to partner contributions. Figure C3-3 shows the same data but in chart form.

California One-Stop System Cost Study Report
162
Table C3-3: Costs by Activity
Activity Total cost One-Stop + WIB Support
Cost
Partner contribution
Universal Activities $1,619,118 Reception & orientation $531,057 $399,617 $131,439Assessment $123,923 $123,923 $0IEP/ISS $20,890 $20,890 $0Self service $197,720 $197,720 1-on-1 coaching (excl. case management) $745,528 $421,183 $324,345Enrolled Activities $1,789,559 Case Management $279,589 $181,007 $98,582OJTs $0 $0 $0Direct placement $254,429 $69,609 $184,821PLACEMENT/ Occupational skills training $501,974 $501,974 $0Workshops / seminars $358,238 $263,604 $94,634Placement & follow-up $395,329 $360,587 $34,742Business Services $784,590 Business information $94,947 $94,947 $0Job development $527,548 $297,694 $229,854Rapid Response $37,979 $37,979 $0Outreach & recruitment $124,116 $124,116 $0Total Cost $4,193,267 $3,094,850 $1,098,417
Of the $4.2 million total cost of operating the One-Stop, about $1.6 million (38.6%) was traceable to Universal Activities, about $1.8 million (42.7%) was traceable to Enrolled Activities, and about $0.75 million (18.7%) was traceable to Business Services.
When we look at the cost of specific activities, we find that the highest costs in the Universal Access process were generated by “coaching and one-on-one assistance.” We can see that both One-Stop staff and EDD staff put substantial time into this activity, generating high costs. Outreach, recruitment and eligibility workshops were second highest cost activity in this process.

California One-Stop System Cost Study Report
163
Figure C3-3 – Cost by Activity
$0
$100,000
$200,000
$300,000
$400,000
$500,000
$600,000
Recep
tion &
orien
tation
Asses
smen
t
IEP/IS
S
Self se
rvice
1-on-1
coun
selin
g (ex
cl. ca
se m
anag
emen
t)
Case M
anag
emen
tOJT
s
Direct
place
ment
ITA / Occ
upati
onal
skills
traini
ng
Work
shop
s / se
minars
Placem
ent &
follo
w-up
Busine
ss in
formati
on
Job d
evelo
pmen
t
Rapid
Respo
nse
Outrea
ch &
recru
itmen
t
Activity
Cos
t
Cost By Service
The final step in our analysis is to estimate the costs of particular One-Stop services. In each case study, we were constrained by what the One-Stop measured, so we could only estimate costs for services which were measured by the One-Stop. We could also only estimate costs when One-Stop staff could assign cost drivers – usually their time – to specific services.
Before we could calculate the costs for each activity or services, we needed to deal with an additional methodological problem, the problem of “joint costs” (see Text Box C3-2). Joint costs are those costs that are shared by various services. For example, reception is an activity that supports many services such as universal access visits, case management, job placement and others. It is difficult to break that cost down to get an accurate estimate of the cost of reception for each service.

California One-Stop System Cost Study Report
164
Text Box C3-2: The Problem of Joint Costs Some of the “cost-per” calculations are afflicted by a condition known as the “joint cost” or “joint product” or “joint revenue” problem. This condition occurs when two or more products are produced using a single, indivisible input (or are associated with a single bundled revenue stream). This creates ambiguity when we try to compute the cost-per of the separate outputs. A common example is that of raising chickens. An input is the feed. Outputs include chicken wings, chicken legs, and chicken breasts. We may know the chicken ate 9 pounds of food, but we do not know exactly how much of that food went to the chicken’s wings, legs, or breasts. In this example, the cost-pers would likely be approximated by apportioning the cost of the chicken feed according to either the weight of each of the component outputs, or the revenue associated with the component outputs. So, an approximation in this example is only an estimate, but is possible. So the solution in this example is relatively However, other cases of joint costs are more difficult to solve. These more difficult cases occur when the revenue for a component product is hard to determine (or when there is no revenue associated with a particular product), and when the product has no physical weight (or when the weight is not clearly related to revenue). This is the nature of a One-Stop’s operations. Consider the resource room, for example. We can determine the total amount a One-Stop spent on the resource room. We can even calculate how much it cost to make the resource room available, on a per-person basis, for the year. But then some people who use the resource room will end up producing a resume, and others will end up producing a job search plan. Some will do both; others will do neither. There is no good way—as far as we can see at this point—to know how to apportion the cost of the resource room across those separate outputs. These outputs have no apparent revenue associated with them, and they have no physical weight. So, a calculation of the “cost per resume” or “cost per job search plan” would be very difficult.
In making our estimates, we tried to get as close as possible to the unique costs of a product. In cases where we could not break down the joint costs we assigned the whole pool of costs to multiple services. The tables below include notes on which costs were traced to which services. In some cases we were not able to isolate the costs of the services but we did not have measures of how much of the service was delivered. In these cases we reported the amount of the service delivered without a cost estimate.

California One-Stop System Cost Study Report
165
Table C3-4 shows costs of some Universal Access services.
Table C3-4: Cost for Universal Access Services Service Cost per
unitTotal Cost Number
of units Note*
Total visits to the One-stop $69 $4,193,267 60,732 1 Total # of visits to resource room $70 $1,832,542 26,013 2 1-on-1 coaching (excl. case management) $84 $745,528 8,892 3 # of participants trained (resource room count) $1,035 $501,974 485 4 # participated in workshops (unique SSNs) $172 $358,238 2,080 5 Workshop attendees (includes duplicates) $51 $358,238 7,035 5 # attended orientation sessions $224 $531,057 2,369 6
*refer to Table C3-7 for further explanation of calculations.
Note that some of the outputs listed in Table C3-4 are not directly attributable to the Resource Room. For example, “total visits to the One-Stop” clearly involves much more than just the activities of the Resource Room.
The analysis of Universal Access products provides some valuable insights into the costs of this One-Stop. The One-Stop’s cost for serving the “average” Universal Access customer visit was about $69. Approximately one-third of those visits included direct contact with Resource Room staff (other than front-desk reception), and the average fully-loaded cost per interaction of this sort was about $170. The cost per person participating in workshops was about $172. Since the average person participating in a workshop participated in about 3.5 workshops, the per-person-workshop cost appears to be about $51.
Table C3-5 displays costs of some Enrolled Services at Central California Urban One-Stop.

California One-Stop System Cost Study Report
166
Table C3-5: Cost of Enrolled Service Service Cost Per
UnitTotal cost Number
of units Note*
Lower-bound estimates (excludes placement & job development) Enrolled clients $808 $1,035,993 1,282 7 New enrolled clients $1,315 $1,035,993 788 Exited $1,226 $1,035,993 845 Placed $428 $1,035,993 2,420 8 Mid-range estimate (adds placement & job development) Enrolled clients $1,528 $1,958,870 1,282 9 New enrolled clients $2,486 $1,958,870 788 Exited $2,318 $1,958,870 845 Placed $809 $1,958,870 2,420 Upper-bound estimate (further adds outreach, employer services) Enrolled clients $1,699 $2,177,933 1,282 10 New enrolled clients $2,764 $2,177,933 788 Exited $2,577 $2,177,933 845 Placed $900 $2,177,933 2,420 *refer to Table C3-7 for further explanation of calculations For a variety of reasons we found it much more difficult to estimate the cost of specific Enrolled Services products. The key reason for this is the difficulty of calculating a cost for the particular services. In One-Stops generally, Universal Access customers typically can be found physically in a certain area of the One-Stop – the Resource Room. Costs of providing services typically associated with Universal Access customers therefore are somewhat contained in a certain physical area of the One-Stop. But while there typically is a certain area where “case management” is conducted for Enrolled customers, these Enrolled customers also frequently receive or directly benefit from services at various other areas of the One-Stop, such as the “business services” area. So, the costs of serving Enrolled customers tend to be much more dispersed across the physical facilities of the One-Stop and are difficult to trace specifically to whether or not the funds were being deployed to serve Registered customers. We have estimated that on the whole, it cost between $808 and $1,699 to serve an enrolled client. This cost is considerably lower than at other case study sites, most likely due to the fact that a large amount of case management (which we have found to be quite costly at other sites) is excluded from our calculations here, due to our “under the roof” definition of a One-Stop’s activities. We’ll note again that this study has arrived at no conclusion at all about the efficiency or effectiveness of the contracting arrangement. Also, note that the placements number (2,420) includes more than WIA enrolled customers. Table C3-6 shows some analysis of costs incurred in providing Business Services.

California One-Stop System Cost Study Report
167
Table C3-6: Cost of Business Services Service Cost Per
UnitNumber of
Units Total Cost Note*
New visitors $110 $94,947 860 11Repeat visitors $192 $94,947 495 Total visitors $70 $94,947 1,355 Number of companies served through Rapid
Response $9,377 $37,979 4 12
Appointments $131 $94,947 722 Technical assistance to businesses $52 $94,947 1,818 Hiring/training events $133 $94,947 715 Field visits to businesses $348 $94,947 273 *refer to Table C3-7 for further explanation of calculations Cost-per-unit calculations for Business Services are badly afflicted by the “joint cost” problem. For example, an “appointment” may be an appointment either with an Enrolled customer to explore business opportunities, or may be an appointment with personnel form a business who are not Enrolled Customers. Likewise, field visits to businesses may benefit businesses, and/or may benefit Enrolled or even Universal customers. Therefore, with the current data, it is not possible to strongly associate the costs with the particular services. Tables C3-4, C3-5, and C3-6 contain calculations derived from data that appears in Table C3-8. If you want to see how a certain calculation in Table C3-4, C3-5, and C3-6 was made, refer in those tables to the “Note” column. Then take the number in the “Note” area and find it in Table C3-7. Then in the right-hand column of Table C3-7, you see that the total cost included in the calculation is the sum of the costs of one or more activities. These activities correspond to the very top line of Table C3-8. This information is supplied to allow a reader to understand exactly which costs are included in each cost-per calculation, and which are not.
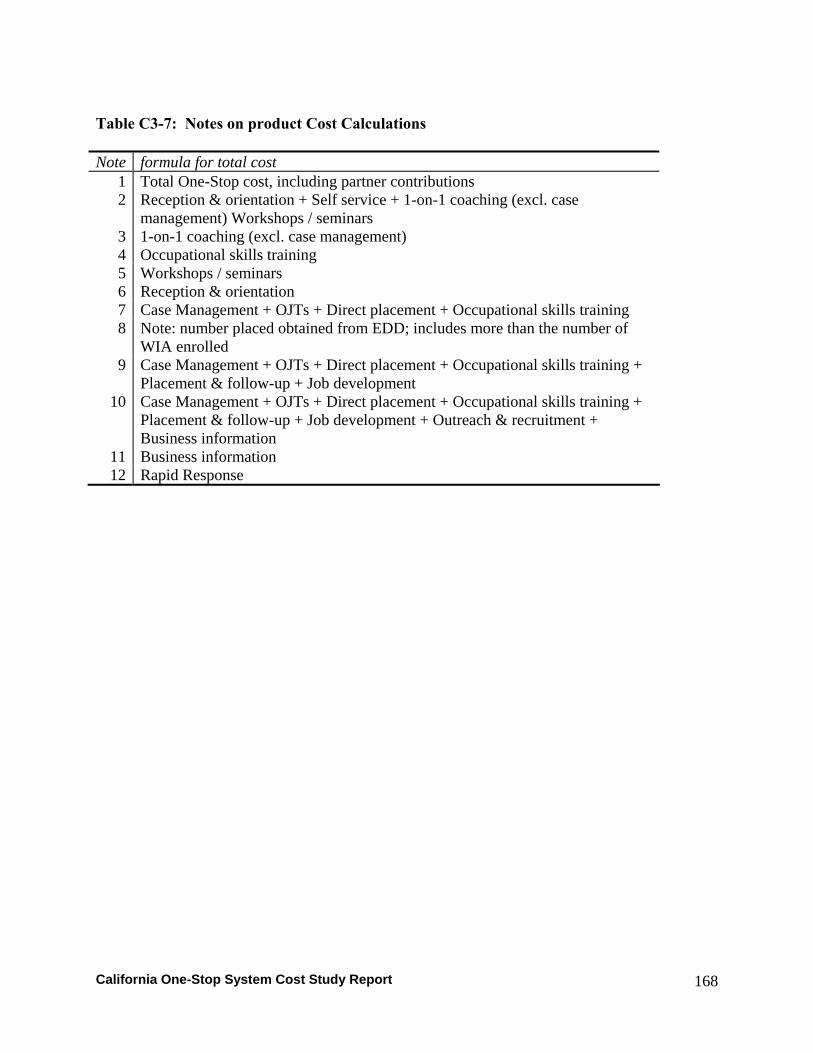
California One-Stop System Cost Study Report
168
Table C3-7: Notes on product Cost Calculations Note formula for total cost
1 Total One-Stop cost, including partner contributions 2 Reception & orientation + Self service + 1-on-1 coaching (excl. case
management) Workshops / seminars 3 1-on-1 coaching (excl. case management) 4 Occupational skills training 5 Workshops / seminars 6 Reception & orientation 7 Case Management + OJTs + Direct placement + Occupational skills training 8 Note: number placed obtained from EDD; includes more than the number of
WIA enrolled 9 Case Management + OJTs + Direct placement + Occupational skills training +
Placement & follow-up + Job development 10 Case Management + OJTs + Direct placement + Occupational skills training +
Placement & follow-up + Job development + Outreach & recruitment + Business information
11 Business information 12 Rapid Response

California One-Stop System Cost Study Report
169
Table C3-8: Central California Urban One-Stop Cost Tracing Worksheet - Dollars
Responsibility Center Tota
l Cos
ts fo
r Eac
h R
espo
nsib
ility
Cen
ter
Rec
eptio
n &
orie
ntat
ion
Ass
essm
ent
IEP/
ISS
Self
serv
ice
1-on
-1 c
ouns
elin
g (e
xcl.
case
m
anag
emen
t)
Cas
e M
anag
emen
t
OJT
s
Dire
ct p
lace
men
t
ITA
/ O
ccup
atio
nal s
kills
tra
inin
g
Wor
ksho
ps /
sem
inar
s
Pace
lem
ent &
follo
w-u
p
Bus
ines
s inf
orm
atio
n
Job
deve
lopm
ent
Rap
id R
espo
nse
Out
reac
h &
recr
uitm
ent
One-StopResource Room $1,684,732 $336,946 $0 $0 $168,473 $421,183 $168,473 $0 $0 $252,710 $84,237 $168,473 $0 $0 $0 $84,237Registered Services $612,525 $0 $61,252 $0 $0 $0 $0 $0 $61,252 $61,252 $61,252 $183,757 $0 $183,757 $0 $0Business Resources $379,788 $0 $0 $0 $0 $0 $0 $0 $0 $0 $113,937 $0 $94,947 $113,937 $37,979 $18,989Admin Directors Office $417,805 $62,671 $62,671 $20,890 $29,246 $0 $12,534 $0 $8,356 $188,012 $4,178 $8,356 $0 $0 $0 $20,890
One-Stop total $3,094,850 $399,617 $123,923 $20,890 $197,720 $421,183 $181,007 $0 $69,609 $501,974 $263,604 $360,587 $94,947 $297,694 $37,979 $124,116One-Stop expense by activity, % 12.9% 4.0% 0.7% 6.4% 13.6% 5.8% 0.0% 2.2% 16.2% 8.5% 11.7% 3.1% 9.6% 1.2% 4.0%
Partner ContributionsEDD $617,692 $88,242 $88,242 $88,242 $110,302 $88,242 $154,423Community Services and Training Agency $149,037 $74,519 $74,519Employment Services Agency $77,322 $72,489 $4,833Job Training for ex-offenders $1,560 $1,560HHSA $91,500 $91,500Dept. of Rehab $30,413 $912 $18,248 $10,340 $912Deaf and Hard of Hearing $46,323 $11,581 $34,742AARP $48,326 $24,163 $24,163Farm workers Assistance $36,245 $18,122 $18,122
Partner contribution total $1,098,417 $131,439 $0 $0 $324,345 $98,582 $0 $184,821 $0 $94,634 $34,742 $0 $229,854 $0 $0
TOTAL COST for activity $4,193,267 $531,057 $123,923 $20,890 $197,720 $745,528 $279,589 $0 $254,429 $501,974 $358,238 $395,329 $94,947 $527,548 $37,979 $124,116A B C D E F G H I J K L M N O P

California One-Stop System Cost Study Report
170
Appendix C-4: Case Study 4 – Northern California Rural One-Stop Report

California One-Stop System Cost Study Report
171
NoCal Rural One-Stop Case Report Background The NoCal Rural One-Stop serves a sparsely populated Northern California County. The entire workforce in 2005 was made up of about 43,000 workers, and the county had a higher than average unemployment rate of about 7%. The local economy is largely made up of small businesses. No single industry sector dominates. Government is the biggest employer accounting for 24% of employment in 2004. Trade, transportation and utilities make up an additional 18% and manufacturing 10%. There is a good deal of tourism in the area, so leisure and hospitality industries account for 12% of employment. The County WIA program is governed by a local WIB appointed by the board of supervisors. The WIB has 34 members, many from the public sector, and a number of representatives from small and mid-sized businesses. The county operates six One-Stops; most are small and have a handful of staff. There is a substantial full-service One-Stop in the county seat which is the site of this study. All the One-Stops are operated by a non-profit corporation, which we will call WIA Non-Profit or WIA NP for short, whose only purpose is operating One-Stops in the County. The county WIB has the following mission statement:
To improve the quality of the local workforce, to increase employment opportunities and earnings, and to enhance the productivity and competitiveness of business for the benefit of all residents...
The One-Stop we visited has a strong partnership with the county Department of Social Services; in fact, the WIB is housed in that department. A staff of three within the Department oversees the WIA program, supports the WIB and is housed in the One-Stop we studied. In 2004-05 costs for the One-Stop we studied were about $3.2 million including the costs of all partners. NoCal Rural One-Stop Description The One-Stop is located in a modern one story office building, a little away from the center of the county seat. The One-Stop is co-located with the county’s Department of Social Services’ (DSS) CalWorks program which is integrated into the One-Stop. EDD also has an operation within the One-Stop. Thus the One-Stop is a hub for local workforce activity. Staff are committed to providing a high level of professional service. The list below shows the agencies which are official partners of the One-Stop. The agencies in the first section are agencies which provide significant measurable contributions “under the roof” of the One-Stop in the 2004-05 program year and are featured in our analysis. The rest are agencies which partner with the One-Stop in various ways but do not provide services in the One-Stop which we were able to measure.

California One-Stop System Cost Study Report
172
Table C4-1: List of Partners21 2004-05
Partners with a Measurable Cost Contribution in the One-Stop • WIA NP (Funded with WIA funds) • EDD • DSS WIA Administration (county administrative unit for WIA) • DSS Job Alliance • DSS Drug and Alcohol Program • DSS Mental Health • Good Will • Calif. Human Development Corporation Agriculture • Local Rehab Assoc • California Dept. of Rehab
Partners Without a Measurable Cost Contribution in the One Stop • Local Community College • Local Community Foundation • Community Resources for Independence • Consumer Credit Counseling • Local Economic Development Corporation • Older Worker Non-profit • County Department of Mental Health • County Department of Public Health • County Office of Education • Country Transit Authority • Our House Non-Profit • Project Sanctuary • Local Adult School • Local Community Services
Defining the One-Stop Boundaries For the purposes of our analysis we had to define what was inside and what was outside the One-Stop. To make these decisions consistent we developed an “operational definition” of what was and what was not considered a One-Stop activity for the purpose of our analysis:
Activities and agencies are included in the analysis if they provide workforce services to One-Stop clients and if the services are provided under the roof of the One-Stop.
Based on this definition the activities of many partners are not included in this analysis because they take place away from the campus. While these partnerships are real we were not able to put a cost on the services provided. To do so would mean tracing costs of services received by One-
21 Names of some partners have been changed to protect the anonymity of the One-Stop.

California One-Stop System Cost Study Report
173
Stop clients though a large system of support agencies requiring us to analyze innumerable budgets. For example, if a client is referred to the local adult education program to get ESL classes and these classes help her get a job, the partnership is real but the costs of that service is not included in our analysis. Or in another case, the One-Stop may refer a client to a housing agency to get advice about how to find housing, again the cost of making the referral would be included in our analysis but the cost of providing the advice about housing would not be, because tracing these cost through the large complex social service system is beyond the scope of this study.
One-Stop Structure The local WIB has a staff of three county employees who oversee WIA in the county and thus the work of the One-Stop we studied. The One-Stop is actually operated by the WIA-NP which employs an Executive Director who manages the One-Stop, and had 21 employees working in the One-Stop in 2004-05. Most of these employees were full time in the One-Stop, a few had some time allocated to other One-Stops. The graphic below shows how the One-Stop is situated within the local area. Figure C4-1: NoCal Rural County Workforce Development System
Workforce Investment Board• Oversight
• Executive
Board of Supervisors
Youth Council
Partnership Council
WIA-NP One-Stop Operator
Subject One-Stop(Comprehensive)
Other One-Stopsand Satellites
Northern California Rural County Workforce Development System
As noted before, the One-Stop is managed by the executive Director from WIA-NP. But the One-Stop also houses large units from the county Department of Social Services and EDD. In
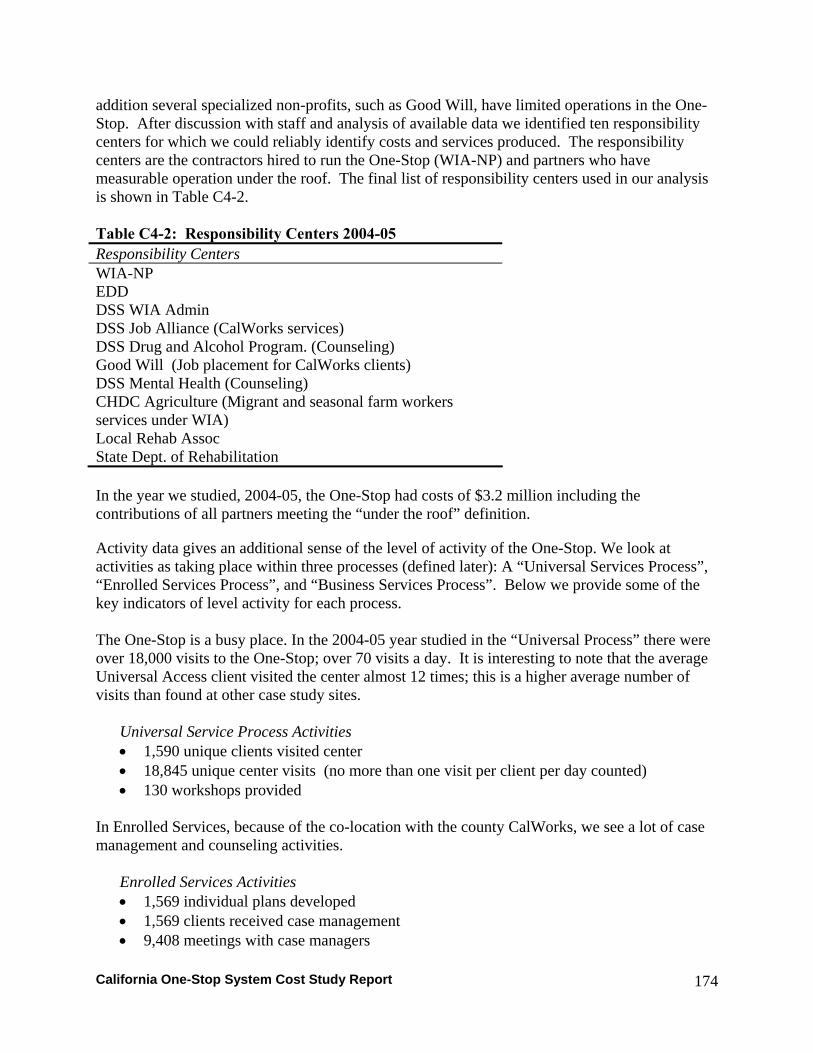
California One-Stop System Cost Study Report
174
addition several specialized non-profits, such as Good Will, have limited operations in the One-Stop. After discussion with staff and analysis of available data we identified ten responsibility centers for which we could reliably identify costs and services produced. The responsibility centers are the contractors hired to run the One-Stop (WIA-NP) and partners who have measurable operation under the roof. The final list of responsibility centers used in our analysis is shown in Table C4-2. Table C4-2: Responsibility Centers 2004-05 Responsibility Centers WIA-NP EDD DSS WIA Admin DSS Job Alliance (CalWorks services) DSS Drug and Alcohol Program. (Counseling) Good Will (Job placement for CalWorks clients) DSS Mental Health (Counseling) CHDC Agriculture (Migrant and seasonal farm workers services under WIA) Local Rehab Assoc State Dept. of Rehabilitation In the year we studied, 2004-05, the One-Stop had costs of $3.2 million including the contributions of all partners meeting the “under the roof” definition.
Activity data gives an additional sense of the level of activity of the One-Stop. We look at activities as taking place within three processes (defined later): A “Universal Services Process”, “Enrolled Services Process”, and “Business Services Process”. Below we provide some of the key indicators of level activity for each process. The One-Stop is a busy place. In the 2004-05 year studied in the “Universal Process” there were over 18,000 visits to the One-Stop; over 70 visits a day. It is interesting to note that the average Universal Access client visited the center almost 12 times; this is a higher average number of visits than found at other case study sites.
Universal Service Process Activities • 1,590 unique clients visited center • 18,845 unique center visits (no more than one visit per client per day counted) • 130 workshops provided
In Enrolled Services, because of the co-location with the county CalWorks, we see a lot of case management and counseling activities.
Enrolled Services Activities • 1,569 individual plans developed • 1,569 clients received case management • 9,408 meetings with case managers

California One-Stop System Cost Study Report
175
• 3,194 individual counseling sessions The Business Services reached 510 mostly small businesses.
Business Services Activities • 510 businesses received consulting services • 192 businesses visited the business service center • 22 companies and 369 workers were served by rapid response services
One-Stop Processes and Activities Analysis We began our analysis by mapping the processes we observed in the One-Stop. We asked the One-Stop staff to validate this process map and help us define specific activities. Figure C4-2 shows the final process map, with the key measures of what the processes produced. This process map was the framework we used for estimating the costs of each activity and ultimately the costs of producing different products. As we said previously, we found three major processes in the One-Stop:
1. Universal Access Service Process: This process served anyone who came to the One-Stop seeking help. It provided a wide range of resources in a resource room, including career and labor market information, access to computers for job searching and resume preparation, access to phones and fax machines, limited one-on-one coaching and advice, career oriented workshops and a job club. In this center, unlike other case study sites, many clients lacked basic computer skills and staff spent a good deal of time helping clients learn to use on-line resources.
Within the Universal Access Service Process are a number of activities, as indicated on the process map. After passing through reception, clients may participate in any or all of these activities in any order. While most activity is self-service where clients access information or work on resumes and cover letters, staff are available for one-on-one assistance. The assistance ranged from help accessing the internet, to feedback on resumes and letters, to quick referrals for other types of help. Unfortunately, staff were unable to estimate the time they spent in this activity so we were unable to assign a cost to one-on-one assistance at this site. The center offers a wide range of workshops, ranging from “Career Exploration” to “Retail Sales Skills”. In addition, the center offers video and computer based, self-paced training, which may be available free or for a small fee. This type of individual self-pace training includes: Windows 95, Excel, Word, Microsoft Office, Typing Tutorials and other topics. Data on how many clients used the various self-paced training modules were not available and staff could not break out their costs so we were unable to analyze them separately from other universal activities. Finally, the center has a job club which holds regular meetings. In the meetings job seekers help each other search for a job and learn from experts who make presentations to the club.
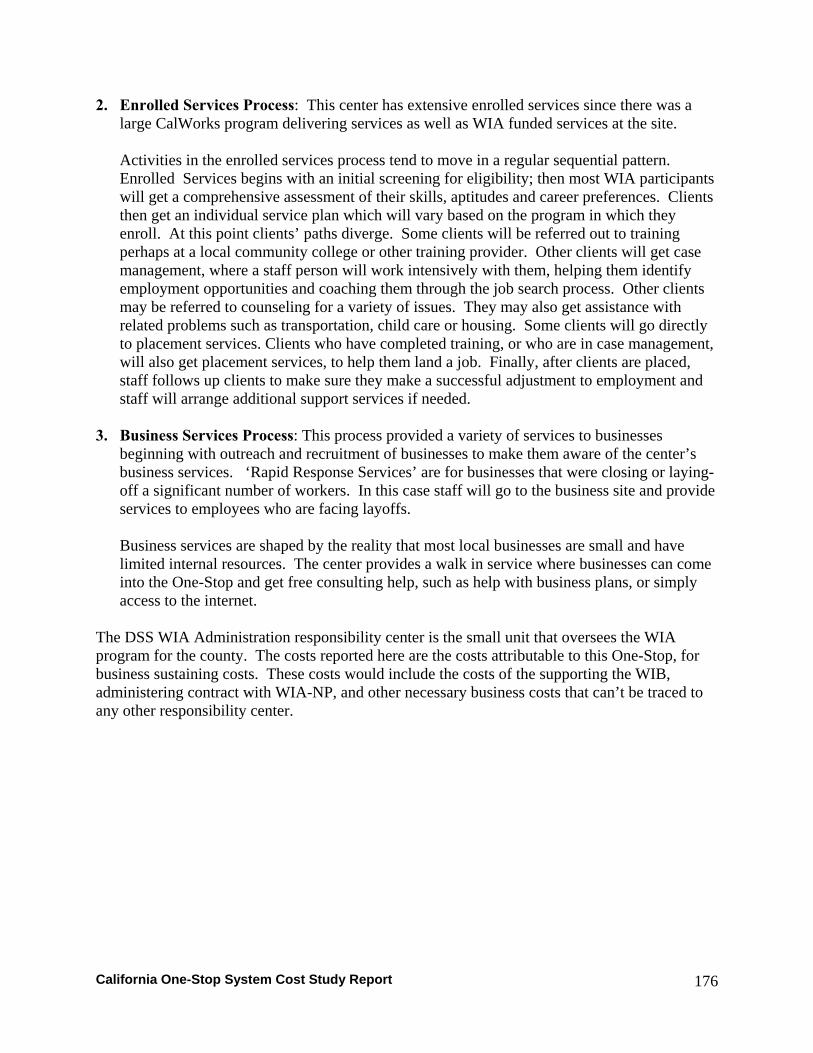
California One-Stop System Cost Study Report
176
2. Enrolled Services Process: This center has extensive enrolled services since there was a large CalWorks program delivering services as well as WIA funded services at the site.
Activities in the enrolled services process tend to move in a regular sequential pattern. Enrolled Services begins with an initial screening for eligibility; then most WIA participants will get a comprehensive assessment of their skills, aptitudes and career preferences. Clients then get an individual service plan which will vary based on the program in which they enroll. At this point clients’ paths diverge. Some clients will be referred out to training perhaps at a local community college or other training provider. Other clients will get case management, where a staff person will work intensively with them, helping them identify employment opportunities and coaching them through the job search process. Other clients may be referred to counseling for a variety of issues. They may also get assistance with related problems such as transportation, child care or housing. Some clients will go directly to placement services. Clients who have completed training, or who are in case management, will also get placement services, to help them land a job. Finally, after clients are placed, staff follows up clients to make sure they make a successful adjustment to employment and staff will arrange additional support services if needed.
3. Business Services Process: This process provided a variety of services to businesses beginning with outreach and recruitment of businesses to make them aware of the center’s business services. ‘Rapid Response Services’ are for businesses that were closing or laying-off a significant number of workers. In this case staff will go to the business site and provide services to employees who are facing layoffs.
Business services are shaped by the reality that most local businesses are small and have limited internal resources. The center provides a walk in service where businesses can come into the One-Stop and get free consulting help, such as help with business plans, or simply access to the internet.
The DSS WIA Administration responsibility center is the small unit that oversees the WIA program for the county. The costs reported here are the costs attributable to this One-Stop, for business sustaining costs. These costs would include the costs of the supporting the WIB, administering contract with WIA-NP, and other necessary business costs that can’t be traced to any other responsibility center.
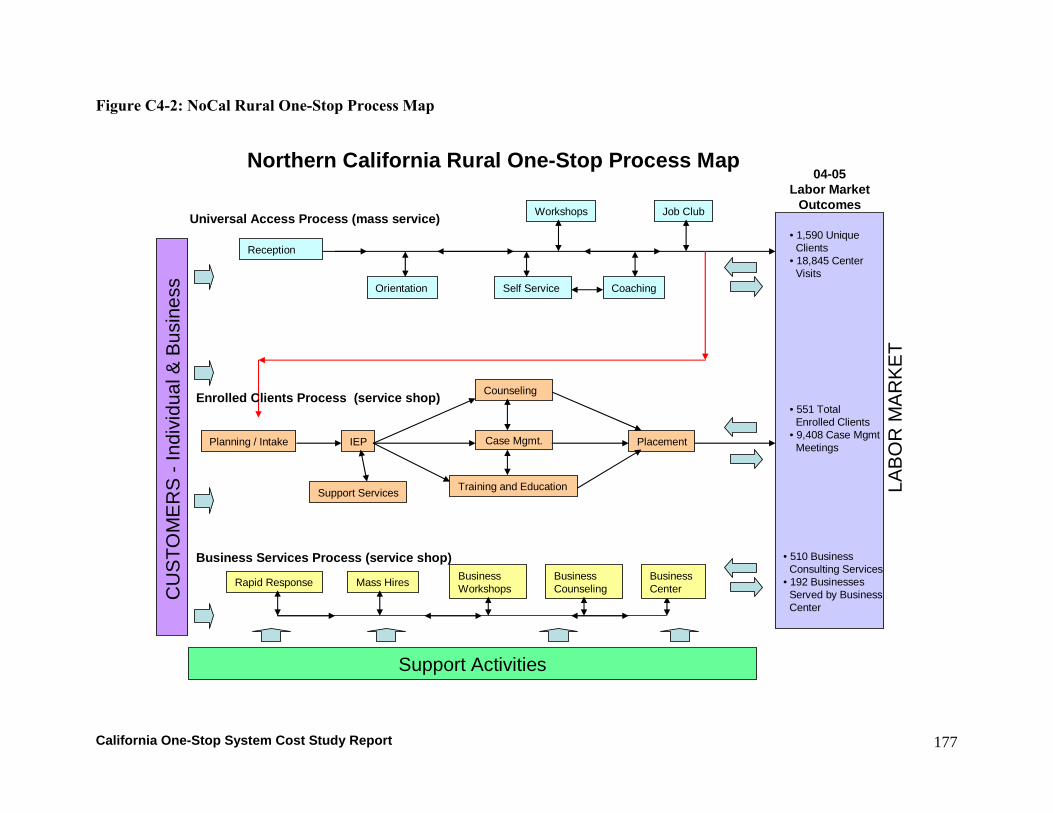
California One-Stop System Cost Study Report
177
Figure C4-2: NoCal Rural One-Stop Process Map
Reception
Self Service
Workshops Job Club
Coaching
Planning / Intake IEP Case Mgmt.
Training and EducationSupport Services
Placement
Universal Access Process (mass service)
Enrolled Clients Process (service shop)
Rapid Response Business Workshops
Business Counseling
Support Activities
Business Services Process (service shop)
Northern California Rural One-Stop Process Map04-05
Labor Market Outcomes
LABO
R M
AR
KET
• 1,590 Unique Clients
• 18,845 Center Visits
• 551 Total Enrolled Clients
• 9,408 Case MgmtMeetings
• 510 Business Consulting Services
• 192 BusinessesServed by BusinessCenter
CU
STO
ME
RS
-Ind
ivid
ual &
Bus
ines
s Orientation
Counseling
Mass Hires Business Center
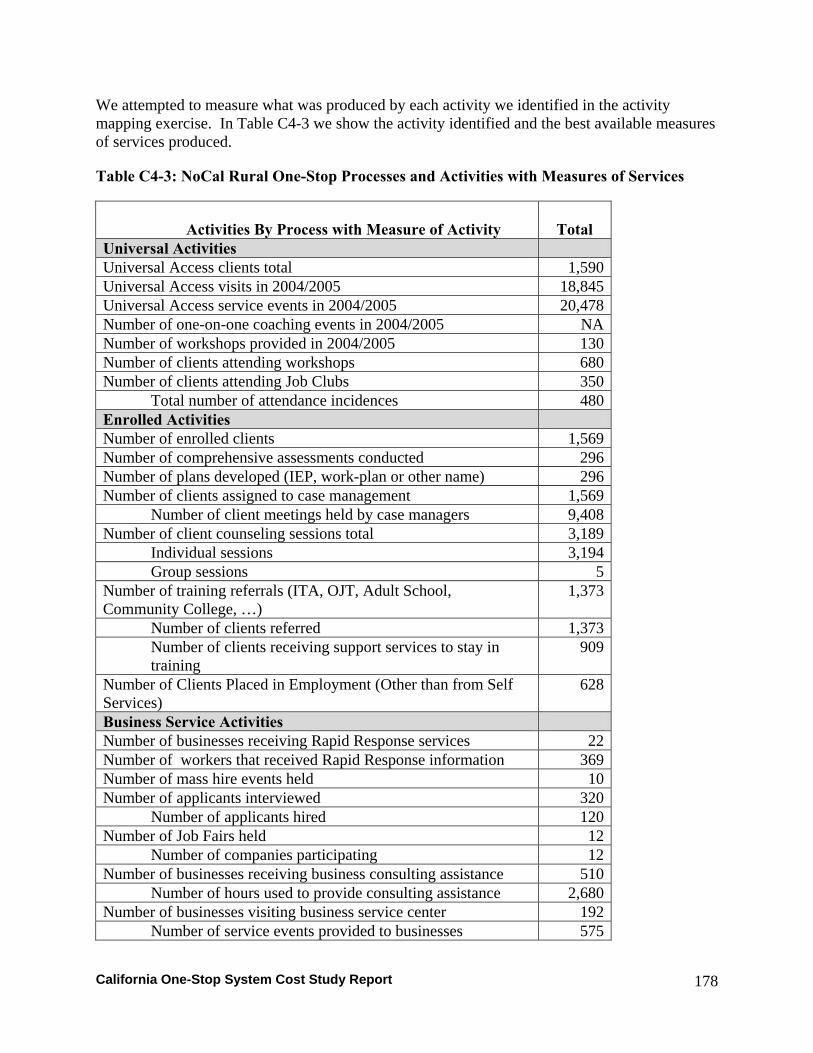
California One-Stop System Cost Study Report
178
We attempted to measure what was produced by each activity we identified in the activity mapping exercise. In Table C4-3 we show the activity identified and the best available measures of services produced.
Table C4-3: NoCal Rural One-Stop Processes and Activities with Measures of Services
Activities By Process with Measure of Activity Total
Universal Activities Universal Access clients total 1,590 Universal Access visits in 2004/2005 18,845 Universal Access service events in 2004/2005 20,478 Number of one-on-one coaching events in 2004/2005 NA Number of workshops provided in 2004/2005 130 Number of clients attending workshops 680 Number of clients attending Job Clubs 350
Total number of attendance incidences 480 Enrolled Activities Number of enrolled clients 1,569 Number of comprehensive assessments conducted 296 Number of plans developed (IEP, work-plan or other name) 296 Number of clients assigned to case management 1,569
Number of client meetings held by case managers 9,408 Number of client counseling sessions total 3,189 Individual sessions 3,194 Group sessions 5 Number of training referrals (ITA, OJT, Adult School, Community College, …)
1,373
Number of clients referred 1,373 Number of clients receiving support services to stay in training
909
Number of Clients Placed in Employment (Other than from Self Services)
628
Business Service Activities Number of businesses receiving Rapid Response services 22 Number of workers that received Rapid Response information 369 Number of mass hire events held 10 Number of applicants interviewed 320 Number of applicants hired 120 Number of Job Fairs held 12 Number of companies participating 12 Number of businesses receiving business consulting assistance 510
Number of hours used to provide consulting assistance 2,680 Number of businesses visiting business service center 192
Number of service events provided to businesses 575
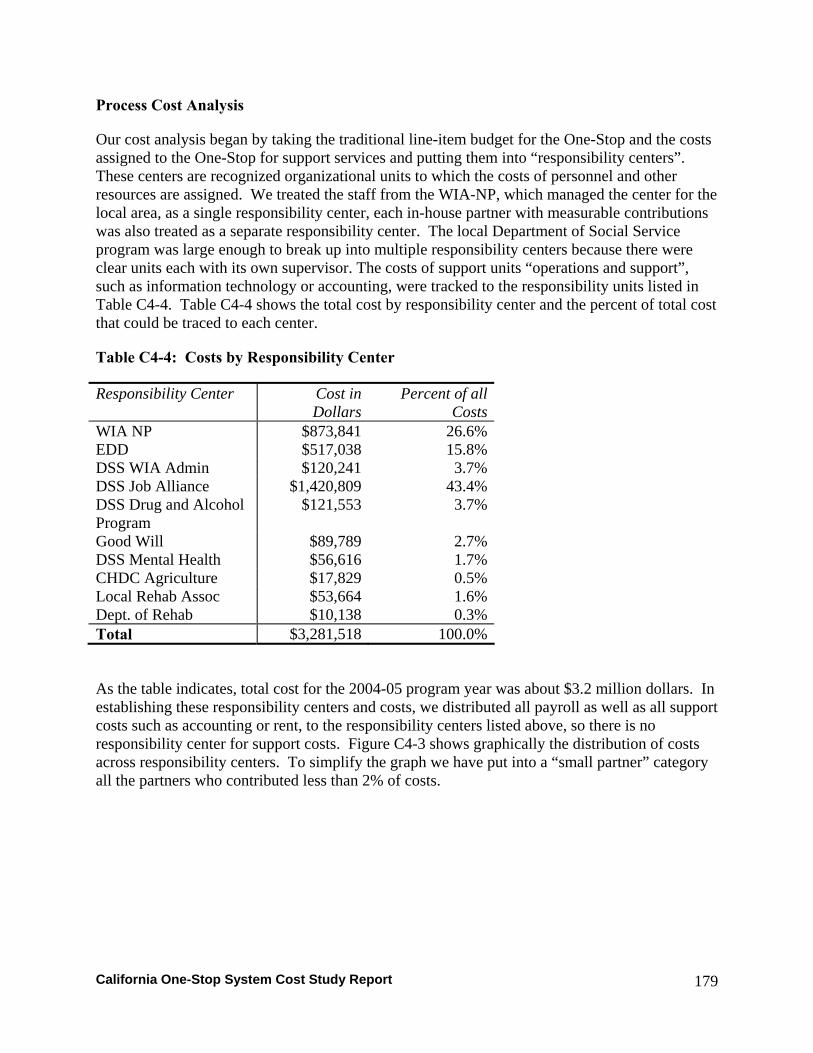
California One-Stop System Cost Study Report
179
Process Cost Analysis
Our cost analysis began by taking the traditional line-item budget for the One-Stop and the costs assigned to the One-Stop for support services and putting them into “responsibility centers”. These centers are recognized organizational units to which the costs of personnel and other resources are assigned. We treated the staff from the WIA-NP, which managed the center for the local area, as a single responsibility center, each in-house partner with measurable contributions was also treated as a separate responsibility center. The local Department of Social Service program was large enough to break up into multiple responsibility centers because there were clear units each with its own supervisor. The costs of support units “operations and support”, such as information technology or accounting, were tracked to the responsibility units listed in Table C4-4. Table C4-4 shows the total cost by responsibility center and the percent of total cost that could be traced to each center.
Table C4-4: Costs by Responsibility Center
Responsibility Center Cost in Dollars
Percent of all Costs
WIA NP $873,841 26.6%EDD $517,038 15.8%DSS WIA Admin $120,241 3.7%DSS Job Alliance $1,420,809 43.4%DSS Drug and Alcohol Program
$121,553 3.7%
Good Will $89,789 2.7%DSS Mental Health $56,616 1.7%CHDC Agriculture $17,829 0.5%Local Rehab Assoc $53,664 1.6%Dept. of Rehab $10,138 0.3%Total $3,281,518 100.0%
As the table indicates, total cost for the 2004-05 program year was about $3.2 million dollars. In establishing these responsibility centers and costs, we distributed all payroll as well as all support costs such as accounting or rent, to the responsibility centers listed above, so there is no responsibility center for support costs. Figure C4-3 shows graphically the distribution of costs across responsibility centers. To simplify the graph we have put into a “small partner” category all the partners who contributed less than 2% of costs.

California One-Stop System Cost Study Report
180
Figure C4-3: Cost by Responsibility Center
WIA NP, 26.6%
EDD, 15.8%
DSS WIA Admin, 3.7%
DSS Job Alliance, 43.3%
Good Will, 2.7%
DSS Drug and Alcohol Prog.,
3.7%
Small Partners, 4.2%
Of the four case study sites, this site had partners who made the largest contribution to costs. The graph above shows that WIA-NP the contractor who operated the center accounted for only 26.6% of the costs, while the responsibility centers in the Department of Social Service Units accounted for about half of all costs. EDD accounted for an additional 15.8% of costs. All other partners accounted for only 6.9% of costs.
Cost By Process and Activity
Our next step was to trace the costs of each responsibility center back to the processes and activities that generated the costs. To understand the cost of each process, and the activities within each process we identified a number of cost drivers that allowed us to trace costs back to activities. The most important cost driver was staff time, since that was the largest budget item. To identify how staff time was spent we asked managers and many staff members to estimate the time they spent on different activities. We also estimated the amount of physical space used for various activities and traced the cost of that space back to the various activities. We used the judgment of senior managers to distribute support cost across the activities.
We used the same process with the Department of Social Services, EDD, Good Will and the other partners, we asked senior managers to attribute staff time to the processes and activities we had mapped, and then had them estimate how support costs were used.
Our mapping of the processes and activities permits us to look at how resources are used at different levels of aggregations and how they relate to different outputs. For example, we can estimate the entire cost of the universal service process and calculate the average cost of serving

California One-Stop System Cost Study Report
181
a universal client. At a more disaggregated level we can look at the specific costs of job club activity and estimate the cost of serving a single job club member.
Figure C4-4 shows a highly aggregated analysis of the costs by each major process: universal service process, enrolled services process, business services process, and business sustaining costs. Remember that we have now combined the costs of all responsibility centers and partners by process.
Figure C4-4: Percent of Cost by Process
Universal Services ,
25.9%
Enrolled Services,
68.0%
Sustaining Costs, 3.7%
Business Services, 2.4%
As the figure indicates the enrolled services process accounted for over two thirds of the costs, while universal services process accounted for a bit more than a quarter and business services accounted for less than 3%. Business sustaining costs were just under 4%.
Table C4-5 shows a more disaggregated analysis of costs. Here you can see the cost of each activity. It also shows how much of those costs were supported directly by the local area, EDD and other partners. It’s important to note that here we put partner costs into the processes and activities they support, unlike in the responsibility centers where we broke out partner costs independent of activity. Table C4-5 shows detailed break down of costs by processes, specific activities and the contribution of various partners. A reminder, costs presented include labor, space, supplies and expenses and support costs such as accounting. The table is broken out to show the costs of the local area, EDD and smaller partners. Overall the One-Stop had costs of slightly more than 3.2 million in 2004-05.

California One-Stop System Cost Study Report
182
Table C4-5: Cost Detail by Process and Activity
Department of Social Services WIA NP EDD All Job Service
Programs
WIA Admin
Job Alliance
Drug & Alcohol
Mental Health
CHDC Agricultural
Workers
Local Assoc.
of Habili- tation
Depart-ment of Rehab.
Goodwillestimated
cost
Total
Business Sustaining
120,241
120,241
Universal Process
851,058
Self Services 141,552
24,752
42,624
1,216
1,115
211,259
Coaching 53,963
169,962
71,040
1,216
5,069
9,225
310,475
Orientation 35,283
29,079
42,624
9,223
116,209
Workshops 31,329
22,148
142,081
6,078
203
2,460
204,299
Job Clubs 6,385
2,431
8,816
Enrolled Services
2,231,564
Assessments 46,175
170,497
30,388
764
1,074
4,305
253,203
IEP 66,017
12,138
255,746
17,017
2,368
16,099
369,385
Case Management 94,702
78,472
412,035
36,466
3,897
10,196
3,548
639,316
Counseling 49,079
26,741
56,616
10,196
142,632
Training & Education 117,595
10,763
128,358
Support Services
148,562
8,801
284,162
10,800
24,600
476,925
Placement 16,132
160,098
16,099
203
29,213
221,745
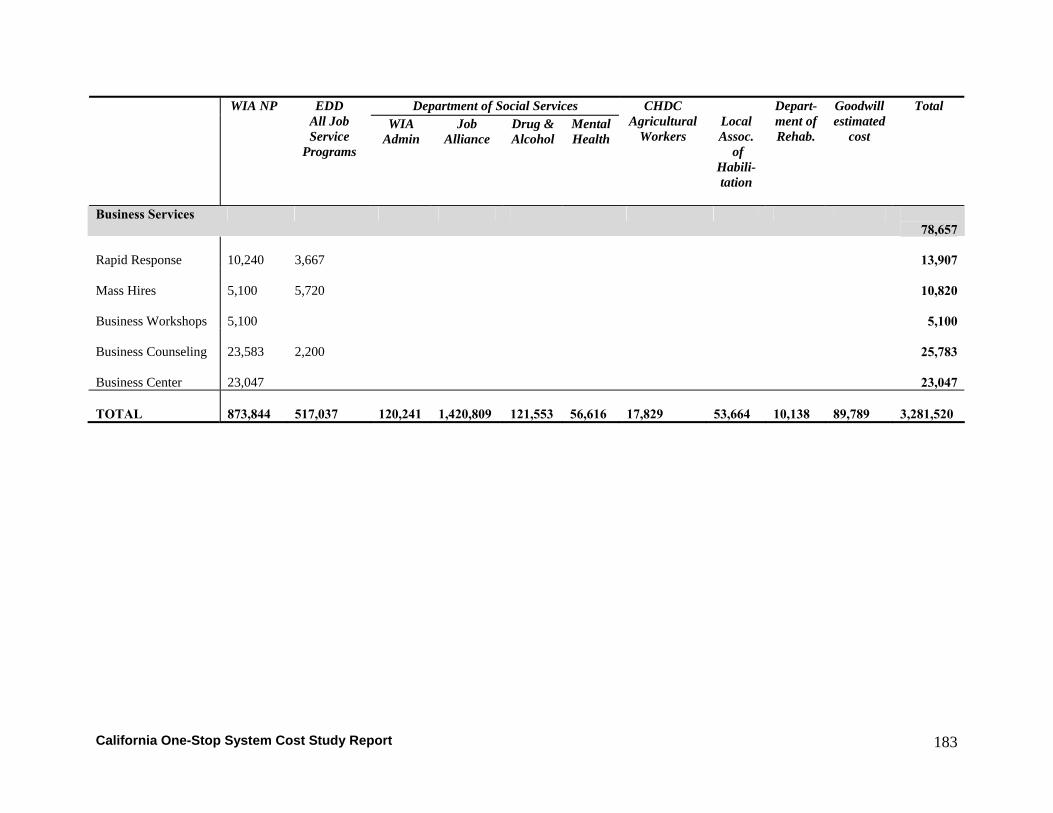
California One-Stop System Cost Study Report
183
Department of Social Services WIA NP EDD All Job Service
Programs
WIA Admin
Job Alliance
Drug & Alcohol
Mental Health
CHDC Agricultural
Workers
Local Assoc.
of Habili- tation
Depart-ment of Rehab.
Goodwillestimated
cost
Total
Business Services 78,657
Rapid Response
10,240
3,667
13,907
Mass Hires
5,100
5,720
10,820
Business Workshops
5,100
5,100
Business Counseling
23,583
2,200
25,783
Business Center
23,047
23,047
TOTAL
873,844
517,037
120,241
1,420,809
121,553
56,616
17,829
53,664
10,138
89,789
3,281,520
California One-Stop System Cost Study Report
184
Looking within the processes we gain some additional insights about where the $3.2 million in costs were generated. Enrolled services accounted for most of the costs, about $2.2 million. Within the Enrolled Services Process the largest costs were generated by case management: $639,316. This reflects the large number of CalWorks clients in this center who get intensive case management services, as the large number of case management meetings reported earlier indicate. Similarly, support services, which are a relatively small cost at other case study sites, are large here: $476,925. Again this reflects the large number of CalWorks clients making the transition from public support to employment, who often require support services. The process of enrolling clients into the various programs at the One-Stop was another substantial cost, the cost of assessment and developing individual plans together accounted for over $600,000 of costs. The various training services offered through the One-Stop and referral to training outside the One-Stop cost only $128,358. This is because most training is delivered away from the One-Stop and thus does not meet our under the roof definition. These costs are mostly for referring and monitoring clients who are trained else where.
The next highest cost process was Universal Services at about $850,000. The largest cost item here, accounting for more than one-third of the costs ($310,475), was one-on-one coaching, where staff provide individual assistance to clients. Supporting self-service activities, which includes maintaining a computer network, staffing the resource room, and receiving visitors was the next most costly activity at slightly over $200,000. Workshops were a significant cost item at over $204,299, orientation of new clients to the One-Stop cost less about $116,000, and the Job Club was the least costly activity at $8,816.
The Business Service Process cost substantially less than the other two at a total of only $78,657. Here the highest cost items were business counseling, where staff provide one-on-one assistance to businesses and the Business Center, which was walk in assistance for local businesses to get assistance. Together these two activities accounted for almost $49,000 of the cost. Rapid Response, which is services for businesses facing a closure or layoff, was only about $14,000.
Finally, the cost to the county of managing and overseeing this One-Stop was $120,241. This includes a share of the cost of supporting the WIB and other local area costs.
Cost By Service Line
The final step in our analysis is to estimate the costs of particular One-Stop services produced by processes and activities described before. One-Stops are a service business and it is often hard to distinguish between activities and services. For example, when a client has a one-on-one session with a counselor to review her resume, is the product a counseling session or is this event merely an activity leading to a product such as placement in a job? We did not worry too much about this distinction. In our case studies we were constrained by what the One-Stop measured, we could only estimate costs for services which were measured by the One-Stop. We could also only calculate costs for specific services when One-Stop staff could assign cost drivers – usually their time – to specific activities that directly linked to measured service lines. We were also interested in services that were likely to be found in other One-Stops, such as a universal access visit, or a workshop. We began our cost-per-service estimates with the services that we viewed as produced by a whole process, not just an individual activity. We also focused on services we
California One-Stop System Cost Study Report
185
thought would be common to other One-Stops and thus could provide some valuable insights about managing One-Stops.
Before we could calculate the costs for each service, we needed to deal with an additional methodological problem, the problem of “joint costs” (see Text Box C4-1). Joint costs are those costs that are shared by various products. For example, reception is an activity that supports many products such as universal access visits, case management, job placement and others. It is impossible to actually break that cost down to get an accurate estimate of the cost of reception for each product.
Text Box C4-1: The Problem of Joint Costs Some of the “cost-per” calculations are afflicted by a condition known as the “joint cost” or “joint product” or “joint revenue” problem. This condition occurs when two or more products are produced using a single, indivisible input (or are associated with a single bundled revenue stream). This creates ambiguity when we try to compute the cost-per of the separate outputs. A common example is that of raising chickens. An input is the feed. Outputs include chicken wings, chicken legs, and chicken breasts. We may know the chicken ate 9 pounds of food, but we do not know exactly how much of that food went to the chicken’s wings, legs, or breasts. In this example, the cost-pers would likely be approximated by apportioning the cost of the chicken feed according to either the weight of each of the component outputs, or the revenue associated with the component outputs. So, an approximation in this example is only an estimate, but is possible. However, other cases of joint costs are more difficult to solve. These more difficult cases occur when the revenue for a component product is hard to determine (or when there is no revenue associated with a particular product), and when the product has no physical weight (or when the weight is not clearly related to revenue). This is the nature of a One-Stop’s operations. Consider the resource room, for example. We can determine the total amount a One-Stop spent on the resource room. We can even calculate how much it cost to make the resource room available, on a per-person basis, for the year. But then some people who use the resource room will end up producing a resume, and others will end up producing a job search plan. There is no good way—as far as we can see at this point—to know how to apportion the valid cost of the resource room across those separate outputs. These outputs have no apparent revenue associated with them, and they have no physical weight. So, a calculation of the “cost per resume” or “cost per job search plan” would be very difficult.
In making our estimates we tried to get as close as possible to the unique costs of a service. In cases where we could not break down the joint costs, we only assigned the costs directly attributable to the product. Table C4-9 below includes notes on how we made our calculations. In come cases we were able to identify costs that went with a particular activity but did not have

California One-Stop System Cost Study Report
186
measures of the services produced by that activity, so no cost per service calculations were possible. The tables below show the best cost per service calculations we could make by the three processes identified earlier.
Universal services are produced in a high volume at relatively low cost. You can see in Table C4-6 if we take all universal costs and simply divide by all universal clients we get a cost per client of $535, if we look further and track the number of visits made for universal services we get a get a cost of $45 per visit. It is interesting to note that at this One-Stop clients made many more visits on average than at other case study sites. Providing one-on-one assistance in the resource room was a significant cost item but since these events were not counted we were unable to calculate a cost per unit.
Other significant universal activities at this One-Stop were Workshops which cost about $1,500 each and $300 per client served. It cost $25 to serve a client in a job club.
Table C4-6: Cost for Universal Access Services Service Lines Units of
ServiceCost Cost per
UnitNote*
Universal Access clients total 1,590 $851,058 $535 1 Universal Access visits in 2004/2005 18,845 $851,058 $45 2 Universal Access service events in 2004/2005 20,478 $851,058 $42 3 Number of One-on-one coaching events in 2004/2005 NA Number of workshops provided in 2004/2005 130 $204,299 $1,572 4 Number of clients attending workshops 680 $204,299 $300 5 Number of clients attending Job Clubs 350 $8,816 $25 6 Total number of attendance Incidences’ at Job Club 480 $8,816 $18 7 *refer to Table C4-9 for further explanation of calculations It was, not surprisingly, much more costly to serve clients formally enrolled in a WIA or a Department of Social Service program. On average an enrolled client cost $1,422 to serve. Looking at the beginning of the process it cost about $1,090 to assess a client and develop an individual plan. Providing case management cost $407 per client served but only $68 per client meeting. This One-Stop provided extensive counseling services. The cost of a counseling session across all the programs and all the types of counseling averaged $45 a session. Placing clients in training and supporting them during training cost $525 for a client receiving training; remember this does not include the direct cost of training usually paid for through and ITA (voucher).

California One-Stop System Cost Study Report
187
Participants received different packages of services, and these cost-per measures help us understand the costs of the various packages. Let’s compare two clients who got two different packages of services. Client A, got a comprehensive assessment, case management to help them resolve some personal issues and placement assistance; total cost $3,327. Client B also got a comprehensive assessment, case management, and in addition got 10 personal counseling sessions and training at a local community college; total cost to the One-Stop $4, 349. Figure C4-5: Costs for Two Model Clients Client A Client B
• Comprehensive assessment and individual plan $1,090
• Case Management $407 • Placement $554
Total Cost: $2,057
• Comprehensive assessment and individual plan $1,090
• Case Management $407 • Counseling (3 sessions) $135 • Referral to training $618 • Placement $554
Total Cost: $2,804
Table C4-7 provides the best cost per service calculations we could make with the available data. Table C4-7: Cost per Enrolled Service Unit Service Lines Units of
ServiceCost Cost per
Unit Note*
Total enrolled clients 1569 $2,231,562 $1,422 7a Number of comprehensive assessments conducted
296 $253,203 $855 8
Number of plans developed (IEP, work-plan or other name)
1569 $369,384 $235 9
Number of clients assigned to Case Management
1,569 $639,316 $407 10
Number of client meetings held by case managers
9,408 $639,316 $68 11
Number of client counseling sessions total
3,189 $142,632 $45 12
Individual sessions 3,194 $142,632 $45 13 Number of training referrals (ITA, OJT, adult school, community college, …)
1,373 $128,358 $93 14
Number of clients receiving support services to stay in training
909 $476,924 $525 15
Number of clients placed in employment (other than from self services)
400 $221,745 $554 16
*refer to Table C4-9 for further explanation of calculations

California One-Stop System Cost Study Report
188
Business services account for about 2.4% of the One-Stop’s costs. The data available on services provided allowed us to make a number of cost calculations, which are shown in Table C4-8. One service provided by the One-Stop was hosting mass hire events, where an employer who needed to hire a number of people, such as at the opening of a large retail store, could come to the Center and interview a number of applicants on a single day. The cost of one of these events was $1,082, the cost for each interview generated was $34, and cost per person actually hired was $90. The One-Stop provided quite a bit of consulting services to businesses inexpensively. Using data provided we calculate that the One-Stop provided consulting at a cost of just $51 per business and an hour of Business consulting for just $10. Similar businesses who were served by the business center, cost $120 each or $40 per service event. We estimate providing Rapid Response services, which is usually done in conjunction with EDD, cost $632 per company served and $38 per worker reached. This low cost may be indicative of the fact that most companies were small and services were limited. The One-Stop gets and distributes job listings for companies; we estimate costs of serving each company who used this service at $1,644. In addition, the One-Stop hosts events where multiple companies can come into the One-Stop and recruit employees; we estimate the cost of these events at $2,349, and cost per individual job seeker who attends these events is $147. Table C4-8: Cost of Employer Services Service Lines Units of
ServiceCost Cost per
UnitNote*
Companies served with rapid response services 22 $13,907 $632 17a Number of affected workers that received Rapid Response information 369 $13,907 $38 17 Number of mass hire events held
10 $10,820 $1,082 18
Number of applicants interviewed
320 $10,820 $34 19
Number of applicants hired 120 $10,820 $90 20 Number of businesses receiving business consulting assistance
510 $25,783 $51 21
Number of hours used to provide consulting assistance
2,680 $25,783 $10 22
Number of businesses visiting business service center
192 $23,047 $120 23
Number of service events provided to businesses
575 $23,047 $40 24
*refer to Table C4-9 for further explanation of calculations
California One-Stop System Cost Study Report
189
Table C4-9 below show notes on the calculations reported in earlier tables. Table C4-9: Notes on Service Cost Calculations Note Explanation
1 Total cost of universal access process divided by number of unique clients 2 Total cost of universal access process divided by number of client visits 3 Total cost of universal access process divided by number of service events 4 Total cost of workshops divided by number of workshops held 5 Total cost of workshops divided by total workshop attendance 6 Total cost of job clubs divided by number of unique clients served 7 Total cost of job clubs divided by total attendance at job clubs
7a Total cost of enrolled services divided by number of clients enrolled in any program
8
Total cost of assessments divided by number of assessments completed
9 Total cost of developing individual plans divided by total number of plans developed
10 Total cost of case management divided by number of clients receiving case management
11 Total cost of case management divided by number of case management client meetings
12 Total cost of counseling divided by number of counseling sessions 13 Total cost of counseling divided by number of individual sessions 14 Total cost of training and training referrals (does not include cost of training
delivered away from the One-Stop) divided by number of clients getting training 15 Total cost of providing support services divided by number of clients getting
support services 16 Total cost of placement services for enrolled clients divided by number placed 17 Total cost of rapid response service divided by number of workers served 18 Total cost of mass hire events divided by number of mass hire events 19 Total cost of mass hire events divided by number of applicants who were
interviewed at events 20 Total cost of mass hire events divided by the number of applicants placed 21 Total cost of business consulting assistance divided by the number of businesses
receiving assistance 22 Total cost of business consulting assistance divided by the number of hours of
consulting services 23 Total cost of the business service center divided by the number of unique
businesses visiting center 24 Total cost of the business service center divided by the number of service events
(may be more than one per business)
California One-Stop System Cost Study Report
190
Appendix D: Survey Instruments

California One-Stop System Cost Study Report
191
Figure D-1: Sample Cover Letter and Instructions Date, 2006 One-Stop Manager Subject One-Stop Center 1234 Main St. Anytown, CA 90000 Dear Ms. One-Stop Manager, Thank you for agreeing to be part of our Cost Study of California One-Stops. Your cooperation will help us gain a better understanding of how One-Stop Career Centers operate. This study is a major priority for the State WIB. Once our analysis is complete, we will provide you with an analysis of your data benchmarked against other California One-Stops, which will provide you valuable management information. Essentially we are asking for four types of data: first, information about expenditures for the closed 2005-06 fiscal year; second, how your staff and partners spent their time during 2005-06; third, an estimate of the services the Subject One-Stop Center produced in 2005-06; and fourth, a simple report on your partners who play a limited role in your One-Stop. We ask that you use the best available data, but as the directions on the instruments indicate, it is OK to estimate when needed. We have enclosed a series of simple data-collection forms that you should be able to complete easily from existing records or your own estimates. Please return the completed forms by this date, 2007. You have both paper and electronic copies. The following pages contain a list of enclosed survey instruments that can serve as a checklist; as you collect data, simply check off each completed form. Here are the types of data collection forms enclosed in this package: A. Expenditure Information
“Subject One-Stop Center Expenditures as Traced from Agencies’ Total Costs” (“Cost Study template”) The spreadsheet should be completed by: ___ Your Local Area fiscal person (for Local Area expenditures and also for WIA
expenditures in the One-Stop)
B. How staff spent their time in PY 05/06 “Effort Allocation Data Collection Instrument”

California One-Stop System Cost Study Report
192
To be completed by each responsibility center in the One-Stop ___ Subject One-Stop Center – Universal Services Staff ___ Subject One-Stop Center – Registered Services Staff ___ Subject One-Stop Center – Business Services Staff
C. Services Produced “Service Lines Data Collection Instrument” There is just one instrument summarizing all the services produced by the One-Stop. To be completed by One-Stop Management: ___One-Stop Management
D. Information on Partners “Partner’s Short Survey Form” To be completed by each of the following partners: ___ Retired People’s Association ___ Veterans Resource Association ___ Junior College ___ Local University ___ County Human Services Department ___ Local SBDC (EDD and the Department of Rehabilitation do not complete this form.) If you feel that this partner list is incomplete please add to the list and have any additional partners complete the ““Partner’s Short Survey Form”.
E. EDD Form – Cost Allocation Detail Sheet
___EDD Manager Also enclosed are: • A set of instructions containing an overview of the fiscal data-collection forms, with
information on how to go about making some of the calculations. We encourage you and your major partners to review this set of instructions. We only want to know about services and activities that occurred “under the roof” of your One-Stop. Services or activities that occurred elsewhere or which were “contracted out” are not included, even if they served One-Stop clients. For example, if a client got an ITA to receive training at a community college, the cost of that ITA is not included because the training did not occur in the One-Stop, but if the client is case managed by One-Stop staff the cost of the case management is included in our analysis.
California One-Stop System Cost Study Report
193
• A USB “flash drive” containing all these files. The flash drive has three folders:
o One folder is labeled “Data Collection Forms.” This folder contains most of the data-collection forms and directions listed above. The forms in this folder can be filled out electronically or by hand on the printed copies provided.
o The second folder is labeled “Electronic Fiscal Forms.” This folder contains the subset of the data-collection forms that we’d like to have filled out electronically. Please fill out the contents of this folder electronically.
o The third folder is labeled “EDD” and it contains the instructions and forms for the EDD Manager to complete. Please complete this spreadsheet electronically.
Once you have reviewed the forms, please call us with any questions you may have. Once all the data-collection forms have been filled out, please keep a copy of everything and send the originals, including the flash drive containing electronic information, in the enclosed self-addressed stamped envelope to:
Richard Moore Center for Management and Organization Development California State University, Northridge 18111 Nordhoff St. Northridge, CA 91330-8376
If you have questions, please call Andrew Wilson, the Research Assistant for this study, at 818-677-6400. I want to remind you that all the data you provide will be confidential. We will not identify you or any of your partners in our reports or analysis. Once again, thanks for your willingness to participate in this important project and we look forward to returning your analyzed data to you. If you have any questions about the project please contact either Andrew or me at 818-677-6400 or via email at [email protected] or [email protected]. Sincerely, Richard W. Moore, Ph.D. Professor and Project Director

California One-Stop System Cost Study Report
194
Figure D-2: Expenditure Instrument for Subject One-Stop Center

California One-Stop System Cost Study Report
195
Figure D-3: EDD Financial and Effort Worksheet

California One-Stop System Cost Study Report
196
Page 2

California One-Stop System Cost Study Report
197
Page 3

California One-Stop System Cost Study Report
198
Figure D-4: Services Lines Data Collection Instrument
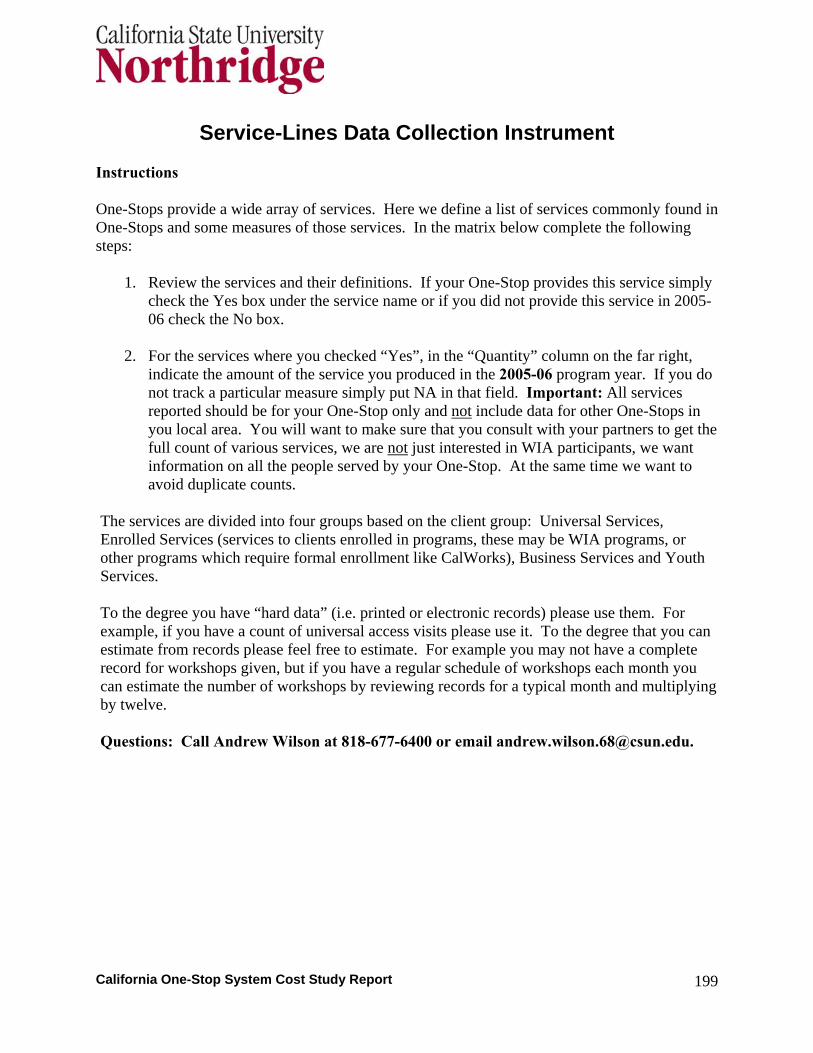
California One-Stop System Cost Study Report
199
Service-Lines Data Collection Instrument
Instructions One-Stops provide a wide array of services. Here we define a list of services commonly found in One-Stops and some measures of those services. In the matrix below complete the following steps:
1. Review the services and their definitions. If your One-Stop provides this service simply check the Yes box under the service name or if you did not provide this service in 2005-06 check the No box.
2. For the services where you checked “Yes”, in the “Quantity” column on the far right,
indicate the amount of the service you produced in the 2005-06 program year. If you do not track a particular measure simply put NA in that field. Important: All services reported should be for your One-Stop only and not include data for other One-Stops in you local area. You will want to make sure that you consult with your partners to get the full count of various services, we are not just interested in WIA participants, we want information on all the people served by your One-Stop. At the same time we want to avoid duplicate counts.
The services are divided into four groups based on the client group: Universal Services, Enrolled Services (services to clients enrolled in programs, these may be WIA programs, or other programs which require formal enrollment like CalWorks), Business Services and Youth Services. To the degree you have “hard data” (i.e. printed or electronic records) please use them. For example, if you have a count of universal access visits please use it. To the degree that you can estimate from records please feel free to estimate. For example you may not have a complete record for workshops given, but if you have a regular schedule of workshops each month you can estimate the number of workshops by reviewing records for a typical month and multiplying by twelve. Questions: Call Andrew Wilson at 818-677-6400 or email [email protected].

California One-Stop System Cost Study Report
200
Process Service Definition/ Notes Measure Quantity
Number Universal Access visits
Number Universal Access clients
Universal Self Service- Job Search Information and Support
Yes No
This is what goes on in the resource room; people seek jobs and related information and use resources to support the job search such as faxing resumes, completing self administered assessments, self referral to other services, using word processing etc. One-on-one assistance is not included in this service line.
Number Universal Access Service Events (e.g. faxed a resume, accessed career information on internet)
Universal Coaching: for job search information and support
Yes No
In the resource room clients get one-on-one help with a variety of activities, accessing information, quick informal coaching on resumes, help filing a UI claim etc. It may also include informal referral to other resources inside or outside the One-stop.
Number of times one-on-one coaching events occur
Universal Orientation to One-Stop
Yes No
Introducing new clients to the resources in the One-stop on their first visit; includes initial needs assessment.
Number of new universal access clients.
# of Workshops
Universal Workshops: Job search and support
Yes No
These are workshops that build skills or give support for job search. Workshops may serve universal clients, enrolled clients or both.
# of People attending
# Job club or network members
Universal Job seeking Networks
Yes No
This would include traditional job clubs of any type, whether they are staff facilitated or peer facilitated. They must be open to universal clients
Total Job club or network

California One-Stop System Cost Study Report
201
Process Service Definition/ Notes Measure Quantity attendance
Enrolled Assessment
Yes No
A comprehensive assessment of skills, background and interests for registered or potentially registered clients, interpreted by a professional
# of comprehensive assessments
Enrolled Individual Service Plan, such as IEP
Yes No
A service plan for an individual that involves one or more formal services leading to employment, that will be tracked by a staff member
# of IEPs or other formal plans
# of clients getting case management
Enrolled Case management
Yes No
Meetings, phone calls and other activities where a staff member helps a client complete their plan. It may involve problems solving, securing support services, or brief counseling. This includes follow-up after placement or exit.
# of meetings with case manager (staff/ client ratio may be a meaning full measure as well)
Enrolled Counseling
Yes No
Counseling for specific personal problems in scheduled sessions – individual or group. For example drug and alcohol counseling.
# of client session
Enrolled ITA/ OJT
Yes No
Trainees receive an ITA or an OJT experience as part of training plan.
# of clients with ITA or OJT
# of clients receiving training/education
Enrolled Training and Education
Yes No
Formal training or education which is part of a service plan. For example GED or ESL classes provided in the One-Stop.
# of hours of training/ education
Enrolled Support Services This is restricted to support services such as drop in child care which are
# of clients receiving support

California One-Stop System Cost Study Report
202
Process Service Definition/ Notes Measure Quantity
Yes No delivered under the roof. services
Enrolled Placement Assistance
Yes No
Defined as staff provided assistance to locate and secure a job.
# of clients placed (entered employment)
# of employees assisted
Business Services
Rapid Response Assistance
Yes No
Meeting at the company site with employers or employees of companies considering a lay-off or closure.
# Employers assisted
# of mass hire events
# of applicants interviewed at mass hire events
# of applicants hired from mass hires events
# of Job Fairs
# of companies participating
Business Services
Mass Hires/ Job Fairs
Yes No
One-stop staff arrange logistics, screen applicants for employer hiring a number of employees or Job Fairs where employers come and meet a number of potential applicants.
# of Job seekers participating in job fair
# of workshops
Business Services
Workshops
Yes No
Workshops to provide skills or information for businesses.
# of businesses attending
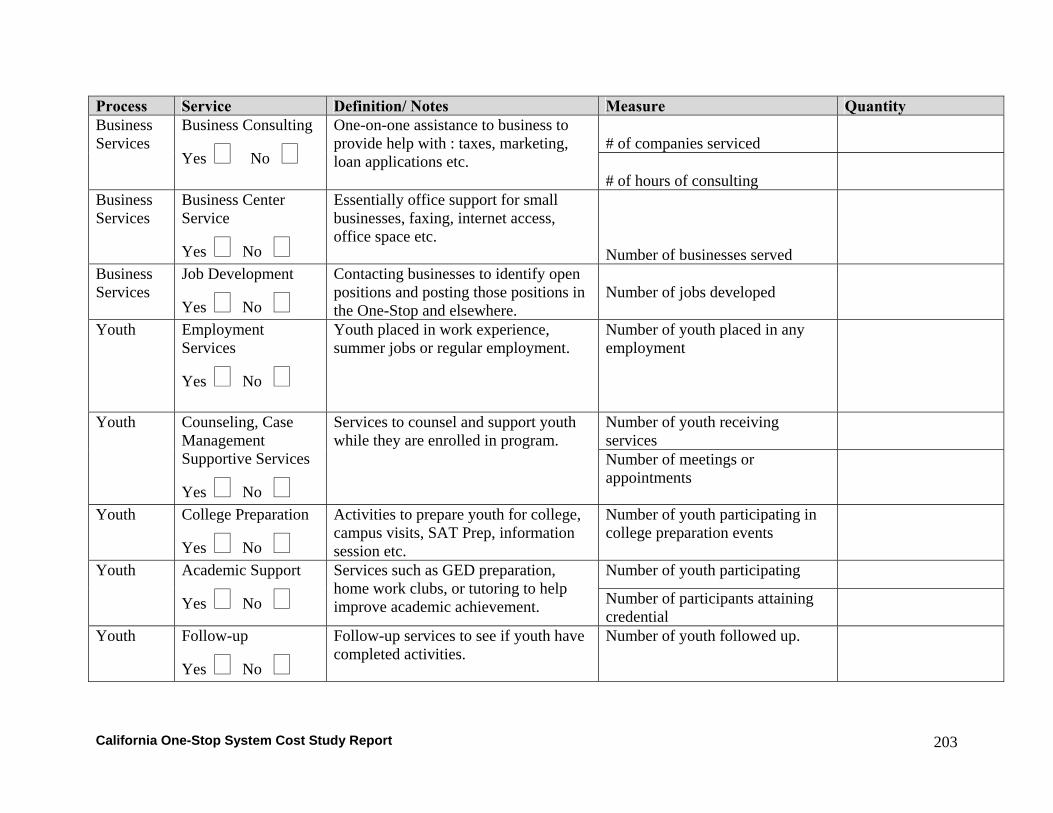
California One-Stop System Cost Study Report
203
Process Service Definition/ Notes Measure Quantity # of companies serviced
Business Services
Business Consulting
Yes No
One-on-one assistance to business to provide help with : taxes, marketing, loan applications etc.
# of hours of consulting
Business Services
Business Center Service
Yes No
Essentially office support for small businesses, faxing, internet access, office space etc.
Number of businesses served
Business Services
Job Development
Yes No
Contacting businesses to identify open positions and posting those positions in the One-Stop and elsewhere.
Number of jobs developed
Youth Employment Services
Yes No
Youth placed in work experience, summer jobs or regular employment.
Number of youth placed in any employment
Number of youth receiving services
Youth Counseling, Case Management Supportive Services
Yes No
Services to counsel and support youth while they are enrolled in program.
Number of meetings or appointments
Youth College Preparation
Yes No
Activities to prepare youth for college, campus visits, SAT Prep, information session etc.
Number of youth participating in college preparation events
Number of youth participating Youth Academic Support
Yes No
Services such as GED preparation, home work clubs, or tutoring to help improve academic achievement. Number of participants attaining
credential
Youth Follow-up
Yes No
Follow-up services to see if youth have completed activities.
Number of youth followed up.

California One-Stop System Cost Study Report
204
Figure D-5: Effort Allocation Data Collection Instrument
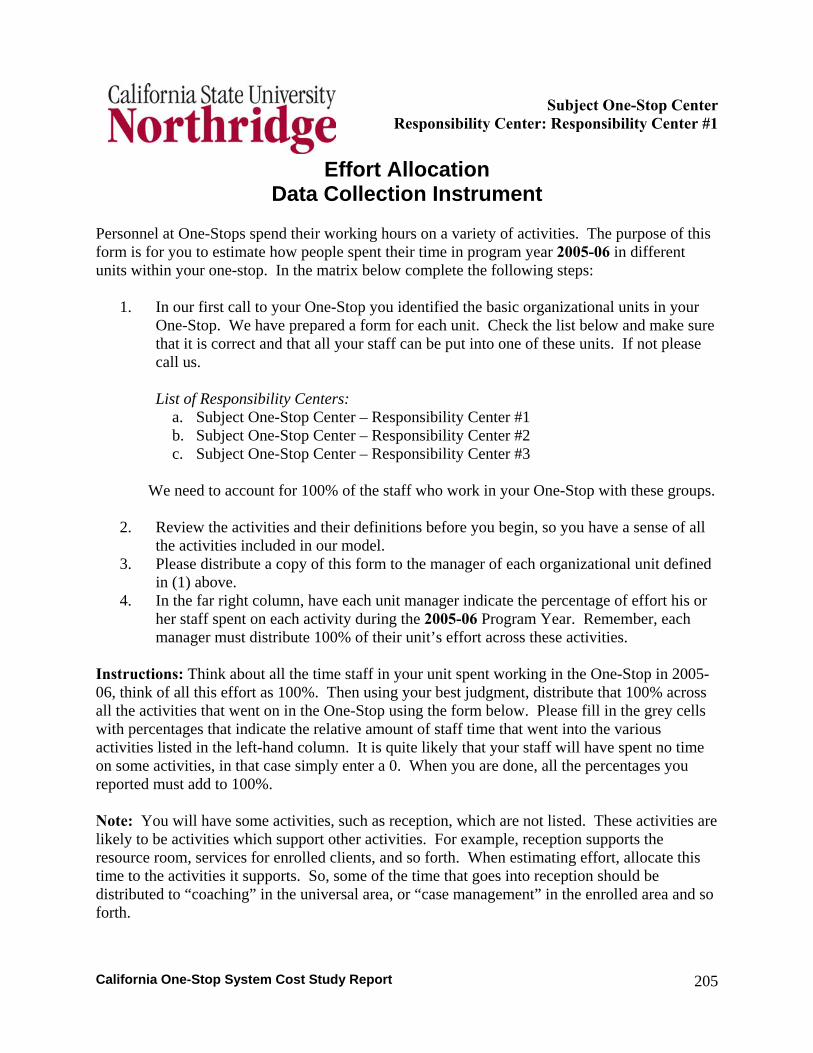
California One-Stop System Cost Study Report
205
Subject One-Stop Center Responsibility Center: Responsibility Center #1
Effort Allocation
Data Collection Instrument Personnel at One-Stops spend their working hours on a variety of activities. The purpose of this form is for you to estimate how people spent their time in program year 2005-06 in different units within your one-stop. In the matrix below complete the following steps:
1. In our first call to your One-Stop you identified the basic organizational units in your
One-Stop. We have prepared a form for each unit. Check the list below and make sure that it is correct and that all your staff can be put into one of these units. If not please call us.
List of Responsibility Centers:
a. Subject One-Stop Center – Responsibility Center #1 b. Subject One-Stop Center – Responsibility Center #2 c. Subject One-Stop Center – Responsibility Center #3
We need to account for 100% of the staff who work in your One-Stop with these groups.
2. Review the activities and their definitions before you begin, so you have a sense of all the activities included in our model.
3. Please distribute a copy of this form to the manager of each organizational unit defined in (1) above.
4. In the far right column, have each unit manager indicate the percentage of effort his or her staff spent on each activity during the 2005-06 Program Year. Remember, each manager must distribute 100% of their unit’s effort across these activities.
Instructions: Think about all the time staff in your unit spent working in the One-Stop in 2005-06, think of all this effort as 100%. Then using your best judgment, distribute that 100% across all the activities that went on in the One-Stop using the form below. Please fill in the grey cells with percentages that indicate the relative amount of staff time that went into the various activities listed in the left-hand column. It is quite likely that your staff will have spent no time on some activities, in that case simply enter a 0. When you are done, all the percentages you reported must add to 100%. Note: You will have some activities, such as reception, which are not listed. These activities are likely to be activities which support other activities. For example, reception supports the resource room, services for enrolled clients, and so forth. When estimating effort, allocate this time to the activities it supports. So, some of the time that goes into reception should be distributed to “coaching” in the universal area, or “case management” in the enrolled area and so forth.

California One-Stop System Cost Study Report
206
Subject One-Stop Center – Universal Services Staff _________________________________________________________ Person Completing Form_____________________________________________________ Date Completed __________ Number of FTE staff in your unit:_________________ Activities Allocation of effort (%)
Universal Activities Support and maintenance of “self-service” activities, maintaining resource room, staffing information / referral kiosks etc.
______%
Coaching: Informal one-on-one assistance, may include drop in appointments, NOT case management.
______%
Orientation to One-Stop: providing new clients information about One-Stop services, how to use the resource room, etc.
______%
Workshops / Seminars supporting job search; resume writing, interviewing, etc.
______%
Support of Job Club or Other Networking Activities ______%
Enrolled Services ; Services for Adult participants formally in enrolled in any program
Conducting Comprehensive Assessments of Applicants ______%
Development of Client Plans such as IEP/ ISS ______%
Case Management, Referrals: (time spent conferring with clients or not enrolled aimed primarily at referring them to outside services) ______%
Case Management, Support: monitoring progress, solving problems, arranging support services for enrolled clients. ______%
Case Management, Training: setting up ITA, or other classroom training ______%
Counseling: One-on-one or group counseling with scheduled appointments for specific problems (alcohol and drug counseling). NOT case management.
______%
OJT or ITA: Developing OJT positions and placing clients in them. ______%
Training and Education; General Education (GED, ESL) / occupational skills training – includes only training conducted in the One-Stop
______%
Providing Support Services: only support services such as drop in child care that occur in the One-Stop ______%
Providing Placement Assistance ______%
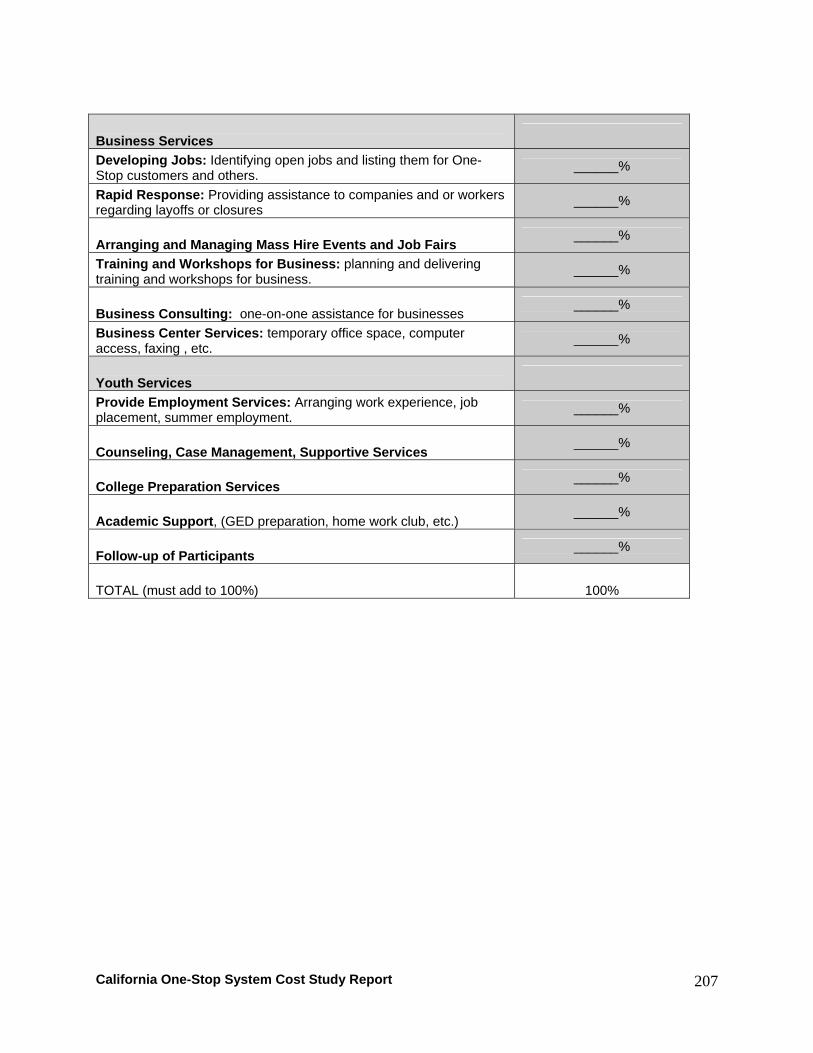
California One-Stop System Cost Study Report
207
Business Services
Developing Jobs: Identifying open jobs and listing them for One-Stop customers and others.
______%
Rapid Response: Providing assistance to companies and or workers regarding layoffs or closures
______%
Arranging and Managing Mass Hire Events and Job Fairs ______%
Training and Workshops for Business: planning and delivering training and workshops for business.
______%
Business Consulting: one-on-one assistance for businesses ______%
Business Center Services: temporary office space, computer access, faxing , etc.
______%
Youth Services
Provide Employment Services: Arranging work experience, job placement, summer employment.
______%
Counseling, Case Management, Supportive Services ______%
College Preparation Services ______%
Academic Support, (GED preparation, home work club, etc.) ______%
Follow-up of Participants ______%
TOTAL (must add to 100%) 100%
California One-Stop System Cost Study Report
208
Figure D-6: Partners Short Survey Form
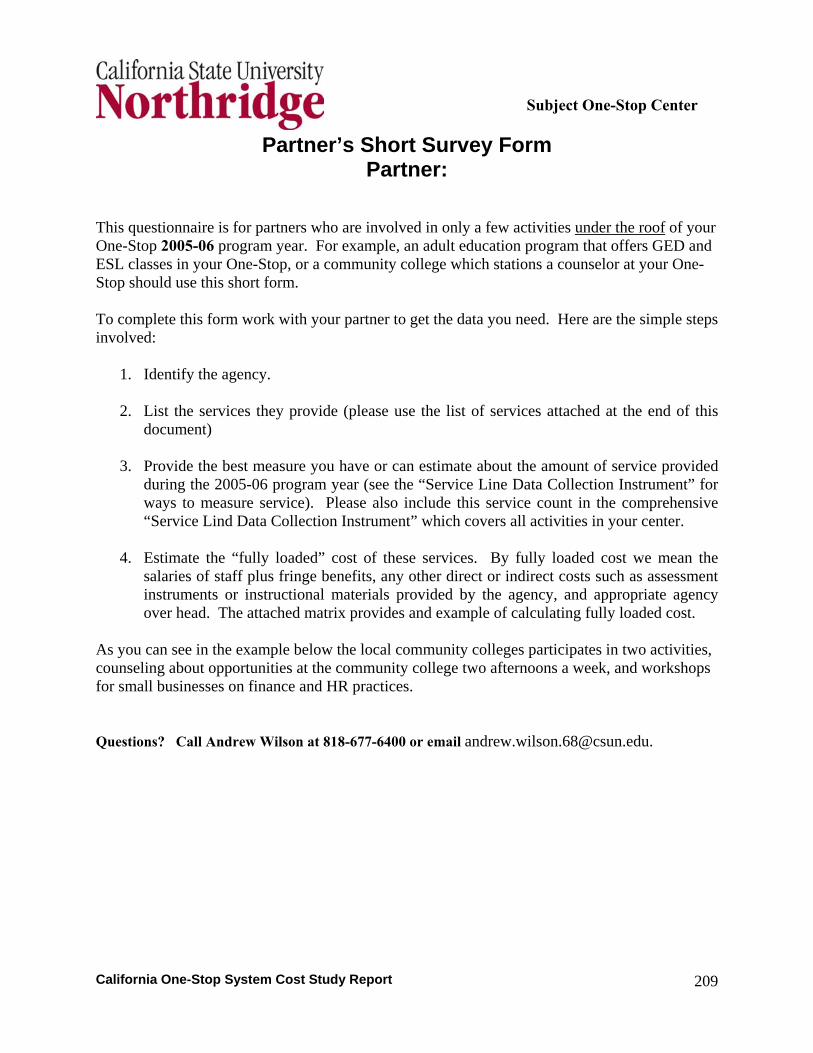
California One-Stop System Cost Study Report
209
Subject One-Stop Center
Partner’s Short Survey Form Partner:
This questionnaire is for partners who are involved in only a few activities under the roof of your One-Stop 2005-06 program year. For example, an adult education program that offers GED and ESL classes in your One-Stop, or a community college which stations a counselor at your One-Stop should use this short form. To complete this form work with your partner to get the data you need. Here are the simple steps involved:
1. Identify the agency.
2. List the services they provide (please use the list of services attached at the end of this document)
3. Provide the best measure you have or can estimate about the amount of service provided
during the 2005-06 program year (see the “Service Line Data Collection Instrument” for ways to measure service). Please also include this service count in the comprehensive “Service Lind Data Collection Instrument” which covers all activities in your center.
4. Estimate the “fully loaded” cost of these services. By fully loaded cost we mean the
salaries of staff plus fringe benefits, any other direct or indirect costs such as assessment instruments or instructional materials provided by the agency, and appropriate agency over head. The attached matrix provides and example of calculating fully loaded cost.
As you can see in the example below the local community colleges participates in two activities, counseling about opportunities at the community college two afternoons a week, and workshops for small businesses on finance and HR practices. Questions? Call Andrew Wilson at 818-677-6400 or email [email protected].

California One-Stop System Cost Study Report
210
Subject One-Stop Center Agency /Activity Measure of Annual
Activity Annual Cost PY 2005-06
Sample Agency : Community College
Total Cost: $56,510
Activity 1: Coaching about training and education
350 one-on-one appointments
$ 46,700 ( Hourly rate with fringes and overhead $45 x 20 hours a week x 50 weeks= $45,000, 200 assessment instruments @ $8.50= $1,700)
Activity 2: Business workshops
21 Workshops 225 participants
$9,810 (Each workshop 8 hours of labor at $45 per hour X 21 workshops= $7,560 $10 of materials for each participant $2,250)
Agency Name:
Total Cost:
Activity 1:
Activity 2:
Activity 3:
Activity 4:
Activity 5:

California One-Stop System Cost Study Report
211
List of One Stop Services Universal Activities Support and maintenance of “self-service” activities, maintaining resource room, staffing information / referral kiosks etc. Coaching: Informal one-on-one assistance, may include drop in appointments, NOT case management. Orientation to One-Stop: providing new clients information about One-Stop services, how to use the resource room, etc. Workshops / Seminars supporting job search; resume writing, interviewing, etc. Support of Job Club or Other Networking Activities Enrolled Services ; Services for Adult participants formally in enrolled in any program
Conducting Comprehensive Assessments of Applicants
Development of Client Plans such as IEP/ ISS
Case Management, Referrals: (time spent conferring with clients or not enrolled aimed primarily at referring them to outside services) Case Management, Support: monitoring progress, solving problems, arranging support services for enrolled clients. Case Management, Training: setting up ITA, or other classroom training Counseling: One-on-one or group counseling with scheduled appointments for specific problems (alcohol and drug counseling). NOT case management. OJT or ITA: Developing OJT positions and placing clients in them.
Training and Education; General Education (GED, ESL) / occupational skills training – includes only training conducted in the One-Stop Providing Support Services: only support services such as drop in child care that occur in the One-Stop Providing Placement Assistance Business Services
Rapid Response: Assistance to companies and or workers regarding layoffs or closures
Arranging and Managing Mass Hire Events and Job Fairs Training and Workshops for Business: planning and delivering training and workshops for business.
Business Consulting: one-on-one assistance for businesses
Business Center Services: temporary office space, computer access, faxing , etc.
Youth Services
Provide Employment Services: work experience, job placement, summer employment.
Counseling, Case Management, Supportive Services
College Preparation Services
Academic Support, (GED preparation, home work club, etc.)
Follow-up of Participants