california craft brewers association april 22, 2014 · cooling tower blow-down efficiency water...
TRANSCRIPT

California Craft Brewers AssociationApril 22, 2014

• Regional water wholesaler
• 26 Member Agencies
• 6 Counties
• Serving Approximately 19 million residents
• 5,200 square mile service area
• $1 trillion economy
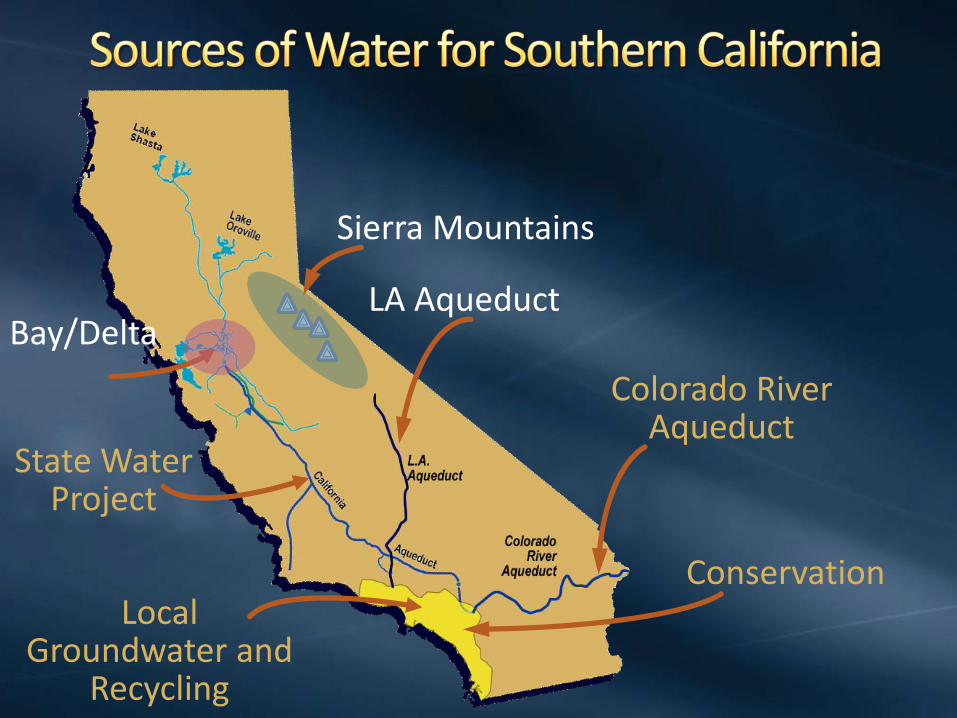
Bay/DeltaLA Aqueduct
Colorado River Aqueduct
State Water Project
Sierra Mountains
Local Groundwater and
Recycling
Conservation
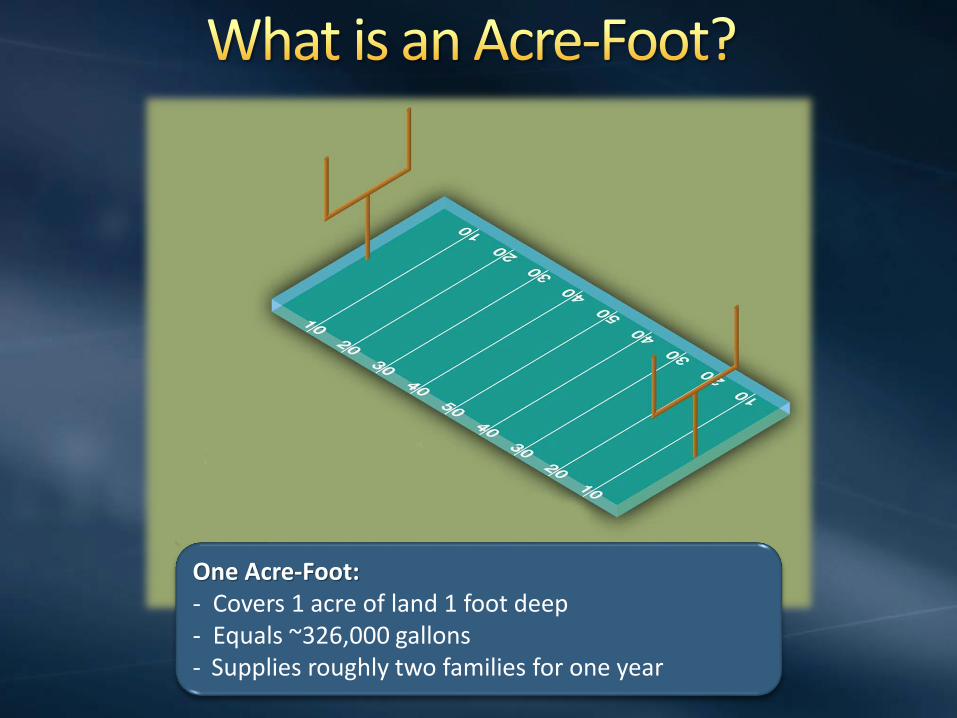
One Acre-Foot:- Covers 1 acre of land 1 foot deep- Equals ~326,000 gallons - Supplies roughly two families for one year
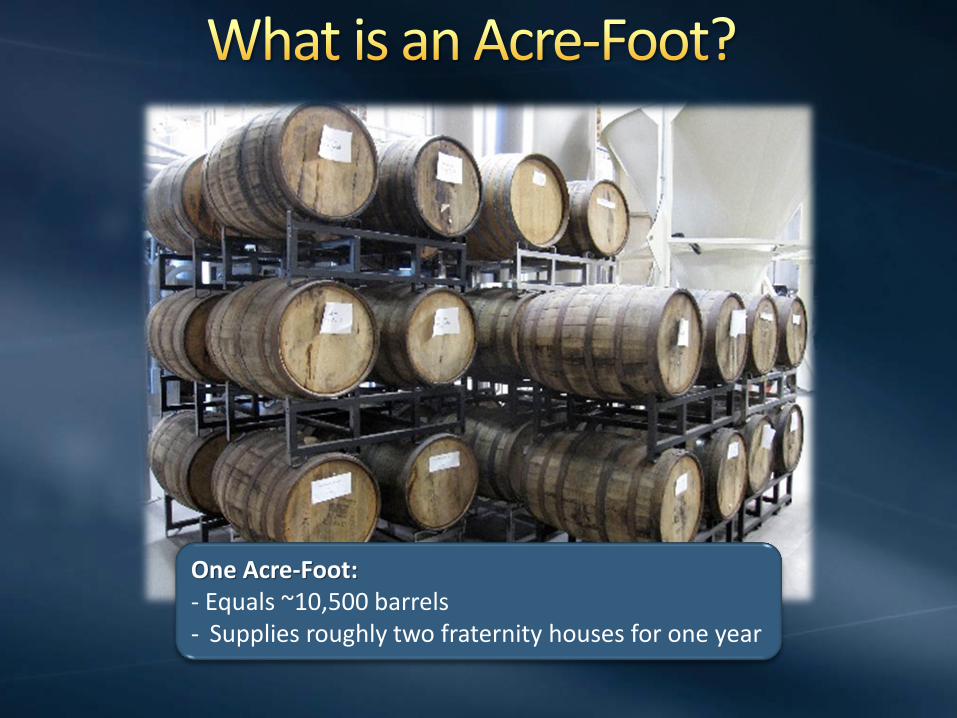
One Acre-Foot:- Equals ~10,500 barrels - Supplies roughly two fraternity houses for one year
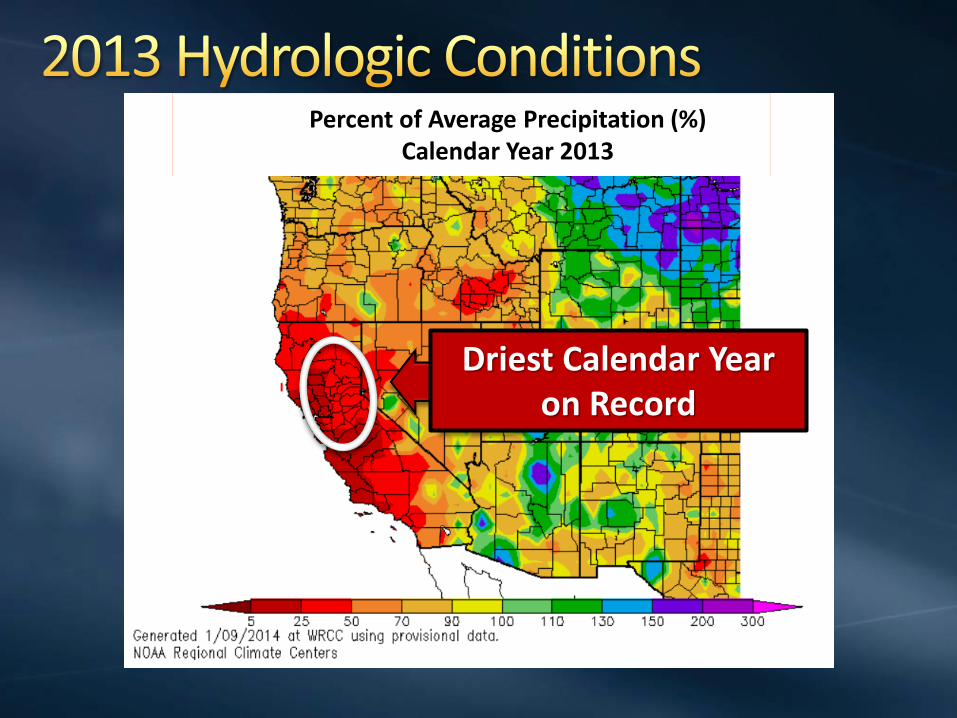
Driest Calendar Year on Record
Percent of Average Precipitation (%)Calendar Year 2013

0
10
20
30
40
50
60
70
80
90
100
OCT NOV DEC JAN FEB MAR APR MAY JUN JUL AUG SEPT
Cu
mu
lati
ve P
reci
pit
atio
n (
Inch
es)
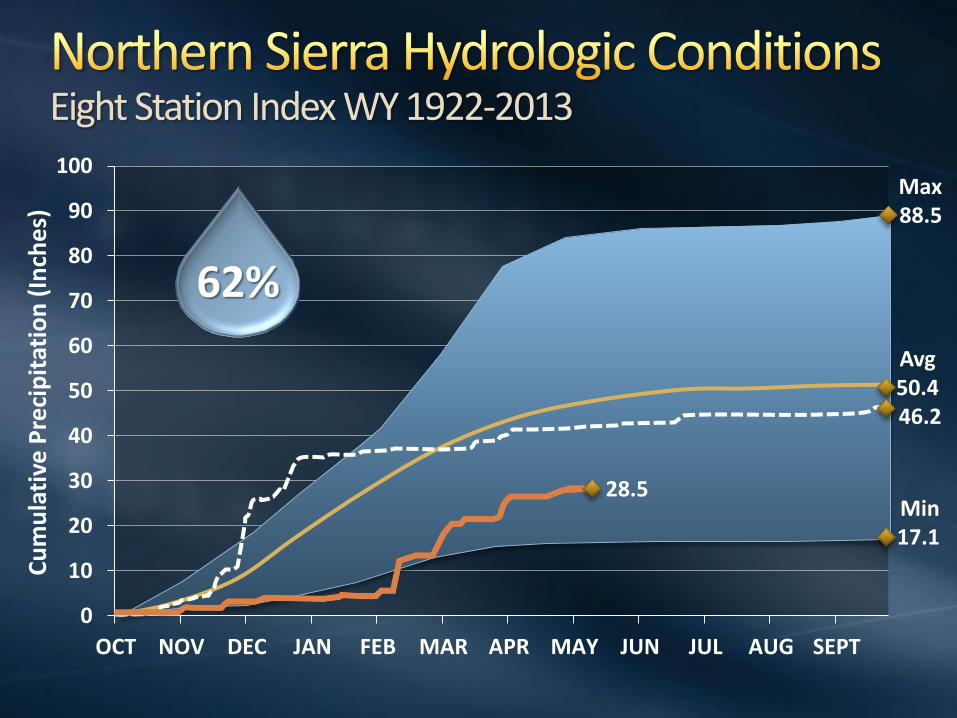
Eight Station Index WY 1922-2013
Max88.5
Min17.1
Avg50.446.2
4.5
17%
Unprecedented Dry Conditions
0
10
20
30
40
50
60
70
80
90
100
OCT NOV DEC JAN FEB MAR APR MAY JUN JUL AUG SEPT
Cu
mu
lati
ve P
reci
pit
atio
n (
Inch
es)
Eight Station Index WY 1922-2013
Max88.5
Min17.1
Avg50.446.2
62%
28.5

0
5
10
15
20
25
30
35
Oct Nov Dec Jan Feb Mar Apr May Jun Jul Aug Sep
Wat
er
Co
nte
nt
(in
)
Northern Sierra Snowpack
6%
Normal
Current Water Year
Previous Water Year
1.2
Still in a Drought
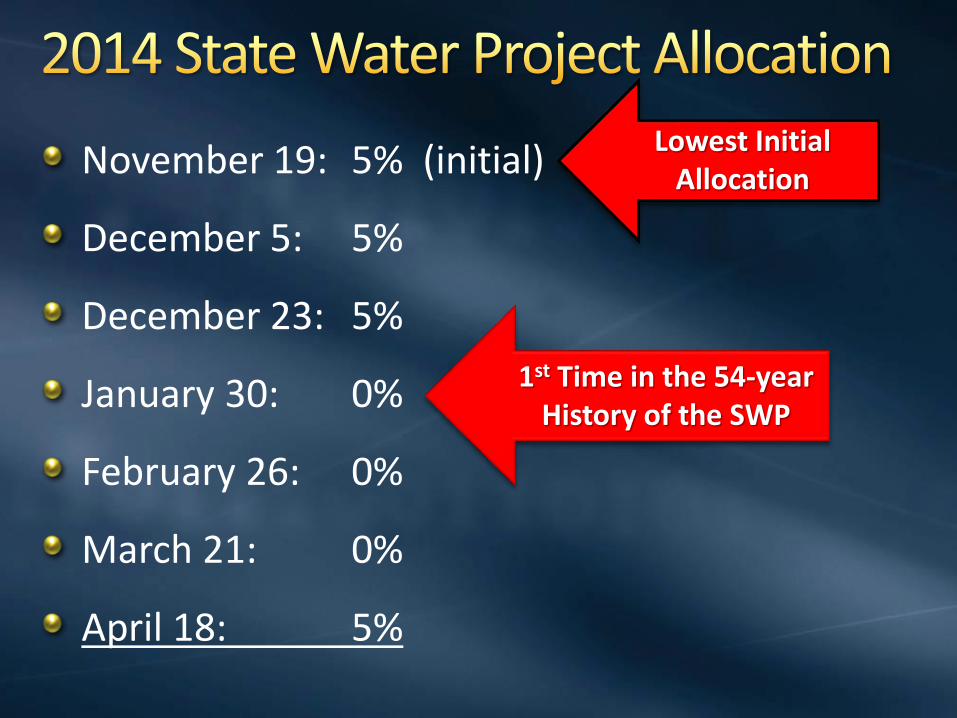
November 19: 5% (initial)
December 5: 5%
December 23: 5%
January 30: 0%
February 26: 0%
March 21: 0%
April 18: 5%
1st Time in the 54-year History of the SWP
Lowest Initial Allocation

Governor Brown declaration on January 17
“Perhaps the worst drought California has seen since records began being kept”
Calls for citizens to do their part and reduce water use by 20 percent
Took actions to facilitate management of water statewide
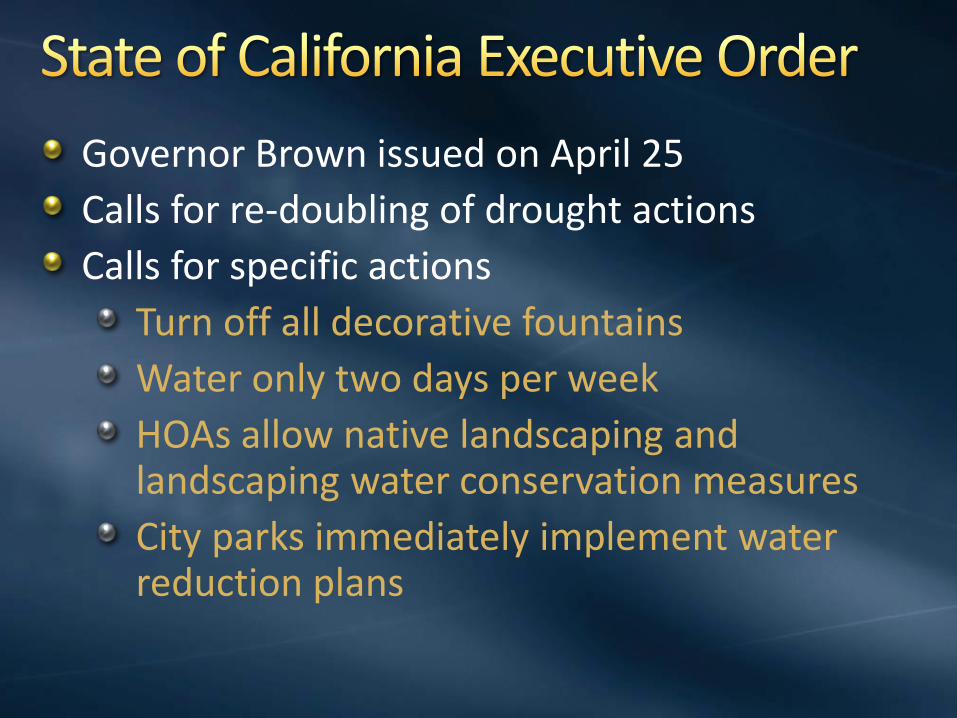
Governor Brown issued on April 25
Calls for re-doubling of drought actions
Calls for specific actions
Turn off all decorative fountains
Water only two days per week
HOAs allow native landscaping and landscaping water conservation measures
City parks immediately implement water reduction plans


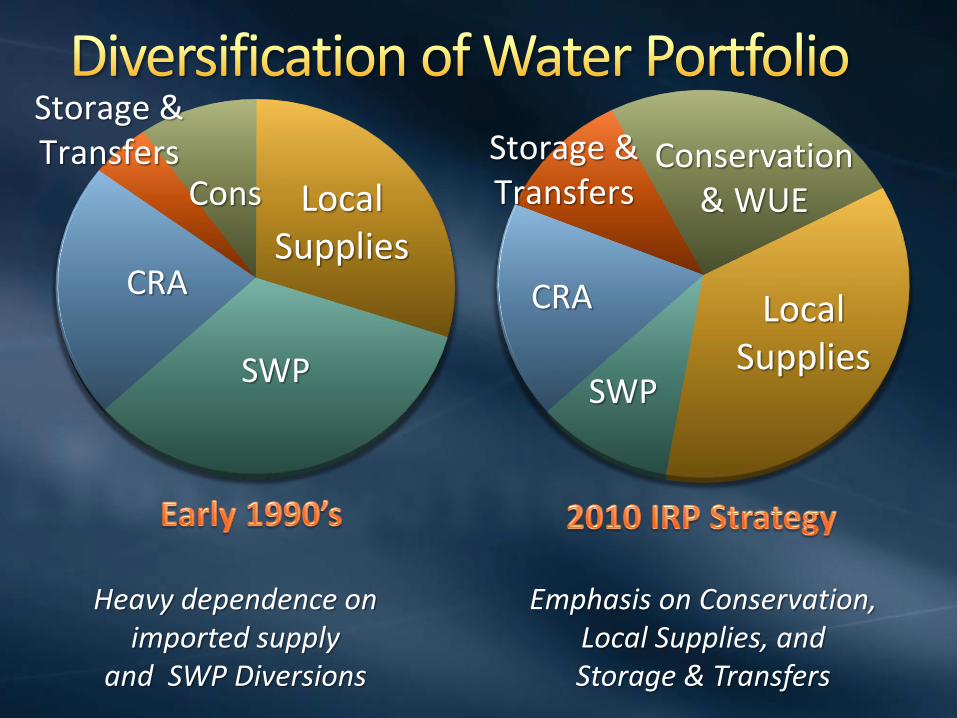
Heavy dependence on imported supply
and SWP Diversions
Emphasis on Conservation, Local Supplies, and Storage & Transfers
CRA
Cons
SWP
Local Supplies
Storage & Transfers
CRA
SWP
Local Supplies
Storage & Transfers
Conservation & WUE
CURRENT AS OF 051711
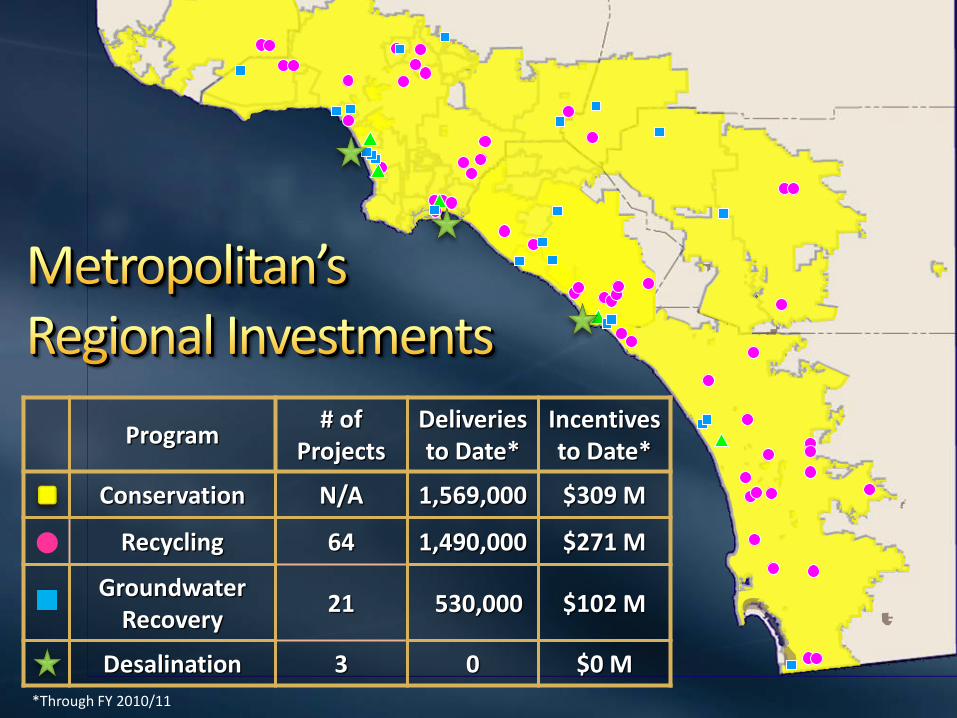
Program# of
ProjectsDeliveries to Date*
Incentives to Date*
Conservation N/A 1,569,000 $309 M
Recycling 64 1,490,000 $271 M
Groundwater Recovery
21 530,000 $102 M
Desalination 3 0 $0 M
*Through FY 2010/11
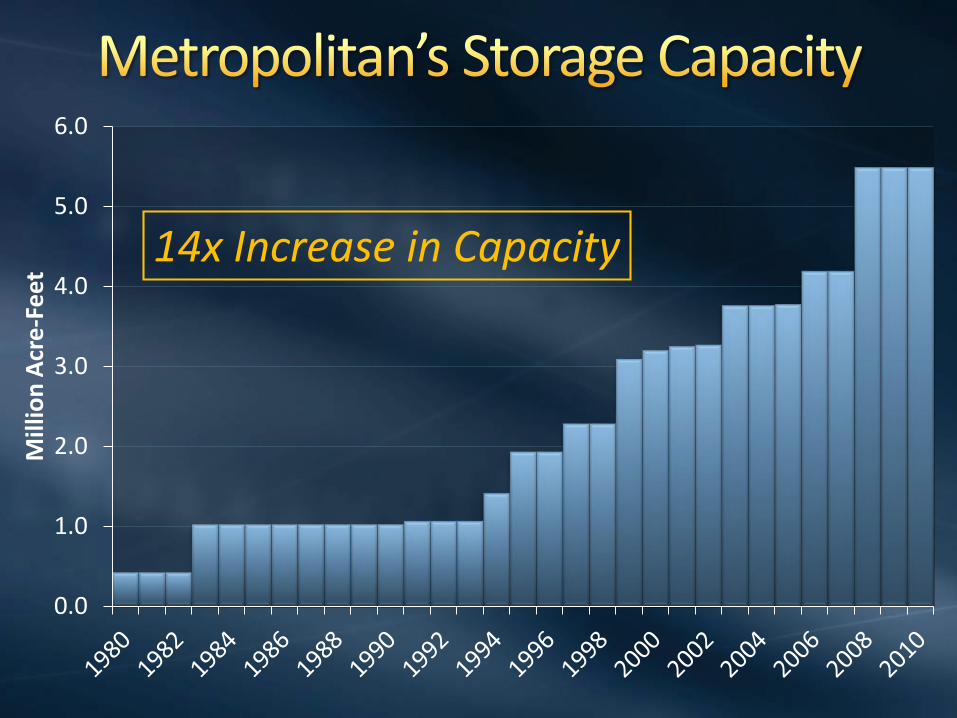
0.0
1.0
2.0
3.0
4.0
5.0
6.0
Mill
ion
Acr
e-F
eet
14x Increase in Capacity
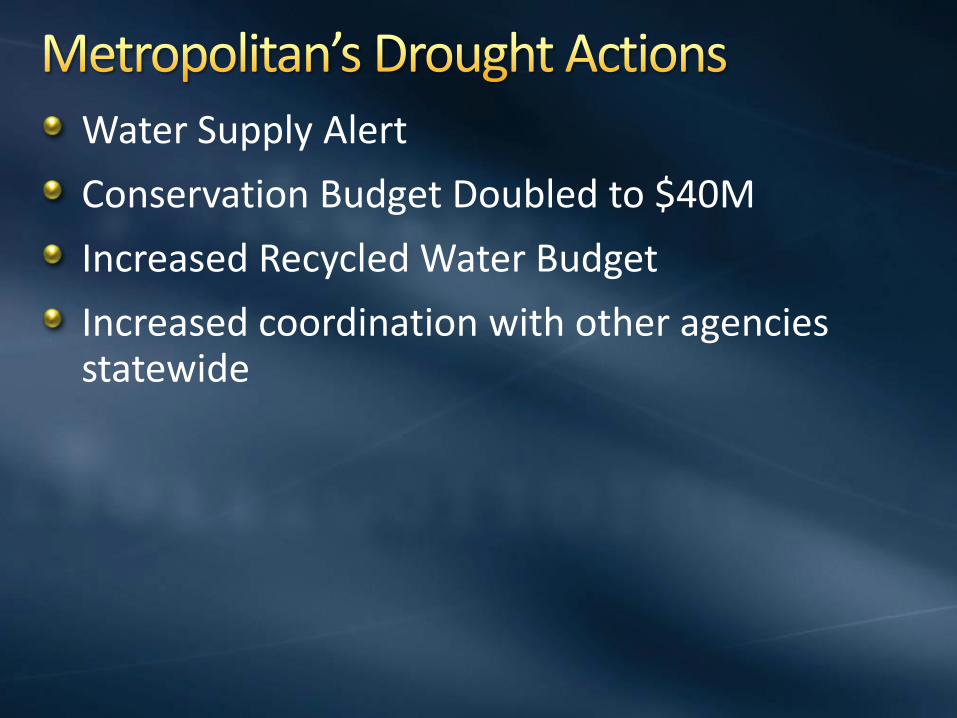
Water Supply Alert
Conservation Budget Doubled to $40M
Increased Recycled Water Budget
Increased coordination with other agencies statewide

2.21.8
1.1 1.01.7
2.4 2.72.4
0
1
2
3
4
2006 2007 2008 2009 2010 2011 2012 2013 2014
Mill
ion
Acr
e-F
ee
t
Emergency Storage Dry-Year Storage
End of Year Balances*
*Estimated actual storage balances, may be subject to change.
Storage use will vary based on actual
conditions
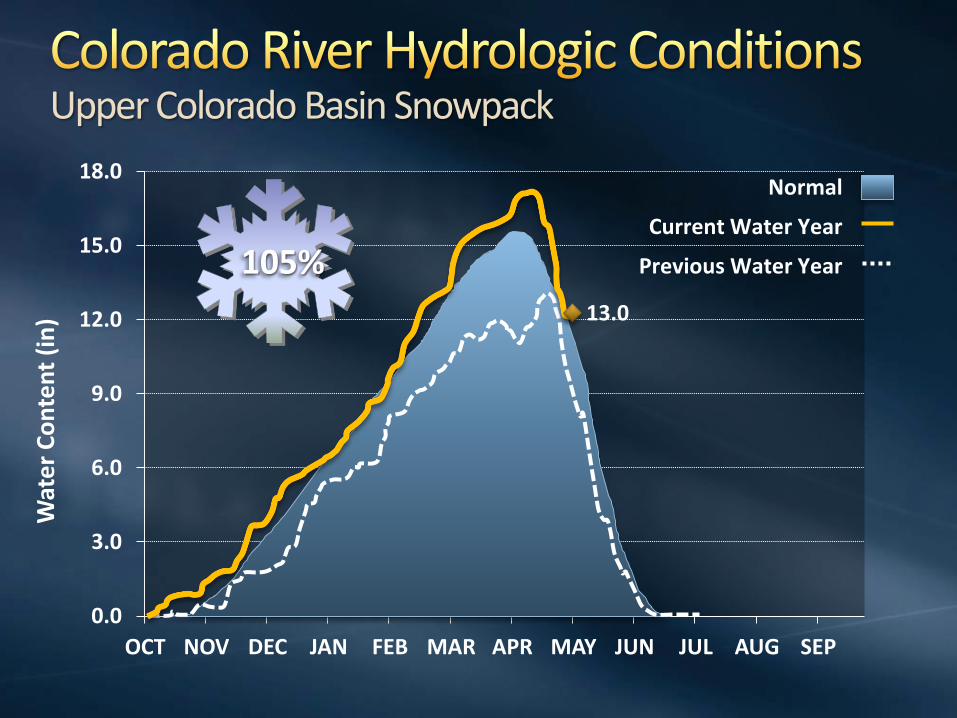
Upper Colorado Basin Snowpack
0.0
3.0
6.0
9.0
12.0
15.0
18.0
OCT NOV DEC JAN FEB MAR APR MAY JUN JUL AUG SEP
Wat
er
Co
nte
nt
(in
)
Normal
Current Water Year
Previous Water Year
13.0
105%


High Efficiency Toilets
Tank, dual flush, flushometer
1.28 gpf or less
Base rebate $50 or $100
Zero / Ultra Low Water Urinals
From zero to .25 gpf
Base rebate $200

Conductivity Controllers
Base rebate $625
pH Conductivity Controllers
Base rebate $1,750

Weather Based
Base rebate $25/station
Central Computer
Base rebate $25/station
Soil Moisture Sensor System (NEW)
Base rebate $25/station

Rotating Spray Nozzles
Base rebate $4 per nozzle
Large Rotary Nozzles
Base rebate $13/set

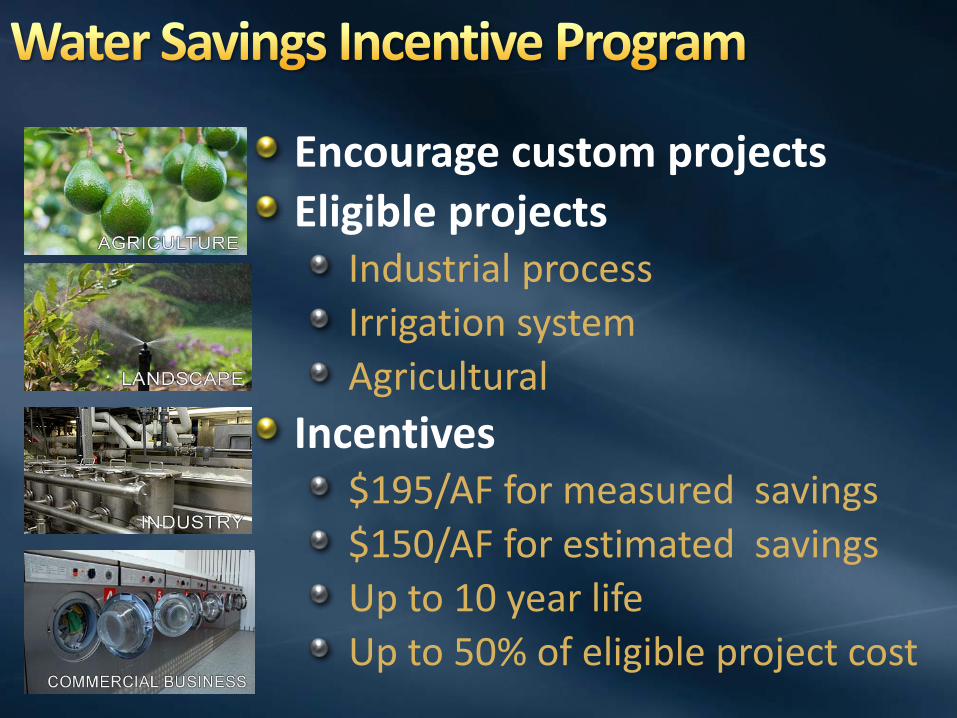
Encourage custom projectsEligible projects
Industrial process
Irrigation system
Agricultural
Incentives$195/AF for measured savings
$150/AF for estimated savings
Up to 10 year life
Up to 50% of eligible project cost

No cost
Minimum 1 acre irrigated area
Commercial, institutional, public agencies, HOAs common areas
Recommendations to improve water efficiency
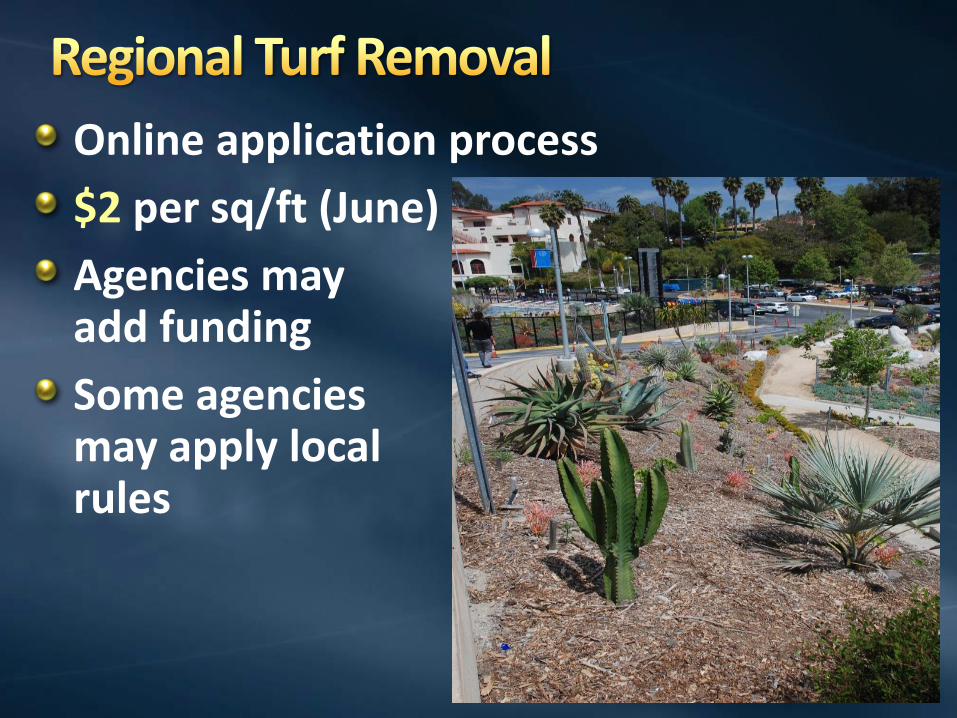
Online application process
$2 per sq/ft (June)
Agencies mayadd funding
Some agenciesmay apply localrules

Standard CII Devices
Landscape Conservation
Process Water Improvements
Opportunity to showcase water use efficiency!

Stone has already implemented a major improvement: Reverse Osmosis System
Allows for beneficial recirculation of process water
Reduced potable water demand by ~25%
Other potential process improvements
RO water storage
Cooling Tower blow-down efficiency
Water Efficiency Audit – April 2014
Heavy dependence on imported supply
and SWP Diversions
Emphasis on Conservation, Local Supplies, and Storage & Transfers
CRA
Cons
SWP
Local Supplies
Storage & Transfers
CRA
SWP
Local Supplies
Storage & Transfers
Conservation & WUE
CURRENT AS OF 051711
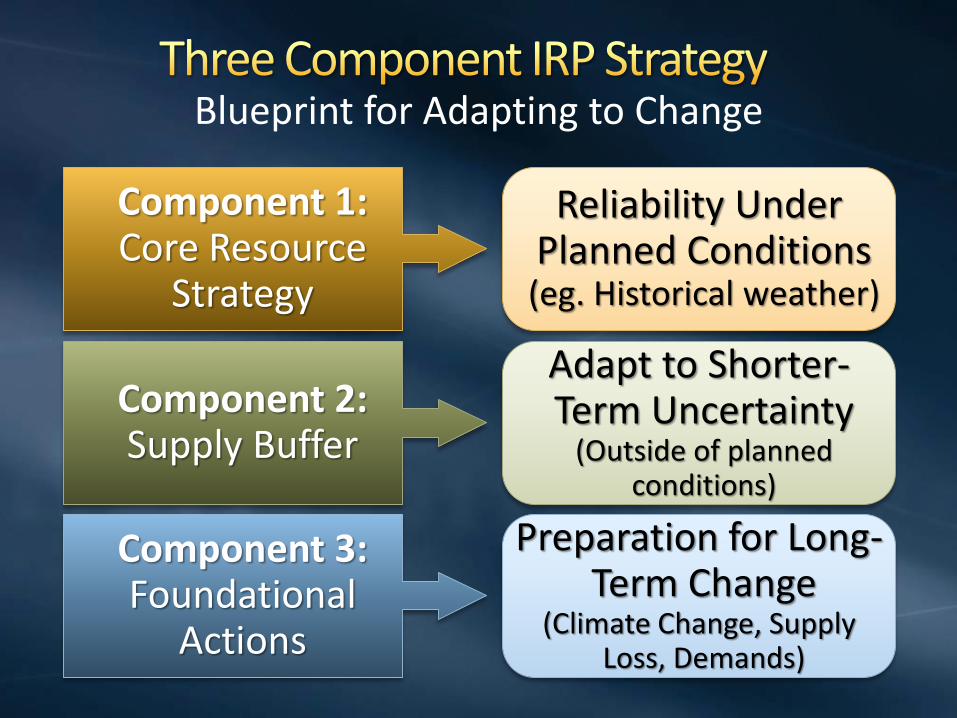
Blueprint for Adapting to Change
Component 1:Core Resource
Strategy
Reliability Under Planned Conditions (eg. Historical weather)
Adapt to Shorter-Term Uncertainty
(Outside of planned conditions)
Preparation for Long-Term Change
(Climate Change, Supply Loss, Demands)
Component 2:Supply Buffer
Component 3: Foundational
Actions


Bay Area – 33%
Central Valley – 23 to 90%
Metropolitan – 30%
Some regions 100% dependent
36
California relies on water that flows through the Delta

State Water Project: Essential Baseline
• Southern California depends on a reliable baseline supply of water flowing through the Delta for:
– Recycled water
– Groundwater replenishment and recovery
– Storage management
– Blending/stretching other supplies• Water quality and salinity management
• Conservation
Conservation Garden Recycled Water Groundwater Recharge

Sacramento
38
SWP Pumps
CVP Pumps
Sac River
Stockton
Preliminary Subject to Revision
Sacramento
SWP Pumps
CVP Pumps
Sac River
Stockton
Preliminary Subject to Revision
North Diversion
South Diversion
CONVEYANCEThree intakes/pumping plants
State-of-the-art fish screens
Forebay temporarily stores water pumped from river
Two gravity flow tunnels (30 miles long; 9,000 cfs)
ECOSYSTEM RESTORATION57 species
~145,000 acres
REDUCING ENVIRONMENTAL
STRESSORSToxic pollutants
Invasive species
Predator control
Illegal poaching
Hatchery practices
Bay-Delta Conservation Plan
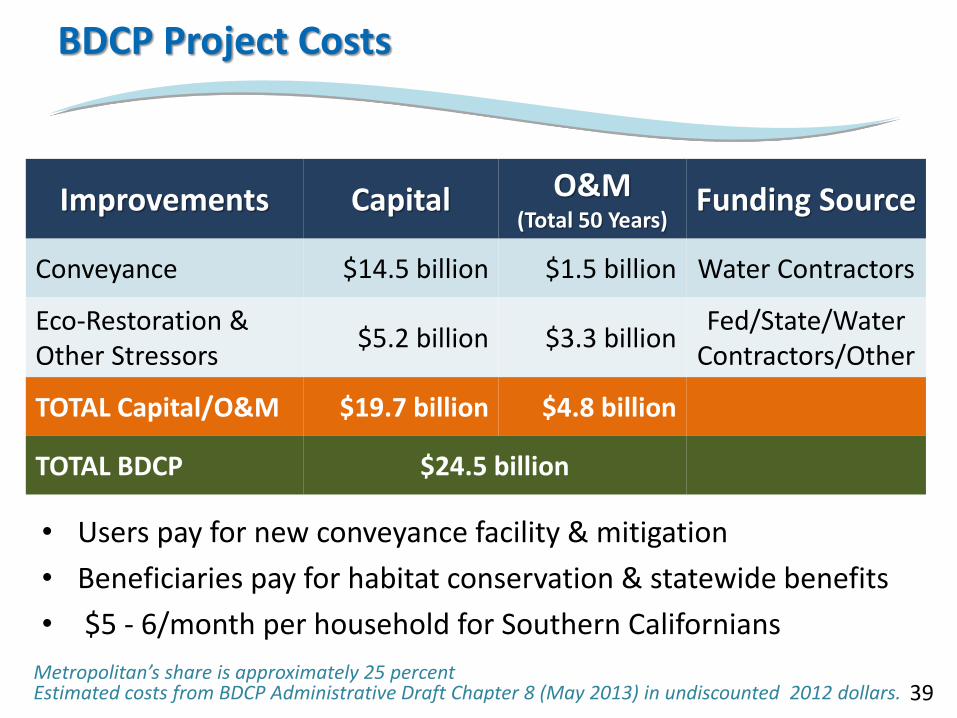
BDCP Project Costs
• Users pay for new conveyance facility & mitigation
• Beneficiaries pay for habitat conservation & statewide benefits
• $5 - 6/month per household for Southern Californians
Improvements Capital O&M (Total 50 Years)
Funding Source
Conveyance $14.5 billion $1.5 billion Water Contractors
Eco-Restoration & Other Stressors
$5.2 billion $3.3 billionFed/State/Water
Contractors/Other
TOTAL Capital/O&M $19.7 billion $4.8 billion
TOTAL BDCP $24.5 billion
39Metropolitan’s share is approximately 25 percentEstimated costs from BDCP Administrative Draft Chapter 8 (May 2013) in undiscounted 2012 dollars.

Statewide Economic Report—Costs/Benefits of BDCP
• $5 billion in overall net benefits
• 177,000 construction and habitat restoration jobs created
• $84 billion in statewide business activity over 50-year life
• Avoidance of water shortages that could cost over 1 million jobs
40

$0
$500
$1,000
$1,500
$2,000
$2,500
$3,000
$3,500
Stormwater GroundwaterRecovery
Recycled SeawaterDesalination
Sup
ply
Co
st (
$/A
F)
$1,600 -3,500+/AF $600 -
2,600/AF
$700 -3,500+/AF
$1,600 -2,300/AF
Cost Comparison of Water Portfolio Projects
41
MWD Tier 1 Treated with Delta Improvements = $985 to $1,013/AF *
* MWD Treated Water Rate with Delta Improvements (in 2013 dollars)-- Existing ($847/AF treated rate) + Delta Improvements ($138 - $166/AF melded rate) = $985 - $1,013/AFLocal project cost ranges are based on recent reports from member agencies
September 17, 2013
Metropolitan is committed to meeting future additional water supply needs through local resources and conservation

Risks of Doing Nothing
•Impacts
Pumping restrictions
(supply reduced 30%)
Ecosystem decline
Decreased reliability
Increased cost
Stranded investments
•Major Levee Failure
Up to three-year disruption of water deliveries
$40 billion estimated impact to California’s economy
Source: DWR Delta Risk Management Study 2007 and 2009
T H E M E T R O P O L I T A N W A T E R D I S T R I C T O F
S O U T H E R N C A L I F O R N I A
What can you do?Be informed.Know the facts.Get involved.Our future depends on it.
California’s current drought is severe
Conservation and Water Use Efficiency is an important part of managing current and future water supply reliability
Do your part and look into potential savings
Continued water supply reliability requires investment in California’s water future
Local supply, imported supply, and water use efficiency
