california competes: higher education for a strong economy 50 california st., suite 3165, san...
TRANSCRIPT
California Competes: Higher Education for a Strong Economy
50 California St., Suite 3165, San Francisco, CA 94111 v:(415) 343-0830 f:(415) 543-0735
San Joaquin Region
www.californiacompetes.org
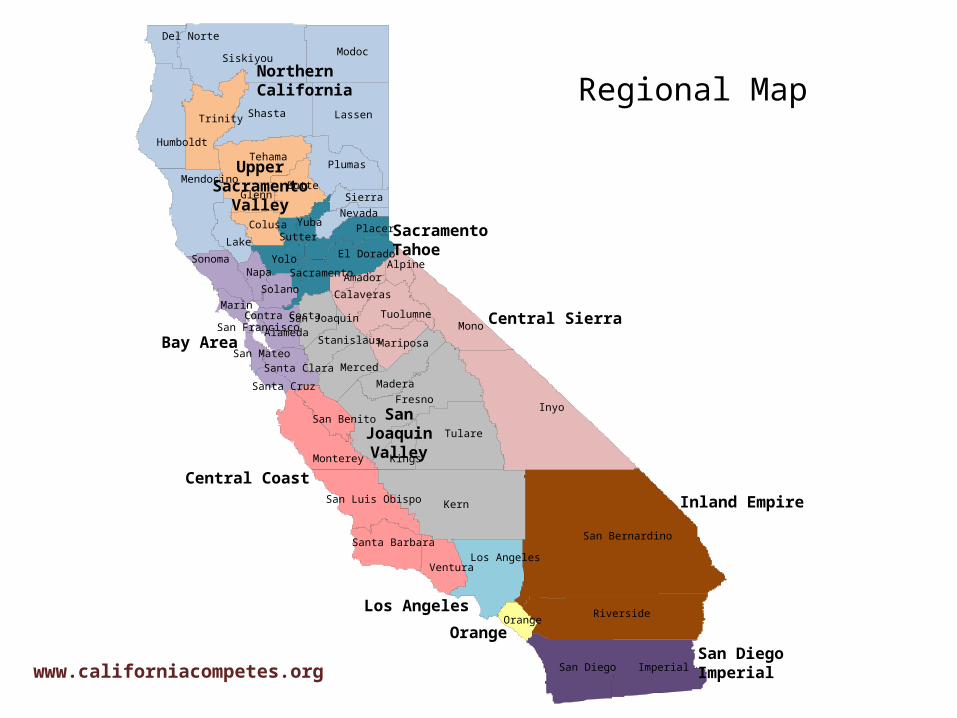
Santa Cruz
San Benito
Merced
Sonoma Yolo
Colusa
Lake
YubaNevada
Placer
Mendocino
Del Norte
Humboldt
Madera
TuolumneMono
Monterey Kings
Calaveras
Los AngelesVentura
San Diego
Lassen
Alameda
AlpineAmador
Butte
Contra Costa
El Dorado
Fresno
Glenn
Imperial
Inyo
Kern
Marin
Mariposa
Modoc
Napa
Orange
Plumas
Riverside
Sacramento
San Bernardino
San FranciscoSan Joaquin
San Luis Obispo
San Mateo
Santa Barbara
Santa Clara
Shasta
Sierra
Siskiyou
Solano
Stanislaus
Sutter
Tehama
Trinity
Tulare
Regional Map Northern California
Upper Sacramento Valley
Sacramento Tahoe
Central Sierra
San Joaquin Valley
Bay Area
Central CoastInland Empire
San Diego Imperial
Los Angeles
Orange
www.californiacompetes.org
Population and Educational Attainment
www.californiacompetes.org
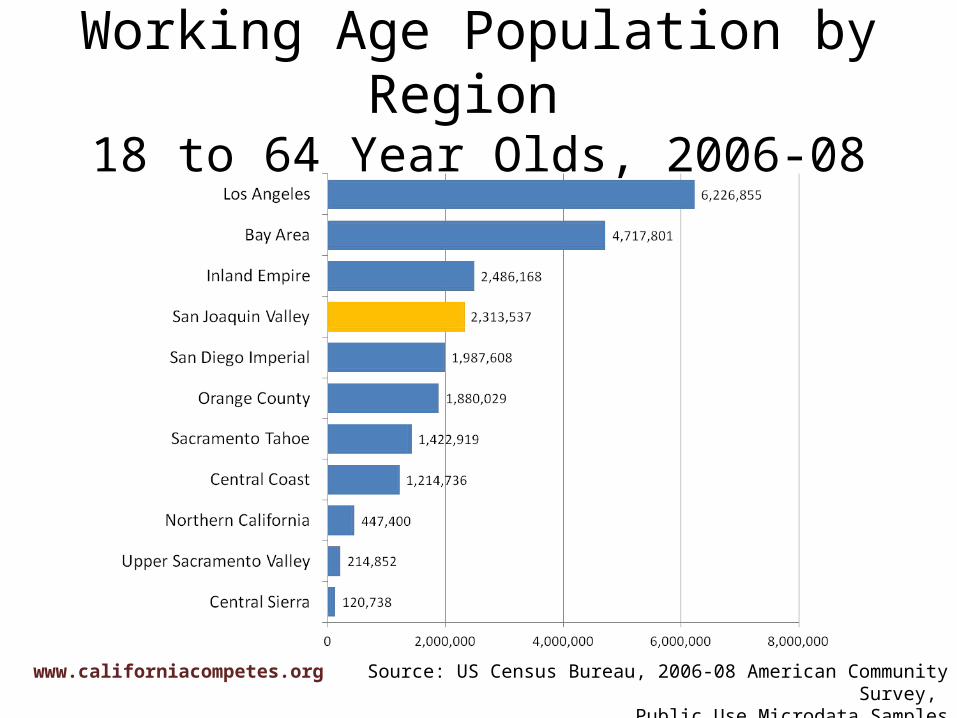
Working Age Population by Region 18 to 64 Year Olds, 2006-08
Source: US Census Bureau, 2006-08 American Community Survey, Public Use Microdata Samples
www.californiacompetes.org
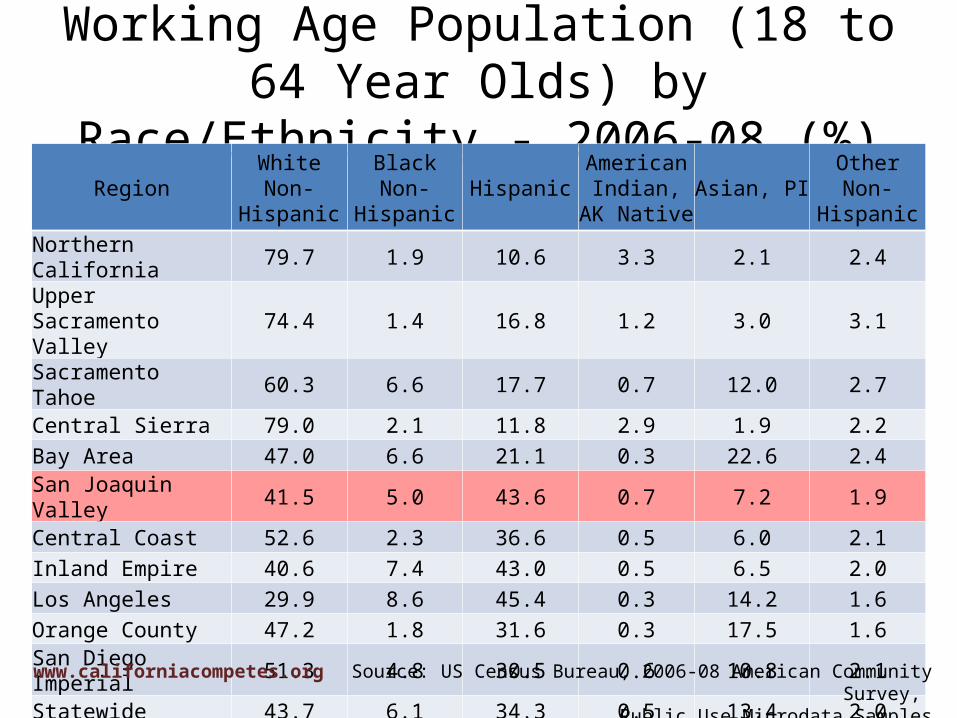
Working Age Population (18 to 64 Year Olds) by Race/Ethnicity - 2006-08 (%)
Region White Non-Hispanic
Black Non-Hispanic Hispanic
American Indian, AK
NativeAsian, PI Other Non-
Hispanic
Northern California 79.7 1.9 10.6 3.3 2.1 2.4Upper Sacramento Valley 74.4 1.4 16.8 1.2 3.0 3.1
Sacramento Tahoe 60.3 6.6 17.7 0.7 12.0 2.7Central Sierra 79.0 2.1 11.8 2.9 1.9 2.2Bay Area 47.0 6.6 21.1 0.3 22.6 2.4San Joaquin Valley 41.5 5.0 43.6 0.7 7.2 1.9Central Coast 52.6 2.3 36.6 0.5 6.0 2.1Inland Empire 40.6 7.4 43.0 0.5 6.5 2.0Los Angeles 29.9 8.6 45.4 0.3 14.2 1.6Orange County 47.2 1.8 31.6 0.3 17.5 1.6San Diego Imperial 51.3 4.8 30.5 0.6 10.8 2.1Statewide 43.7 6.1 34.3 0.5 13.4 2.0
Source: US Census Bureau, 2006-08 American Community Survey, Public Use Microdata Samples
www.californiacompetes.org
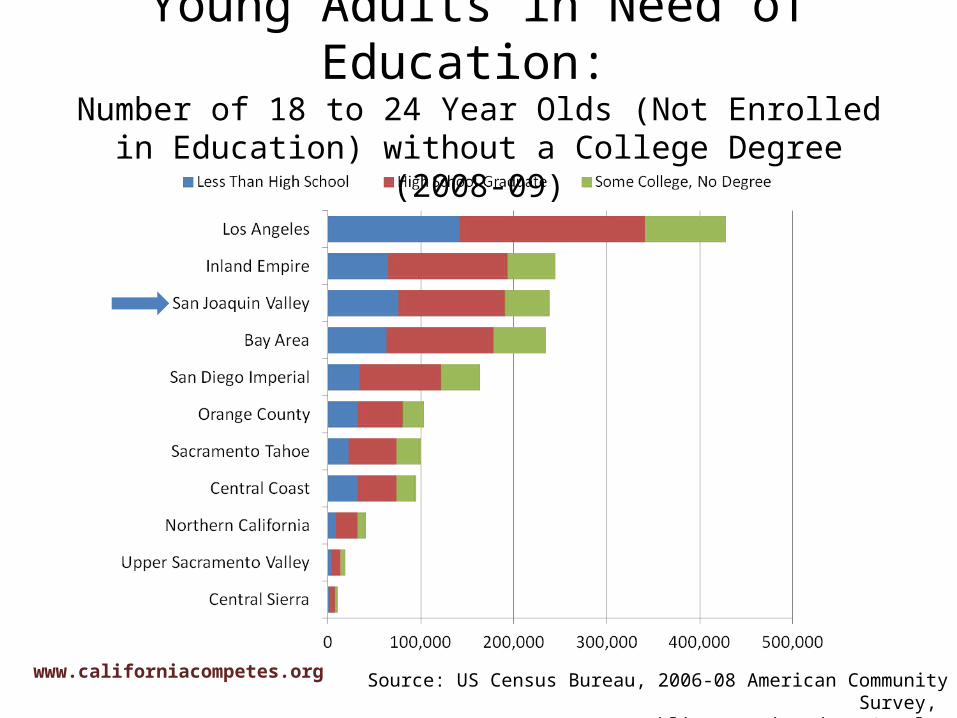
Young Adults in Need of Education: Number of 18 to 24 Year Olds (Not Enrolled in Education)
without a College Degree (2008-09)
Source: US Census Bureau, 2006-08 American Community Survey, Public Use Microdata Samples
www.californiacompetes.org
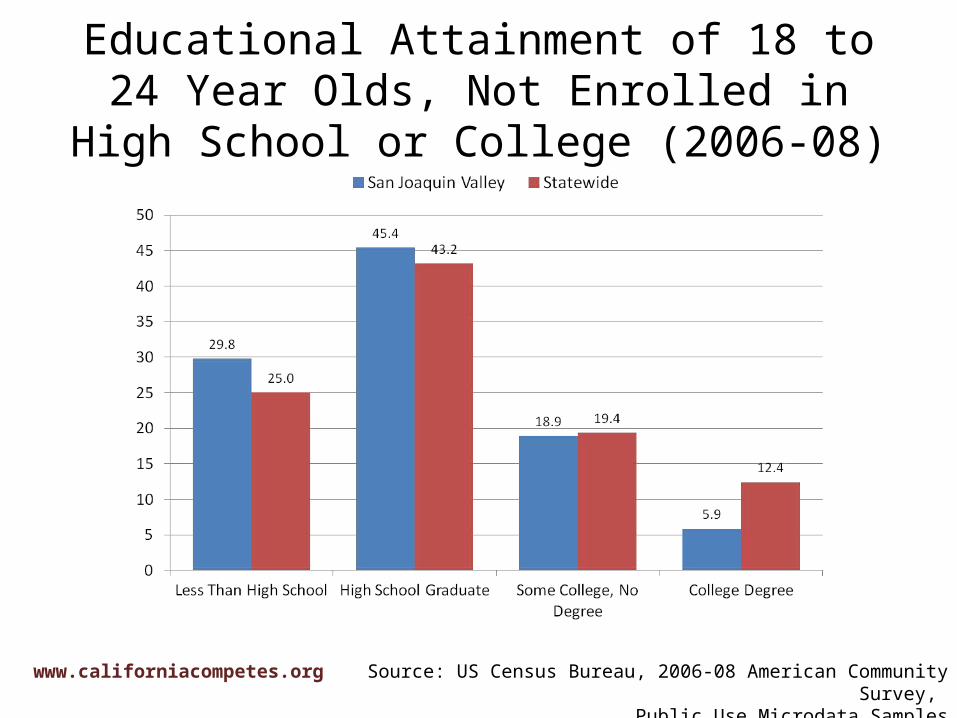
Educational Attainment of 18 to 24 Year Olds, Not Enrolled in High School or College (2006-08)
Source: US Census Bureau, 2006-08 American Community Survey, Public Use Microdata Samples
www.californiacompetes.org
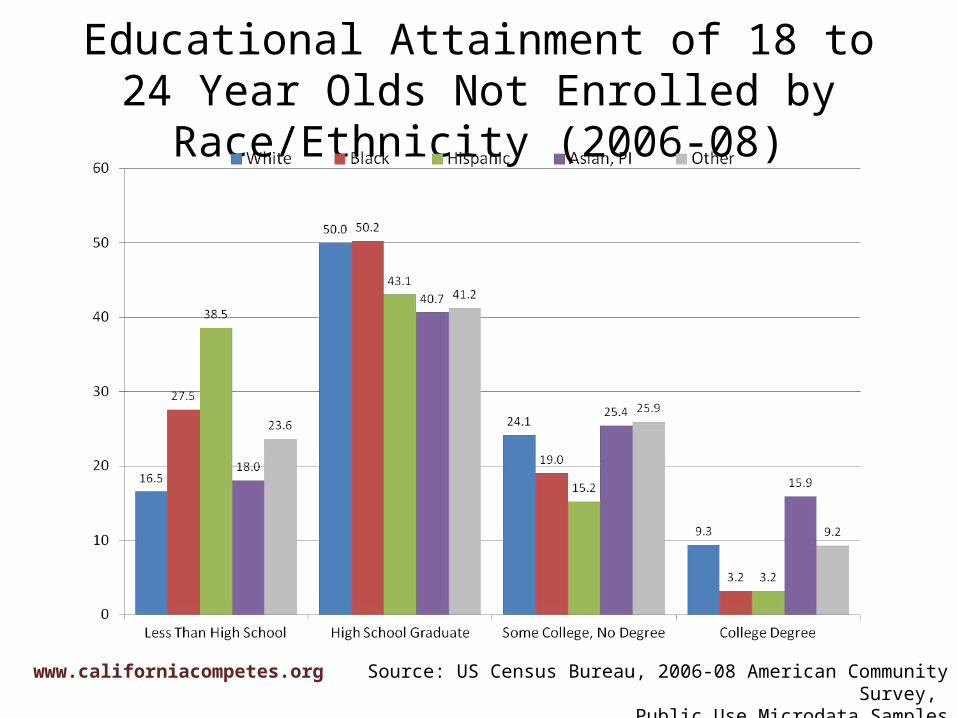
Educational Attainment of 18 to 24 Year Olds Not Enrolled by Race/Ethnicity (2006-08)
Source: US Census Bureau, 2006-08 American Community Survey, Public Use Microdata Samples
www.californiacompetes.org
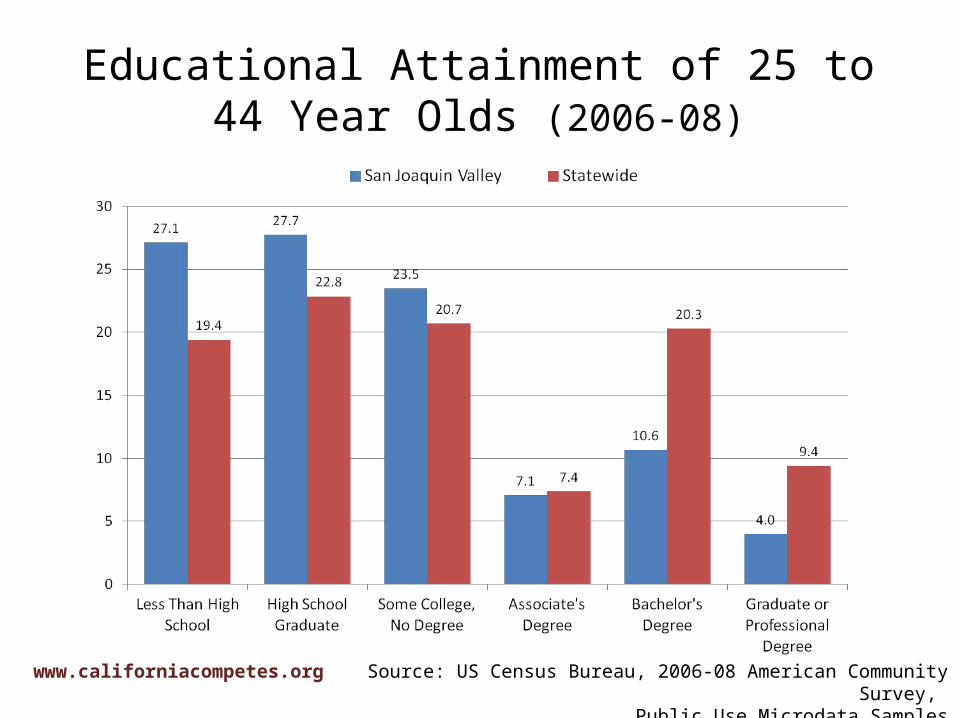
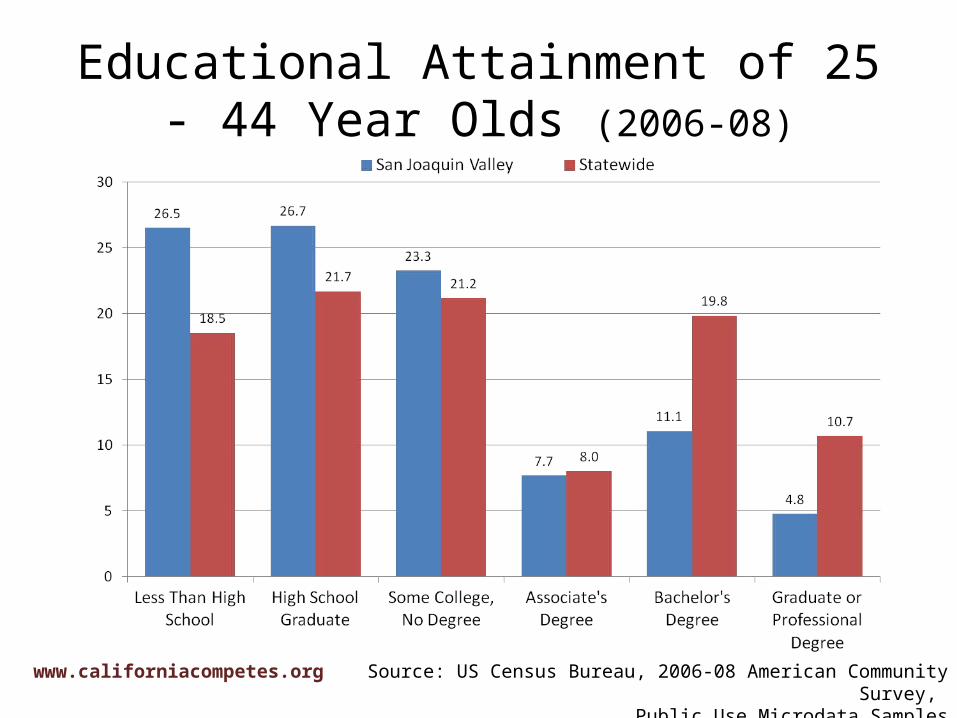
Educational Attainment of 25 to 44 Year Olds (2006-08)
Source: US Census Bureau, 2006-08 American Community Survey, Public Use Microdata Samples
www.californiacompetes.org
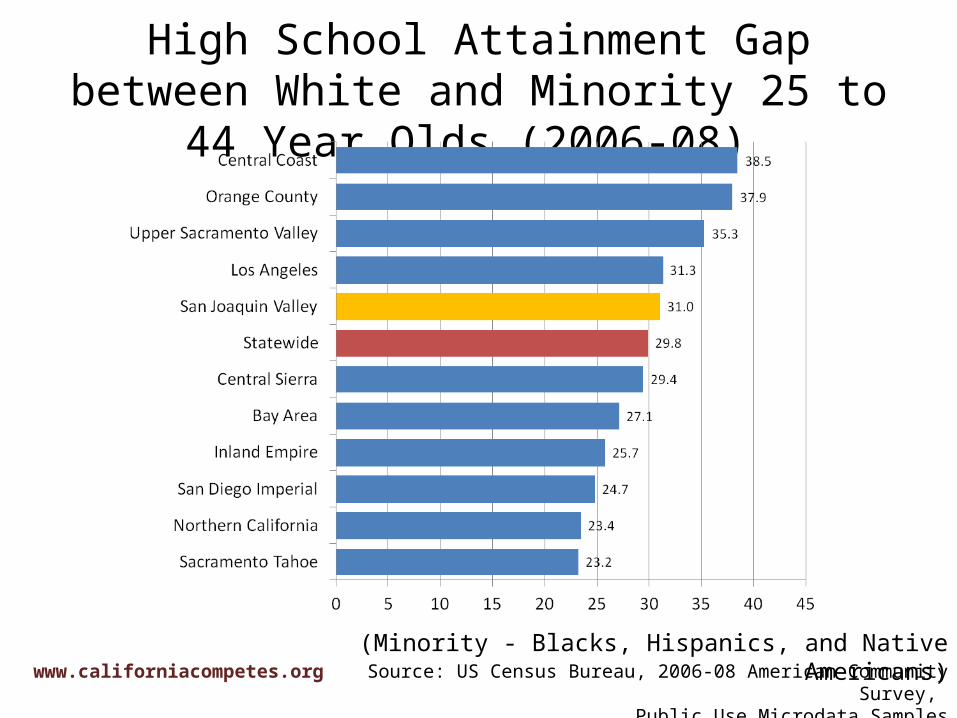
High School Attainment Gap between White and Minority 25 to 44 Year Olds (2006-08)
Source: US Census Bureau, 2006-08 American Community Survey, Public Use Microdata Samples
(Minority - Blacks, Hispanics, and Native Americans)www.californiacompetes.org
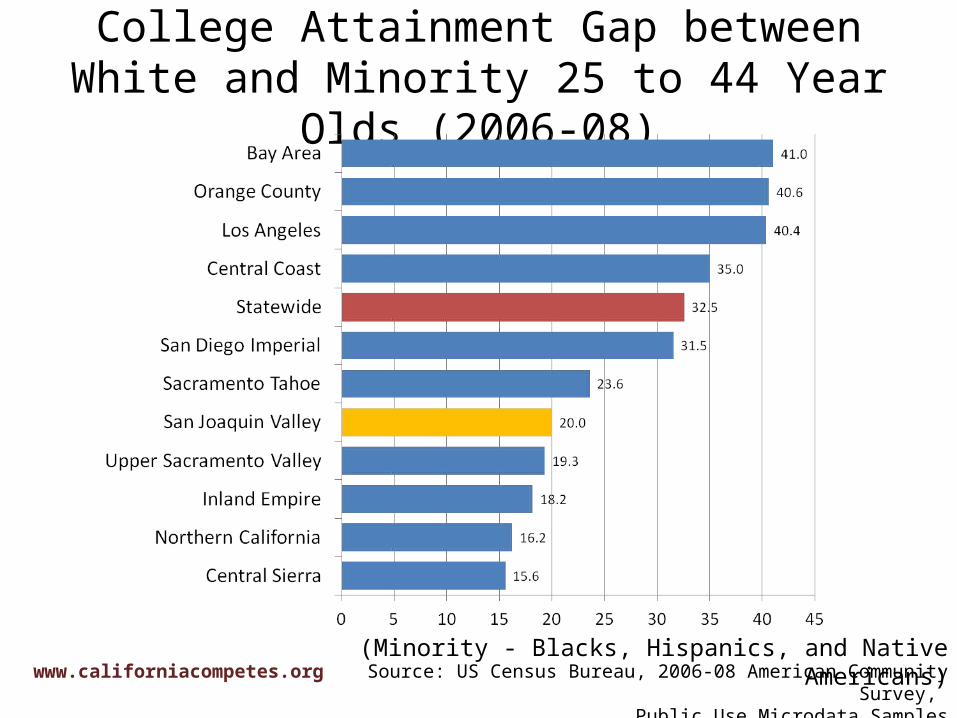
College Attainment Gap between White and Minority 25 to 44 Year Olds (2006-08)
Source: US Census Bureau, 2006-08 American Community Survey, Public Use Microdata Samples
(Minority - Blacks, Hispanics, and Native Americans)www.californiacompetes.org
Educational Attainment of 25 - 44 Year Olds (2006-08)
Source: US Census Bureau, 2006-08 American Community Survey, Public Use Microdata Samples
www.californiacompetes.org
Employment and Earnings
www.californiacompetes.org
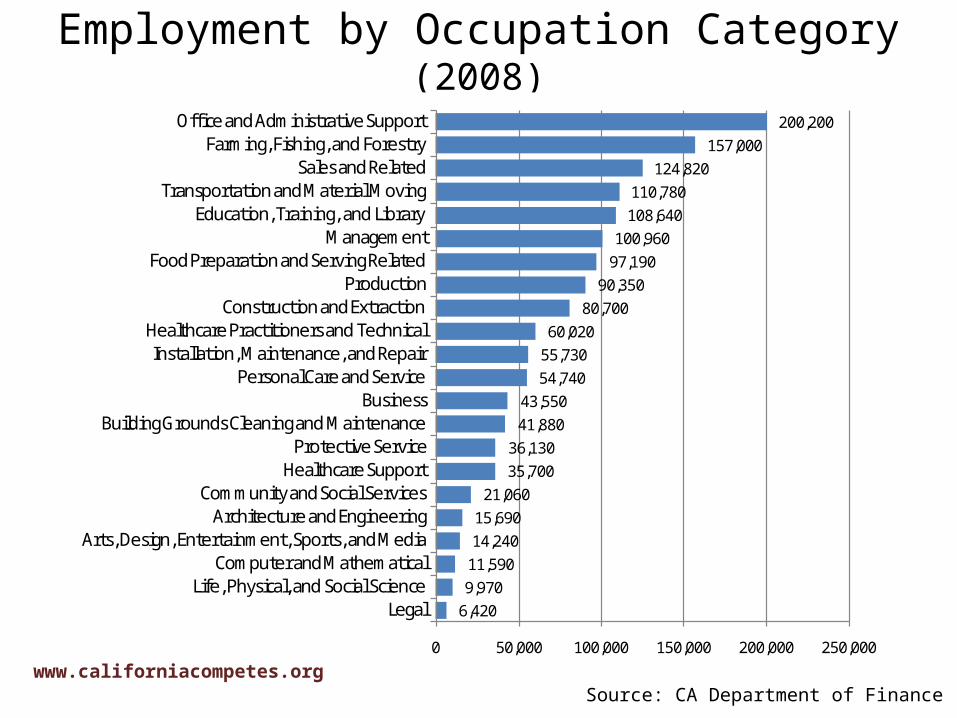
Employment by Occupation Category (2008)
Source: CA Department of Finance
6,420 9,970 11,590 14,240 15,690
21,060 35,700 36,130
41,880 43,550
54,740 55,730 60,020
80,700 90,350
97,190 100,960
108,640 110,780
124,820 157,000
200,200
0 50,000 100,000 150,000 200,000 250,000
LegalLife, Physical, and Social Science
Computer and MathematicalArts, Design, Entertainment, Sports, and Media
Architecture and EngineeringCommunity and Social Services
Healthcare SupportProtective Service
Building Grounds Cleaning and MaintenanceBusiness
Personal Care and ServiceInstallation, Maintenance, and Repair
Healthcare Practitioners and TechnicalConstruction and Extraction
ProductionFood Preparation and Serving Related
ManagementEducation, Training, and Library
Transportation and Material MovingSales and Related
Farming, Fishing, and ForestryOffice and Administrative Support
www.californiacompetes.org
Percent Employment by Occupation Category (2008)
Source: CA Department of Finance
7.56.1
3.85.5
10.613.6
8.43.7
2.86.6
2.42.4
4.11.0
7.40.4
1.40.7
1.10.8
2.96.8
5.95.7
3.25.0
1.916.0
10.14.5
3.27.6
2.22.2
4.02.5
6.10.9
1.31.2
2.02.6
4.96.9
0 5 10 15 20
Transportation and Material MovingProduction
Installation, Maintenance, and RepairConstruction and Extraction
Farming, Fishing, and ForestryOffice and Administrative Support
Sales and RelatedPersonal Care and Service
Building Grounds Cleaning and …Food Preparation and Serving Related
Protective ServiceHealthcare Support
Healthcare Practitioners and TechnicalArts, Design, Entertainment, Sports, …
Education, Training, and LibraryLegal
Community and Social ServicesLife, Physical, and Social Science
Architecture and EngineeringComputer and Mathematical
BusinessManagement
California
San Joaquin Valley
www.californiacompetes.org
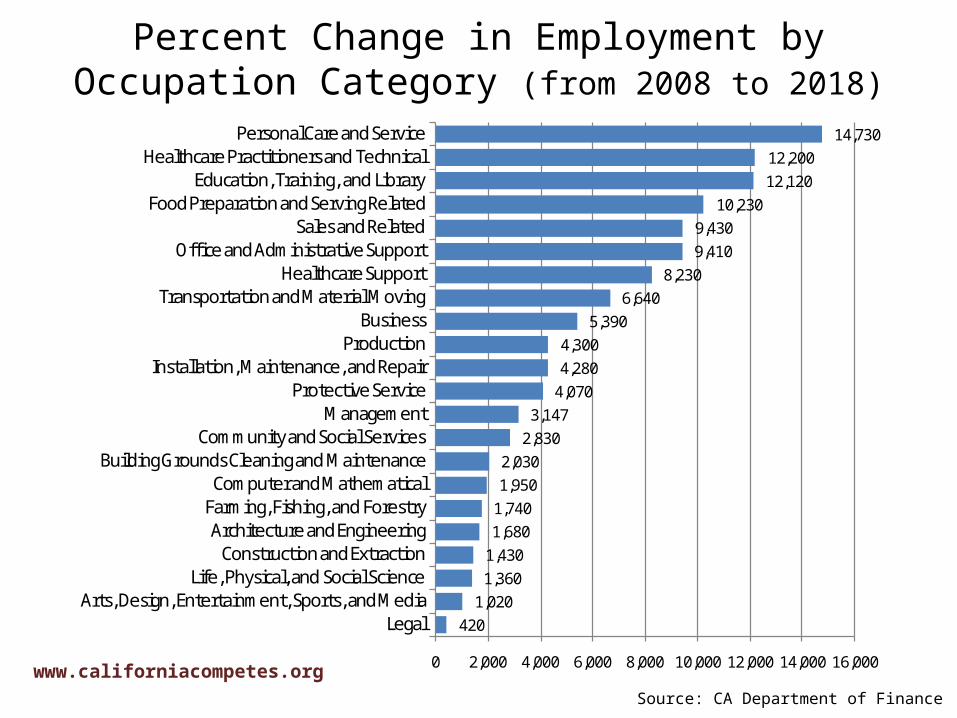
Percent Change in Employment by Occupation Category (from 2008 to 2018)
420 1,020
1,360 1,430 1,680 1,740 1,950 2,030
2,830 3,147
4,070 4,280 4,300
5,390 6,640
8,230 9,410 9,430
10,230 12,120 12,200
14,730
0 2,000 4,000 6,000 8,000 10,000 12,000 14,000 16,000
LegalArts, Design, Entertainment, Sports, and Media
Life, Physical, and Social ScienceConstruction and Extraction
Architecture and EngineeringFarming, Fishing, and ForestryComputer and Mathematical
Building Grounds Cleaning and MaintenanceCommunity and Social Services
ManagementProtective Service
Installation, Maintenance, and RepairProduction
BusinessTransportation and Material Moving
Healthcare SupportOffice and Administrative Support
Sales and RelatedFood Preparation and Serving Related
Education, Training, and LibraryHealthcare Practitioners and Technical
Personal Care and Service
Source: CA Department of Finance
www.californiacompetes.org
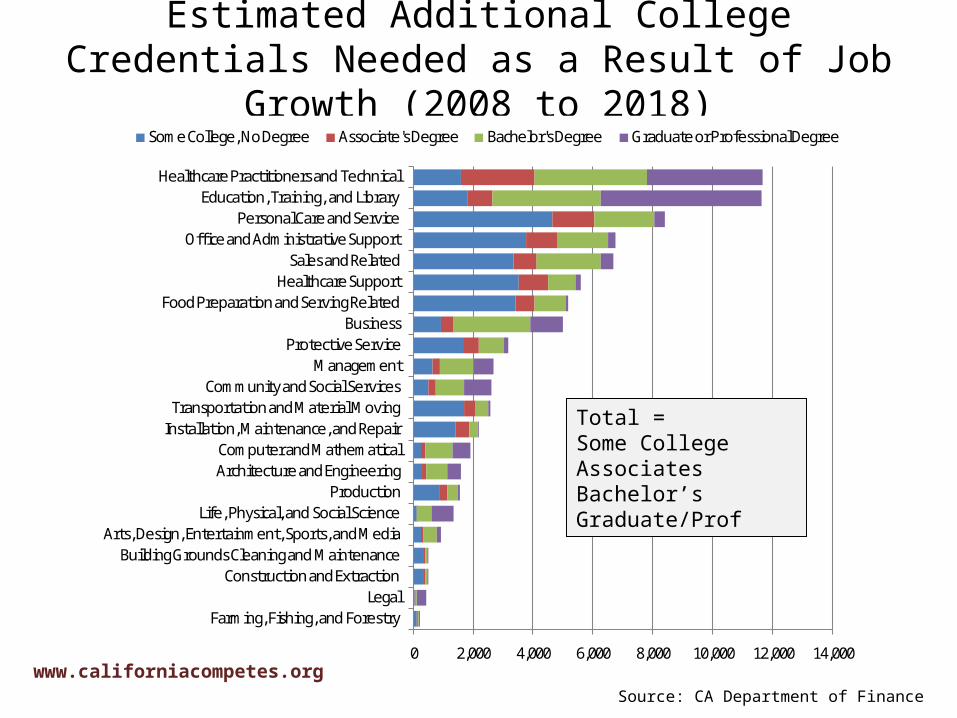
Estimated Additional College Credentials Needed as a Result of Job Growth (2008 to 2018)
Source: CA Department of Finance
0 2,000 4,000 6,000 8,000 10,000 12,000 14,000
Farming, Fishing, and ForestryLegal
Construction and ExtractionBuilding Grounds Cleaning and Maintenance
Arts, Design, Entertainment, Sports, and MediaLife, Physical, and Social Science
ProductionArchitecture and EngineeringComputer and Mathematical
Installation, Maintenance, and RepairTransportation and Material Moving
Community and Social ServicesManagement
Protective ServiceBusiness
Food Preparation and Serving RelatedHealthcare Support
Sales and RelatedOffice and Administrative Support
Personal Care and ServiceEducation, Training, and Library
Healthcare Practitioners and Technical
Some College, No Degree Associate's Degree Bachelor's Degree Graduate or Professional Degree
Total = Some CollegeAssociatesBachelor’sGraduate/Prof
www.californiacompetes.org
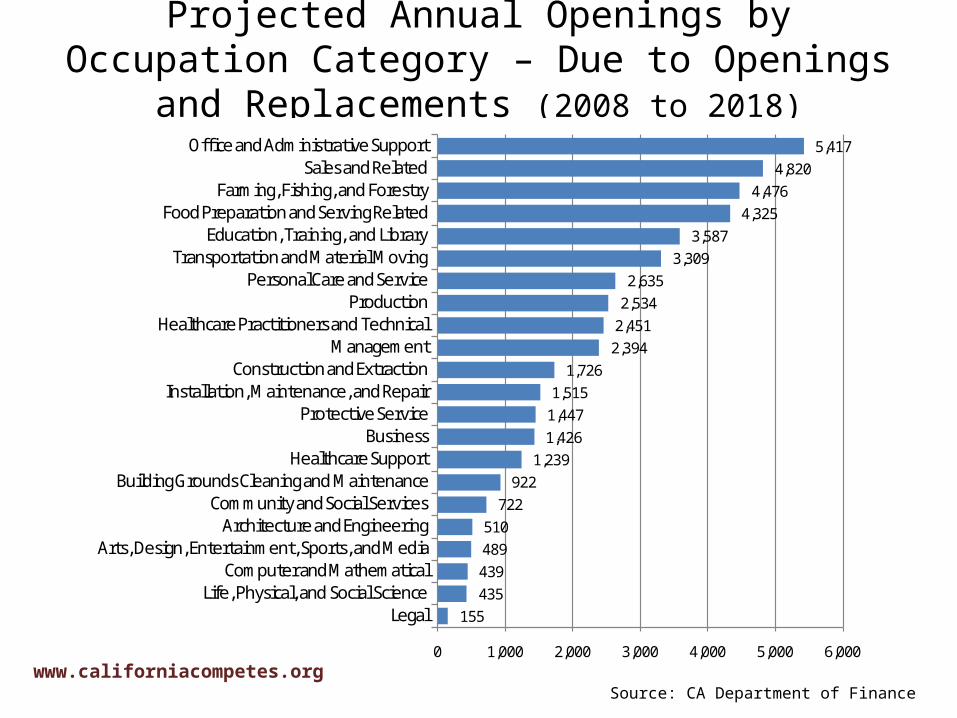
Projected Annual Openings by Occupation Category – Due to Openings and Replacements (2008 to 2018)
Source: CA Department of Finance
155 435 439 489 510
722 922
1,239 1,426 1,447 1,515
1,726 2,394 2,451 2,534 2,635
3,309 3,587
4,325 4,476
4,820 5,417
0 1,000 2,000 3,000 4,000 5,000 6,000
LegalLife, Physical, and Social Science
Computer and MathematicalArts, Design, Entertainment, Sports, and Media
Architecture and EngineeringCommunity and Social Services
Building Grounds Cleaning and MaintenanceHealthcare Support
BusinessProtective Service
Installation, Maintenance, and RepairConstruction and Extraction
ManagementHealthcare Practitioners and Technical
ProductionPersonal Care and Service
Transportation and Material MovingEducation, Training, and Library
Food Preparation and Serving RelatedFarming, Fishing, and Forestry
Sales and RelatedOffice and Administrative Support
www.californiacompetes.org
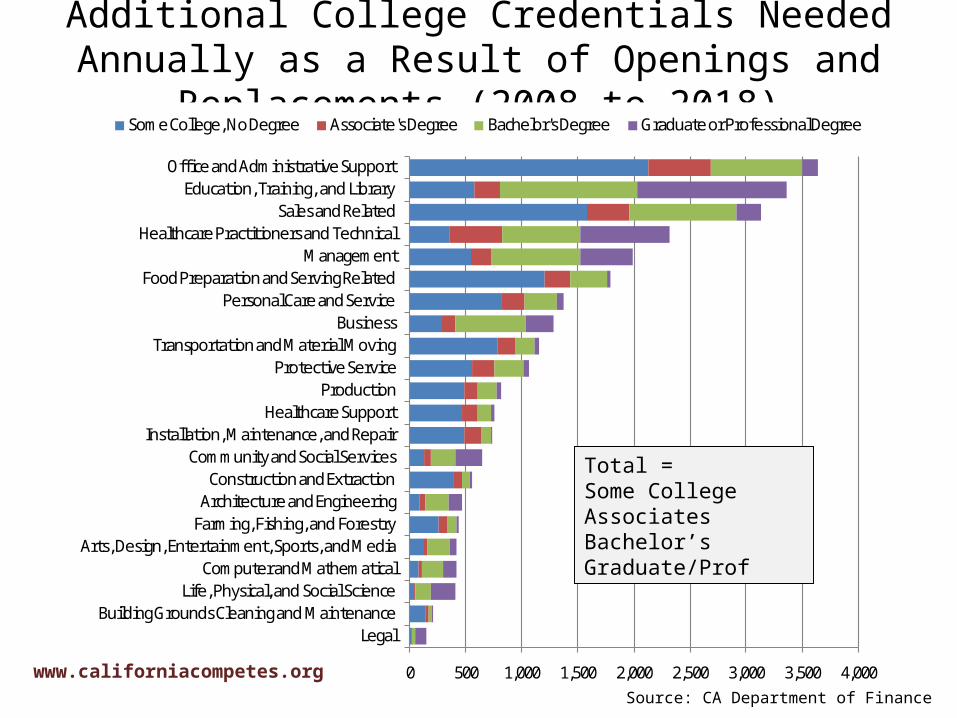
Additional College Credentials Needed Annually as a Result of Openings and Replacements (2008 to 2018)
0 500 1,000 1,500 2,000 2,500 3,000 3,500 4,000
LegalBuilding Grounds Cleaning and Maintenance
Life, Physical, and Social ScienceComputer and Mathematical
Arts, Design, Entertainment, Sports, and MediaFarming, Fishing, and ForestryArchitecture and Engineering
Construction and ExtractionCommunity and Social Services
Installation, Maintenance, and RepairHealthcare Support
ProductionProtective Service
Transportation and Material MovingBusiness
Personal Care and ServiceFood Preparation and Serving Related
ManagementHealthcare Practitioners and Technical
Sales and RelatedEducation, Training, and Library
Office and Administrative Support
Some College, No Degree Associate's Degree Bachelor's Degree Graduate or Professional Degree
Source: CA Department of Finance
Total = Some CollegeAssociatesBachelor’sGraduate/Prof
www.californiacompetes.org
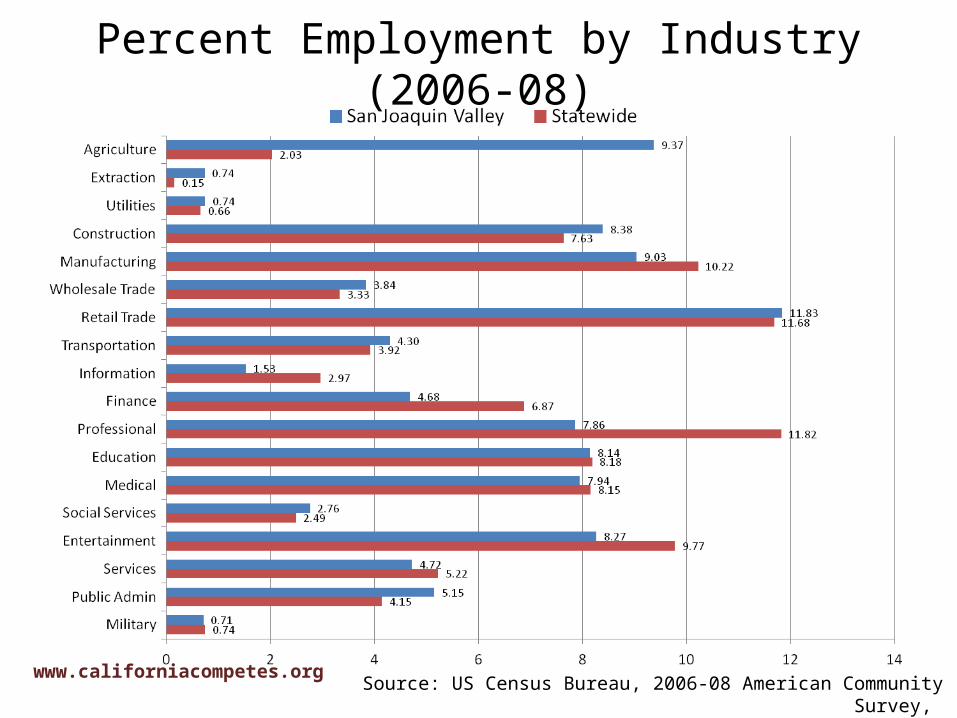
Percent Employment by Industry (2006-08)
Source: US Census Bureau, 2006-08 American Community Survey, Public Use Microdata Samples
www.californiacompetes.org
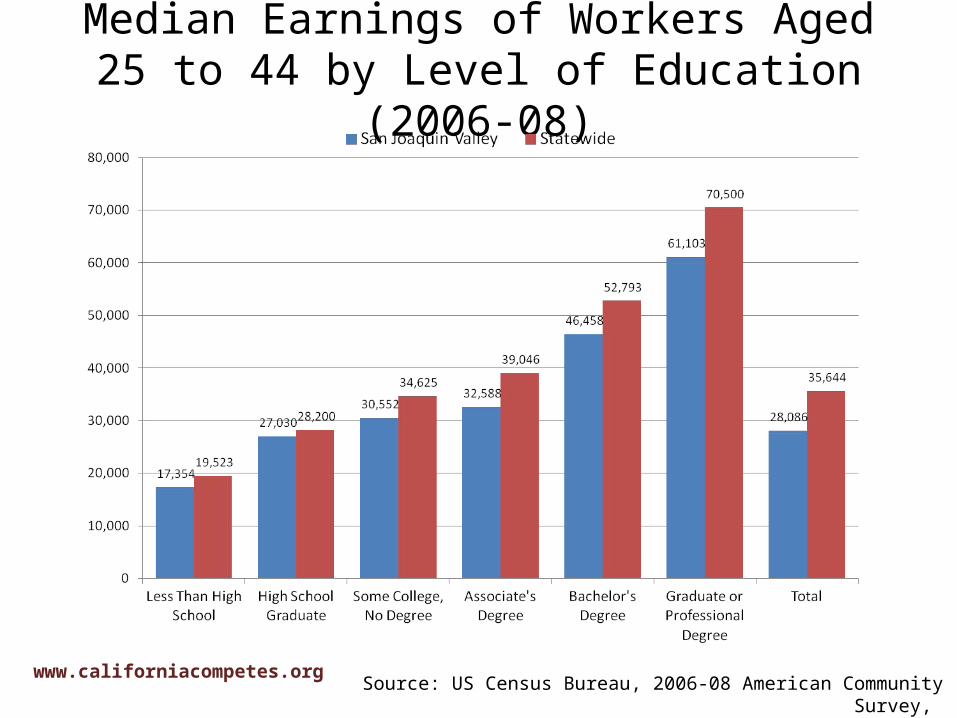
Median Earnings of Workers Aged 25 to 44 by Level of Education (2006-08)
Source: US Census Bureau, 2006-08 American Community Survey, Public Use Microdata Samples
www.californiacompetes.org

The Education Pipeline
www.californiacompetes.org
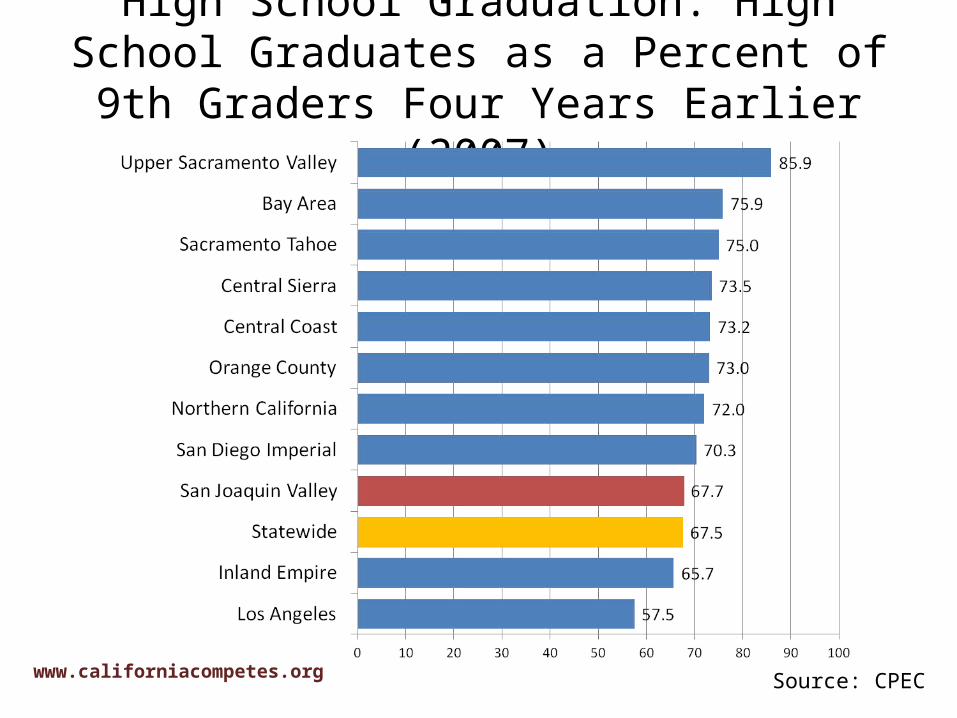
High School Graduation: High School Graduates as a Percent of 9th Graders Four Years Earlier (2007)
Source: CPECwww.californiacompetes.org
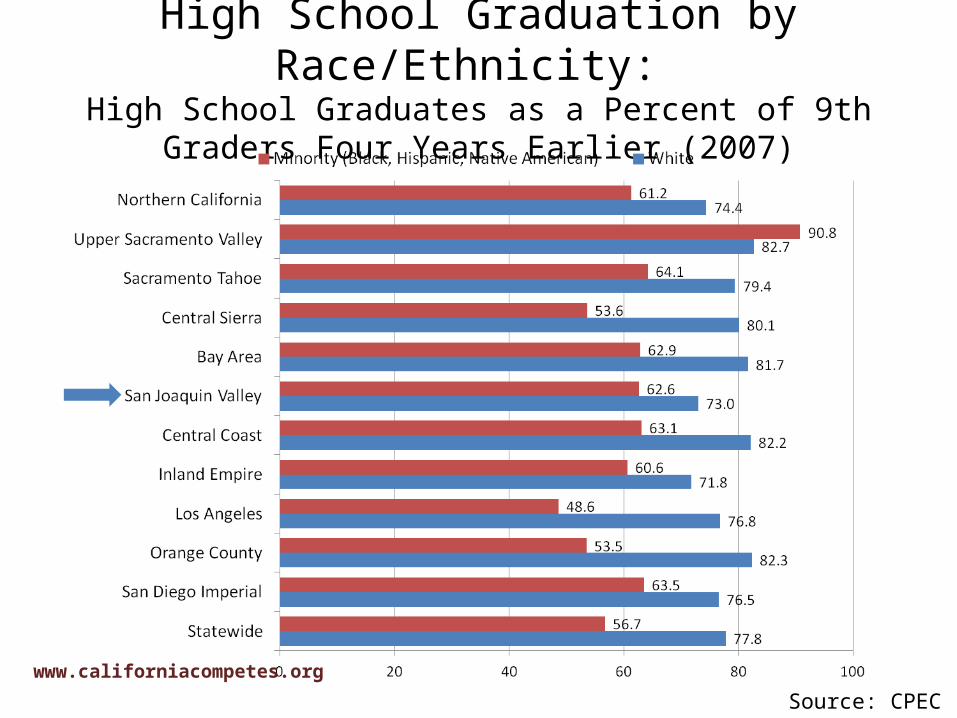
High School Graduation by Race/Ethnicity: High School Graduates as a Percent of 9th Graders Four Years Earlier
(2007)
Source: CPECwww.californiacompetes.org
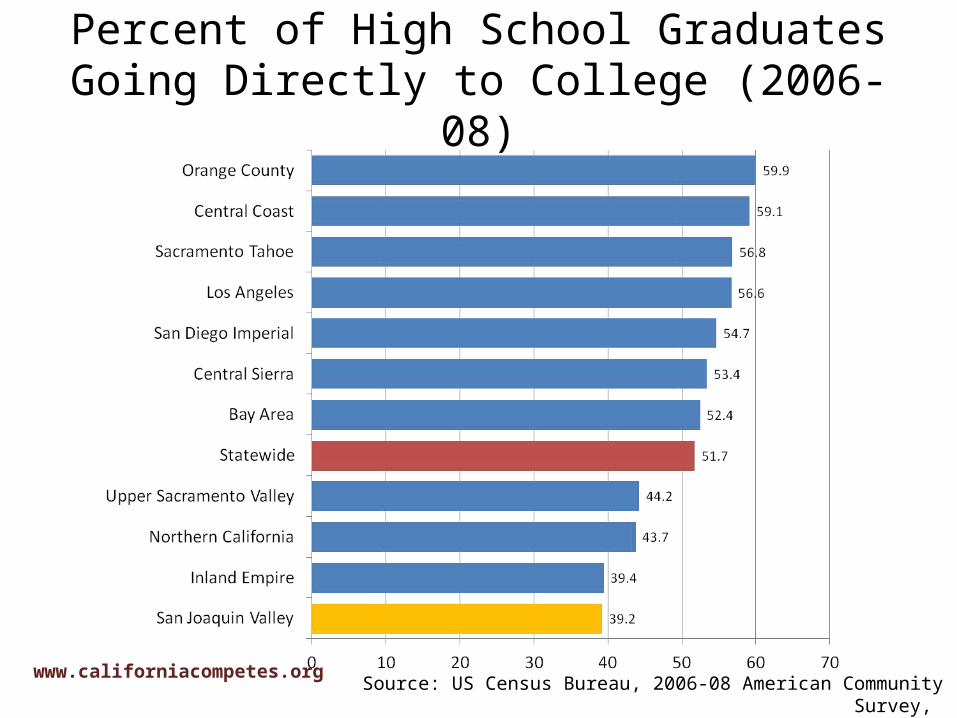
Percent of High School Graduates Going Directly to College (2006-08)
Source: US Census Bureau, 2006-08 American Community Survey, Public Use Microdata Samples
www.californiacompetes.org
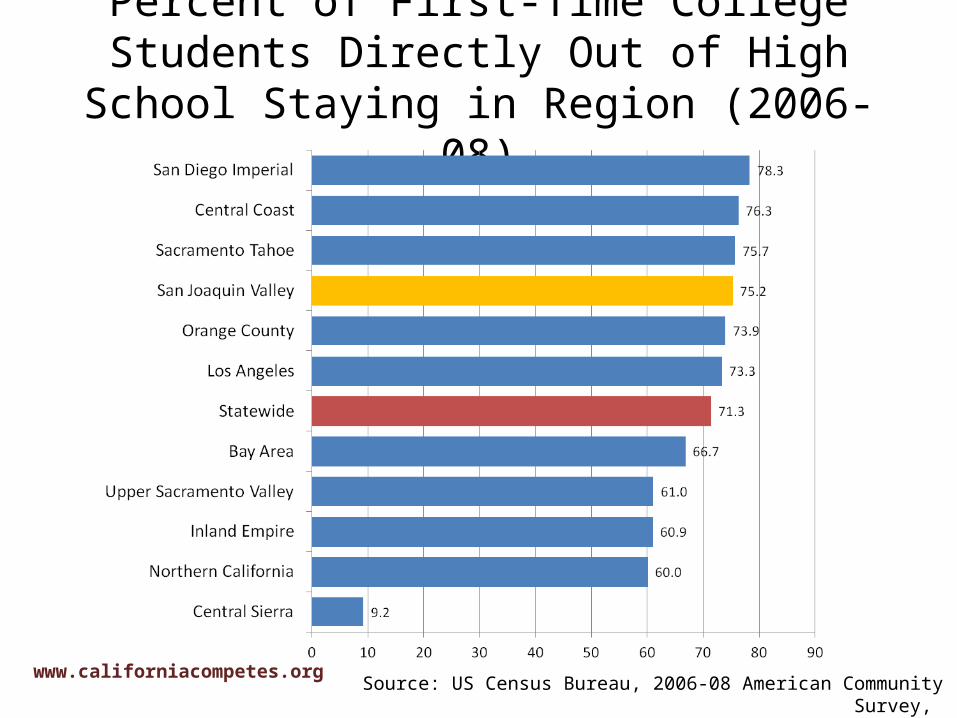
Percent of First-Time College Students Directly Out of High School Staying in Region (2006-08)
Source: US Census Bureau, 2006-08 American Community Survey, Public Use Microdata Samples
www.californiacompetes.org
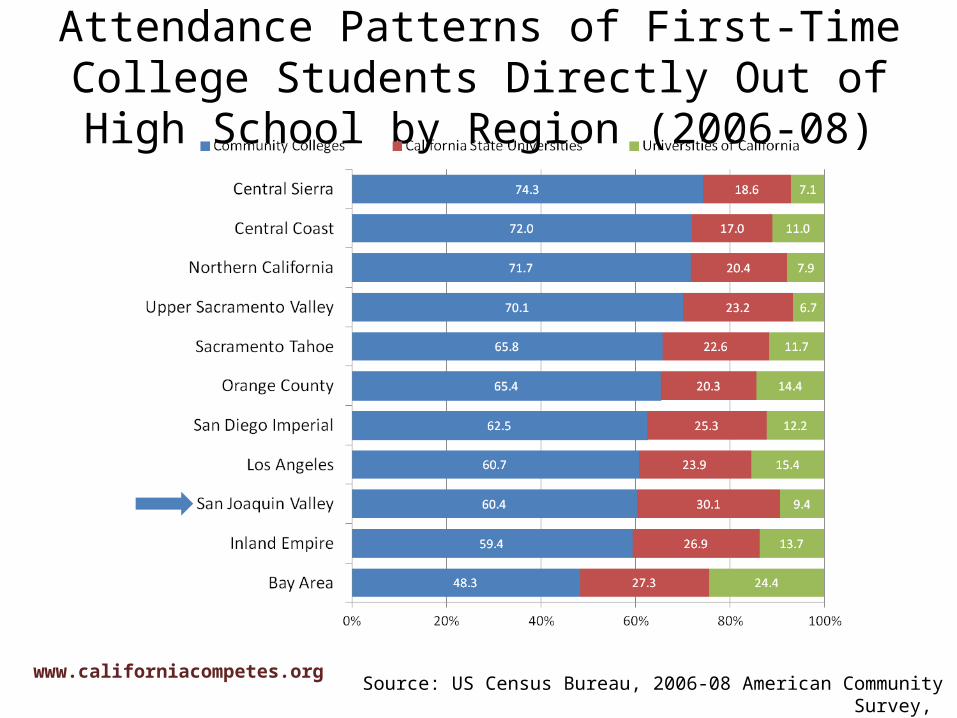
Attendance Patterns of First-Time College Students Directly Out of High School by Region (2006-08)
Source: US Census Bureau, 2006-08 American Community Survey, Public Use Microdata Samples
www.californiacompetes.org
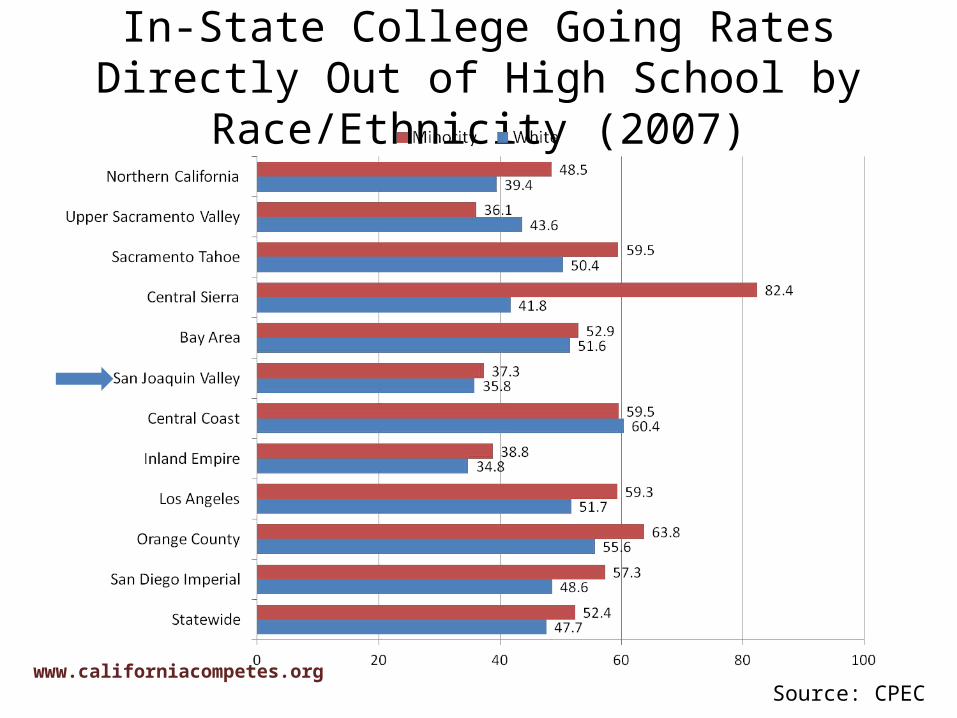
In-State College Going Rates Directly Out of High School by Race/Ethnicity (2007)
Source: CPECwww.californiacompetes.org