california annual specific yield paul gipe & assoc
TRANSCRIPT

California Annual Specific Yield
Paul Gipe & Assoc.
86 87 88 89 90 91 92 93 94 95 96 97 98 99 '00 '01 '02 '03
Year
0
200
400
600
800
1,000
1,200
1,400Annual Specific Yield (kWh/m2/yr)
Cal. Avg.
San Gorgonio Farms

North American Mid-Continent Wind Sites
Paul Gipe & Assoc.
SiteSize
DiameterAvg. Speed
m/sAEO
mil/kWh/yrAvg. Yield kWh/m2/yr
Traverse City 44 m 6.5 1.1 725
Ontario 43 m 6.3 1.2 825
Adair, IA 27 m 6.1 0.475 825
Buffalo Ridge 33 m 7 0.775 850
Sibley, IA 44 m 6.9 1.6 1000

North American Mid-Continent Wind Sites
Paul Gipe & Assoc.
Site Size Diameter Hub HeightAEO
mil/kWh/yrAvg. Yield kWh/m2/yr
Woodstock, MN 44 m 60 m 1.7 1050
Zond, MN 50 m 60 m 2.4 1200
Byron, WI 47 m 65 m 0.7 850
Lakota, MN 48 m 56 m 2 1100

Tararua New Zealand Yields
Tararua Wind Plant New Zealand Specific YieldsVestas V47
Specific YieldSwept AreaDiameterApproximatekWh/m2/yrm2mkWh/yr
8008401,735471,457,901Low1,5001,4401,735472,500,000Median1,8001,7601,735473,050,622High
WindStats, Spring 2005, Vol. 18, No. 2, pg 13.
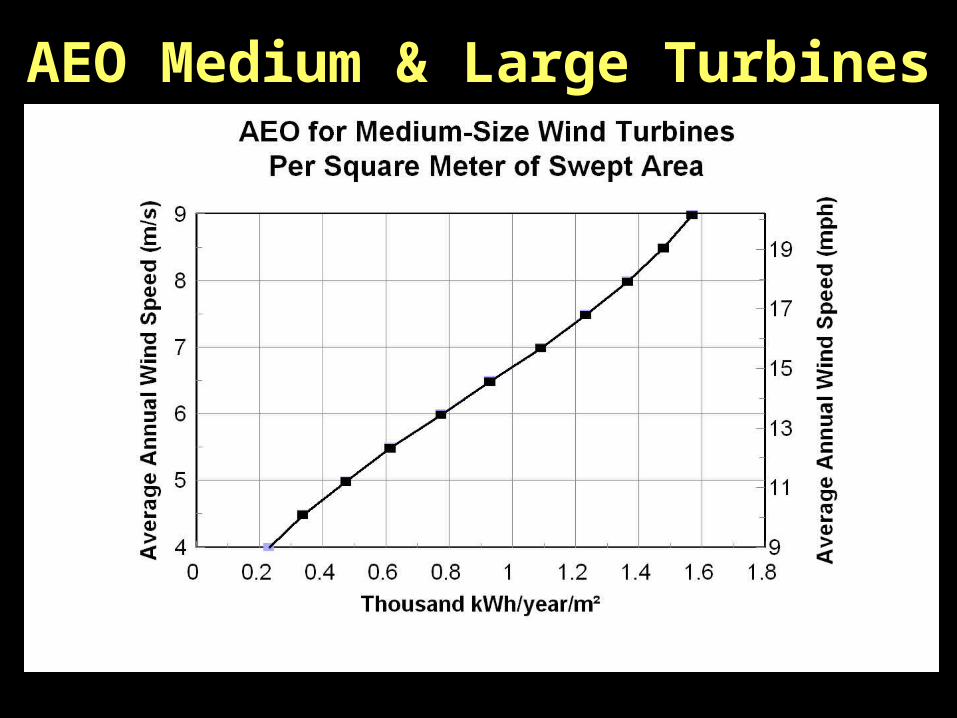
AEO Medium & Large Turbines

Estimating AEOSwept Area Method for 7 m/s*
Paul Gipe & Assoc. *At Hub Height
TurbineSwept Area
(m2) Yield
(kWh/m2/yr)AEO
(kWh/yr)
36 m; .5 MW 1,000 1,000 1,000,000
50 m; .75 MW 2,000 1,000 2,000,000
62 m; 1 MW 3,000 1,000 3,000,000
80 m; 2 MW 5,000 1,000 5,000,000
Sample Power Curve CalculationPower Curve
Paul Gipe & Assoc.
8 10 12 14 16 18 20 22 24 26 28 30 32 34 36 38 40
Wind Speed (mph)
00.10.20.30.40.50.60.70.80.9
11.11.2
Kilowatts

Sample Power Curve CalculationSpeed Distribution
Paul Gipe & Assoc.
8 10 12 14 16 18 20 22 24 26 28 30 32 34 36 38 40
Wind Speed (mph)
0
100
200
300
400
500
600Hours per Year

Sample Power Curve CalculationAnnual Energy Production
Paul Gipe & Assoc.
8 10 12 14 16 18 20 22 24 26 28 30 32 34 36 38 40
Wind Speed (mph)
0
20
40
60
80
100kWh/year

0
200
400
600
800
1000
1200
Watt
s
0 5 10 15 20 25 30 35 40
Wind Speed (mph)
Total Power and Power to Batteries
29,2
Gross Power
Power Delivered
Note: BWC 850, nominal 24 VDC,150 ft, #8 AWG Cu
Paul Gipe & Assoc.

Net Generation from Wind Plants
Paul Gipe & Assoc.
Net
Availability 98%
Electrical 97%
Array Interference 90%-95%
Total 86%-90%
Wind Energy Software• Spreadsheets
Integrated (Tom Wind)
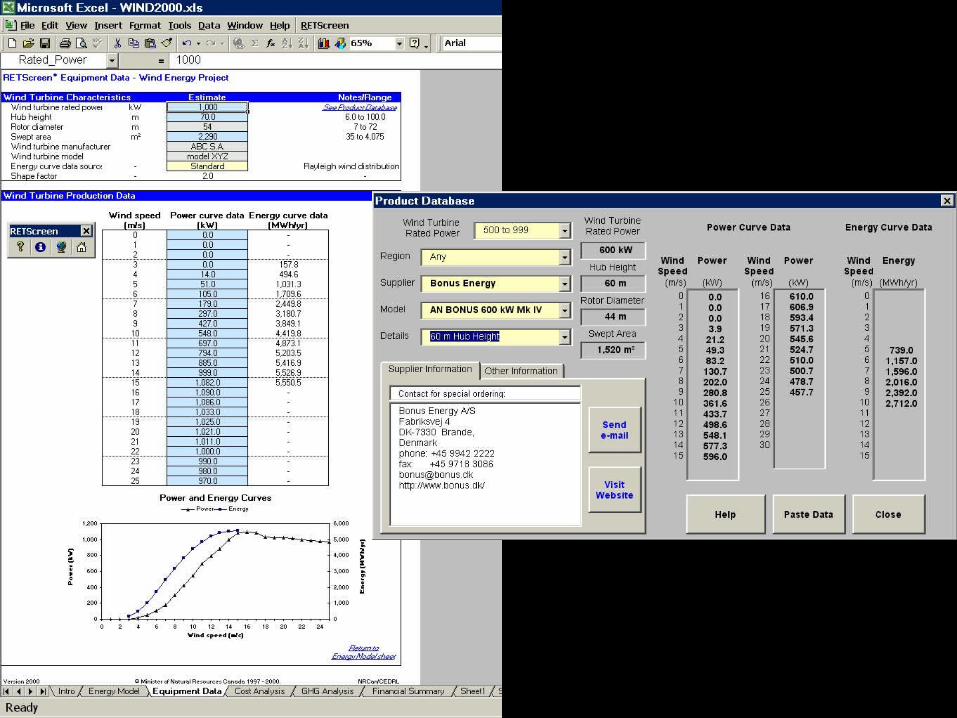
Fully Integrated (RETScreen)
• Wind Farm Design ToolsWAsP (Risø)
WindFarm (ReSoft)
WindFarmer (Garrad Hassan)
WindPro (EMD)
WindMap (Brower)
Paul Gipe & Assoc.


Paul Gipe & Assoc.Paul Gipe & Assoc.
Wind Turbine StandardsSmall Turbines
Caveat Emptor (Buyer Beware)You Get What You Pay For
Big TurbinesMinimum Design Stds. (GL)Power Curve Field TestsWarranteed Power CurvesPerformance GuaranteesField Experience Best Guide
Sources of Information
Paul Gipe & Assoc.
• Trade Magazines
• European Wind Reports
• German Market Survey
• Books
• Web Sites
• Workshops

Trade Magazines
Paul Gipe & Assoc.
• Windpower Monthly• WindStats• WinDirections• RE World• New Energy• Neue Energie• North American Windpower• Systèmes Solaires
Paul Gipe & Assoc.
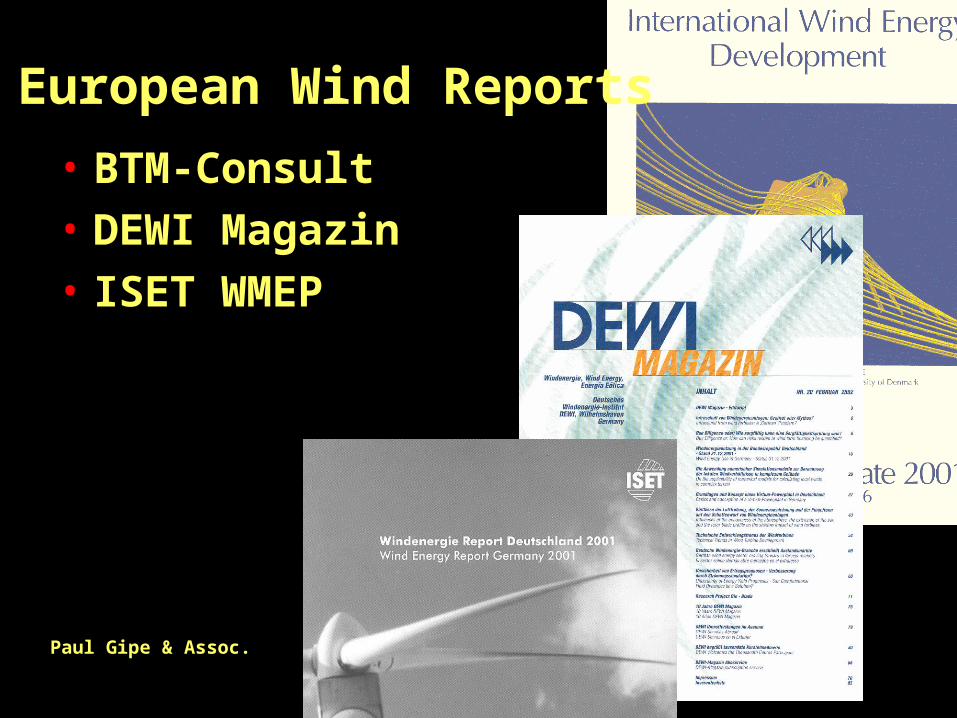
• BTM-Consult
• DEWI Magazin
• ISET WMEP
European Wind Reports

Paul Gipe & Assoc.
Book &
CD-Rom
Paul Gipe & Assoc.
German Market Survey

• Power Curves
• Noise
• Power Factor
• Flicker
Paul Gipe & Assoc.
Measured Performance Data

Pricing
• Model
• Tower
• Transformer
• €/kWh/annum
• €/m2
Paul Gipe & Assoc.

Books by Paul Gipe
2004

New Wind Books
Paul Gipe & Assoc.
2002 20012002
2005

WWW Sites
Paul Gipe & Assoc.
• www.windpower.dkDanish Manufacturers
• www.eole.org/ en français
• www.wind-energie.de BWE, German Wind Turbine Owners
• wind-works.org Archive of Articles by Paul Gipe

Don’t Be Afraid of Foreign Language Web Sites

Suivi-Eolien France

Suivi-Eolien France
Freyssenet E44Specific YieldSwept AreaDiameterkWh/m2/yrm2mkWh/yr
1,2701,521441,924,5352004

Case Studies
Paul Gipe & Assoc.

Distributed (Self) Generation Schafer Systems: Taking a Gamble
• Adair, Iowa, 1995
• V27, 225 kW, 480 VAC
• 5.8 m/s Site
• ~$300,000
• 500,000 kWh/yr
• Net Metering
• 75% of Load

Schafer Systems
• No Tax Credit• $3,000/yr Insurance
(2X projected)
• 8 yr. Payback• Abuts I-80 R-o-W• Rezoned for Height• Ice Throw to Roof• Lightning

Case Study-Altamont Pass
Paul Gipe & Assoc.
• Peak Development 81-88• ~5,000 Turbines• ~550 MW (Capped)• ~1 TWh/yr• Early Turbines ~20 Years Old
Aging
High Maintenance
• Slated for “Repowering” Since 1998!

Case Study-Altamont Pass
Paul Gipe & Assoc.
• ~$2 Billion Invested• Birds Remain an Issue• Good Match w/ Load• Peak Winds Summer Evenings
When Convective Heating Greatest
• USW/Kenetech Dominated• Yields Good on Later Turbines
650-850 kWh/m2/yr
