calenviroscreen data update for the border region · pdf filecalenviroscreen . data update for...
TRANSCRIPT
CalEnviroScreen Data Update for the Border Region
Edmund G. Brown Jr. Governor
Matthew Rodriquez Secretary, California Environmental Protection Agency
Lauren Zeise, PhD Director, Office of Environmental Health Hazard Assessment
A report to the Legislature on actions taken to account for pollution burdens in the California-Mexico border region
pursuant to Public Resources Code Section 71090
March 2017
Report to the Legislature: CalEnviroScreen Data Update for the Border Region
CalEPA Office of Environmental Health Hazard Assessment
Acknowledgements: We thank community organizations and residents for their continued engagement in improving CalEnviroScreen and we look forward to continued opportunities in refining CalEnviroScreen to better capture cross-border pollution impacts. We thank the following individuals for reviewing and providing edits to this report. Sam Delson, Office of Environmental Health Hazard Assessment John Faust, Office of Environmental Health Hazard Assessment Allan Hirsch, Office of Environmental Health Hazard Assessment Julian Leichty, Office of Environmental Health Hazard Assessment Arsenio Mataka, California Environmental Protection Agency David Siegel, Office of Environmental Health Hazard Assessment Lauren Zeise, Office of Environmental Health Hazard Assessment We thank the following individuals for contributing to data gathering and analysis for this report. Laura August, Office of Environmental Health Hazard Assessment Jeff Austin, California Air Resources Board Álvaro Alvarado, California Air Resources Board Mohan Balagopalan, South Coast Air Quality Management District Komal Bangia, Office of Environmental Health Hazard Assessment Wayne Davis, United States Environmental Protection Agency Stacey Ebiner, South Coast Air Quality Management District Monica Fernandez-Neild, South Coast Air Quality Management District Cynthia Garcia, California Air Resources Board Cynthia Gould, Abt Associates Don Nguyen, South Coast Air Quality Management District Luis Olmedo, Comite Civico Del Valle, Inc. Cathy Shirley, Office of Environmental Health Hazard Assessment Andrew Slocombe, Office of Environmental Health Hazard Assessment Walker Wieland, Office of Environmental Health Hazard Assessment San Diego Association of Governments Prepared by: Vanessa E. Galaviz Office of Environmental Health Hazard Assessment California Environmental Protection Agency
Report to the Legislature: CalEnviroScreen Data Update for the Border Region
CalEPA Office of Environmental Health Hazard Assessment
Contents
I Executive Summary ........................................................................................................ 1
II Overview of Assembly Bill 1059 Legislation ..................................................................... 4
III CalEnviroScreen .............................................................................................................. 5
IV California-Mexico Border Region ..................................................................................... 7
V Data Gathering and Analysis ........................................................................................... 9
PM2.5 (Fine Particulate Matter) .............................................................................................. 9
Diesel Particulate Matter ....................................................................................................... 14
Toxic Releases from Facilities ................................................................................................ 22
Traffic Density ........................................................................................................................ 25
VI Deficiencies in and Barriers to Accessing Data ............................................................... 30
PM2.5 (Fine Particulate Matter) ............................................................................................ 30
Diesel Particulate Matter ....................................................................................................... 30
Traffic Density ........................................................................................................................ 30
Toxic Releases from Facilities & Hazardous Waste Generators and Facilities ...................... 31
Drinking Water Contaminants ............................................................................................... 31
VII Current Data Gathering Efforts ...................................................................................... 32
San Ysidro Air Study ............................................................................................................... 32
Air Resources Board Solicitation ............................................................................................ 37
Report to the Legislature: CalEnviroScreen Data Update for the Border Region
CalEPA Office of Environmental Health Hazard Assessment
Figures
Figure 1. CalEnviroScreen 3.0 Pollution Burden and Population Characteristics Indicators ...... 5
Figure 2. CalEnviroScreen 3.0 Statewide Scores ...................................................................... 6
Figure 3. California-Mexico Border Region ............................................................................. 8
Figure 4. CalEnviroScreen 3.0 Results in the California-Mexico Border Region .......................... 9
Figure 5. Location of the PM2.5 Monitor in Calexico............................................................. 10
Figure 6. Location of the PM2.5 Monitors in San Ysidro and at the Richard J. Donovan Correctional Facility ...................................................................................................... 11
Figure 7. Location of the PM2.5 Monitors Along the California-Mexico Border ..................... 12
Figure 8. PM2.5 CalEnviroScreen 3.0 and 2.0 Results for San Ysidro ...................................... 13
Figure 9. PM2.5 CalEnviroScreen 3.0 and 2.0 Results for Calexico ......................................... 14
Figure 10. ‘Standard’ and ‘Fast’ Wait Times for Trucks at the Otay-Mesa Border Crossing ..... 16
Figure 11. Location of the Nitrogen Oxide Air Monitors Used to Estimate Ambient Diesel Particulate Matter Concentrations ................................................................................ 18
Figure 12. Comparison Between Estimated Ambient Diesel Particulate Matter (DPM) Concentrations and DPM Emission Estimates ................................................................ 19
Figure 13. Comparison Between Estimated Ambient Diesel Particulate Matter (DPM) Concentrations and DPM Emission Estimates, Excluding Outliers .................................. 20
Figure 14. CalEnviroScreen 3.0 and 2.0 Diesel Particulate Matter Indicator Results for San Ysidro ........................................................................................................................... 21
Figure 15. CalEnviroScreen 3.0 and 2.0 Diesel Particulate Matter Indicator Results for Calexico ........................................................................................................................ 22
Figure 16. CalEnviroScreen 3.0 Toxic Releases from Facilities Indicator Results for the California-Mexico Border Region ................................................................................... 25
Figure 17. CalEnviroScreen 3.0 and 2.0 Traffic Indicator Results for San Ysidro ..................... 28
Figure 18. CalEnviroScreen 3.0 and 2.0 Traffic Indicator Results for Calexico ......................... 29
Figure 19. Imperial Valley Water Flow .................................................................................. 31
Figure 20. San Ysidro Air Study Partners ............................................................................... 32
Figure 21. San Ysidro Community Residents Providing Directionality for Location of Community Air Monitors .............................................................................................. 33
Report to the Legislature: CalEnviroScreen Data Update for the Border Region
CalEPA Office of Environmental Health Hazard Assessment
Figure 22. Density Map of Locations Where Residents Would Like More Data About Air Quality ......................................................................................................................... 34
Figure 23. Location of the 13 San Ysidro Community Air Monitors ........................................ 35
Figure 24. San Ysidro Community Air Monitors .................................................................... 36
Report to the Legislature: CalEnviroScreen Data Update for the Border Region
CalEPA Office of Environmental Health Hazard Assessment
Tables
Table 1. CalEnviroScreen 2.0 Diesel Particulate Matter Indicator Results After Border Adjustment ................................................................................................................... 17
Table 2. The United States and Mexico Pollutant Thresholds for Industrial Reporting ........... 23
Table 3. Border Crossing Traffic Counts Added to the Traffic Indicator .................................. 26
Table 4. CalEnviroScreen 3.0 Traffic Indicator Results Before and After Border Adjustments ................................................................................................................. 27
Report to the Legislature: CalEnviroScreen Data Update for the Border Region
CalEPA Office of Environmental Health Hazard Assessment 1
I Executive Summary This report is being submitted to the Legislature in accordance with the requirements of Public Resources Code section 71090, which was enacted into law by Assembly Bill 1059 (Eduardo Garcia, Chapter 584, Statutes of 2015). AB 1059 requires OEHHA to report to the Legislature on its efforts to include additional information on pollution in the California-Mexico border region in the California Communities Environmental Health Screening Tool (CalEnviroScreen). 1 Environmental justice advocates and others have argued that chemical-by-chemical and source-specific assessments of pollution impacts do not reflect the multiple environmental exposures their communities experience. Communities with multiple sources of pollution are predominantly low-income and minority and also face socioeconomic and biological stressors, such as unemployment and elevated rates of pre-existing health conditions. In combination, these stressors can increase vulnerability to adverse health effects from exposure to pollution. To address these concerns, the Office of Environmental Health Hazard Assessment (OEHHA) developed CalEnviroScreen, a science-based tool that characterizes California communities based on measurements of pollution burden while accounting for population characteristics to identify those communities that are most highly burdened and most vulnerable to pollution’s adverse effects. The most recent version – CalEnviroScreen 3.0 – uses 20 statewide indicators to measure pollution and population characteristics at the census tract level. The tool is being used to assist the State of California in making allocations from the Greenhouse Gas Reduction Fund to benefit disadvantaged communities, and by the California Environmental Protection Agency (CalEPA) and its boards and departments in prioritizing activities and resources for communities. CalEnviroScreen generally uses California-specific pollution data. This has prompted concerns that the tool is not accounting for pollution originating in Mexico that is impacting California’s border communities. This report covers the work OEHHA has done to improve CalEnviroScreen with respect to California-Mexico cross-border pollution. CalEnviroScreen 3.0 was released in January 2017. A prior CalEnviroScreen 2.0 version was released in August 2014 and updated in October 2014 with some additional pollution data for the California-Mexico border region. Building on that initial update, OEHHA has gathered data on pollution releases near the border and used it to refine the following air quality indicators in CalEnviroScreen 3.0, to better capture impacts faced by San Ysidro, Calexico and other California border communities. PM2.5 (Fine Particulate Matter)
The California Air Resources Board (CARB) has provided OEHHA with data on the concentrations of PM2.5 air pollution for use in CalEnviroScreen. To generate this information, CARB used air monitoring data obtained from a network of monitoring stations maintained by CARB and local air pollution control districts. Data from two new air monitors, one located in San Ysidro and the other at the Otay Mesa Donovan Correctional
1 Information about CalEnviroScreen can be found here: http://oehha.ca.gov/calenviroscreen
Report to the Legislature: CalEnviroScreen Data Update for the Border Region
CalEPA Office of Environmental Health Hazard Assessment 2
Facility in San Diego County, were included. These were not available for the previous version of CalEnviroScreen.
Diesel Particulate Matter
CARB has also provided OEHHA with data that estimates the emissions of diesel particulate matter (DPM) for use in CalEnviroScreen. There are no direct air monitoring measurements statewide, so CARB estimated DPM emissions using an on-road and off-road emissions inventory. In accounting for cross-border DPM impacts, CARB compared the modeled DPM emissions with estimated DPM concentration data that were derived using nitrogen oxide (NOx) data from air monitoring stations located in San Diego and Imperial County. The comparison revealed that Calexico needed to be adjusted to reflect the higher DPM levels that occur at this location.
Toxic Releases from Facilities Toxic releases from Mexican facilities within 49 kilometers of the California-Mexico border that report air emissions to the Mexican government were incorporated in CalEnviroScreen 3.0. This information was not included in the prior version of the tool. Data from the facilities in Mexico were obtained from Mexico’s Registry of Emissions and Pollutant Transfer (RETC) database.
Traffic Density Traffic volumes along roadways within 150 meters south of the California-Mexico border were used to update traffic density at six border crossings. The 150-meter buffer is the same buffer distance applied in the traffic density indicator in CalEnviroScreen for all California census tracts. The San Diego Association of Governments (SANDAG) also provided traffic volume and road network data for Tijuana, Mexico, located adjacent to the community of San Ysidro. This information allowed for two major Tijuana roadways within 150 meters south of the border to be incorporated into the traffic-density results. The previous version of CalEnviroScreen did not include this information.
As just described, OEHHA has included available data on cross-border pollution contributions to CalEnviroScreen’s estimates of pollution burden in border communities. In collecting this information, OEHHA encountered data gaps for some indicators with respect to cross-border impacts that, if addressed, could further improve the characterization of the region (PM2.5, Diesel Particulate Matter, Traffic Density, Toxic Releases from Facilities). Data gaps exist for other indicators that lack necessary information for any cross-border adjustments including Hazardous Waste Generators and Facilities. OEHHA will continue to work on improving any indicators for which information of sufficient quality becomes available. As part of these ongoing efforts, this report highlights two funded projects that are in place to collect additional cross-border pollution data for the PM2.5, Ozone, Diesel Particulate Matter, Toxic Releases from Facilities, and Hazardous Waste Generators and Facilities CalEnviroScreen indicators. CalEnviroScreen data will continue to be refined and updated in subsequent versions of the tool to provide decision-makers with the most accurate and current characterization of conditions in
Report to the Legislature: CalEnviroScreen Data Update for the Border Region
CalEPA Office of Environmental Health Hazard Assessment 3
communities disproportionately impacted by multiple sources of pollution. Ongoing engagement with communities, particularly those affected by pollution, is a critical element to the development of CalEnviroScreen. Studies that use principles of participatory research can be especially valuable in understanding conditions in communities impacted by multiple sources of pollution and who are most vulnerable to its effects.
Report to the Legislature: CalEnviroScreen Data Update for the Border Region
CalEPA Office of Environmental Health Hazard Assessment 4
II Overview of Assembly Bill 1059 Legislation OEHHA prepared this report in response to Assembly Bill (AB) 1059 (California Communities Health Screening, Garcia, Chapter 584, Statutes of 2015), codified as Public Resources Code section 71090. AB 1059 requires OEHHA to report to the Legislature on data on air quality, water quality, and toxic release and hazardous waste sites, necessary for updating indicators in the CalEnviroScreen tool to address communities located in the California-Mexico border region. If available data are of sufficient quality they are to be included in the next update of CalEnviroScreen, to better account for pollution impacts from Mexico on California communities. The report also requires OEHHA to report on barriers to accessing the necessary data, and plans for monitoring and obtaining data in the future. The legislation specifies that necessary data and information may include, but not be limited to, the following: 1) air quality measurements for ozone and fine particulate matter (PM2.5) in the border regions; 2) vehicle emissions at border crossings; 3) complete traffic density data within 150 meters of the border; 4) water quality data for waterways that cross the border; and 5) feasibility of incorporating into the tool information from Mexico contained in the Pollutant Release and Transfer Registry.
Report to the Legislature: CalEnviroScreen Data Update for the Border Region
CalEPA Office of Environmental Health Hazard Assessment 5
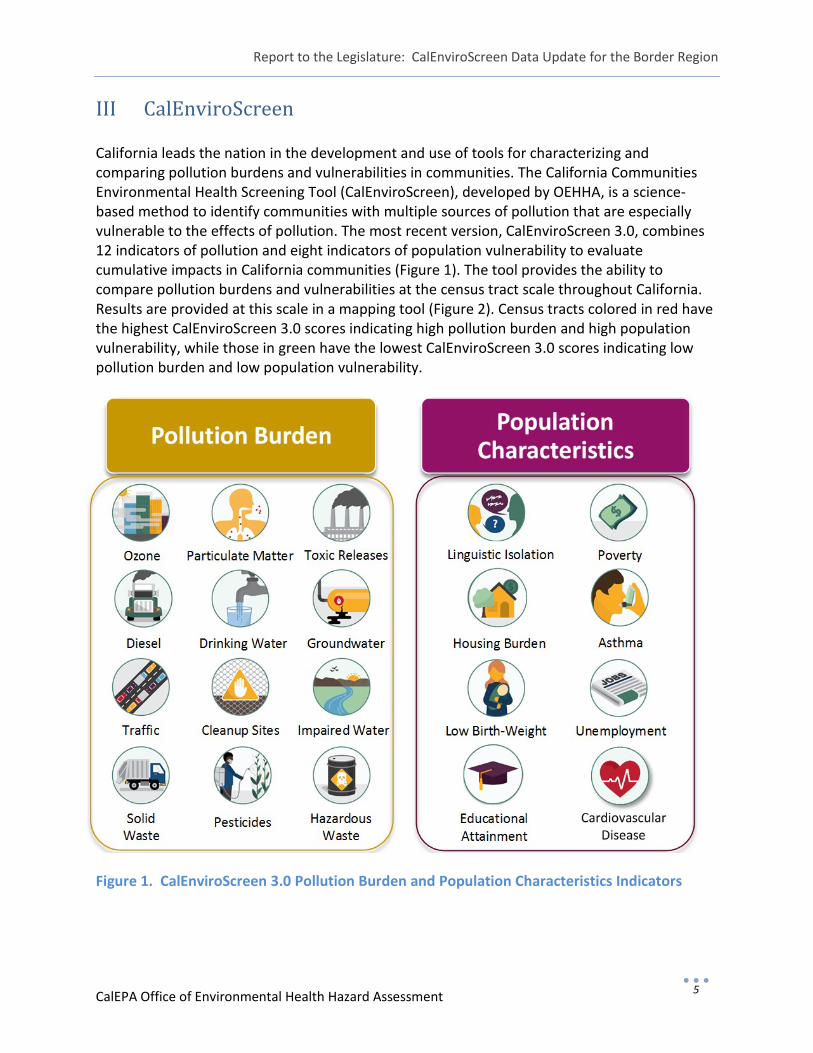
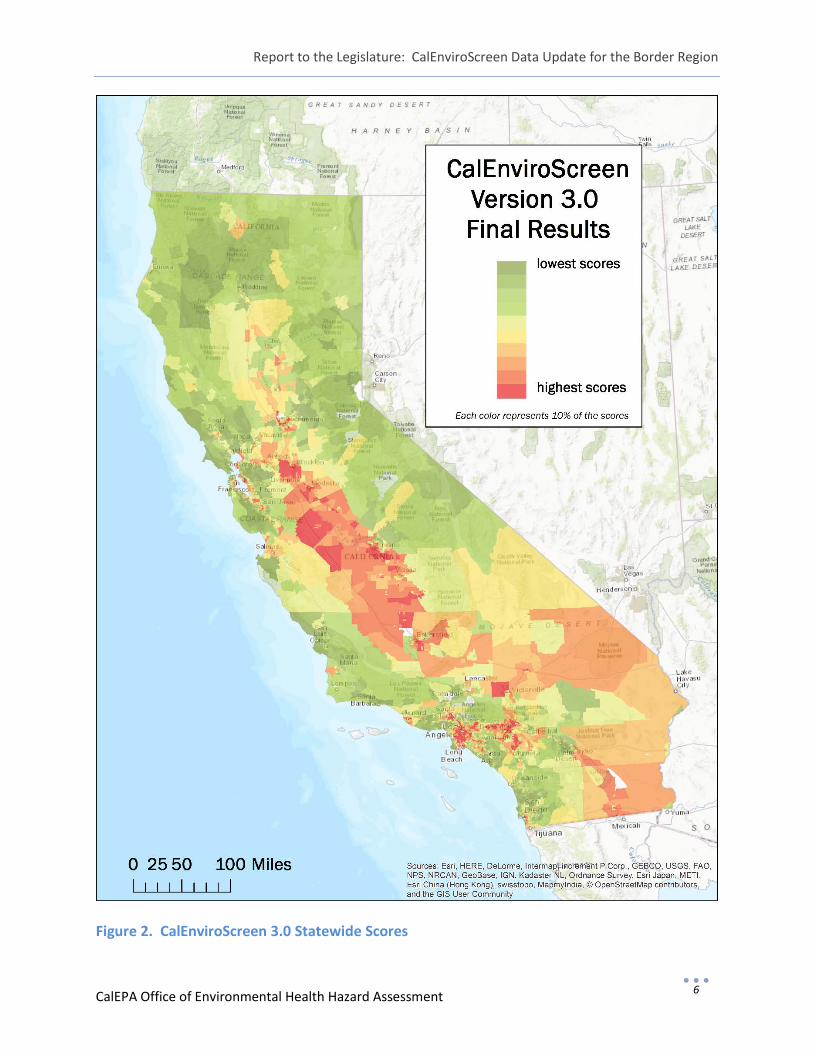
III CalEnviroScreen California leads the nation in the development and use of tools for characterizing and comparing pollution burdens and vulnerabilities in communities. The California Communities Environmental Health Screening Tool (CalEnviroScreen), developed by OEHHA, is a science-based method to identify communities with multiple sources of pollution that are especially vulnerable to the effects of pollution. The most recent version, CalEnviroScreen 3.0, combines 12 indicators of pollution and eight indicators of population vulnerability to evaluate cumulative impacts in California communities (Figure 1). The tool provides the ability to compare pollution burdens and vulnerabilities at the census tract scale throughout California. Results are provided at this scale in a mapping tool (Figure 2). Census tracts colored in red have the highest CalEnviroScreen 3.0 scores indicating high pollution burden and high population vulnerability, while those in green have the lowest CalEnviroScreen 3.0 scores indicating low pollution burden and low population vulnerability.
Figure 1. CalEnviroScreen 3.0 Pollution Burden and Population Characteristics Indicators
Report to the Legislature: CalEnviroScreen Data Update for the Border Region
CalEPA Office of Environmental Health Hazard Assessment 6
Figure 2. CalEnviroScreen 3.0 Statewide Scores
Report to the Legislature: CalEnviroScreen Data Update for the Border Region
CalEPA Office of Environmental Health Hazard Assessment 7
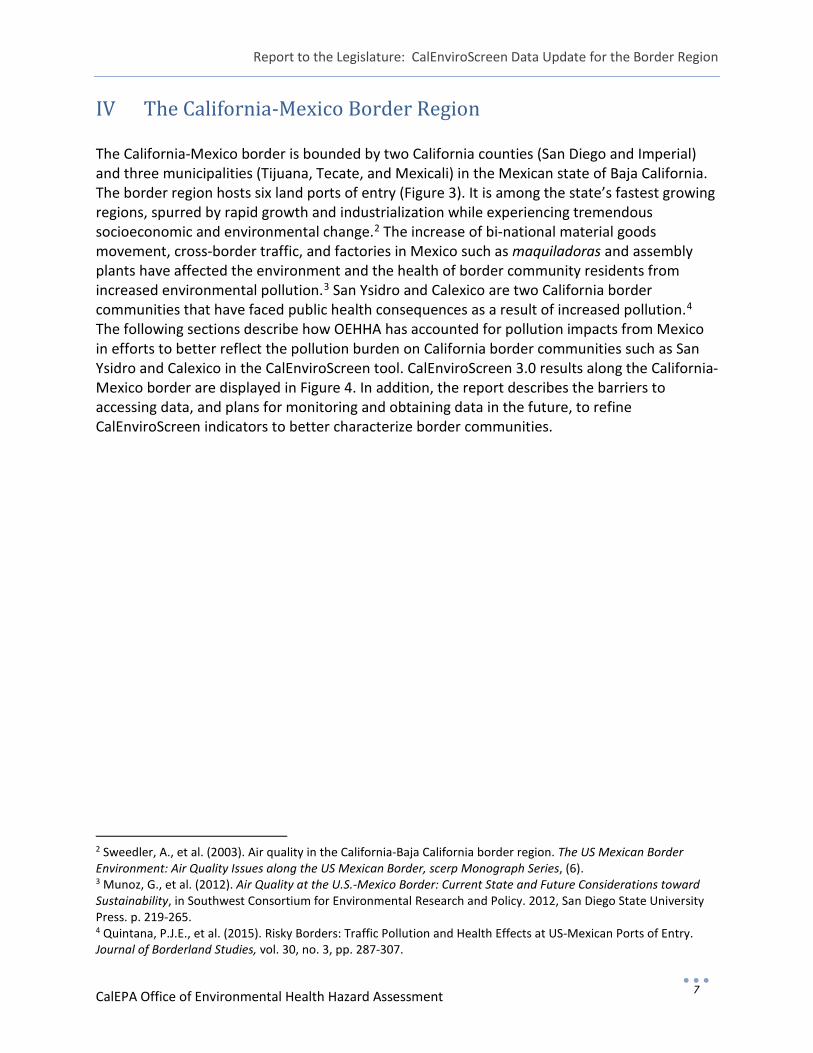
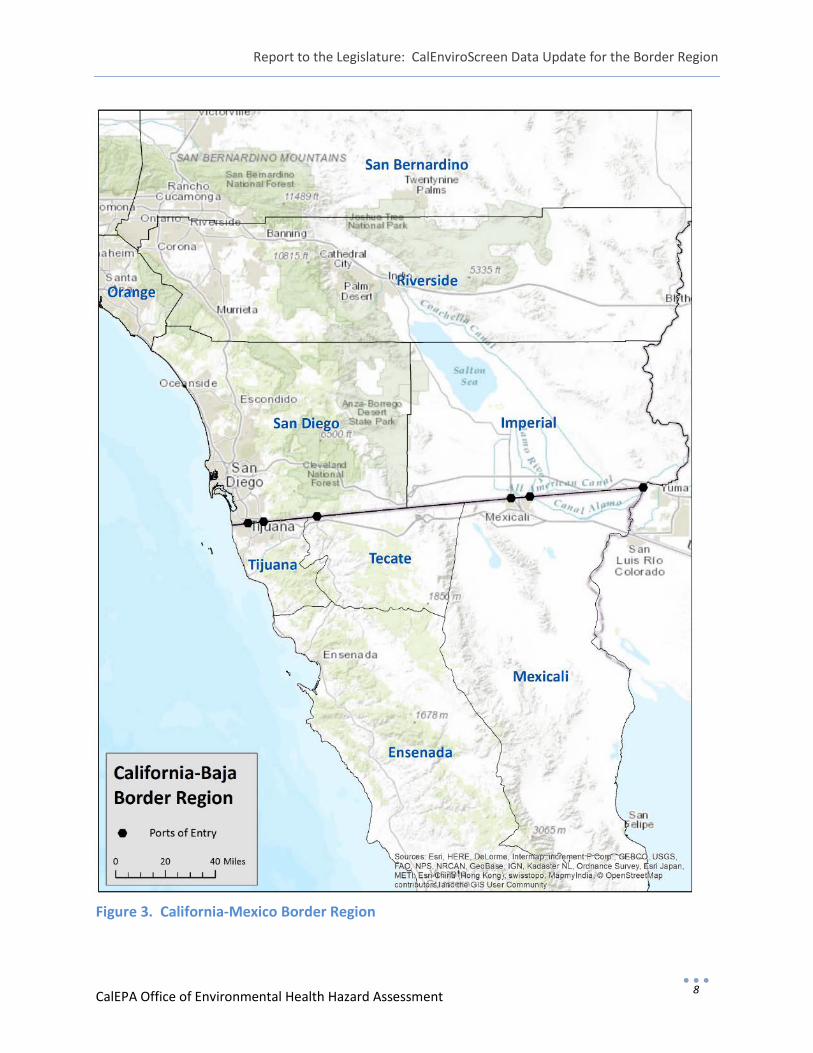
IV The California-Mexico Border Region The California-Mexico border is bounded by two California counties (San Diego and Imperial) and three municipalities (Tijuana, Tecate, and Mexicali) in the Mexican state of Baja California. The border region hosts six land ports of entry (Figure 3). It is among the state’s fastest growing regions, spurred by rapid growth and industrialization while experiencing tremendous socioeconomic and environmental change.2 The increase of bi-national material goods movement, cross-border traffic, and factories in Mexico such as maquiladoras and assembly plants have affected the environment and the health of border community residents from increased environmental pollution.3 San Ysidro and Calexico are two California border communities that have faced public health consequences as a result of increased pollution.4 The following sections describe how OEHHA has accounted for pollution impacts from Mexico in efforts to better reflect the pollution burden on California border communities such as San Ysidro and Calexico in the CalEnviroScreen tool. CalEnviroScreen 3.0 results along the California-Mexico border are displayed in Figure 4. In addition, the report describes the barriers to accessing data, and plans for monitoring and obtaining data in the future, to refine CalEnviroScreen indicators to better characterize border communities.
2 Sweedler, A., et al. (2003). Air quality in the California-Baja California border region. The US Mexican Border Environment: Air Quality Issues along the US Mexican Border, scerp Monograph Series, (6). 3 Munoz, G., et al. (2012). Air Quality at the U.S.-Mexico Border: Current State and Future Considerations toward Sustainability, in Southwest Consortium for Environmental Research and Policy. 2012, San Diego State University Press. p. 219-265. 4 Quintana, P.J.E., et al. (2015). Risky Borders: Traffic Pollution and Health Effects at US-Mexican Ports of Entry. Journal of Borderland Studies, vol. 30, no. 3, pp. 287-307.
Report to the Legislature: CalEnviroScreen Data Update for the Border Region
CalEPA Office of Environmental Health Hazard Assessment 8
Figure 3. California-Mexico Border Region
Report to the Legislature: CalEnviroScreen Data Update for the Border Region
CalEPA Office of Environmental Health Hazard Assessment 9
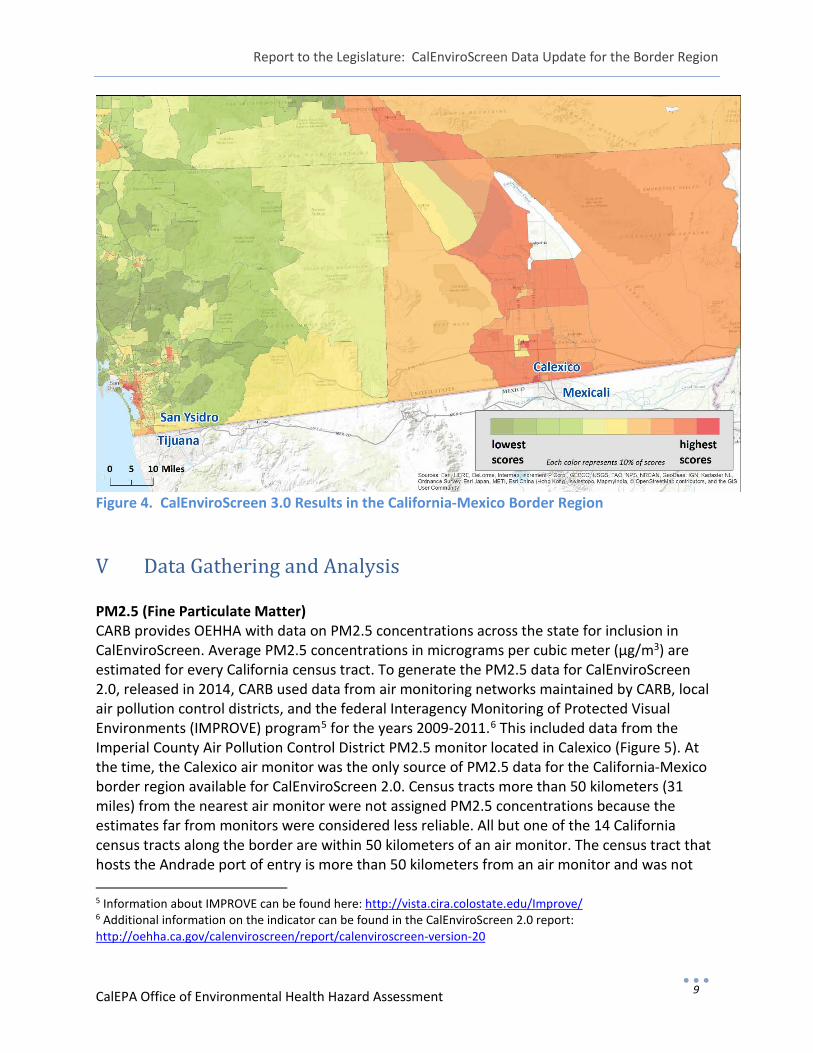
Figure 4. CalEnviroScreen 3.0 Results in the California-Mexico Border Region
V Data Gathering and Analysis PM2.5 (Fine Particulate Matter) CARB provides OEHHA with data on PM2.5 concentrations across the state for inclusion in CalEnviroScreen. Average PM2.5 concentrations in micrograms per cubic meter (µg/m3) are estimated for every California census tract. To generate the PM2.5 data for CalEnviroScreen 2.0, released in 2014, CARB used data from air monitoring networks maintained by CARB, local air pollution control districts, and the federal Interagency Monitoring of Protected Visual Environments (IMPROVE) program5 for the years 2009-2011.6 This included data from the Imperial County Air Pollution Control District PM2.5 monitor located in Calexico (Figure 5). At the time, the Calexico air monitor was the only source of PM2.5 data for the California-Mexico border region available for CalEnviroScreen 2.0. Census tracts more than 50 kilometers (31 miles) from the nearest air monitor were not assigned PM2.5 concentrations because the estimates far from monitors were considered less reliable. All but one of the 14 California census tracts along the border are within 50 kilometers of an air monitor. The census tract that hosts the Andrade port of entry is more than 50 kilometers from an air monitor and was not 5 Information about IMPROVE can be found here: http://vista.cira.colostate.edu/Improve/ 6 Additional information on the indicator can be found in the CalEnviroScreen 2.0 report: http://oehha.ca.gov/calenviroscreen/report/calenviroscreen-version-20
Report to the Legislature: CalEnviroScreen Data Update for the Border Region
CalEPA Office of Environmental Health Hazard Assessment 10
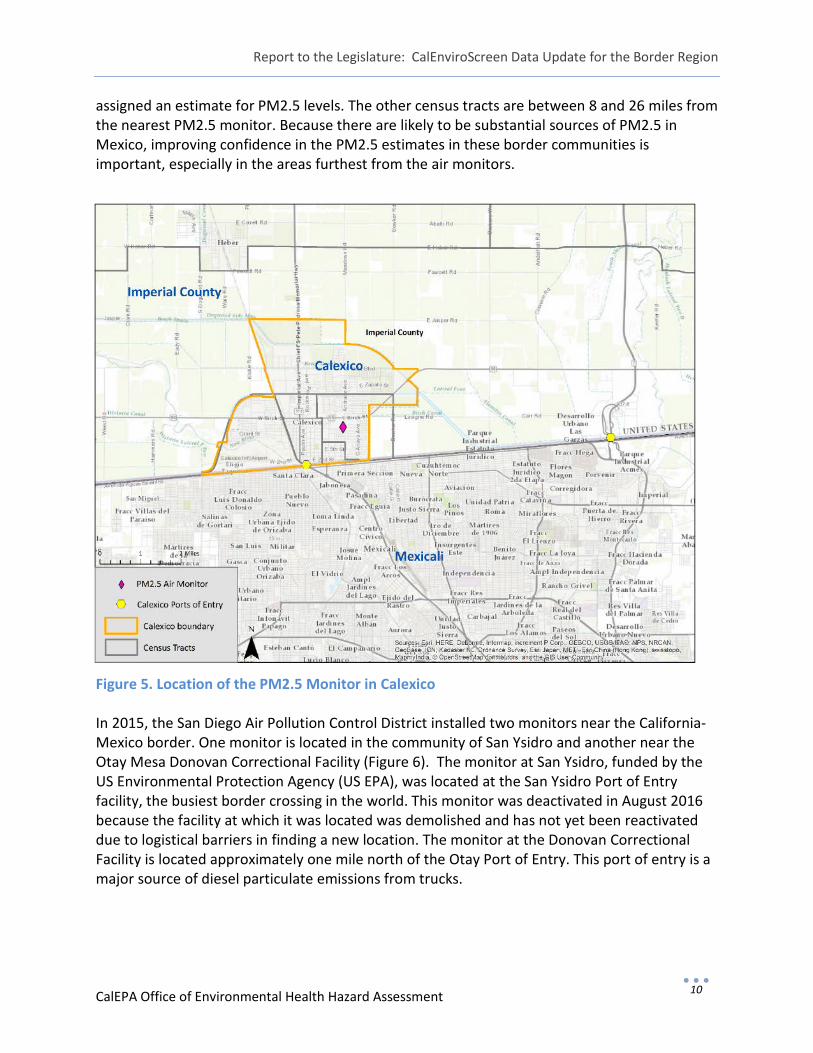
assigned an estimate for PM2.5 levels. The other census tracts are between 8 and 26 miles from the nearest PM2.5 monitor. Because there are likely to be substantial sources of PM2.5 in Mexico, improving confidence in the PM2.5 estimates in these border communities is important, especially in the areas furthest from the air monitors.
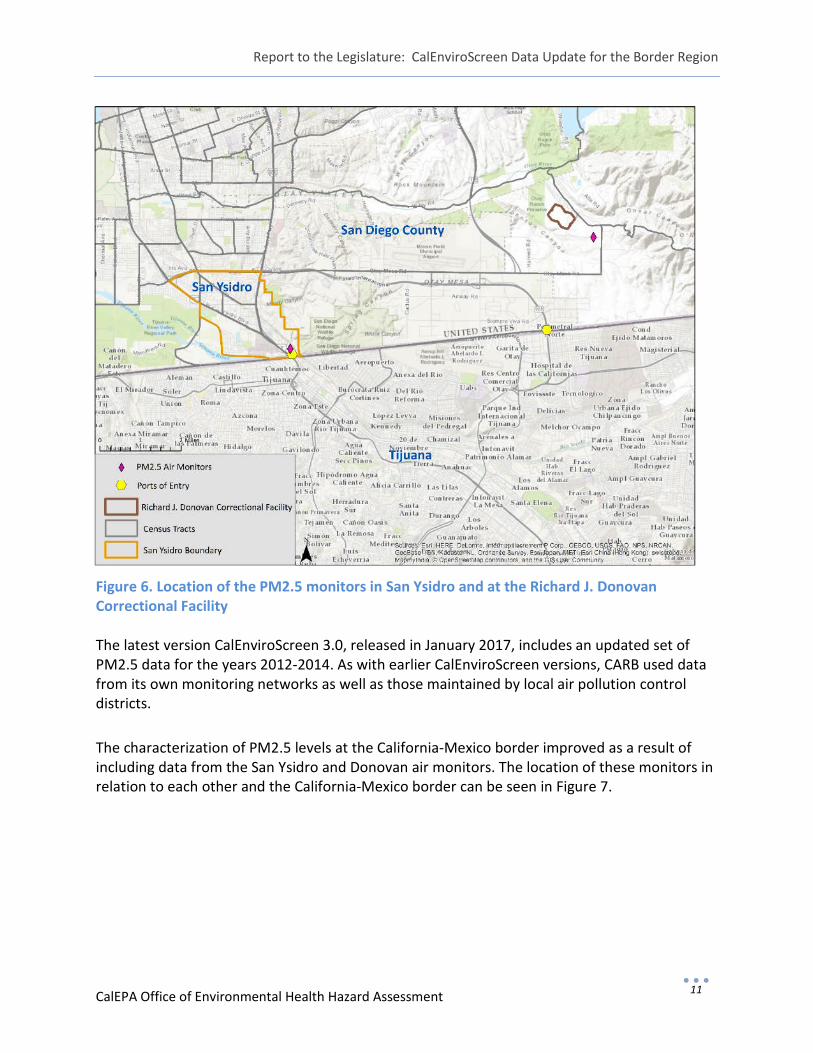
Figure 5. Location of the PM2.5 Monitor in Calexico In 2015, the San Diego Air Pollution Control District installed two monitors near the California-Mexico border. One monitor is located in the community of San Ysidro and another near the Otay Mesa Donovan Correctional Facility (Figure 6). The monitor at San Ysidro, funded by the US Environmental Protection Agency (US EPA), was located at the San Ysidro Port of Entry facility, the busiest border crossing in the world. This monitor was deactivated in August 2016 because the facility at which it was located was demolished and has not yet been reactivated due to logistical barriers in finding a new location. The monitor at the Donovan Correctional Facility is located approximately one mile north of the Otay Port of Entry. This port of entry is a major source of diesel particulate emissions from trucks.
Report to the Legislature: CalEnviroScreen Data Update for the Border Region
CalEPA Office of Environmental Health Hazard Assessment 11
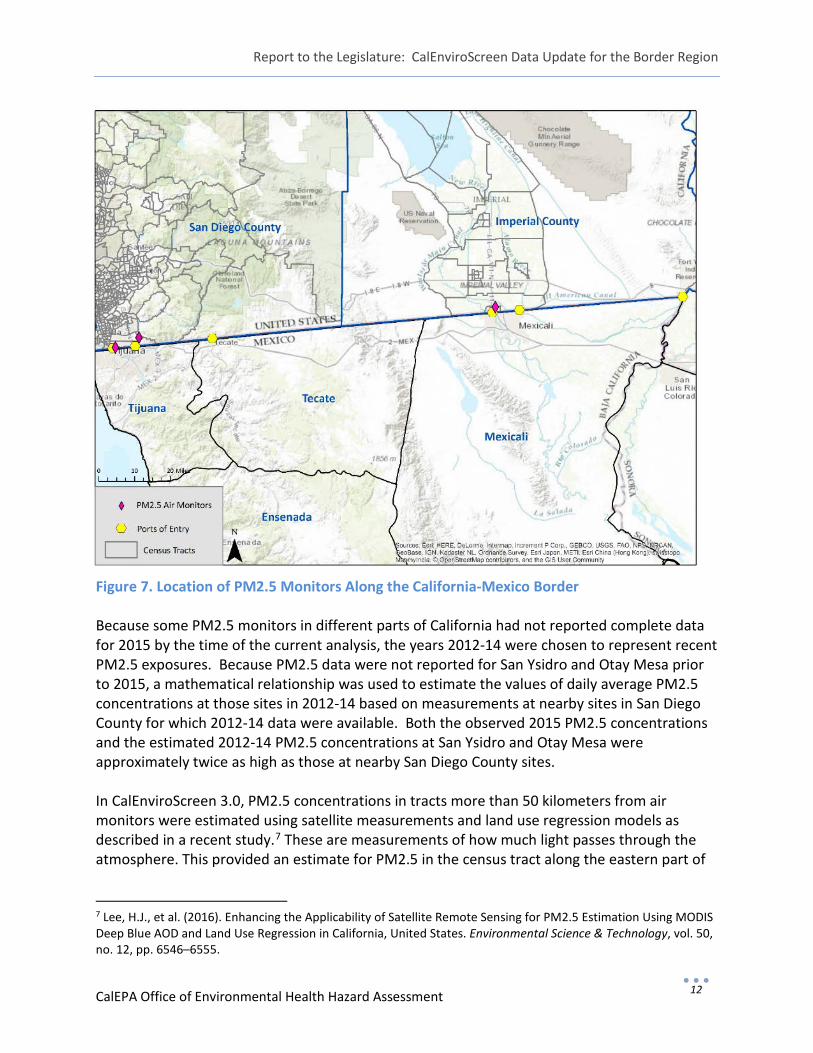
Figure 6. Location of the PM2.5 monitors in San Ysidro and at the Richard J. Donovan Correctional Facility The latest version CalEnviroScreen 3.0, released in January 2017, includes an updated set of PM2.5 data for the years 2012-2014. As with earlier CalEnviroScreen versions, CARB used data from its own monitoring networks as well as those maintained by local air pollution control districts. The characterization of PM2.5 levels at the California-Mexico border improved as a result of including data from the San Ysidro and Donovan air monitors. The location of these monitors in relation to each other and the California-Mexico border can be seen in Figure 7.
Report to the Legislature: CalEnviroScreen Data Update for the Border Region
CalEPA Office of Environmental Health Hazard Assessment 12
Figure 7. Location of PM2.5 Monitors Along the California-Mexico Border Because some PM2.5 monitors in different parts of California had not reported complete data for 2015 by the time of the current analysis, the years 2012-14 were chosen to represent recent PM2.5 exposures. Because PM2.5 data were not reported for San Ysidro and Otay Mesa prior to 2015, a mathematical relationship was used to estimate the values of daily average PM2.5 concentrations at those sites in 2012-14 based on measurements at nearby sites in San Diego County for which 2012-14 data were available. Both the observed 2015 PM2.5 concentrations and the estimated 2012-14 PM2.5 concentrations at San Ysidro and Otay Mesa were approximately twice as high as those at nearby San Diego County sites. In CalEnviroScreen 3.0, PM2.5 concentrations in tracts more than 50 kilometers from air monitors were estimated using satellite measurements and land use regression models as described in a recent study.7 These are measurements of how much light passes through the atmosphere. This provided an estimate for PM2.5 in the census tract along the eastern part of
7 Lee, H.J., et al. (2016). Enhancing the Applicability of Satellite Remote Sensing for PM2.5 Estimation Using MODIS Deep Blue AOD and Land Use Regression in California, United States. Environmental Science & Technology, vol. 50, no. 12, pp. 6546–6555.
Report to the Legislature: CalEnviroScreen Data Update for the Border Region
CalEPA Office of Environmental Health Hazard Assessment 13
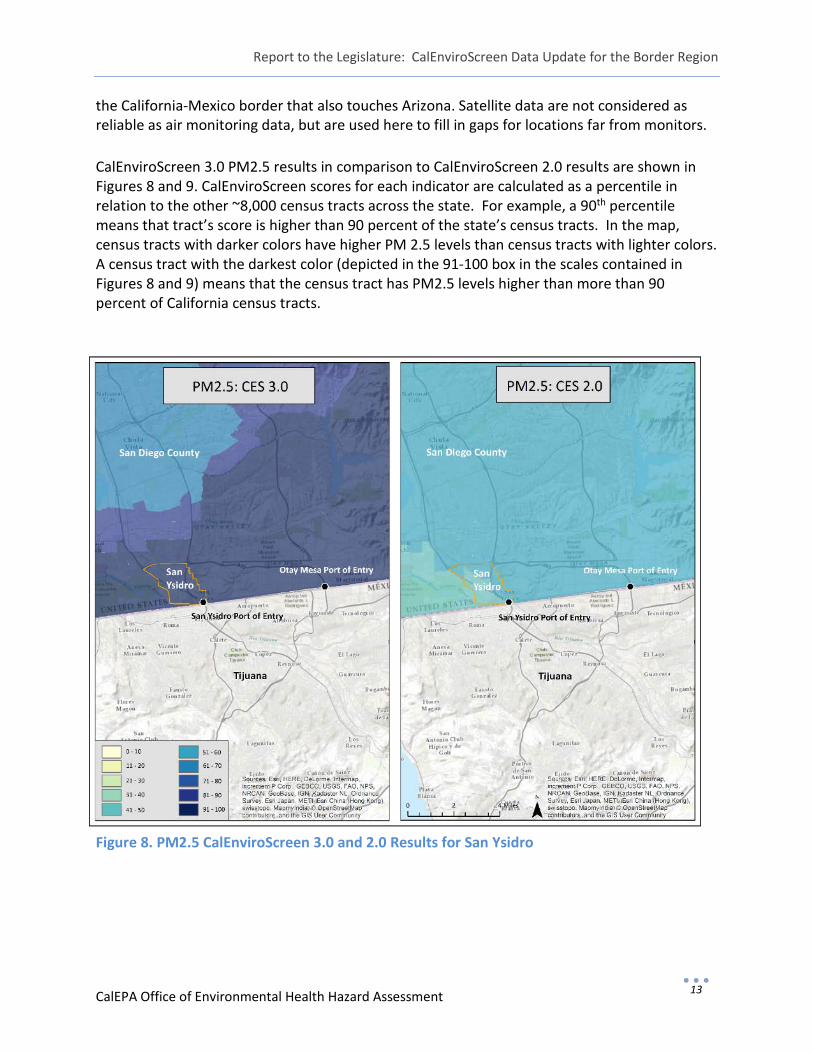
the California-Mexico border that also touches Arizona. Satellite data are not considered as reliable as air monitoring data, but are used here to fill in gaps for locations far from monitors. CalEnviroScreen 3.0 PM2.5 results in comparison to CalEnviroScreen 2.0 results are shown in Figures 8 and 9. CalEnviroScreen scores for each indicator are calculated as a percentile in relation to the other ~8,000 census tracts across the state. For example, a 90th percentile means that tract’s score is higher than 90 percent of the state’s census tracts. In the map, census tracts with darker colors have higher PM 2.5 levels than census tracts with lighter colors. A census tract with the darkest color (depicted in the 91-100 box in the scales contained in Figures 8 and 9) means that the census tract has PM2.5 levels higher than more than 90 percent of California census tracts.
Figure 8. PM2.5 CalEnviroScreen 3.0 and 2.0 Results for San Ysidro
Report to the Legislature: CalEnviroScreen Data Update for the Border Region
CalEPA Office of Environmental Health Hazard Assessment 14
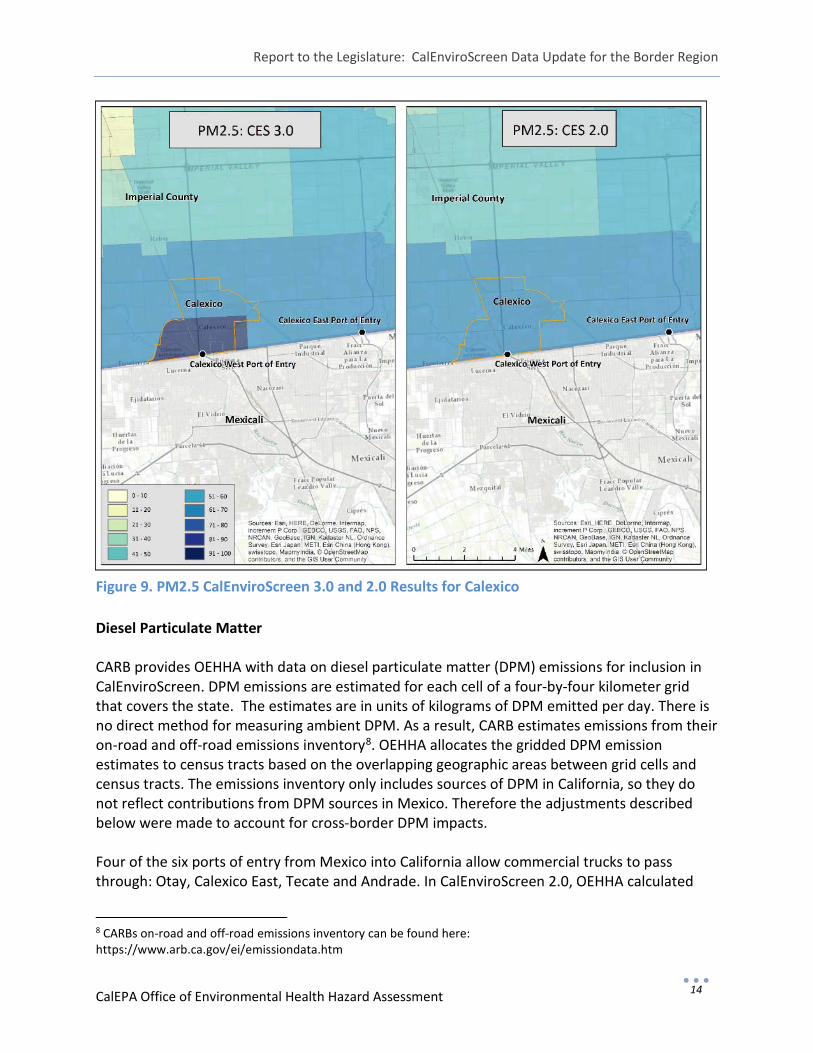
Figure 9. PM2.5 CalEnviroScreen 3.0 and 2.0 Results for Calexico Diesel Particulate Matter CARB provides OEHHA with data on diesel particulate matter (DPM) emissions for inclusion in CalEnviroScreen. DPM emissions are estimated for each cell of a four-by-four kilometer grid that covers the state. The estimates are in units of kilograms of DPM emitted per day. There is no direct method for measuring ambient DPM. As a result, CARB estimates emissions from their on-road and off-road emissions inventory8. OEHHA allocates the gridded DPM emission estimates to census tracts based on the overlapping geographic areas between grid cells and census tracts. The emissions inventory only includes sources of DPM in California, so they do not reflect contributions from DPM sources in Mexico. Therefore the adjustments described below were made to account for cross-border DPM impacts. Four of the six ports of entry from Mexico into California allow commercial trucks to pass through: Otay, Calexico East, Tecate and Andrade. In CalEnviroScreen 2.0, OEHHA calculated
8 CARBs on-road and off-road emissions inventory can be found here: https://www.arb.ca.gov/ei/emissiondata.htm
Report to the Legislature: CalEnviroScreen Data Update for the Border Region
CalEPA Office of Environmental Health Hazard Assessment 15
the additional kilograms of DPM that would be emitted at the California-Mexico border crossings to account for additional DPM emissions from idling commercial trucks waiting in Mexico to cross into the US. The San Diego Association of Governments (SANDAG) has estimated that each day, on average, approximately 2,400 trucks cross in Otay, 832 in Calexico East, 151 in Tecate and fewer than one per day in Andrade. Tecate and Andrade were excluded from the adjustment due to their minimal rates of truck crossings. Additional emissions were estimated based on daily truck counts and fixed assumptions regarding the idling time and emission rates per truck. The following equation provided by CARB describes the relationship:
Daily emissions of DPM = (number of trucks/day) × (time idling in hours) × (rate of DPM emissions per hour idling)
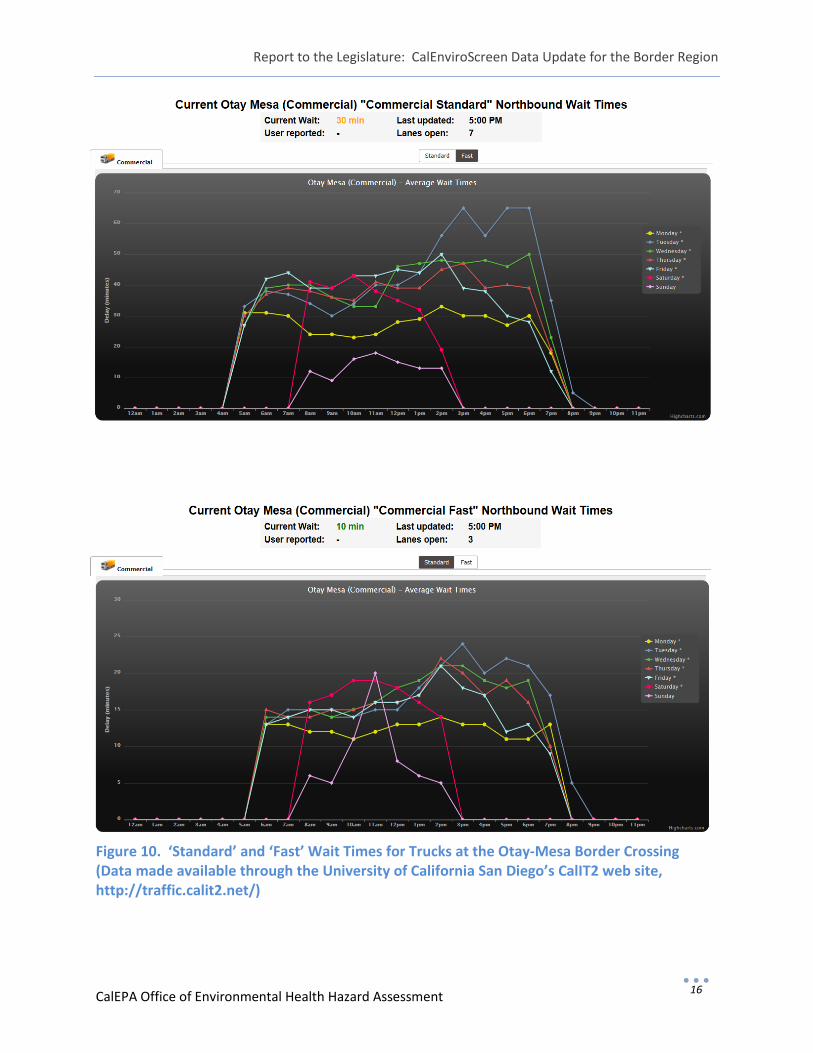
The calculation uses an estimate of 0.33 grams DPM emitted per hour of idling. The basis for this emission rate comes from CARB’s idling emissions spreadsheet tool and uses the 2014 fleet average for San Diego.9 The calculation also uses an estimate of 0.75 hour (45 minutes) idling time for the Otay Mesa Border Crossing. This estimate is based on historical border wait times. Truck wait times at this crossing vary depending on daily congestion as well as on whether a truck passes through a “commercial standard” gate or a “commercial fast (premium)” gate. Data available through the University of California San Diego’s CalIT2 website10 indicate that standard wait times are approximately 45 minutes and fast wait times are approximately 20 minutes (Figure 10). OEHHA used the same wait time for the Calexico East crossing.
9 CARB’s idling emissions spreadsheet tool can be found here: http://www.arb.ca.gov/msei/emfac2011_idling_emission_rates.xlsx 10 University of California San Diego’s CalIT2 website can be found here: http://traffic.calit2.net/
Report to the Legislature: CalEnviroScreen Data Update for the Border Region
CalEPA Office of Environmental Health Hazard Assessment 16
Figure 10. ‘Standard’ and ‘Fast’ Wait Times for Trucks at the Otay-Mesa Border Crossing (Data made available through the University of California San Diego’s CalIT2 web site, http://traffic.calit2.net/)
Report to the Legislature: CalEnviroScreen Data Update for the Border Region
CalEPA Office of Environmental Health Hazard Assessment 17
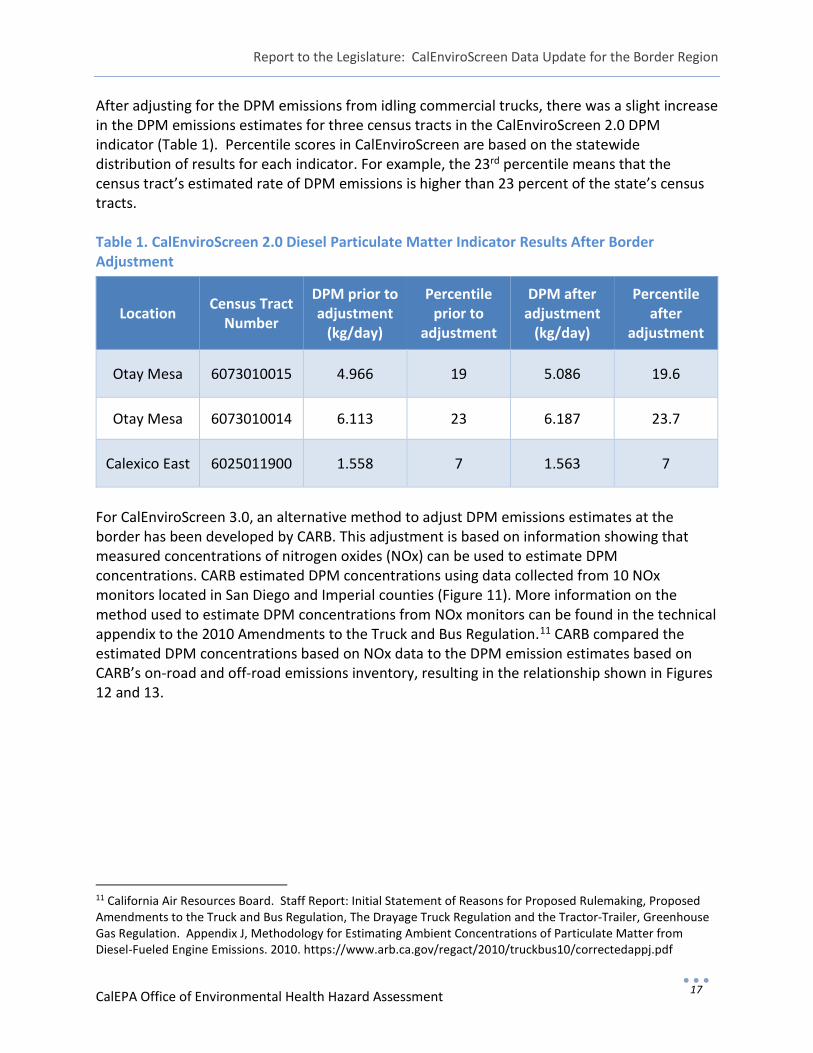
After adjusting for the DPM emissions from idling commercial trucks, there was a slight increase in the DPM emissions estimates for three census tracts in the CalEnviroScreen 2.0 DPM indicator (Table 1). Percentile scores in CalEnviroScreen are based on the statewide distribution of results for each indicator. For example, the 23rd percentile means that the census tract’s estimated rate of DPM emissions is higher than 23 percent of the state’s census tracts. Table 1. CalEnviroScreen 2.0 Diesel Particulate Matter Indicator Results After Border Adjustment
Location Census Tract Number
DPM prior to adjustment
(kg/day)
Percentile prior to
adjustment
DPM after adjustment
(kg/day)
Percentile after
adjustment
Otay Mesa 6073010015 4.966 19 5.086 19.6
Otay Mesa 6073010014 6.113 23 6.187 23.7
Calexico East 6025011900 1.558 7 1.563 7
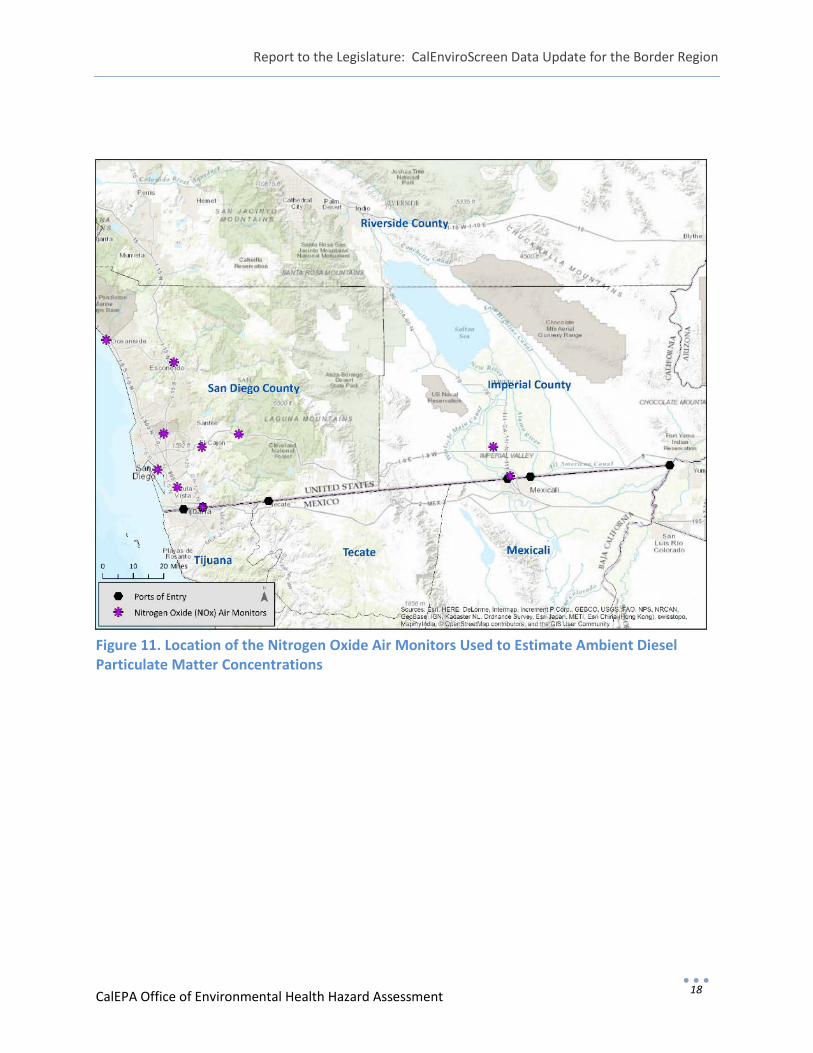
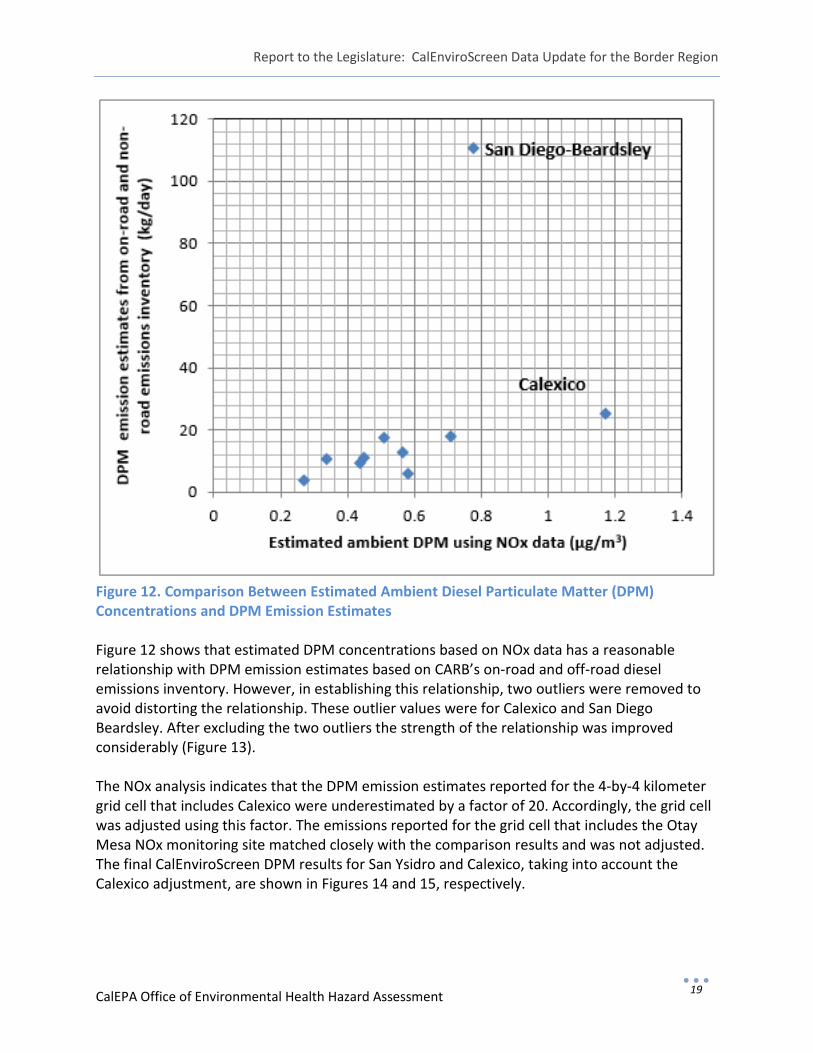
For CalEnviroScreen 3.0, an alternative method to adjust DPM emissions estimates at the border has been developed by CARB. This adjustment is based on information showing that measured concentrations of nitrogen oxides (NOx) can be used to estimate DPM concentrations. CARB estimated DPM concentrations using data collected from 10 NOx monitors located in San Diego and Imperial counties (Figure 11). More information on the method used to estimate DPM concentrations from NOx monitors can be found in the technical appendix to the 2010 Amendments to the Truck and Bus Regulation.11 CARB compared the estimated DPM concentrations based on NOx data to the DPM emission estimates based on CARB’s on-road and off-road emissions inventory, resulting in the relationship shown in Figures 12 and 13.
11 California Air Resources Board. Staff Report: Initial Statement of Reasons for Proposed Rulemaking, Proposed Amendments to the Truck and Bus Regulation, The Drayage Truck Regulation and the Tractor-Trailer, Greenhouse Gas Regulation. Appendix J, Methodology for Estimating Ambient Concentrations of Particulate Matter from Diesel-Fueled Engine Emissions. 2010. https://www.arb.ca.gov/regact/2010/truckbus10/correctedappj.pdf
Report to the Legislature: CalEnviroScreen Data Update for the Border Region
CalEPA Office of Environmental Health Hazard Assessment 18
Figure 11. Location of the Nitrogen Oxide Air Monitors Used to Estimate Ambient Diesel Particulate Matter Concentrations
Report to the Legislature: CalEnviroScreen Data Update for the Border Region
CalEPA Office of Environmental Health Hazard Assessment 19
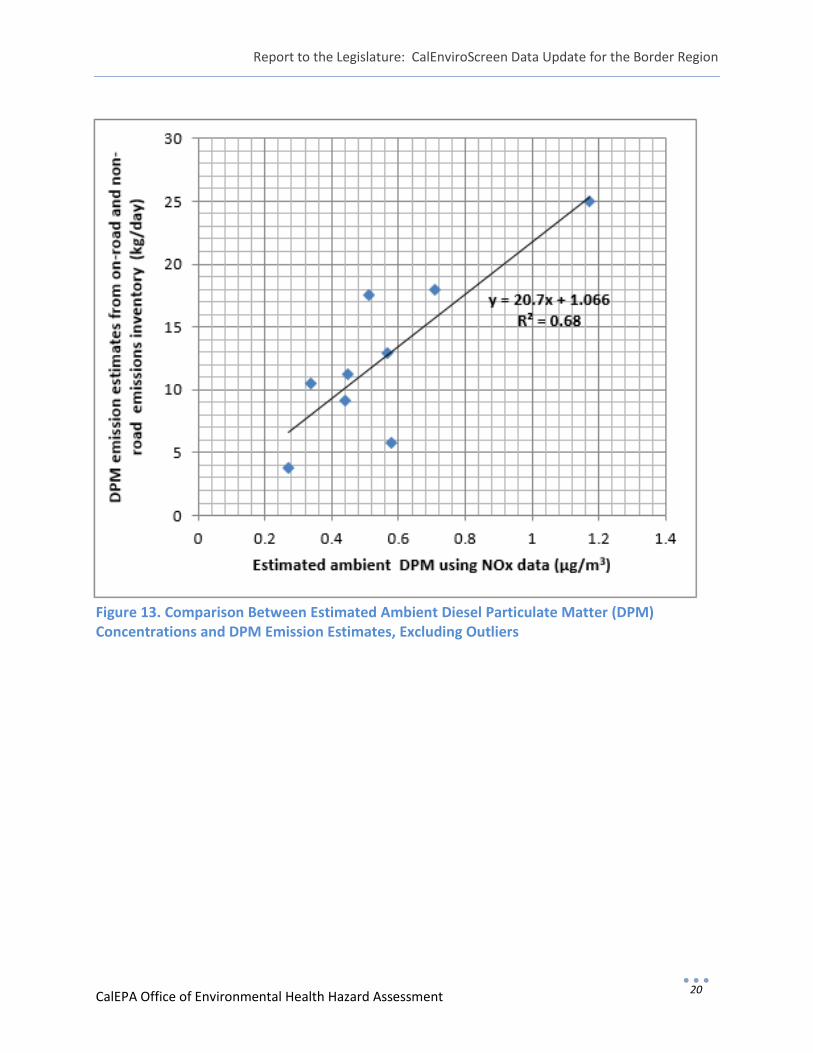
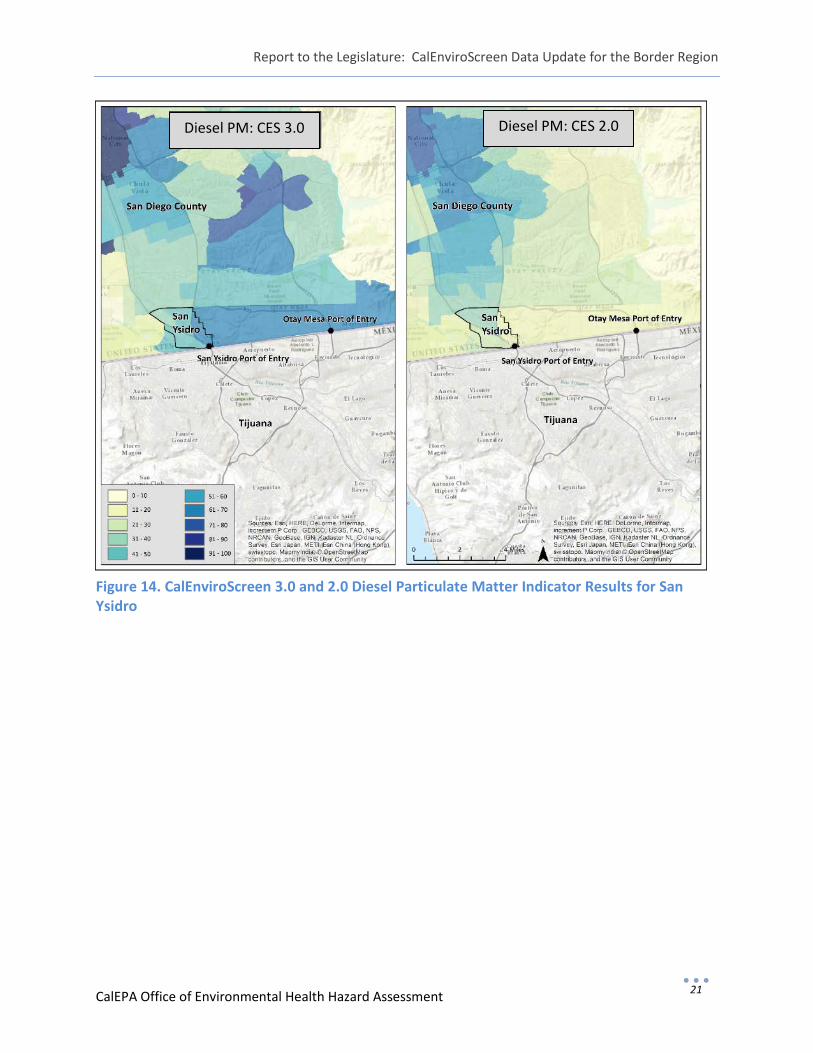
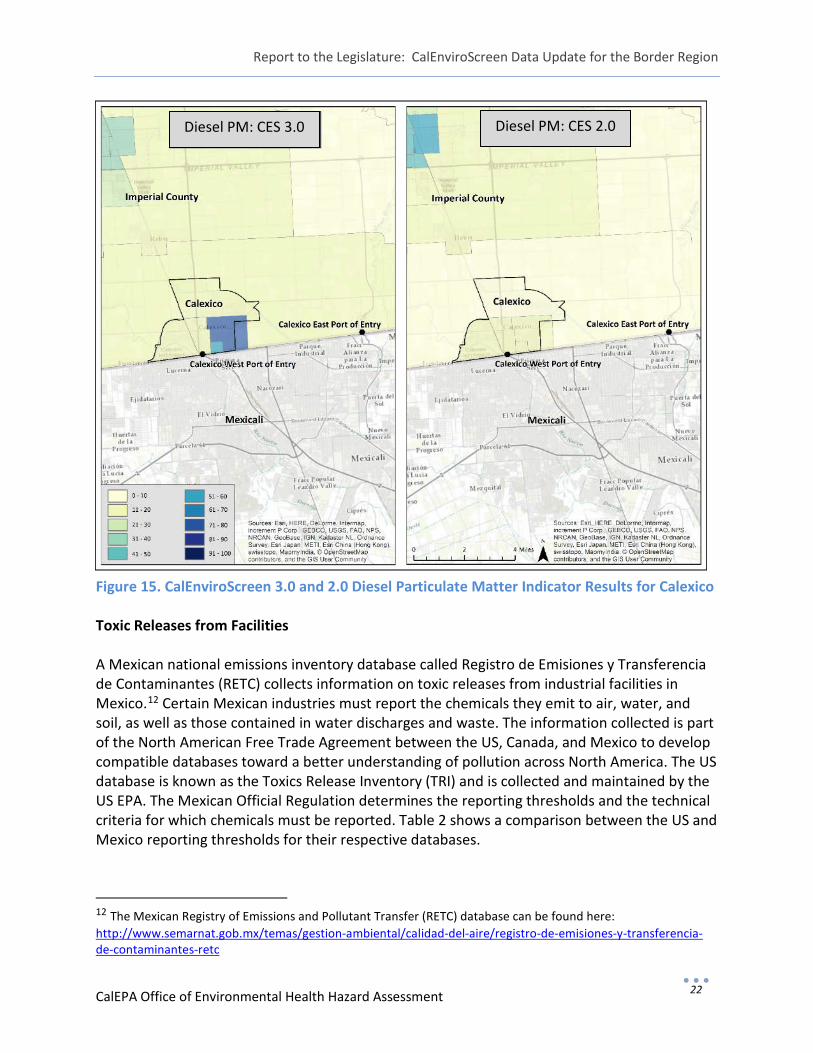
Figure 12. Comparison Between Estimated Ambient Diesel Particulate Matter (DPM) Concentrations and DPM Emission Estimates Figure 12 shows that estimated DPM concentrations based on NOx data has a reasonable relationship with DPM emission estimates based on CARB’s on-road and off-road diesel emissions inventory. However, in establishing this relationship, two outliers were removed to avoid distorting the relationship. These outlier values were for Calexico and San Diego Beardsley. After excluding the two outliers the strength of the relationship was improved considerably (Figure 13). The NOx analysis indicates that the DPM emission estimates reported for the 4-by-4 kilometer grid cell that includes Calexico were underestimated by a factor of 20. Accordingly, the grid cell was adjusted using this factor. The emissions reported for the grid cell that includes the Otay Mesa NOx monitoring site matched closely with the comparison results and was not adjusted. The final CalEnviroScreen DPM results for San Ysidro and Calexico, taking into account the Calexico adjustment, are shown in Figures 14 and 15, respectively.
Report to the Legislature: CalEnviroScreen Data Update for the Border Region
CalEPA Office of Environmental Health Hazard Assessment 20
Figure 13. Comparison Between Estimated Ambient Diesel Particulate Matter (DPM) Concentrations and DPM Emission Estimates, Excluding Outliers
Report to the Legislature: CalEnviroScreen Data Update for the Border Region
CalEPA Office of Environmental Health Hazard Assessment 21
Figure 14. CalEnviroScreen 3.0 and 2.0 Diesel Particulate Matter Indicator Results for San Ysidro
Diesel PM: CES 3.0 Diesel PM: CES 2.0
Report to the Legislature: CalEnviroScreen Data Update for the Border Region
CalEPA Office of Environmental Health Hazard Assessment 22
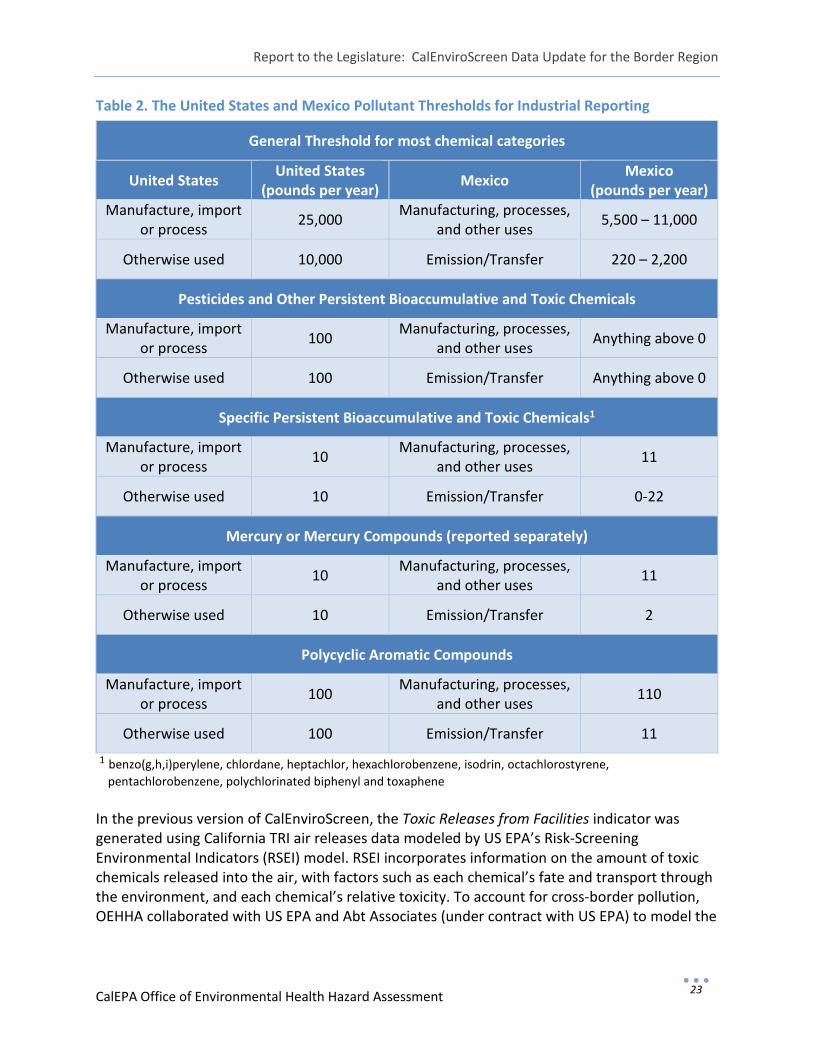
Figure 15. CalEnviroScreen 3.0 and 2.0 Diesel Particulate Matter Indicator Results for Calexico Toxic Releases from Facilities A Mexican national emissions inventory database called Registro de Emisiones y Transferencia de Contaminantes (RETC) collects information on toxic releases from industrial facilities in Mexico.12 Certain Mexican industries must report the chemicals they emit to air, water, and soil, as well as those contained in water discharges and waste. The information collected is part of the North American Free Trade Agreement between the US, Canada, and Mexico to develop compatible databases toward a better understanding of pollution across North America. The US database is known as the Toxics Release Inventory (TRI) and is collected and maintained by the US EPA. The Mexican Official Regulation determines the reporting thresholds and the technical criteria for which chemicals must be reported. Table 2 shows a comparison between the US and Mexico reporting thresholds for their respective databases.
12 The Mexican Registry of Emissions and Pollutant Transfer (RETC) database can be found here: http://www.semarnat.gob.mx/temas/gestion-ambiental/calidad-del-aire/registro-de-emisiones-y-transferencia-de-contaminantes-retc
Diesel PM: CES 3.0 Diesel PM: CES 2.0
Report to the Legislature: CalEnviroScreen Data Update for the Border Region
CalEPA Office of Environmental Health Hazard Assessment 23
Table 2. The United States and Mexico Pollutant Thresholds for Industrial Reporting
General Threshold for most chemical categories
United States United States (pounds per year) Mexico Mexico
(pounds per year) Manufacture, import
or process 25,000 Manufacturing, processes, and other uses 5,500 – 11,000
Otherwise used 10,000 Emission/Transfer 220 – 2,200
Pesticides and Other Persistent Bioaccumulative and Toxic Chemicals
Manufacture, import or process 100 Manufacturing, processes,
and other uses Anything above 0
Otherwise used 100 Emission/Transfer Anything above 0
Specific Persistent Bioaccumulative and Toxic Chemicals1
Manufacture, import or process 10 Manufacturing, processes,
and other uses 11
Otherwise used 10 Emission/Transfer 0-22
Mercury or Mercury Compounds (reported separately)
Manufacture, import or process 10 Manufacturing, processes,
and other uses 11
Otherwise used 10 Emission/Transfer 2
Polycyclic Aromatic Compounds
Manufacture, import or process 100 Manufacturing, processes,
and other uses 110
Otherwise used 100 Emission/Transfer 11
1 benzo(g,h,i)perylene, chlordane, heptachlor, hexachlorobenzene, isodrin, octachlorostyrene, pentachlorobenzene, polychlorinated biphenyl and toxaphene In the previous version of CalEnviroScreen, the Toxic Releases from Facilities indicator was generated using California TRI air releases data modeled by US EPA’s Risk-Screening Environmental Indicators (RSEI) model. RSEI incorporates information on the amount of toxic chemicals released into the air, with factors such as each chemical’s fate and transport through the environment, and each chemical’s relative toxicity. To account for cross-border pollution, OEHHA collaborated with US EPA and Abt Associates (under contract with US EPA) to model the
Report to the Legislature: CalEnviroScreen Data Update for the Border Region
CalEPA Office of Environmental Health Hazard Assessment 24
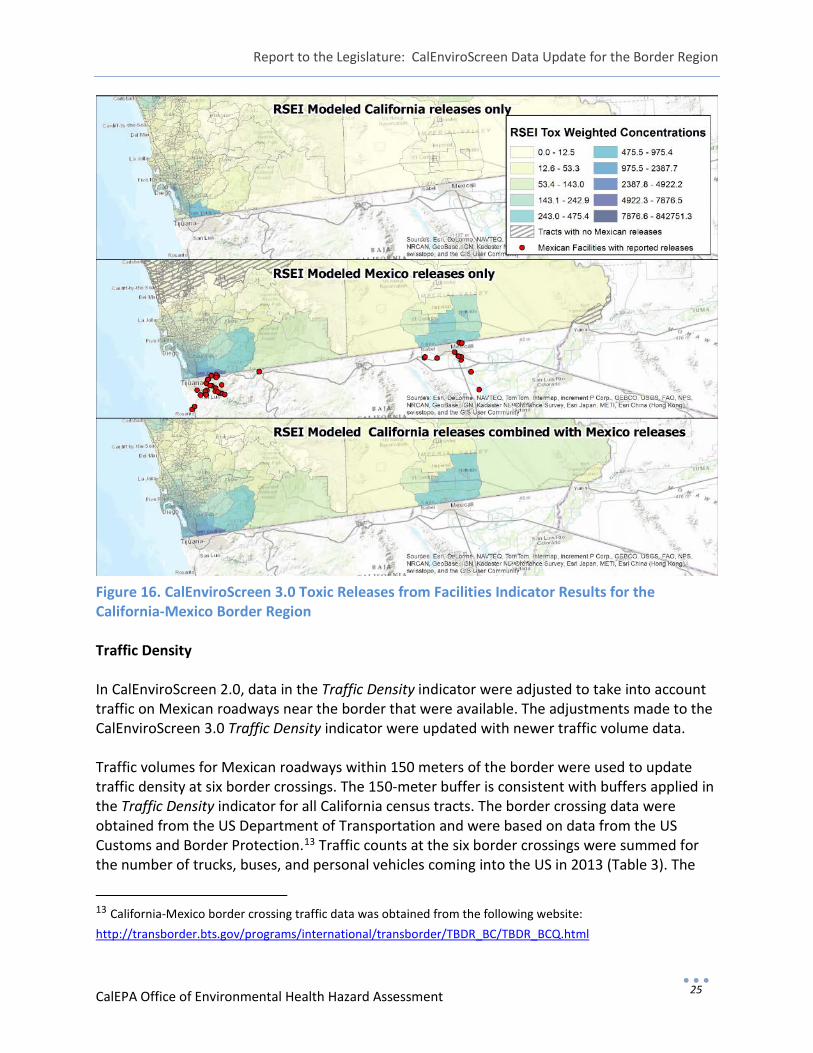
toxic air emissions data from both the Mexican RETC and California TRI datasets for the years 2011-2013. Facilities in Mexico within 49 kilometers of the California-Mexico border region that report air emissions in the RETC database were included in CalEnviroScreen 3.0. The chosen distance of 49 kilometers identifies the greatest distance that emitted chemicals could travel from a high (200-meter) stack under the most stable atmospheric conditions, based on an analysis conducted by Abt Associates. The Mexico RETC database did not specify whether the releases were from stacks or at ground level. Ground-level emissions would result in higher concentrations close to the facility, while emissions from stacks would travel farther. For each Mexican facility within 49 kilometers of the border, Abt Associates modeled expected concentrations of toxic emissions in border census tracts from smokestacks and from ground-level emissions. An average of the two combined modeling results were used in the CalEnviroScreen toxic-releases indicator. Prior to providing Mexico’s RETC dataset to Abt Associates to perform RSEI modeling, OEHHA investigated the quality of the RETC emissions data by comparing types of air emissions for each facility process reported in RETC to similar types of facility processes reported in US EPA’s TRI. The South Coast Air Quality Management District (SCAQMD) reviewed this comparison and provided feedback. SCAQMD noted no concerns with the types of air releases and quantities reported in the RETC dataset. Additional data quality checks included the accuracy of the facility locations using Google Earth Pro. Some locations were adjusted accordingly. The inclusion of Mexico’s RETC dataset better characterizes binational pollutant impacts on California communities near the California-Mexico border region (Figure 16).
Report to the Legislature: CalEnviroScreen Data Update for the Border Region
CalEPA Office of Environmental Health Hazard Assessment 25
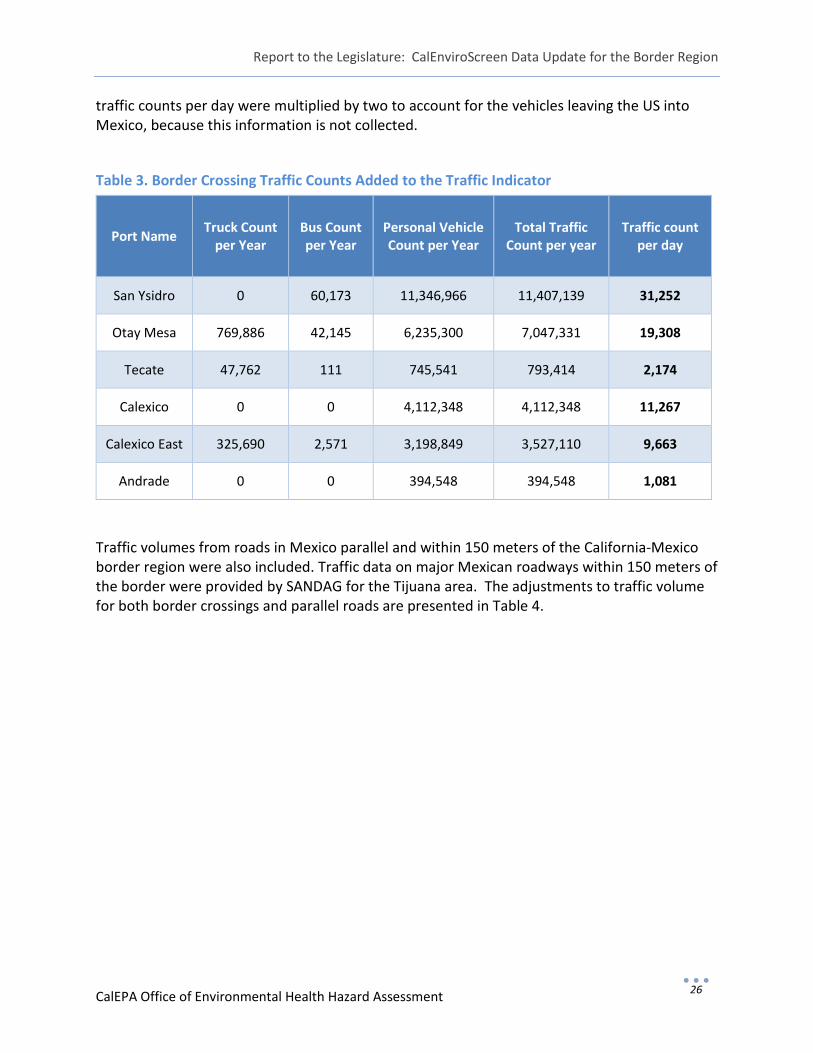
Figure 16. CalEnviroScreen 3.0 Toxic Releases from Facilities Indicator Results for the California-Mexico Border Region Traffic Density In CalEnviroScreen 2.0, data in the Traffic Density indicator were adjusted to take into account traffic on Mexican roadways near the border that were available. The adjustments made to the CalEnviroScreen 3.0 Traffic Density indicator were updated with newer traffic volume data. Traffic volumes for Mexican roadways within 150 meters of the border were used to update traffic density at six border crossings. The 150-meter buffer is consistent with buffers applied in the Traffic Density indicator for all California census tracts. The border crossing data were obtained from the US Department of Transportation and were based on data from the US Customs and Border Protection.13 Traffic counts at the six border crossings were summed for the number of trucks, buses, and personal vehicles coming into the US in 2013 (Table 3). The
13 California-Mexico border crossing traffic data was obtained from the following website: http://transborder.bts.gov/programs/international/transborder/TBDR_BC/TBDR_BCQ.html
Report to the Legislature: CalEnviroScreen Data Update for the Border Region
CalEPA Office of Environmental Health Hazard Assessment 26
traffic counts per day were multiplied by two to account for the vehicles leaving the US into Mexico, because this information is not collected. Table 3. Border Crossing Traffic Counts Added to the Traffic Indicator
Port Name Truck Count per Year
Bus Count per Year
Personal Vehicle Count per Year
Total Traffic Count per year
Traffic count per day
San Ysidro 0 60,173 11,346,966 11,407,139 31,252
Otay Mesa 769,886 42,145 6,235,300 7,047,331 19,308
Tecate 47,762 111 745,541 793,414 2,174
Calexico 0 0 4,112,348 4,112,348 11,267
Calexico East 325,690 2,571 3,198,849 3,527,110 9,663
Andrade 0 0 394,548 394,548 1,081
Traffic volumes from roads in Mexico parallel and within 150 meters of the California-Mexico border region were also included. Traffic data on major Mexican roadways within 150 meters of the border were provided by SANDAG for the Tijuana area. The adjustments to traffic volume for both border crossings and parallel roads are presented in Table 4.
Report to the Legislature: CalEnviroScreen Data Update for the Border Region
CalEPA Office of Environmental Health Hazard Assessment 27
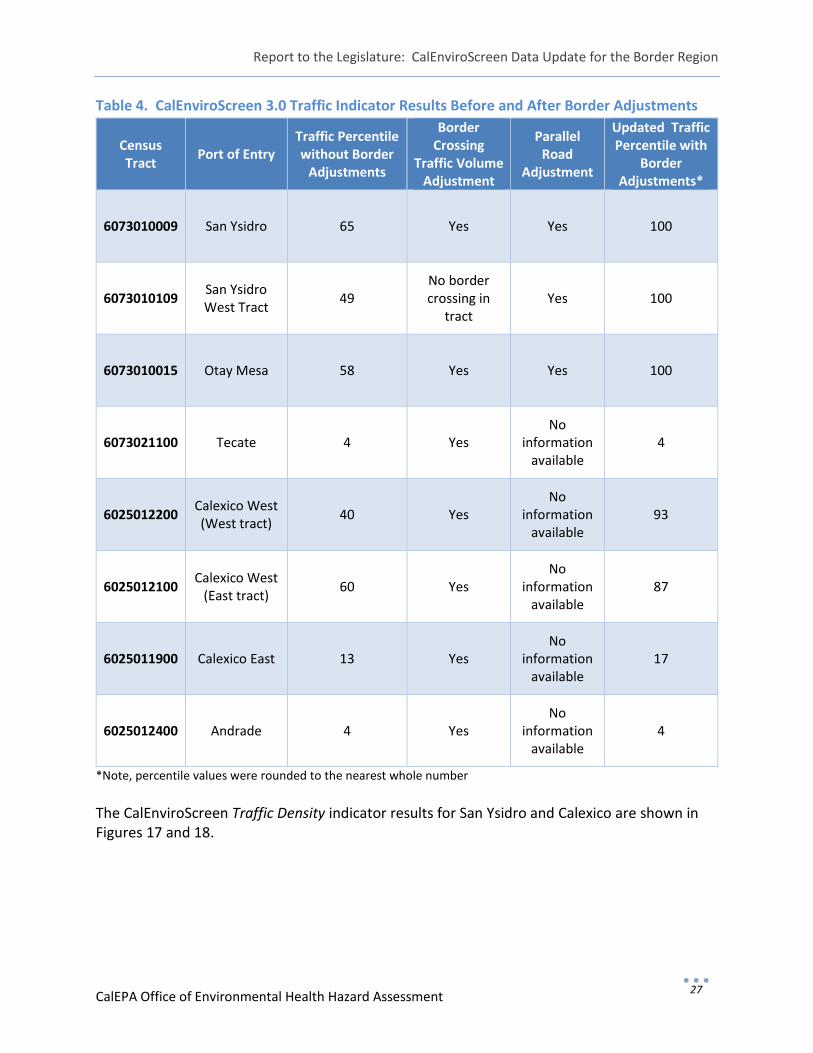
Table 4. CalEnviroScreen 3.0 Traffic Indicator Results Before and After Border Adjustments
Census Tract Port of Entry
Traffic Percentile without Border
Adjustments
Border Crossing
Traffic Volume Adjustment
Parallel Road
Adjustment
Updated Traffic Percentile with
Border Adjustments*
6073010009 San Ysidro 65 Yes Yes 100
6073010109 San Ysidro West Tract 49
No border crossing in
tract Yes 100
6073010015 Otay Mesa 58 Yes Yes 100
6073021100 Tecate 4 Yes No
information available
4
6025012200 Calexico West (West tract) 40 Yes
No information
available 93
6025012100 Calexico West (East tract) 60 Yes
No information
available 87
6025011900 Calexico East 13 Yes No
information available
17
6025012400 Andrade 4 Yes No
information available
4
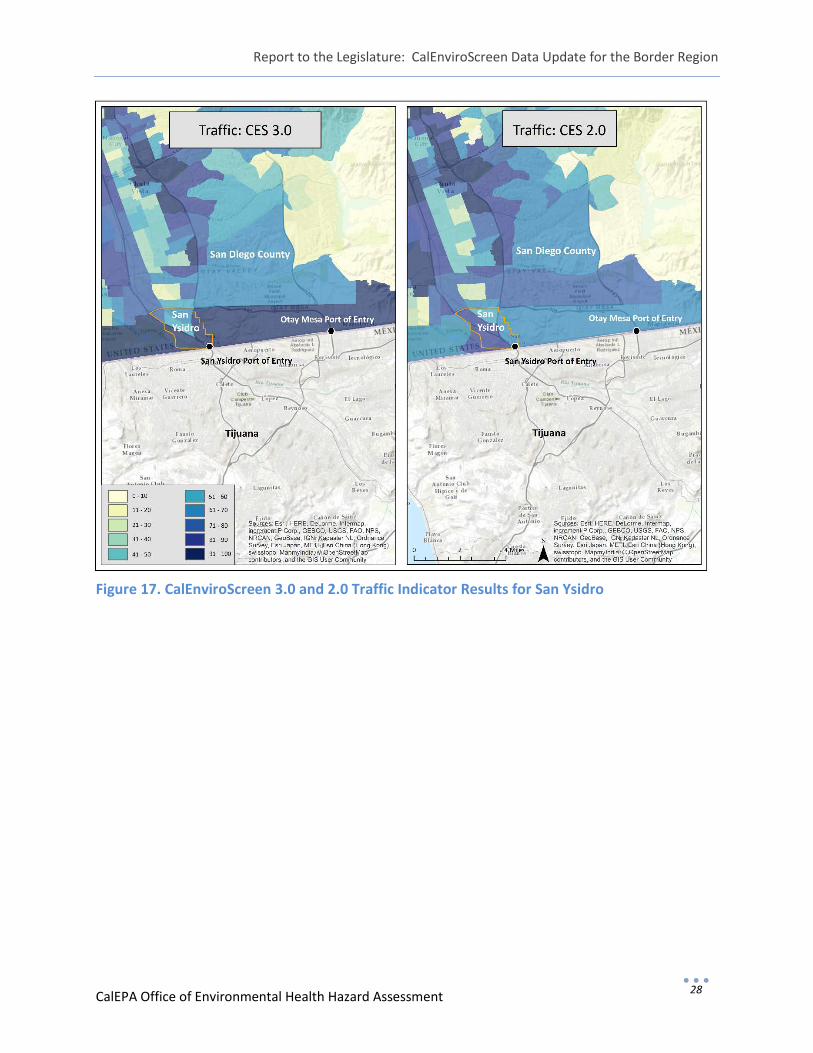
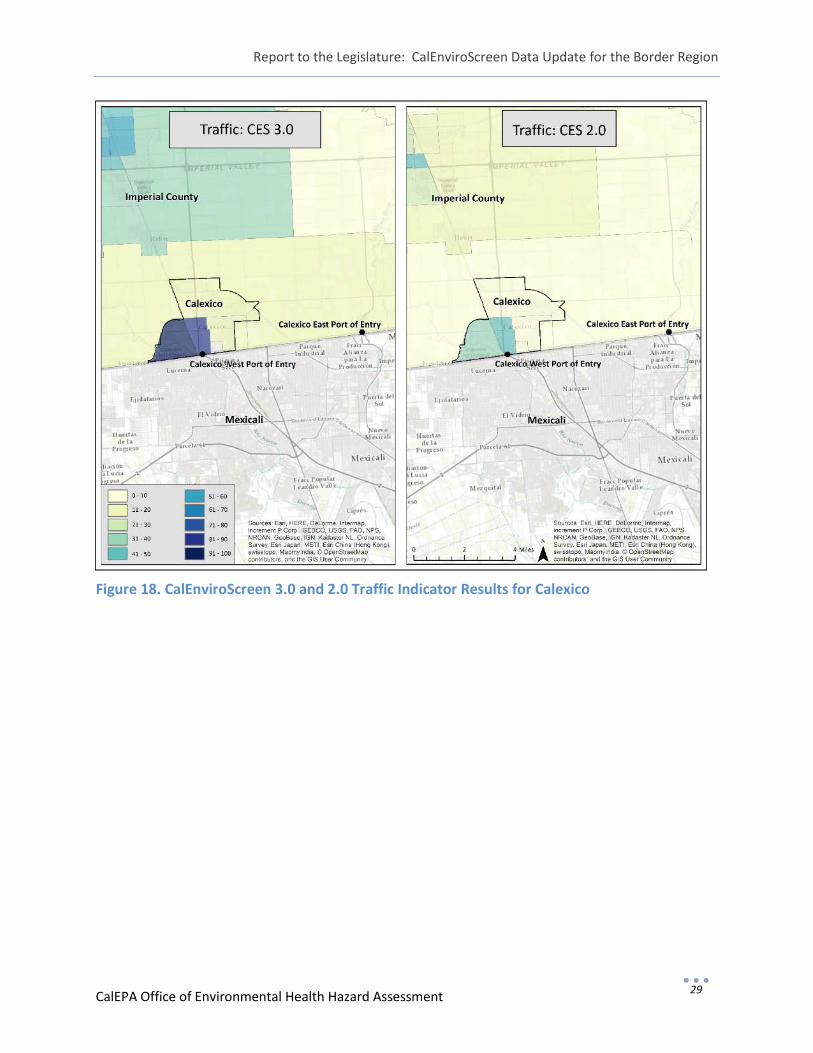
*Note, percentile values were rounded to the nearest whole number The CalEnviroScreen Traffic Density indicator results for San Ysidro and Calexico are shown in Figures 17 and 18.
Report to the Legislature: CalEnviroScreen Data Update for the Border Region
CalEPA Office of Environmental Health Hazard Assessment 28
Figure 17. CalEnviroScreen 3.0 and 2.0 Traffic Indicator Results for San Ysidro
Report to the Legislature: CalEnviroScreen Data Update for the Border Region
CalEPA Office of Environmental Health Hazard Assessment 29
Figure 18. CalEnviroScreen 3.0 and 2.0 Traffic Indicator Results for Calexico
Report to the Legislature: CalEnviroScreen Data Update for the Border Region
CalEPA Office of Environmental Health Hazard Assessment 30
VI Deficiencies in and Barriers to Accessing Data Overall, substantial improvements were made in CalEnviroScreen 3.0 to account for cross-border pollution impacts. However, some barriers and limitations were encountered in these efforts, particularly for the following CalEnviroScreen 3.0 indicators. PM2.5 (Fine Particulate Matter) Data from two new PM2.5 monitors located near the border in San Ysidro and Otay Mesa were included in CalEnviroScreen 3.0. However, to improve characterization of cross-border air pollution at California border communities, a dense network of air monitors at these communities is needed. OEHHA has funded a two-year air monitoring study in San Ysidro to address this concern (more information below). There is a similar study in Imperial County that could also provide additional data. This still leaves PM2.5 data gaps for the community adjacent to Tecate because there are no PM2.5 air monitors in that community. Diesel Particulate Matter Diesel particulate emissions estimates for CalEnviroScreen are generated using an on-road and non-road emissions inventory, however, no corresponding inventory exists with data on Mexican sources of DPM emissions. DPM emission impacts from airports are included in CalEnviroScreen and represent less than 1% of California DPM emissions. Ground support equipment at airports are the source of DPM emissions. CARB investigated the potential of including DPM emissions from the Tijuana and Mexicali airports. It was determined that DPM emission contributions from these two locations were likely to be relatively small and would not substantially affect results, and therefore no adjustments were made. Air monitoring data for NOx to estimate DPM concentrations at the Tijuana and Mexicali airport could help to inform adjustments to the DPM emissions estimates for the border areas near these airports. Traffic Density Traffic volumes for two major parallel roadways in Tijuana 150 meters south of the California-Mexico border were included in CalEnviroScreen 3.0. Efforts were made to locate data for major parallel roads in Mexicali without success. OEHHA attempted to obtain data from Mexicali’s Municipal Public Administration (Ayuntamiento de Mexicali)14, which collects traffic counts through an independent contractor with the city. However, the traffic data have not yet been made available. 14 The Municipal Public Administration website: http://www.mexicali.gob.mx/xxi/pages/gobierno.php
Report to the Legislature: CalEnviroScreen Data Update for the Border Region
CalEPA Office of Environmental Health Hazard Assessment 31
Colorado River
All-American
CanalMain Canals Lateral
Canals
Agricultural, Industrial, Non-
potable residential use
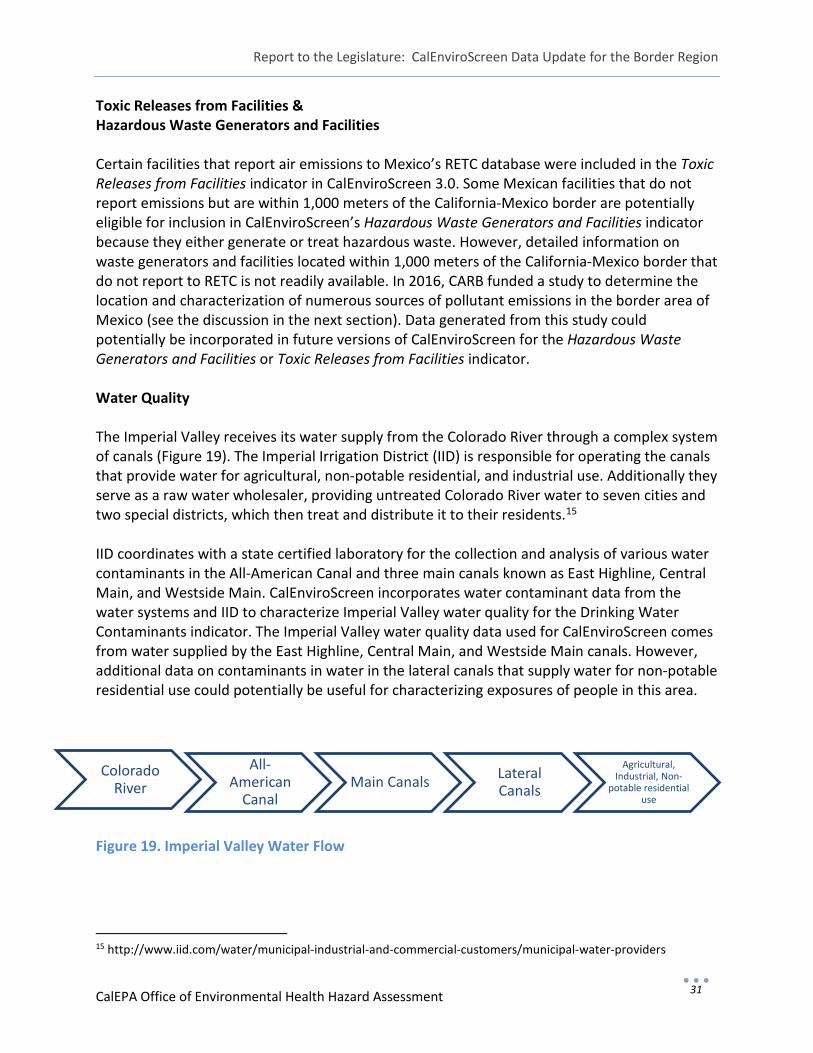
Toxic Releases from Facilities & Hazardous Waste Generators and Facilities Certain facilities that report air emissions to Mexico’s RETC database were included in the Toxic Releases from Facilities indicator in CalEnviroScreen 3.0. Some Mexican facilities that do not report emissions but are within 1,000 meters of the California-Mexico border are potentially eligible for inclusion in CalEnviroScreen’s Hazardous Waste Generators and Facilities indicator because they either generate or treat hazardous waste. However, detailed information on waste generators and facilities located within 1,000 meters of the California-Mexico border that do not report to RETC is not readily available. In 2016, CARB funded a study to determine the location and characterization of numerous sources of pollutant emissions in the border area of Mexico (see the discussion in the next section). Data generated from this study could potentially be incorporated in future versions of CalEnviroScreen for the Hazardous Waste Generators and Facilities or Toxic Releases from Facilities indicator. Water Quality The Imperial Valley receives its water supply from the Colorado River through a complex system of canals (Figure 19). The Imperial Irrigation District (IID) is responsible for operating the canals that provide water for agricultural, non-potable residential, and industrial use. Additionally they serve as a raw water wholesaler, providing untreated Colorado River water to seven cities and two special districts, which then treat and distribute it to their residents.15 IID coordinates with a state certified laboratory for the collection and analysis of various water contaminants in the All-American Canal and three main canals known as East Highline, Central Main, and Westside Main. CalEnviroScreen incorporates water contaminant data from the water systems and IID to characterize Imperial Valley water quality for the Drinking Water Contaminants indicator. The Imperial Valley water quality data used for CalEnviroScreen comes from water supplied by the East Highline, Central Main, and Westside Main canals. However, additional data on contaminants in water in the lateral canals that supply water for non-potable residential use could potentially be useful for characterizing exposures of people in this area. Figure 19. Imperial Valley Water Flow
15 http://www.iid.com/water/municipal-industrial-and-commercial-customers/municipal-water-providers
Report to the Legislature: CalEnviroScreen Data Update for the Border Region
CalEPA Office of Environmental Health Hazard Assessment 32
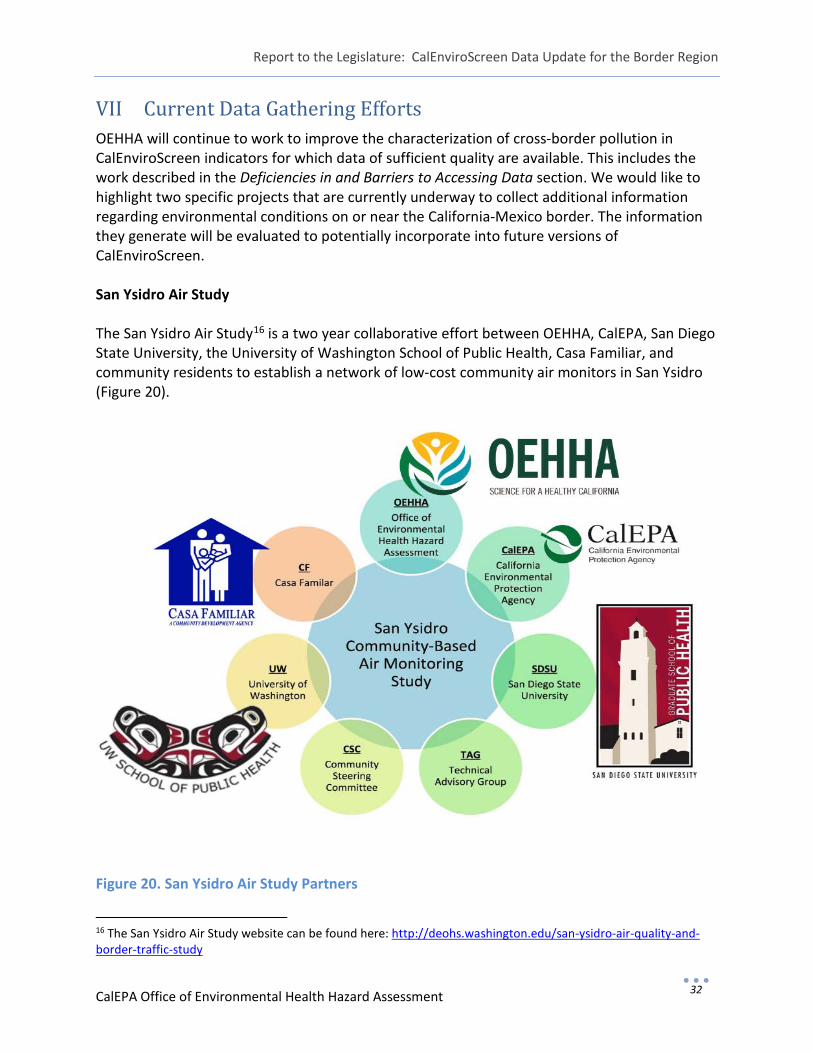
VII Current Data Gathering Efforts OEHHA will continue to work to improve the characterization of cross-border pollution in CalEnviroScreen indicators for which data of sufficient quality are available. This includes the work described in the Deficiencies in and Barriers to Accessing Data section. We would like to highlight two specific projects that are currently underway to collect additional information regarding environmental conditions on or near the California-Mexico border. The information they generate will be evaluated to potentially incorporate into future versions of CalEnviroScreen. San Ysidro Air Study The San Ysidro Air Study16 is a two year collaborative effort between OEHHA, CalEPA, San Diego State University, the University of Washington School of Public Health, Casa Familiar, and community residents to establish a network of low-cost community air monitors in San Ysidro (Figure 20).
Figure 20. San Ysidro Air Study Partners
16 The San Ysidro Air Study website can be found here: http://deohs.washington.edu/san-ysidro-air-quality-and-border-traffic-study
Report to the Legislature: CalEnviroScreen Data Update for the Border Region
CalEPA Office of Environmental Health Hazard Assessment 33
Air quality data provided by the network of monitors will capture air pollution at a neighborhood scale, which in turn can provide air pollution data on the border region for CalEnviroScreen. These data can also inform future efforts to reduce impacts in this region. OEHHA has funded this two-year community-led study to improve air quality characterization for CalEnviroScreen. Overall, the goals of the study include:
• Assessing community needs and concerns • Utilizing regulatory monitoring data, research instruments, and next-generation low-
cost sensors to assess air quality for one year • Developing capacity to continue data collection • Supporting ongoing improvements in public health • Providing data for CalEnviroScreen
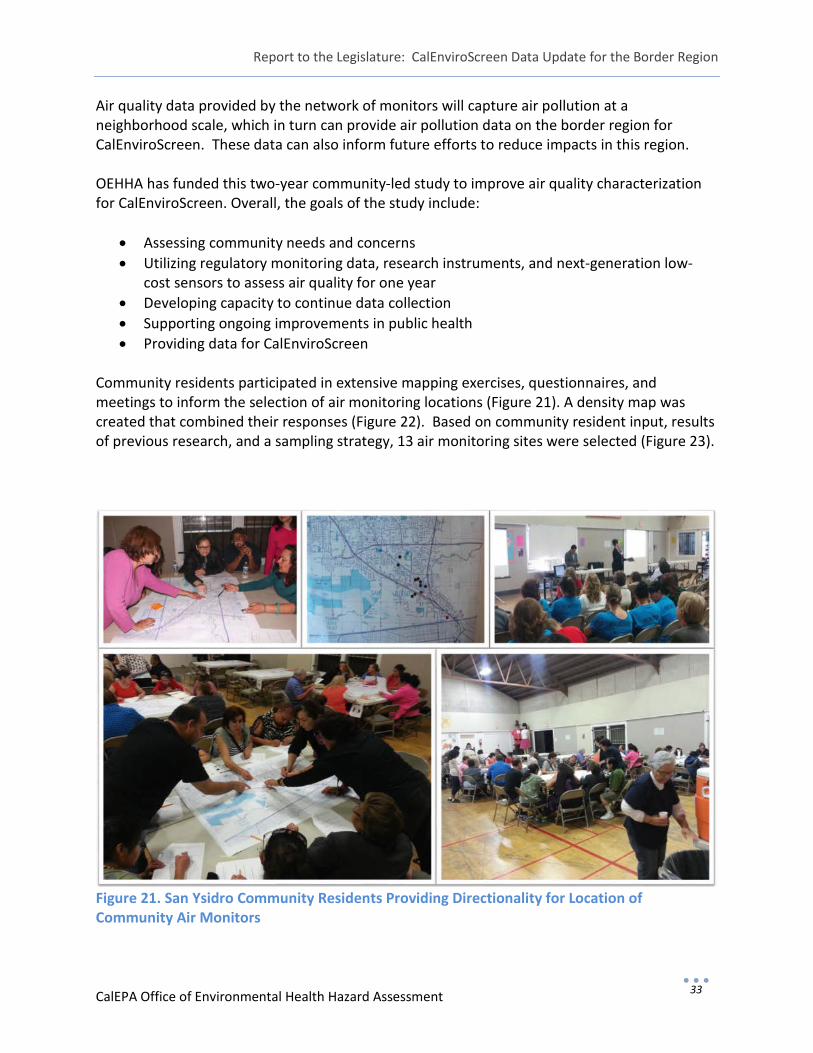
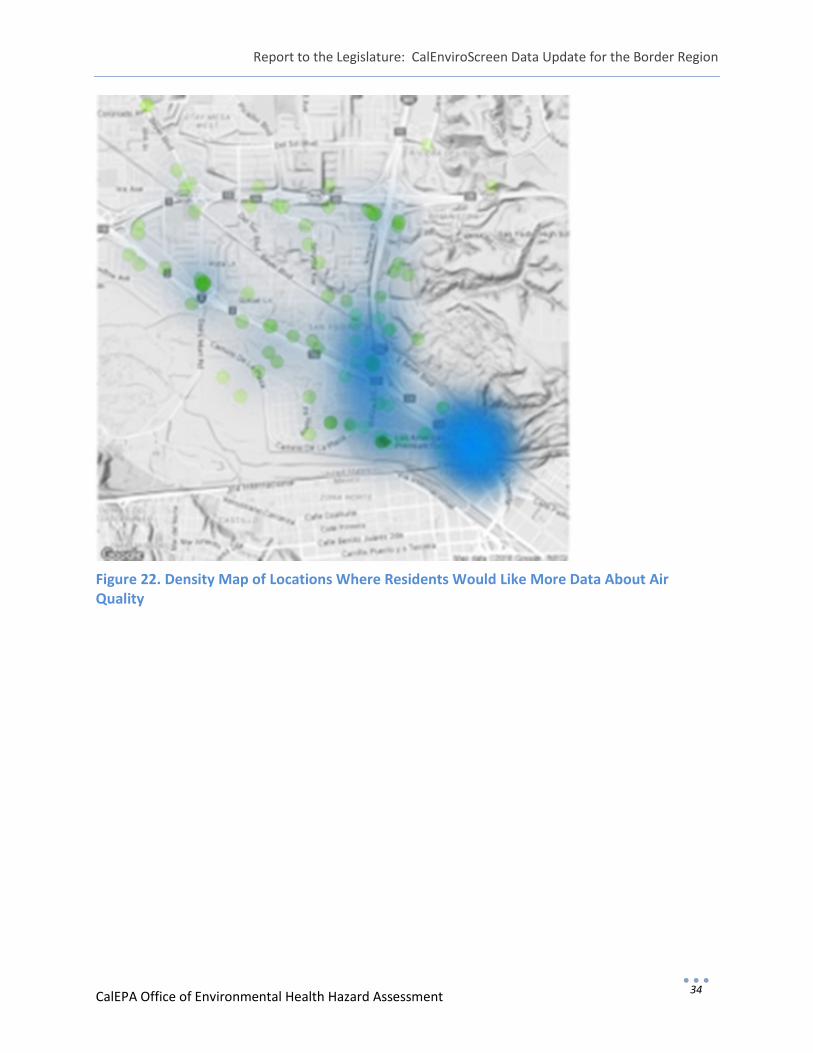
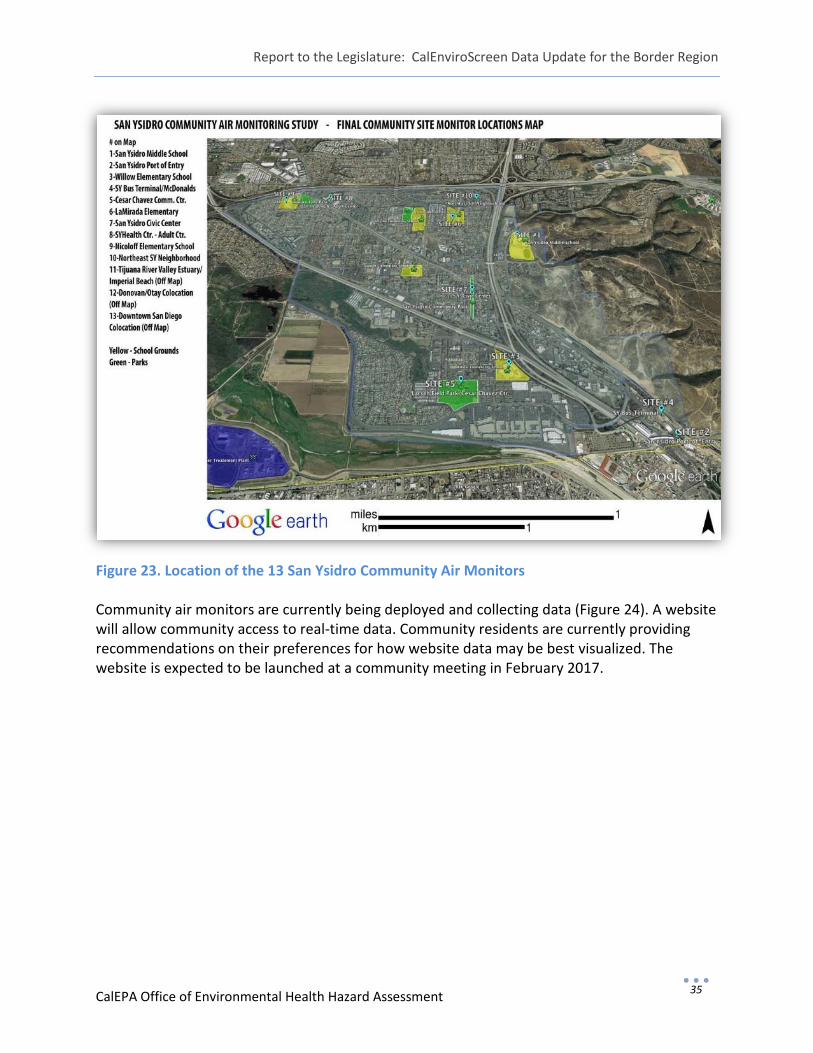
Community residents participated in extensive mapping exercises, questionnaires, and meetings to inform the selection of air monitoring locations (Figure 21). A density map was created that combined their responses (Figure 22). Based on community resident input, results of previous research, and a sampling strategy, 13 air monitoring sites were selected (Figure 23).
Figure 21. San Ysidro Community Residents Providing Directionality for Location of Community Air Monitors
Report to the Legislature: CalEnviroScreen Data Update for the Border Region
CalEPA Office of Environmental Health Hazard Assessment 34
Figure 22. Density Map of Locations Where Residents Would Like More Data About Air Quality
Report to the Legislature: CalEnviroScreen Data Update for the Border Region
CalEPA Office of Environmental Health Hazard Assessment 35
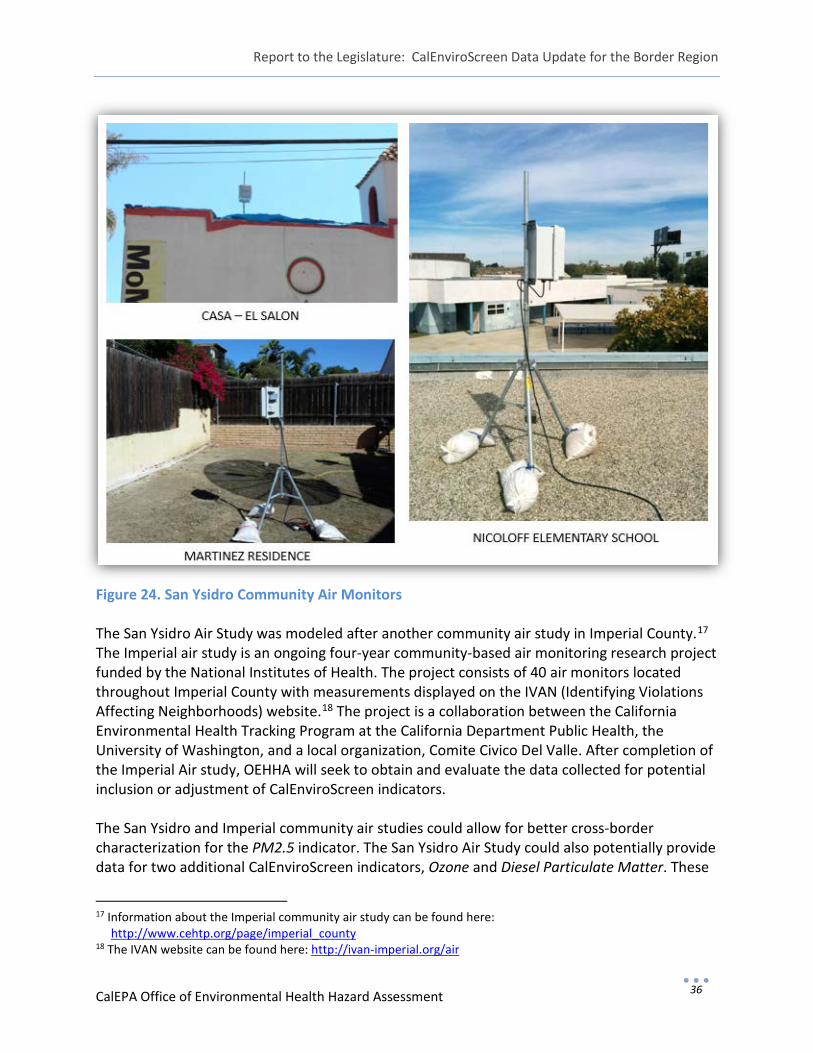
Figure 23. Location of the 13 San Ysidro Community Air Monitors Community air monitors are currently being deployed and collecting data (Figure 24). A website will allow community access to real-time data. Community residents are currently providing recommendations on their preferences for how website data may be best visualized. The website is expected to be launched at a community meeting in February 2017.
Report to the Legislature: CalEnviroScreen Data Update for the Border Region
CalEPA Office of Environmental Health Hazard Assessment 36
Figure 24. San Ysidro Community Air Monitors The San Ysidro Air Study was modeled after another community air study in Imperial County.17 The Imperial air study is an ongoing four-year community-based air monitoring research project funded by the National Institutes of Health. The project consists of 40 air monitors located throughout Imperial County with measurements displayed on the IVAN (Identifying Violations Affecting Neighborhoods) website.18 The project is a collaboration between the California Environmental Health Tracking Program at the California Department Public Health, the University of Washington, and a local organization, Comite Civico Del Valle. After completion of the Imperial Air study, OEHHA will seek to obtain and evaluate the data collected for potential inclusion or adjustment of CalEnviroScreen indicators. The San Ysidro and Imperial community air studies could allow for better cross-border characterization for the PM2.5 indicator. The San Ysidro Air Study could also potentially provide data for two additional CalEnviroScreen indicators, Ozone and Diesel Particulate Matter. These
17 Information about the Imperial community air study can be found here: http://www.cehtp.org/page/imperial_county 18 The IVAN website can be found here: http://ivan-imperial.org/air
Report to the Legislature: CalEnviroScreen Data Update for the Border Region
CalEPA Office of Environmental Health Hazard Assessment 37
studies are scheduled to end in 2017. The ongoing collection of data in these and other communities will be valuable to the understanding of localized impacts from air pollution.
Air Resources Board Research Solicitation CARB recently allocated $150,000 to fund a collaborative study to evaluate gaps in cross-border pollution data. The investigation is a collaboration including San Diego State University, Instituto de Ingeniería, Universidad Autónoma de Baja California, Molina Center for Strategic Studies in Energy and the Environment, University of California San Diego, Occidental College, University of Southern California, and University of California Berkeley. Their goal is to identify and characterize emission sources in Mexico that impact California communities. CalEnviroScreen currently includes air emissions identified in Mexico’s RETC database in the Toxic Releases from Facilities indicator. However, not all industries report their emissions. Some may not report because their emissions do not exceed Mexico’s reporting thresholds. The results of the research proposal could provide additional information on polluting facilities that are not currently captured in CalEnviroScreen. This information could potentially improve the Toxic Releases from Facilities and Hazardous Waste Generators and Facilities indicators.