calendar year 2017 quality blue hospital overview session
TRANSCRIPT

Calendar Year 2017 Quality BlueHospital Overview Session
Program Overview
CONFIDENTIAL & PROPRIETARY
1
Agenda
• Program Overview
• Quality Blue Hospital Program Components
–Quality Component
–Cost and Utilization Component
• Dashboard Reporting and Timelines
• Program Summation
• Question & Answer
2

Quality Blue Hospital Pay-For-Value Program
FY 20026 Participating Hospitals
CY 2016114 Participating Hospitals• Pennsylvania• West Virginia• New York• Delaware
CY 2017• Current participants plus
new contracts
3

CY 2017 Program Timeline
• Draft: December 15, 2016• Manual may be updated for final Quality Bundle (awaiting
final Star cut points)
Program Manual Distributed
• November 30, 2016• December 8, 2016
Program Overview Sessions
• Measurement for Cost and Utilization Component begins withdischarges 10/1/2016 through 9/30/2017 with 90 day post-discharge
Measurement begins 1/1/2017
• CY 2017 Final Dashboard Distributed: June 15, 2018• Reimbursement Notification: June 30, 2018
Final Results
4

CY 2017 Quality Blue HospitalProgram Components
5

Hospital Program Metric Update : CY 2016 to CY 2017
CY 2016 Metrics CY 2017 Metric Updates
Quality
Cost andUtilization
• Same focus; Use qualitativeassessment as reported on HospitalCompare
• Same measure- updated targets
• Healthcare associated adverse events(HAAE)– HAI (CLABSI, CAUTI, CDI);
Surgical Site Infections– VTE
• Same/ one new Star measure• Quality Bundle
• Same measure - updated targets
• Palliative Care • Same measure - updated targets
• Perinatal
• Same measure – updated targets• Readmissions
• Removed from scoring
• Added 3 episodes to Scoring• Ave. Episode Cost (Profiled)
• Follow-up Visit Within 7 Days (Innovations)
• 3-day Return to ED (Profiled)
• MSPB • Removed from Scoring
• Transition of Care Metrics(Innovations)
• Evidence Care Pathways (Innovations)
(Pneumonia, COPD, Major Joints)
6
• Removed from scoring
• Removed from scoring
• Added to scoring

Claims Based Methodology
• Federal Employee Program (FEP) Members in WPA, NEPA, WVand DE Markets included.
• Blue Card Home (Highmark) claims are included but Blue CardHost (other Blue Plans) claims are excluded in all Market areas.
• Primary and Secondary coverage is included.
Commercial and Medicare Advantage products are included.
• Must be accurate and timely (in accordance with industry billingclaims standards) for inclusion in program measurement.
• To assure that claims are included in yearend processing, claimswill need to be submitted by January 31, 2018.
Claims submission
• Masthead documentation provided in “Hospital Component andQuality Bundle Masthead Measure Guide."
• Hospitals may not have access to all data available to recreatemeasurement.
• Highmark leverages NCQA HEDIS (and its licensed vendors) toresult program components. Certain detail may not be included inmastheads due to complexity or propriety limitations.
Technical Specifications
7
Minimizes data collection burden and refocus on process activities to ultimatelyachieve better outcomes.

CY2017 Minimum Denominators• Quality Metrics: 25 qualifying events (denominator) are needed for the
metric to be applicable for scoring at year-end.• Cost and Utilization: Minimum denominator volumes for each Population
and each episode (COPD, Major Joint Replacement of Lower Extremities,Simple Pneumonia) will need 10 episodes in either Commercial orMedicare Advantage to be scored.
• Quality Bundle: Minimum denominator volumes for individual qualitymeasures is set at 10.
o Interim program year reporting will provide preliminary scores without regard tovolume.
o If at year end, an individual metric does not have the required denominator volume,a hospital will not be held accountable for the score for that metric.
8

Quality Component (70 Points)
• Quality Bundle• Readmissions• Healthcare Associated Adverse Events• Palliative Care• Perinatal• 3-Day Return to the Emergency Department
9

Quality Bundle – 10 points
Metrics
Scoring:Bonus Points
Scoring: AggregateStar Rating
• Continue to focus on the care continuum, improvingpatient health and outcomes for hospitals/health systemswith employed physician practices
• Aggregate performance for hospital/health systememployed physician practices on 17 CMS Stars metrics
• Measured on Calendar year Jan through Dec 2017• Final 2017 Star measures & cut-points pending; will
update program when released in early 2017
Potential bonus points are included:
> 4.01-4.50 Star: 2 Bonus
> 4.51-5.00 Star: 5 Bonus
10
POINTS 10 7 2 0
Aggregate
Quality Bundle
Score
(17 metrics)
> 4.0> 3.75
< 4.0
> 3.5
< 3.75< 3.5

Example: Aggregate Star Rating Calculation
All Hospital/Health System practices’ numerators and denominators for each measure areadded together to assess the aggregated Star rating.
Weight
C01=1.0 WeightC02=1.0 WeightC07=1.0 WeightC15 =3.0 WeightD12= 3.0 Weight
Total=9.0 Weight
Performance
C01=3 StarsC02=4 StarsC07=2 StarsC15=4 StarsD12=5 Stars
Total=18 Stars
Result
3 Weighted Stars4 Weighted Stars2 Weighted Stars
12 Weighted Stars15 Weighted Stars
Total=36 Weighted Stars
36 Weighted Stars 9.0 Weighting4.0 Aggregate
Rating
• Determine aggregated performance with each Star measure• Multiply by weight of each measure to determine achieved weighted Stars• Divide total weighted Stars achieved (numerator) /sum of total weight applicable
(Denominator) to calculate hospital/health system Aggregate Star Rating.
11

Readmissions – 25 points
Metrics
Scoring
• All cause –unplanned 30 day Readmission (NCQA-HEDIS national metric). (NQF 1768)
• Medicare Advantage and Commercial resulted separately
MedicareAdvantage
Commercial
Points 12.5 12.5
Scored Year Endperformance
Year Endperformance
ScoredPeriod
Jan- Dec 2017 Jan-Dec 2017
• Performance thresholds established at absolutetargets
12

Readmission Metric Scoring
Acute Care Hospitals Medicare Advantage (non-Specialty Hospitals)
Acute Care Hospitals Commercial (non-Specialty Hospitals)
13
POINTS 12.5 8 4 030 day all-causeUnplannedReadmissions:MedicareAdvantage
< 11.97% > 11.97%< 13.24%
> 13.24. %< 14.63 %
> 14.63%
HighmarkQuality BluePercentile
70th 55th 35th < 35th
POINTS 12.5 8 4 0
30 day all-causeUnplannedReadmissions:Commercial
< 6.17%> 6.17%< 7.20%
> 7.20%< 8.87%
> 8.87%
HighmarkQuality BluePercentile
70th 55th 35th < 35th

Readmission Metric ScoringSpecialty Care Hospitals (Medicare Advantage)
Specialty Care Hospitals (Commercial)
14
POINTS 12.5 8 4 0Index HospitalizationVolumes less than 50Readmission Volumes:Medicare Advantage
ZeroReadmits
1Readmit
2Readmits
>2Readmits
Index HospitalizationVolumes > than 50Readmission Volumes:Medicare Advantage
Zero,1 Readmit
2,3 Readmits 4,5 Readmits >5 Readmits
POINTS 12.5 8 4 0Index HospitalizationVolumes less than 50Readmission Volumes:Commercial
ZeroReadmits
1Readmit
2Readmits
>2Readmits
Index HospitalizationVolumes > than 50Readmission Volumes:Commercial
Zero,1 Readmit
2 Readmits 3 Readmits >3Readmits

HAAE: HAI – 8 pointsData will be pulled from CMS Hospital Compare*
CLABSI HAI_1_SIR
CAUTI HAI_2_SIR
Clostridium difficile LabID-CDI HAI_6_SIR
SSI: Colon HAI_3_SIR
SSI: Hysterectomy HAI_4_SIR
Metrics
Scoring
CLABSI CAUTI LabID-CDI
SSI:Colon
SSI:Hyster-ectomy
Max Points 2 2 2 1 1
Measurementperiod
Data reported in alignment with HospitalCompare
Data.medicare.gov 3/31/2018
15
• Surveillance definitions: align with CDC-NHSN classifications andCMS Inpatient Quality Reporting requirements
• *https://data.medicare.gov/data/hospital-compare

16
HAI – Hospital Comparehttps://data.medicare.gov/data/hospital-compare

17
HAI: Scoring
POINTSCDI Lab ID
HAI_6_SIR
CLABSI
HAI_1_SIR
CAUTI
HAI_2_SIR
SSI:
Colon
HAI_3_SIR
SSI:
Hysterectomy
HAI_4_SIR
2 Better than National Benchmark
1 No different than National Benchmark Better than National Benchmark
0 Worse than National Benchmark
No different than National
Benchmark
Or
Worse than National Benchmark

HAI: Hospital Compare Data
• Highmark will pull data from CMS Hospital Compare on the followingdates for inclusion in the Quarterly dashboards and preliminary scoringreports.
18
CDC-NHSN Performance Data
from CMS included for
Dashboards
Hospital CMS Hospital Compare
Data for Inclusion with
Dashboard
REPORT DELIVERY DATE
CMS established rolling time
period for reportingApril 25, 2017 June 15, 2017
CMS established rolling time
period for reportingJuly 25, 2017 September 15, 2017
CMS established rolling time
period for reportingOctober 26, 2017 December 15, 2017
CMS established rolling time
period for reportingJanuary 26, 2018 March 15, 2018
CMS established rolling time
period for reportingMarch 31,2018 June 15, 2018

HAAE:VTE – 2 pointsDVT or PE rate per 100 surgical procedures for index
hospitalization and 30 day post discharge with return toED, OBS, or acute care admissions
AHRQ Patient Safety Indicator # 12: PerioperativePulmonary Embolism or Deep Vein Thrombosis(secondary diagnosis) for surgical discharges patients.
Metric
Scoring
Scoring Time period: January –December 2017• Max points for combined index and outpatient VTE rate of
less than or equal to 0.66 per 100 procedures• Reduction in points for higher occurrences
19
Scoring Methodology Benchmark/Scoring
Threshold
POINTS Percentile
VTE rate per 100
procedures
< 0.66% 2 55th
> 0.66% < 1.02% 1 35th
Less than or equal to 1 VTE
occurrence
Occurrence: ≤ 1 VTE 2

Palliative Care Consults for Complex Patients –5 points
Palliative Care consultation rate for patients with life-limitingor life threatening conditions with an Inpatient admission
Consults provided 2 weeks prior to admission and twoweeks post discharge will be captured as compliant (ICD-10code Z51.5)
AIS Home Visit enrollment within the Program Year will becompliant (Medicare Advantage)
All hospitals (with the exception of Specialty Care Hospitals)will be scored:
> 100 inpatient licensed beds – Commercial and MedicareAdvantage combined rate< 100 inpatient licensed beds- Medicare Advantage population
Metric
Scoring
• Scored measurement period (Jan – Dec. 2017)
20
Palliative Care
Consult RatePOINTS Percentile
> 17.22% 5 70th
> 13.18 < 17.22% 3 55th
> 8.33 < 13.18% 2 35th
< 8.33% 0 < 35th

Perinatal – 10 points
• AHRQ IQI 33: Primary Cesarean Delivery Rate, Uncomplicated
• Percentage of Low-risk birth women who deliver by CesareandeliveryMetric
Scoring
• Hospitals are scored compared to the overall Highmarkperformance; rates ≤ 13.33% achieve max points
• Measurement: January-December 2017
21
C-Section Rate – Primary,
UncomplicatedPOINTS Percentile
≤ 13.33% 10 70th
>13.33 % ≤ 14.29% 8 55th
>14.29% ≤ 17.46% 5 35th
>17.46 % 0 <35th

3-Day Return to ED – 10 points
Metrics
Scoring
• Previously profiled in CY 2016• Calculates rates of return to an Emergency Department
within 3 days for any reason following anotheremergency department discharge
• Medicare Advantage and Commercial resulted separately
MedicareAdvantage
Commercial
Points 5 5
Scored Year Endperformance
Year Endperformance
ScoredPeriod
Jan- Dec 2017 Jan-Dec 2017
• Performance thresholds established at absolutetargets
22

3-day Return to ED Metric Scoring
Medicare Advantage
Commercial
23
3-day Return to ED
(Medicare Advantage)
POINTS PERCENTILE
< 4.91% 5 70th
>4.91% < 5.56% 3 55th
>5.56% < 6.67% 1 35th
>6.67% 0 < 35th
3-day Return to ED
(Commercial)
POINTS PERCENTILE
< 4.54% 5 70th
>4.54% < 4.76% 3 55th
> 4.76% < 5.15% 1 35th
>5.15% 0 < 35th

Cost/Utilization Component (30 Points)
Average Episode of Care Costs
24

Average Episode of Care Costs Scoring - 30 points
Metrics
Scoring
Major Joints COPD SimplePneumonia
Points 20 5 5
Scored Year-End Episode Composite RelativeEfficiency Score (Medicare Advantage andCommercial combined)
ScoredPeriod
Episodes with discharges Oct 2016-Sept2017, capturing costs 90 days post-discharge
25
• Previously profiled in CY2016• Major Joint Replacement of the Lower Extremities
composite relative efficiency score• COPD, Bronchitis, and Asthma episode composite
relative efficiency score• Simple Pneumonia and respiratory infections composite
relative efficiency score

Average Episode of Care Costs• Episodes “begin” with a discharge for the following DRGs and capture cost for 90
days post discharge
• The Average Episode of Care Costs for a hospital is calculated in alignment with theCMS Bundled Payment Care Improvement (“BPCI”) Model 2 specifications. TheCMS list of episode-specific exclusions for both inpatient and post-dischargeamounts is used for determining cost allowed totals.
• Costs incurred for all allowed amounts from episode start date to end date (90 dayspost discharge) are included:• total cost associated with initial inpatient facility cost allowed• readmission cost• post-acute facility admission allowed amount• outpatient facility allowed amount• all professional provider allowed amounts.
26
EPISODE DRGs for Highmark MembersMajor Joint Replacement of the Lowerextremity
0469 0470
Chronic obstructive pulmonary disease,bronchitis, asthma
0190 0191 0192 0202 0203
Simple pneumonia and respiratoryinfections
0177 0178 0179 0193 01940195

Sample: Average Episode of Care Costs Reporting
• Relative efficiency score: comparisonbetween a hospital’s cost and thesame average costs of care for thesame episode in a Hospital’s Marketarea
• Individual episodes are scoredcombining an aggregated weightedaverage of the Medicare Advantageand Commercial Populations todetermine the Composite RelativeEfficiency Score for an episode
27

Calculate Episode Composite Relative Efficiency Score
28
Step 1: Determine Hospital and Market Average Episode of care costs forpatient populations (Medicare Advantage and/or Commercial)
Step 2: Add together:
• Hospital’s Commercial Population average episode cost multiplied by theHospital’s Commercial Episode volume +
• Hospital’s Medicare Advantage Population average episode costmultiplied by the Hospital’s Medicare Advantage Episode volume
Step 3: Add together:
• Market Commercial average episode of care costs multiplied by the Hospital’sCommercial Episode volume +
• Market Medicare Advantage average episode of care costs multiplied by theHospital’s Medicare Advantage Episode volume
Step 4: Composite Relative Efficiency Score is equal to Step 2 Resultdivided by Step 3 Result

Composite Relative Efficiency Score Illustrative Calculation
MedicareAdvantage
Commercial
Hospital Volume
$25,000
Market AverageEpisode Cost
Hospital AverageEpisode Cost
250
100
$24,000
$25,000$26,000
Composite Relative Efficiency Score :
[($24,000 * 250) + ($25,000 * 100)] / [(250 * $25,000) + (100 * $26,000)] =
8,500,000/8,850,000 = 0.96
Composite Relative Efficiency Score:
< 0.95 Full Points
> 0.95 < 1.10 Partial Proportional Points (Sliding Scale)
> 1.10 = Zero Points
8,500,000/8,850,000 = 0.96
Example: Calculating Composite Relative Efficiency Score
29

Episode Scoring
30
Relative Efficiency Score Points
< 0.95 20
>0.95 < 1.10 [(1.10 –relative efficiency score)/ 0.15] * 20 =Points awarded
>1.10 0
Scoring: Major Joint Replacement of the Lower Extremities Relative Efficiency Score
Scoring: COPD and Simple Pneumonia
Relative EfficiencyScore
Points
< 0.95 5
>0.95 < 1.10 [(1.10 –relative efficiency score)/ 0.15] * 5 = Pointsawarded
>1.10 0
[(1.10 – 0.96)/ 0.15] * 20 = 18.7 points awarded Major Joint Replacement ofthe Lower Extremities
Composite Relative Efficiency Score Illustrative Calculation (cont)

Quality BlueCY 2017 Dashboard Reporting Timelines and
Program Scoring
31

CY2017 Program Reporting Timeline
32
Preliminary Performance Reports
Monthly: Patient Level Detail Report for mostQuality metrics, Average Episode of Care Costs
Monthly: Aggregate Quality Bundle rating
Quarterly: Dashboards with preliminaryScore at each release
Final Dashboard and Patient LevelDetail Report
Notification: AssociatedReimbursement

Program Reporting Timelines
33
Reports Report Frequency RUN-OUT
REPORT DELIVERYDATE
1 Quality Bundle Report Monthly None3rd week following end of
prior month
2Patient Level Detail Hospital Component
Report Monthly None3rd week following end of
prior month
3 Hospital Component Dashboard Report Quarterly None
June 15, 2017September 15, 2017December 15, 2017
March 15, 2018
4 Preliminary Score Report Quarterly None
June 15, 2017September 15, 2017December 15, 2017
March 15, 2018
5Final Program Results : Quality Bundle
and Hospital Component Report Once3
monthsJune 15, 2018
6Final Patient Level Detail Hospital
Component Report
Once 3months
June 15, 2018
7 Final Program Results: Score Once3
MonthsJune 15, 2018
8 Distribution of Achieved Reimbursement Once June 30, 2018
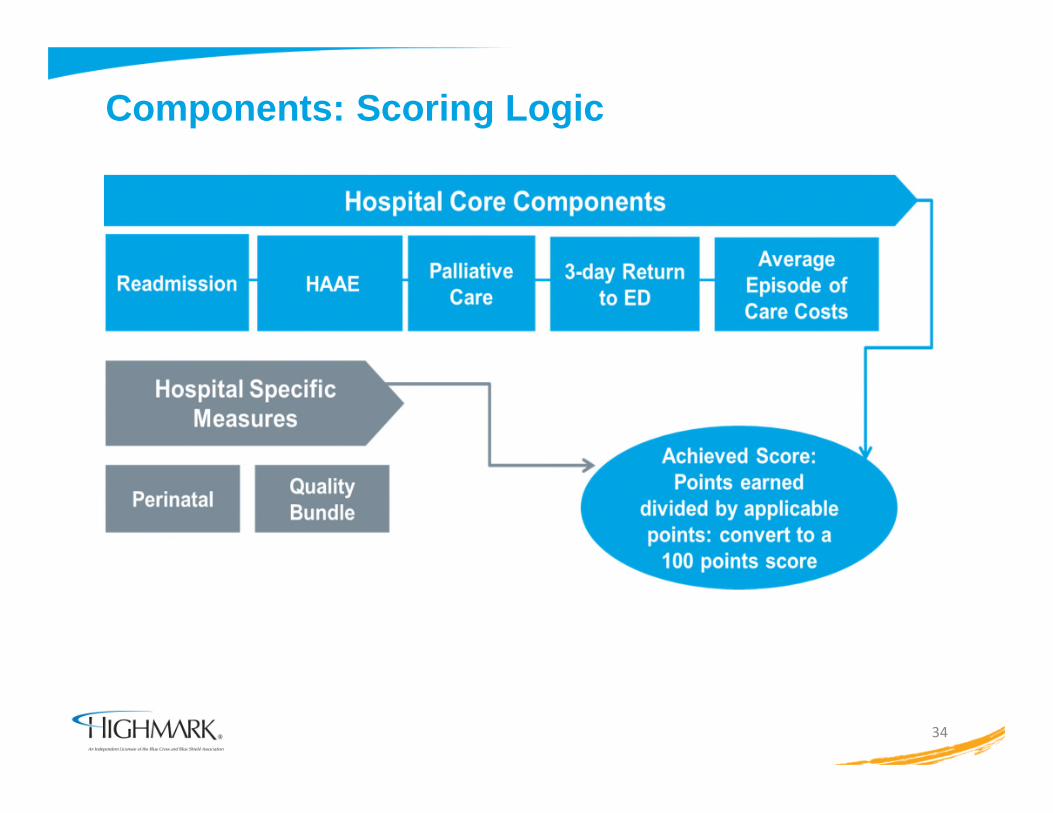
Components: Scoring Logic
34

CY 2017 Point Distribution for Core/ApplicableComponents
35
10
25
82
5
10 10
30
0
5
10
15
20
25
30
35
• If Bonus points achieved, will be added with all achieved points and divided by total applicablepoints to determine overall score
• Bonus Point Potential for Quality Bundle aggregate Star rating > 4.01

Example: Overall Program ScoringPoints achieved are divided by applicable points; convert to overallpercentage to align with reimbursement
36
Metric Max points Achieved
Participant
ABC Score :
66/90
X 100 =
73.33%
overall score
= 73%
Quality Bundle: Aggregate Star
Score
10 10
Bonus Points 5
Readmissions 25 16
HAAE 10 5
Perinatal NA
Palliative Care Consults 5 5
3-Day Return to ED 10 5
Average Episode of Care Costs 30 20
Total 90 66

Overall Scoring and Associated Quality Blue ContractAmendment Reimbursement
• Maximum reimbursement> 70 -100%
• Mid-level reimbursement> 55 and < 70%
• Minimum reimbursement> 40 and < 55%
• No Quality Blue Reimbursement< 40%
37

Program Summation
38

Engagement
Contact your Hospital Provider Relations Representative (Provider
Account Liaison) or Clinical Transformation Consultant with questions
Engage your teams by sharing program materials inclusive of program
manual, dashboard reports, reporting timeframe, and results achieved
Acknowledgement through a survey that your hospital
• Attended an overview session for CY 2017
• Received Program materials
• You know who to contact (Highmark Clinical Transformation Consultant
and/or Provider Relations Representative) to assist with any questions
regarding the program
– Access the Survey at:
http://survey.constantcontact.com/survey/a07eddhysnwiuody30s/start
39

CY 2017 Quality Blue Hospital Major Milestones
• CY 2017 Programming continues to keep focus on the care continuum to improvepatient health and outcomes
• Program continues to align with national industry evidence based practices toimprove healthcare quality
ProgramManual
Distribution12/15/16
1st Qtr.Reports
distributed6/15/17
Final CY 2017Program
outcomesReport
distributed6/2018
CY 2017 QBHospitalOverviewSessions
40
January 2017Patient leveldetail ReportDistribution
2/2017

SAVE THE DATEFUTURE OPEN MIC SESSIONS
Open Mic Schedule to follow
41

Question & Answer?
42