calculation and communication of meat consumption in … · calculation and communication of meat...
TRANSCRIPT
2017-10-04
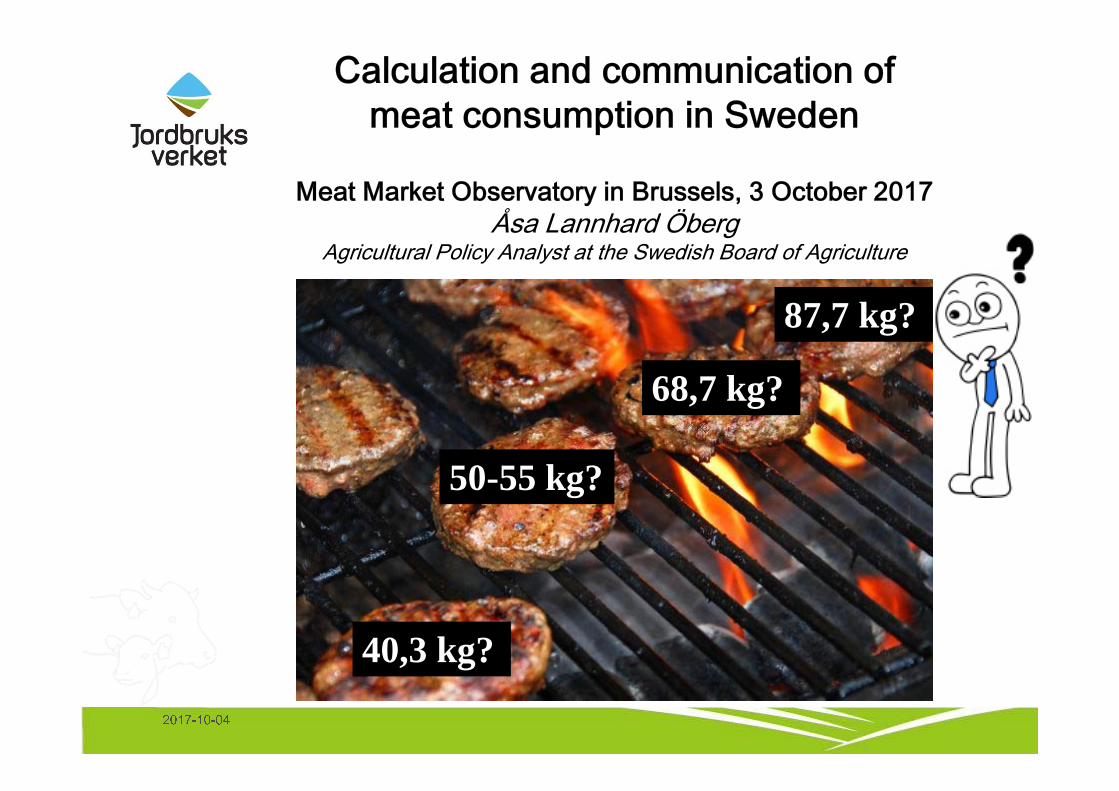
Calculation and communication of
meat consumption in Sweden
Meat Market Observatory in Brussels, 3 October 2017
Åsa Lannhard Öberg Agricultural Policy Analyst at the Swedish Board of Agriculture
87,7 kg?
50-55 kg?40,3 kg?
69 kg?
40,3 kg?
68,7 kg?
87,7 kg?
50-55 kg?
2017-10-04
Before we go into the
details of meat
consumption, some
basic facts about the
Swedish meat market…
…which also answers
the question why it is so
important to have good
information about our
meat consumption!
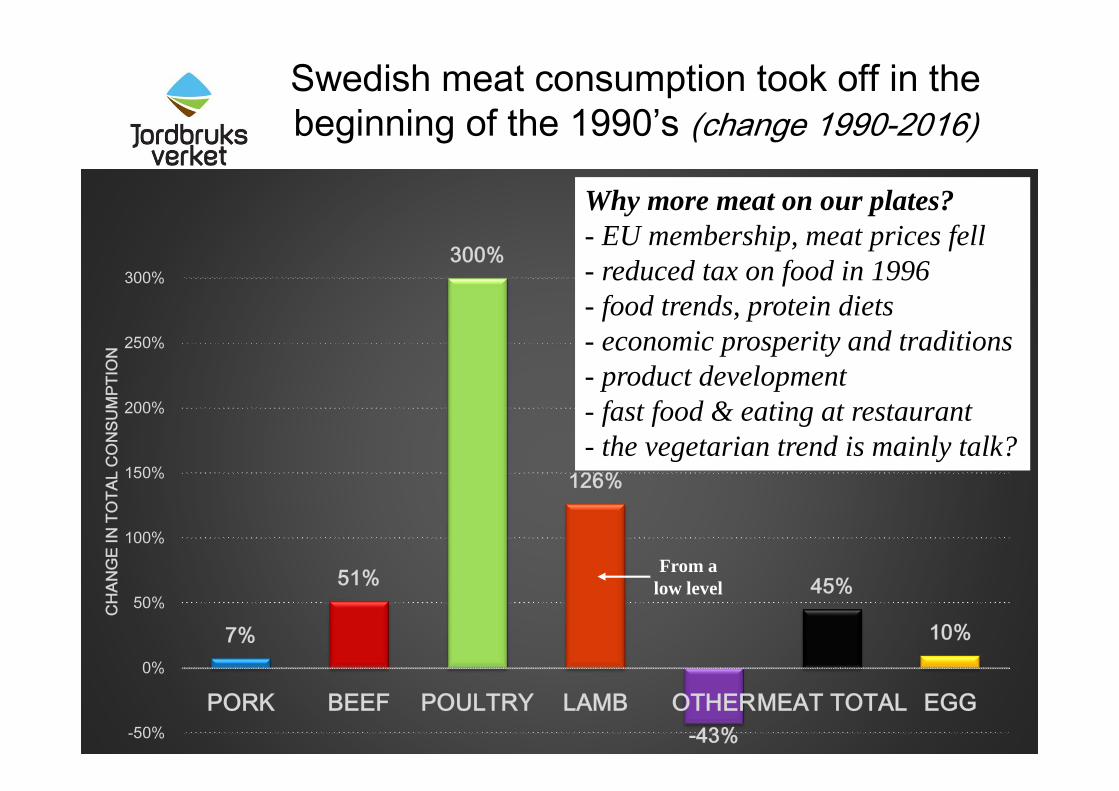
Swedish meat consumption took off in the
beginning of the 1990’s (change 1990-2016)
2017-10-04
7%
51%
300%
126%
-43%
45%
10%
-50%
0%
50%
100%
150%
200%
250%
300%
PORK BEEF POULTRY LAMB OTHERMEAT TOTAL EGG
CH
AN
GE
IN
TO
TA
L C
ON
SU
MP
TIO
N
Why more meat on our plates?- EU membership, meat prices fell- reduced tax on food in 1996- food trends, protein diets- economic prosperity and traditions- product development- fast food & eating at restaurant- the vegetarian trend is mainly talk?
From a low level
2017-10-04
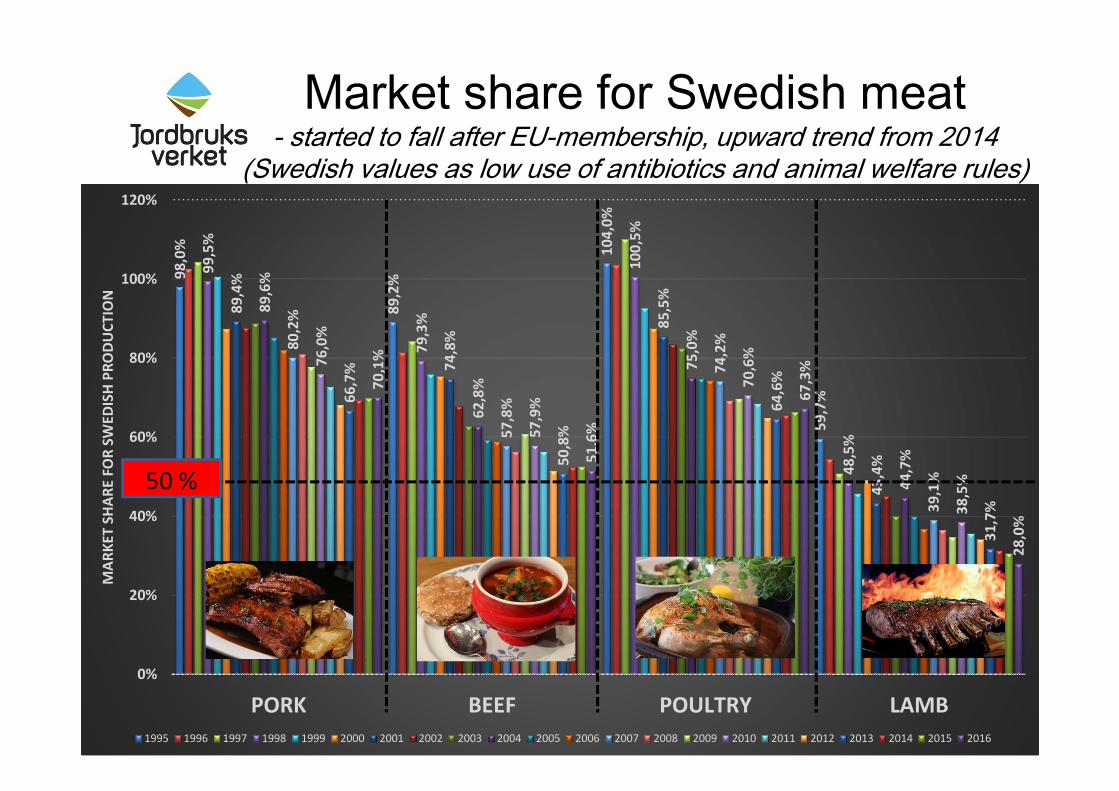
Market share for Swedish meat- started to fall after EU-membership, upward trend from 2014
(Swedish values as low use of antibiotics and animal welfare rules)98
,0%
89,2
%
104,
0%
59,7
%
99,5
%
79,3
%
100,
5%
48,5
%
89,4
%
74,8
%
85,5
%
43,4
%
89,6
%
62,8
%
75,0
%
44,7
%
80,2
%
57,8
%
74,2
%
39,1
%
76,0
%
57,9
%
70,6
%
38,5
%
66,7
%
50,8
%
64,6
%
31,7
%
70,1
%
51,6
%
67,3
%
28,0
%
0%
20%
40%
60%
80%
100%
120%
PORK BEEF POULTRY LAMB
MAR
KET
SHAR
EFO
R SW
EDIS
HPR
ODU
CTIO
N
1995 1996 1997 1998 1999 2000 2001 2002 2003 2004 2005 2006 2007 2008 2009 2010 2011 2012 2013 2014 2015 2016
50 %
2017-10-04
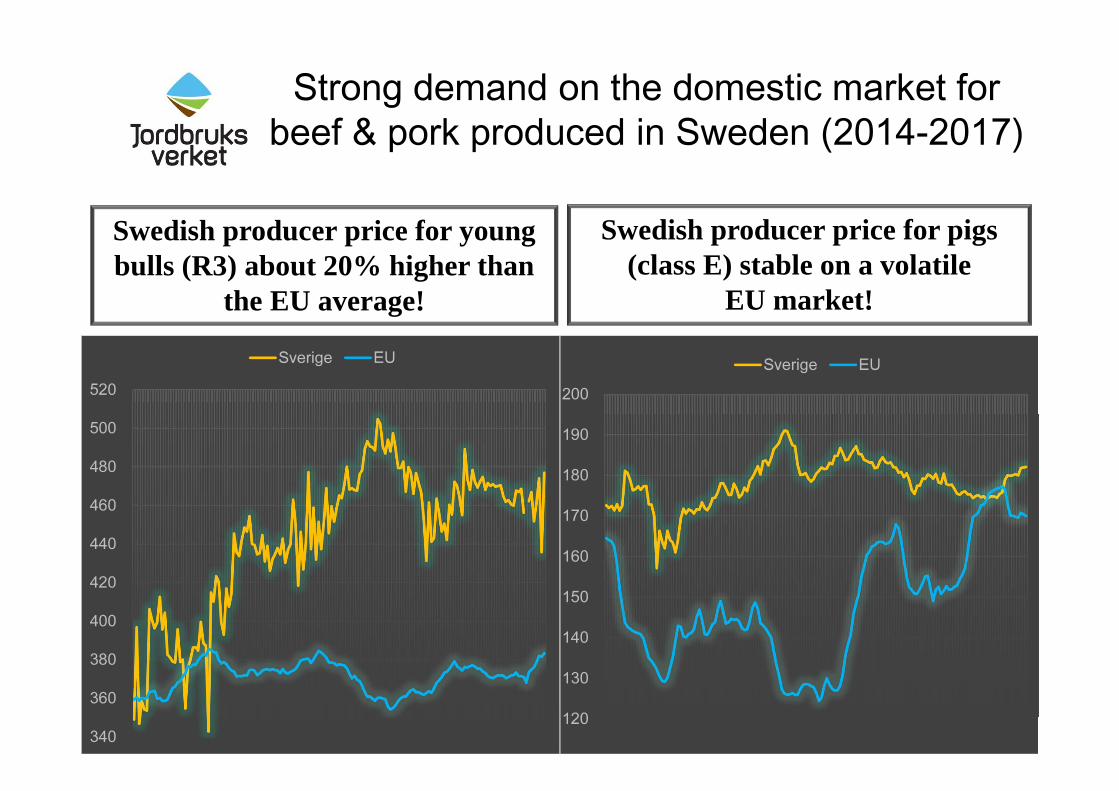
Swedish producer price for youngbulls (R3) about 20% higher than
the EU average!
Strong demand on the domestic market for
beef & pork produced in Sweden (2014-2017)
Swedish producer price for pigs(class E) stable on a volatile
EU market!
340
360
380
400
420
440
460
480
500
520
Sverige EU
120
130
140
150
160
170
180
190
200
Sverige EU
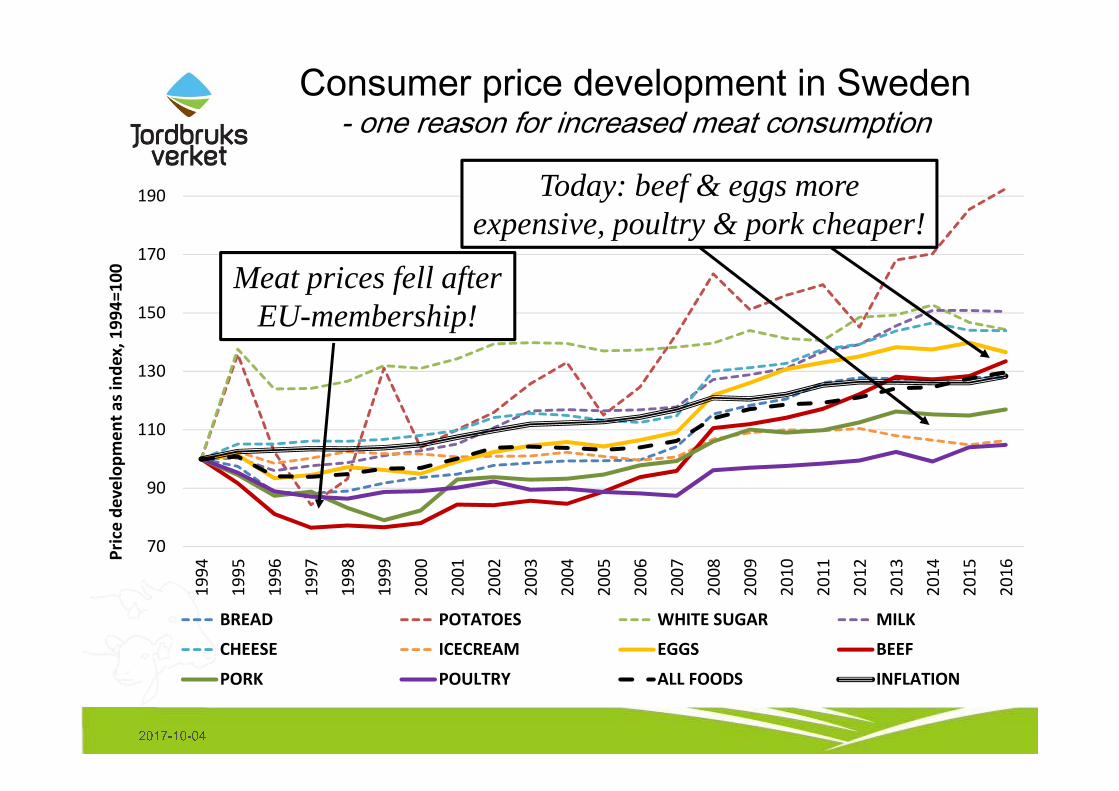
Consumer price development in Sweden - one reason for increased meat consumption
2017-10-04
70
90
110
130
150
170
19019
94
1995
1996
1997
1998
1999
2000
2001
2002
2003
2004
2005
2006
2007
2008
2009
2010
2011
2012
2013
2014
2015
2016
Pric
e de
velo
pmen
t as i
ndex
, 199
4=10
0
BREAD POTATOES WHITE SUGAR MILKCHEESE ICECREAM EGGS BEEF
PORK POULTRY ALL FOODS INFLATION
Meat prices fell afterEU-membership!
Today: beef & eggs moreexpensive, poultry & pork cheaper!
2017-10-04
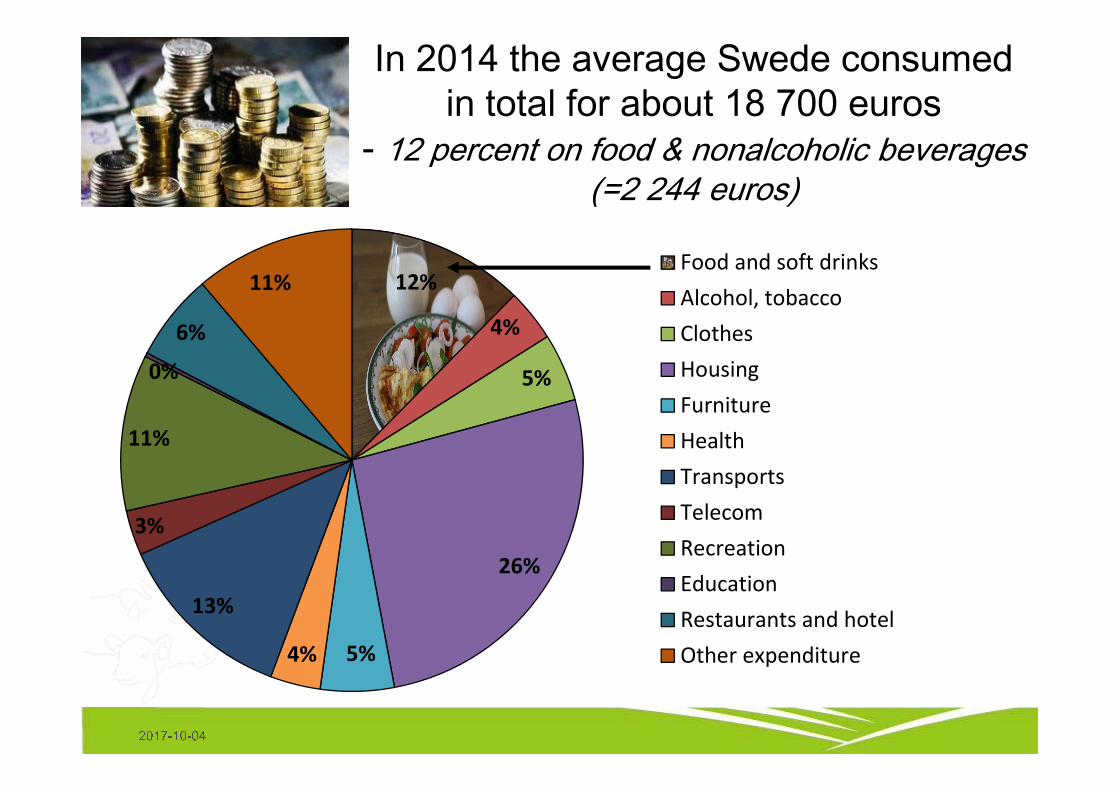
In 2014 the average Swede consumed
in total for about 18 700 euros
- 12 percent on food & nonalcoholic beverages
(=2 244 euros)
12%
4%
5%
26%
5%4%
13%
3%
11%
0%
6%
11%Food and soft drinksAlcohol, tobaccoClothesHousingFurnitureHealthTransportsTelecomRecreationEducationRestaurants and hotelOther expenditure

2017-10-04
0%
2%
4%
6%
8%
10%
12%
14%
16%
18%19
94
1995
1996
1997
1998
1999
2000
2001
2002
2003
2004
2005
2006
2007
2008
2009
2010
2011
2012
2013
2014
Expenditure on food & all beverages 1994-2014 (share per group in current prices)
Bread, grain Meat Fish Dairy, eggsOils, fats Fruit Vegetables SweetsSpices, babyfood Coffe, tea Soft drinks Alcohol
ANIMAL PRODUCTS: Relatively high prices per kgALCOHOL: High Swedish taxes
For every 10 euros of disposable income in 2014 the average Swede spent, on all consumption:
2,60 euros on housing1,30 euros on transports1,10 euros on recreation1,20 euros on food and non-alcoholic beverages
0,22 cents on meat (=2,2%)0,20 cents on dairy/eggs
0,20 cents on alcohol
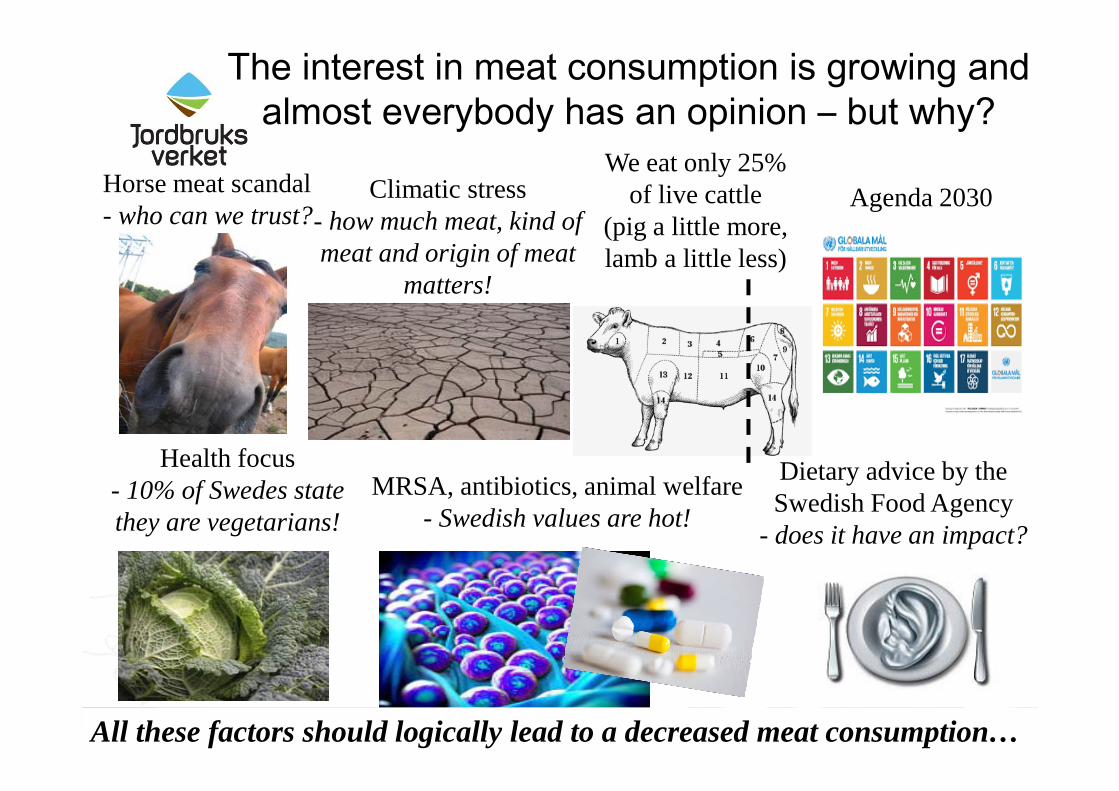
The interest in meat consumption is growing and
almost everybody has an opinion – but why?
2017-10-04
Horse meat scandal- who can we trust?
Climatic stress- how much meat, kind ofmeat and origin of meat
matters!
Agenda 2030
Health focus - 10% of Swedes statethey are vegetarians!
MRSA, antibiotics, animal welfare- Swedish values are hot!
Dietary advice by the Swedish Food Agency
- does it have an impact?
All these factors should logically lead to a decreased meat consumption…
We eat only 25% of live cattle
(pig a little more, lamb a little less)
2017-10-04
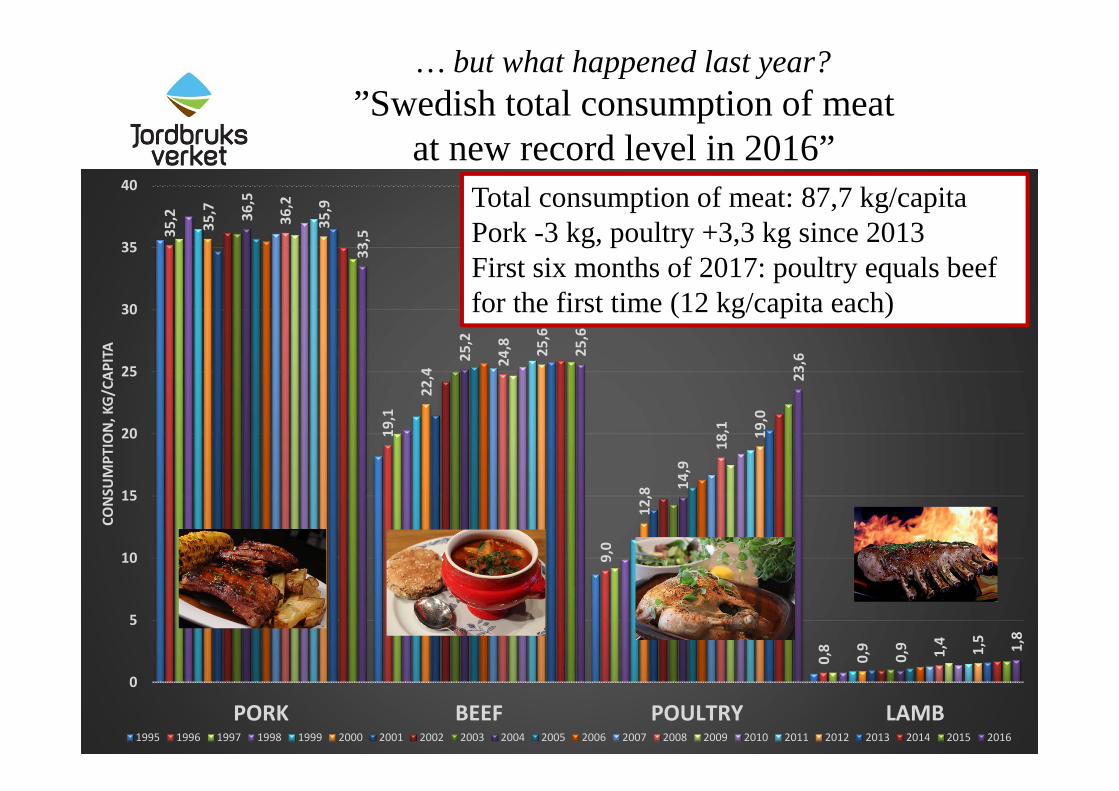
35,2
19,1
9,0
0,8
35,7
22,4
12,8
0,9
36,5
25,2
14,9
0,9
36,2
24,8
18,1
1,4
35,9
25,6
19,0
1,5
33,5
25,6
23,6
1,8
0
5
10
15
20
25
30
35
40
PORK BEEF POULTRY LAMB
CON
SUM
PTIO
N, K
G/C
APIT
A
1995 1996 1997 1998 1999 2000 2001 2002 2003 2004 2005 2006 2007 2008 2009 2010 2011 2012 2013 2014 2015 2016
Total consumption of meat: 87,7 kg/capitaPork -3 kg, poultry +3,3 kg since 2013First six months of 2017: poultry equals beeffor the first time (12 kg/capita each)
… but what happened last year?”Swedish total consumption of meat
at new record level in 2016”
2017-10-04
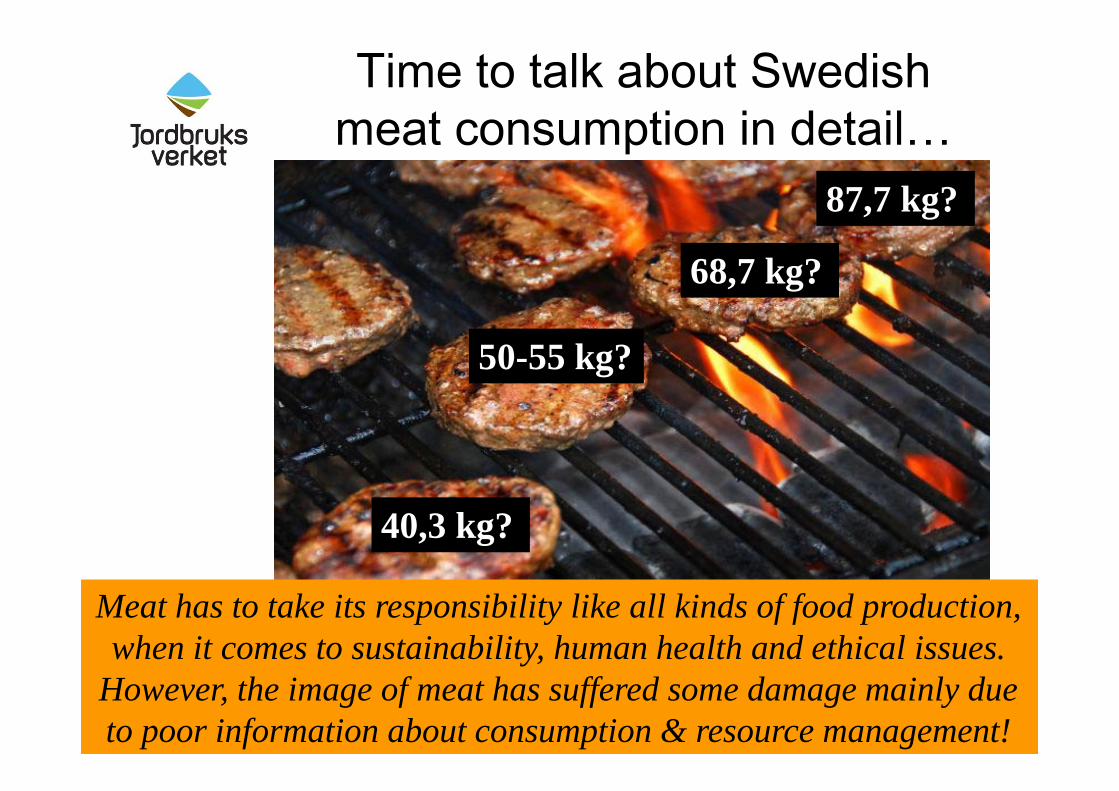
Time to talk about Swedish
meat consumption in detail…
87,7 kg?
68,7 kg?
50-55 kg?
40,3 kg?
Meat has to take its responsibility like all kinds of food production, when it comes to sustainability, human health and ethical issues.
However, the image of meat has suffered some damage mainly dueto poor information about consumption & resource management!
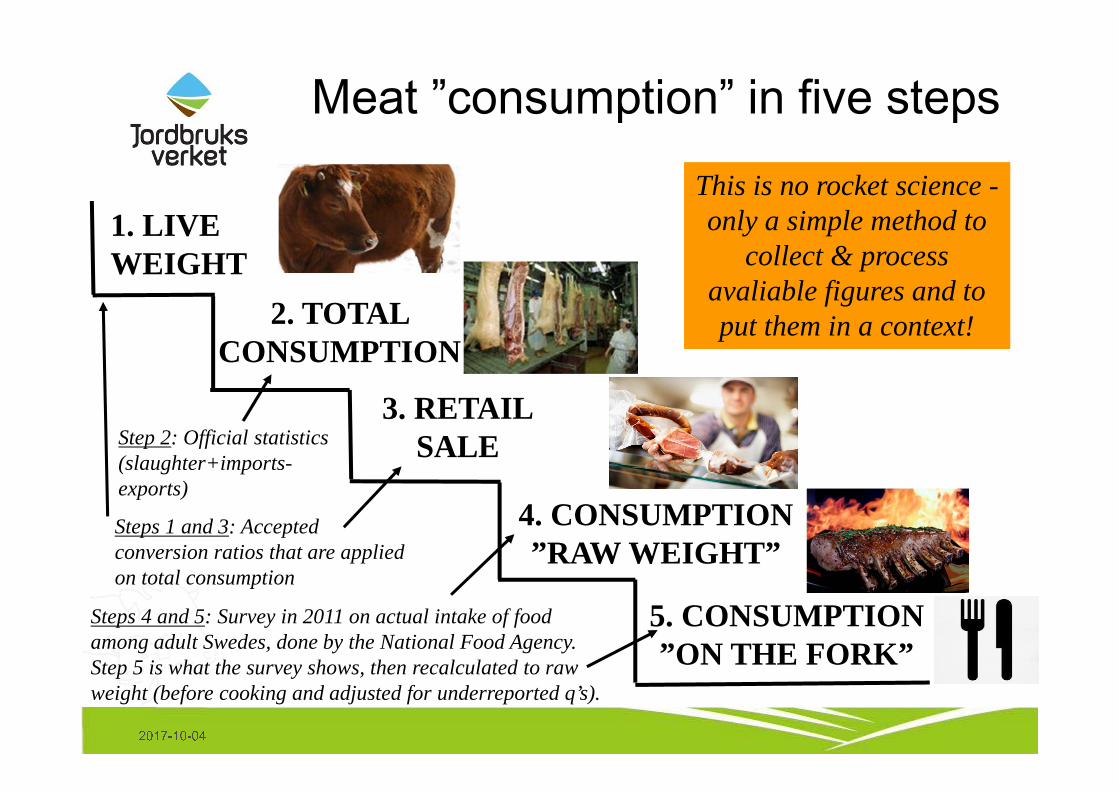
Meat ”consumption” in five steps
2017-10-04
1. LIVE WEIGHT
2. TOTAL CONSUMPTION
3. RETAILSALE
4. CONSUMPTION ”RAW WEIGHT”
5. CONSUMPTION ”ON THE FORK”
Step 2: Official statistics(slaughter+imports-exports)
Steps 4 and 5: Survey in 2011 on actual intake of foodamong adult Swedes, done by the National Food Agency. Step 5 is what the survey shows, then recalculated to rawweight (before cooking and adjusted for underreported q’s).
Steps 1 and 3: Acceptedconversion ratios that are appliedon total consumption
This is no rocket science -only a simple method to
collect & process avaliable figures and to put them in a context!
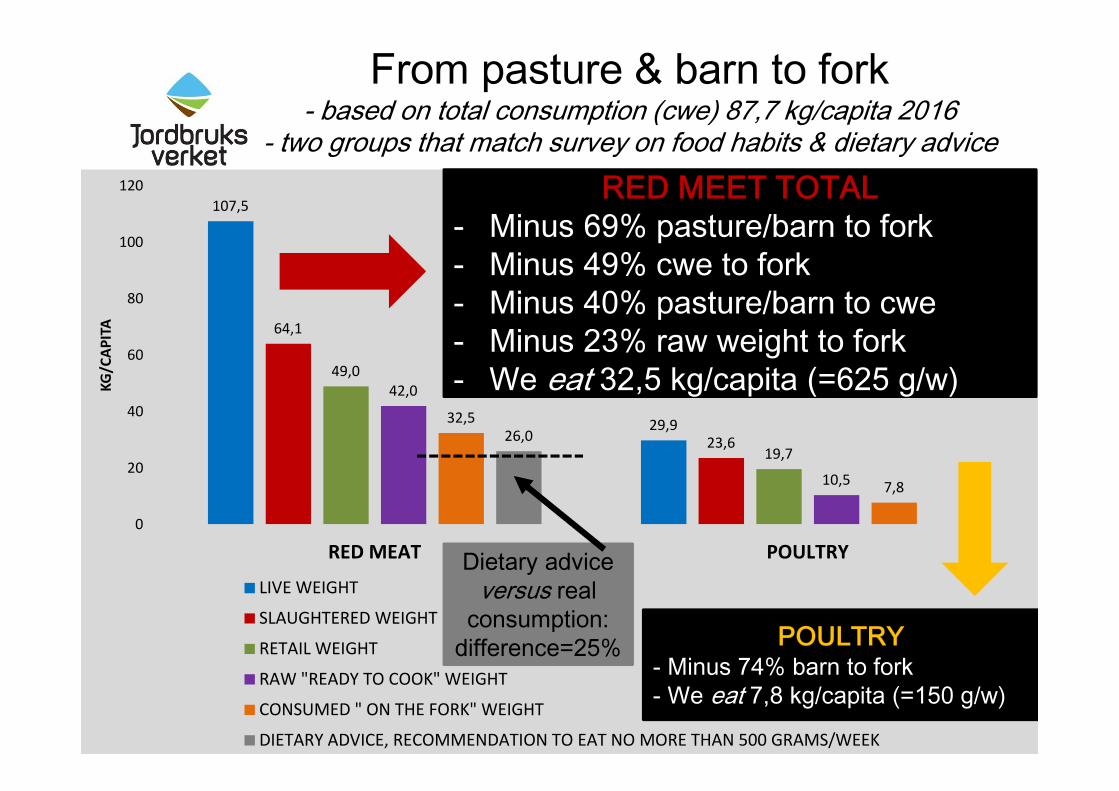
From pasture & barn to fork- based on total consumption (cwe) 87,7 kg/capita 2016
- two groups that match survey on food habits & dietary advice
2017-10-04
107,5
29,9
64,1
23,6
49,0
19,7
42,0
10,5
32,5
7,8
26,0
0
20
40
60
80
100
120
RED MEAT POULTRY
KG/C
APIT
A
LIVE WEIGHT
SLAUGHTERED WEIGHT
RETAIL WEIGHT
RAW "READY TO COOK" WEIGHT
CONSUMED " ON THE FORK" WEIGHT
DIETARY ADVICE, RECOMMENDATION TO EAT NO MORE THAN 500 GRAMS/WEEK
RED MEET TOTAL
- Minus 69% pasture/barn to fork
- Minus 49% cwe to fork
- Minus 40% pasture/barn to cwe
- Minus 23% raw weight to fork
- We eat 32,5 kg/capita (=625 g/w)
POULTRY
- Minus 74% barn to fork
- We eat 7,8 kg/capita (=150 g/w)
Dietary advice
versus real
consumption:
difference=25%
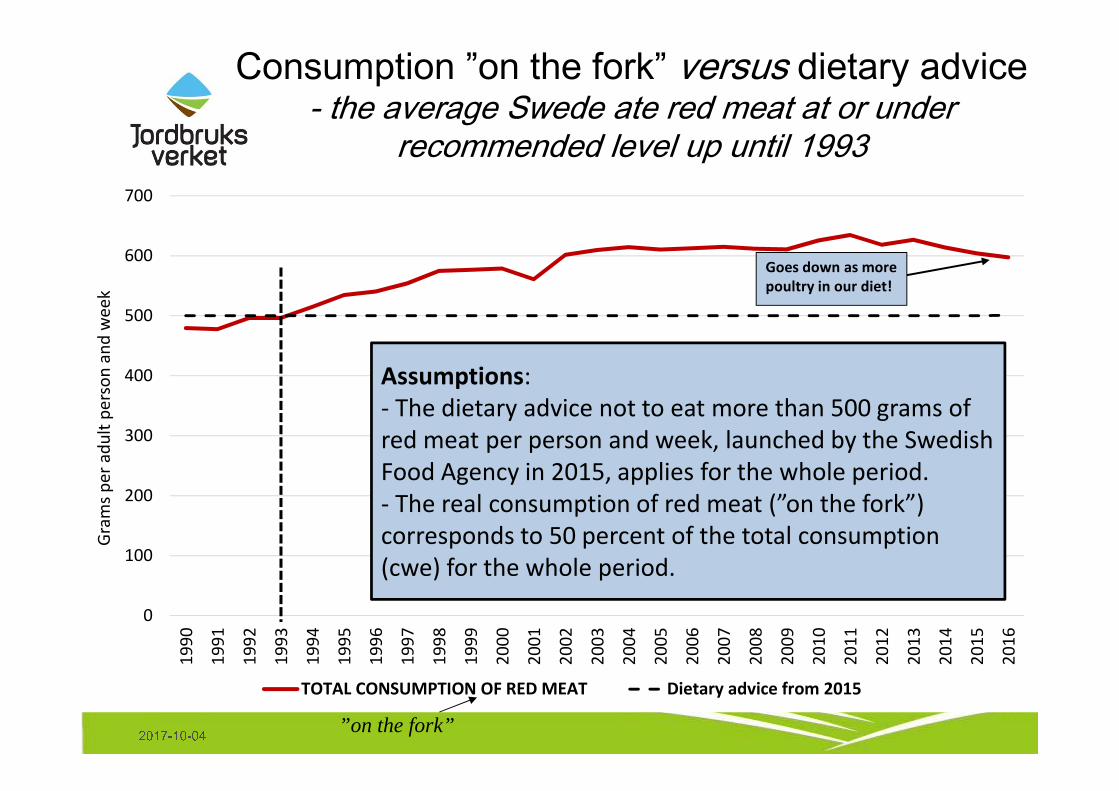
Consumption ”on the fork” versus dietary advice- the average Swede ate red meat at or under
recommended level up until 1993
2017-10-04
0
100
200
300
400
500
600
70019
90
1991
1992
1993
1994
1995
1996
1997
1998
1999
2000
2001
2002
2003
2004
2005
2006
2007
2008
2009
2010
2011
2012
2013
2014
2015
2016
Gram
s per
adu
lt pe
rson
and
wee
k
TOTAL CONSUMPTION OF RED MEAT Dietary advice from 2015
Assumptions: - The dietary advice not to eat more than 500 grams ofred meat per person and week, launched by the Swedish Food Agency in 2015, applies for the whole period.- The real consumption of red meat (”on the fork”) corresponds to 50 percent of the total consumption(cwe) for the whole period.
Goes down as morepoultry in our diet!
”on the fork”
2017-10-04
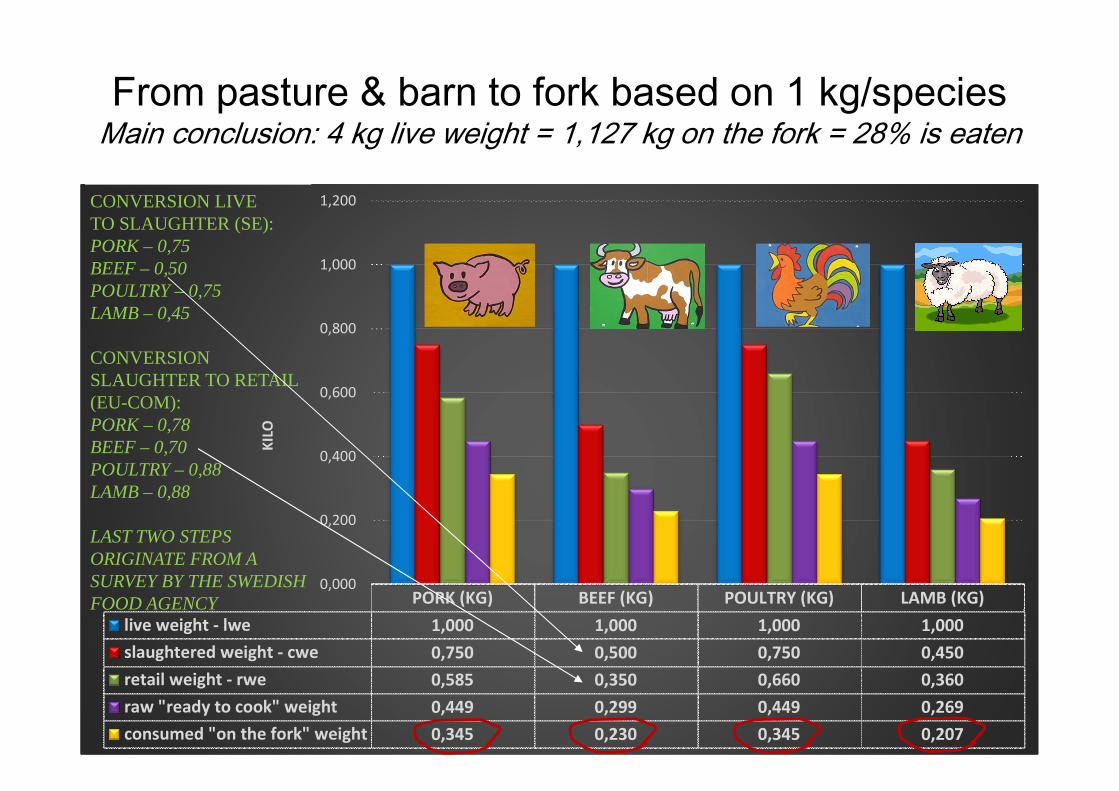
PORK (KG) BEEF (KG) POULTRY (KG) LAMB (KG)live weight - lwe 1,000 1,000 1,000 1,000slaughtered weight - cwe 0,750 0,500 0,750 0,450retail weight - rwe 0,585 0,350 0,660 0,360raw "ready to cook" weight 0,449 0,299 0,449 0,269consumed "on the fork" weight 0,345 0,230 0,345 0,207
0,000
0,200
0,400
0,600
0,800
1,000
1,200
KILO
CONVERSION LIVE TO SLAUGHTER (SE):PORK – 0,75BEEF – 0,50POULTRY – 0,75LAMB – 0,45
CONVERSION SLAUGHTER TO RETAIL (EU-COM):PORK – 0,78 BEEF – 0,70POULTRY – 0,88LAMB – 0,88
LAST TWO STEPS ORIGINATE FROM A SURVEY BY THE SWEDISH FOOD AGENCY
From pasture & barn to fork based on 1 kg/speciesMain conclusion: 4 kg live weight = 1,127 kg on the fork = 28% is eaten
2017-10-04
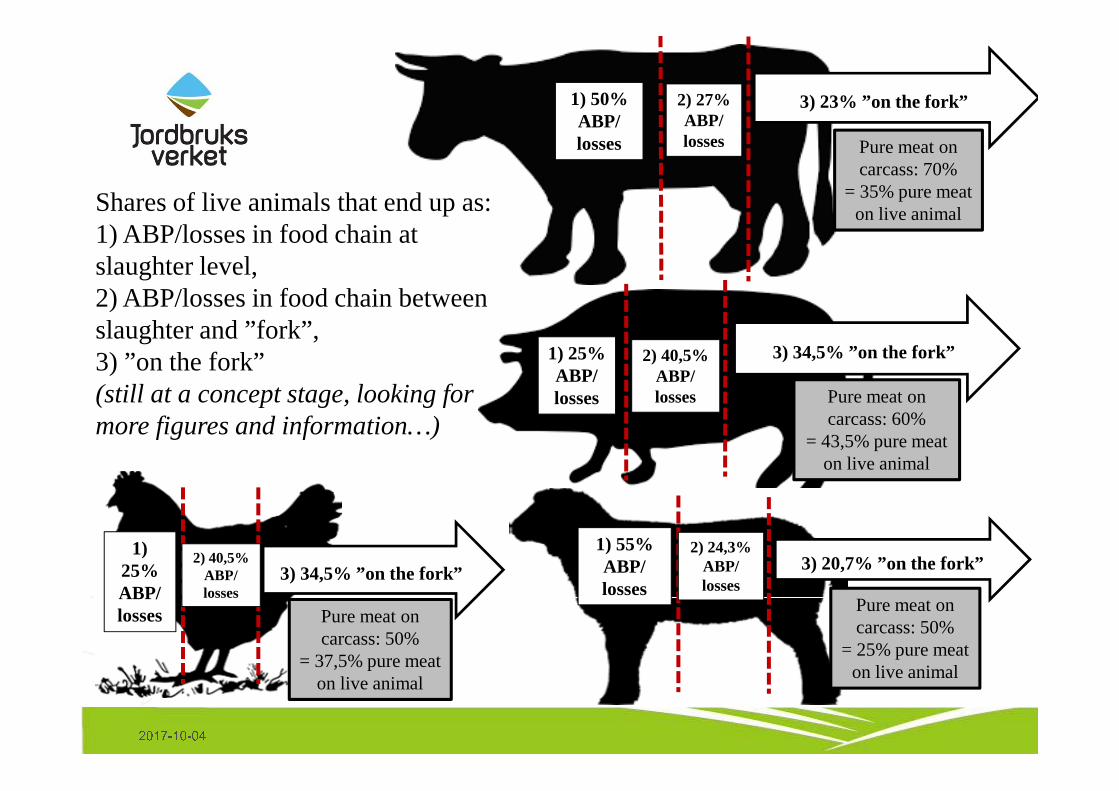
1) 50%ABP/losses
2) 27%ABP/losses
3) 23% ”on the fork”
1) 25%ABP/losses
2) 40,5%ABP/losses
3) 34,5% ”on the fork”
1) 55%ABP/losses
2) 24,3%ABP/losses
3) 20,7% ”on the fork”1)
25%ABP/losses
3) 34,5% ”on the fork”2) 40,5%
ABP/losses
Shares of live animals that end up as:1) ABP/losses in food chain at slaughter level, 2) ABP/losses in food chain betweenslaughter and ”fork”, 3) ”on the fork”(still at a concept stage, looking for more figures and information…)
Pure meat on carcass: 70%
= 35% pure meaton live animal
Pure meat on carcass: 50%
= 25% pure meaton live animal
Pure meat on carcass: 60%
= 43,5% pure meaton live animal
Pure meat on carcass: 50%
= 37,5% pure meaton live animal

2017-10-04
ABP/losses in food chain: slaughter level• Hides and skins• Intestines• Bones, horns and hooves• Blood• Fat • Feathers (poultry)Areas of use• Feed• Organic fertilisers• Energy through incineration• Biogas (=energy&organic fertilisers)• Biodiesel• Fat for technical use• Leather and skins
ABP/losses in food chain: cutting plants, food industry, wholesale/retail level, households• Remaining bones from carcases• Tendons• Fat on carcases• Pure meatAreas of use• Feed• Organic fertilisers• Energy through incineration• Biogas (= energy & organic fertilisers)• Biodiesel• Fat for technical use
1) 50%ABP/losses
2) 27%ABP/losses
3) 23% ”on the fork”
- Not much is completely wasted but more can be done- There are no detailed figures - big variation- Challange for smaller slaughterhouses/enterprises

Is our information good enough?-we still get many questions about…
2017-10-04
1. Regional differences in meat consumption?
2. Differences in origin of meat consumed in public kitchens,
private restaurants & households?
3. How can I avoid meat from animals that have not been
anesthetized before slaughter?
4. Sustainable meat - how should I argue (origin, kind of meat,
amount of meat)?
5. How do I handle conflicting objectives (ecosystem services
versus climate impact)?
2017-10-04
The Swedish Board of Agriculture in
Jönköping
Thank you for listening!If you want more information about Swedish meat
consumption, don’t hesitate to contact me!
Åsa Lannhard Ö[email protected]
+46 36 15 52 74 or +46 70 369 73 04