calculated ldl by age cases vs. controls figure 1
TRANSCRIPT

Calculated LDL by AgeCases vs. Controls
Calculated LDL by AgeCases vs. Controls
80
90
100
110
120
130
140
20 25 30 35 40 45 50 55Age
Calc
ula
ted
LD
L
CaseControl
Figure 1Figure 1
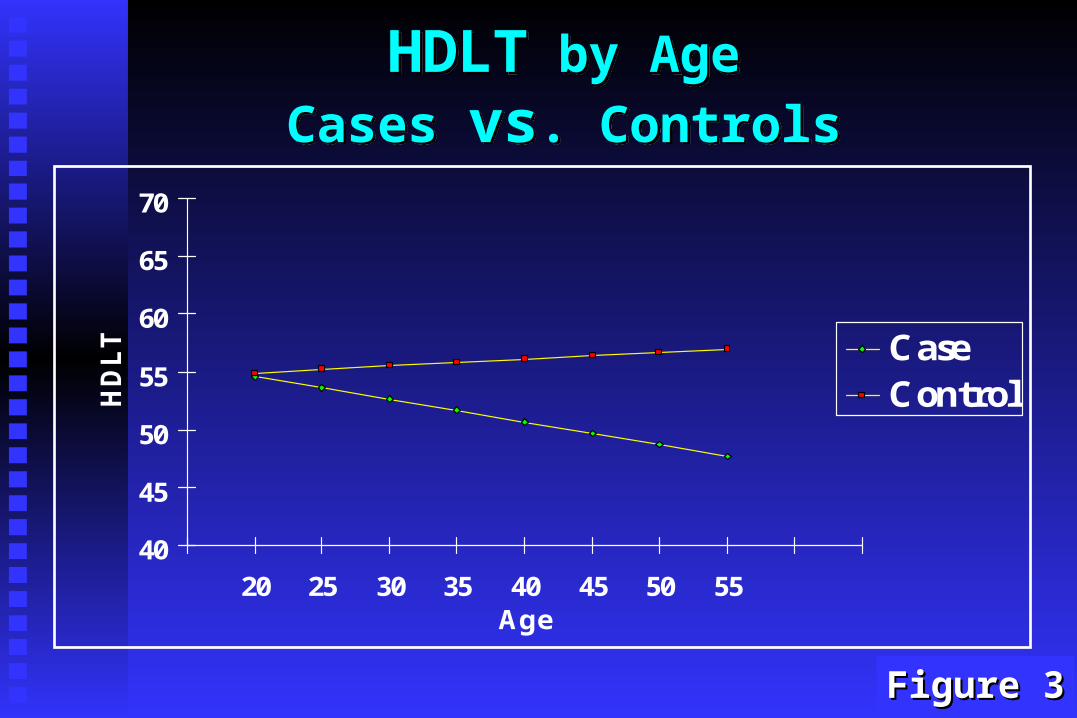
HDLT by Age
Cases vs. Controls
HDLT by Age
Cases vs. Controls
40
45
50
55
60
65
70
20 25 30 35 40 45 50 55Age
HD
LT Case
Control
Figure 3Figure 3

Triglycerides by AgeCases vs. Controls
Triglycerides by AgeCases vs. Controls
50
70
90
110
130
150
170
190
20 25 30 35 40 45 50 55Age
Tri
gly
ceri
des
CaseControl
Figure 5Figure 5

Insulin by AgeCases vs. Controls
Insulin by AgeCases vs. Controls
0
5
10
15
20
25
20 25 30 35 40 45 50 55Age
Insu
lin
CaseControl
Figure 6Figure 6

Androstenedione by AgeCases vs. Controls
Androstenedione by AgeCases vs. Controls
80
130
180
230
280
330
20 25 30 35 40 45 50 55Age
An
dro
ste
ned
ion
e
CaseControl
Figure 7Figure 7
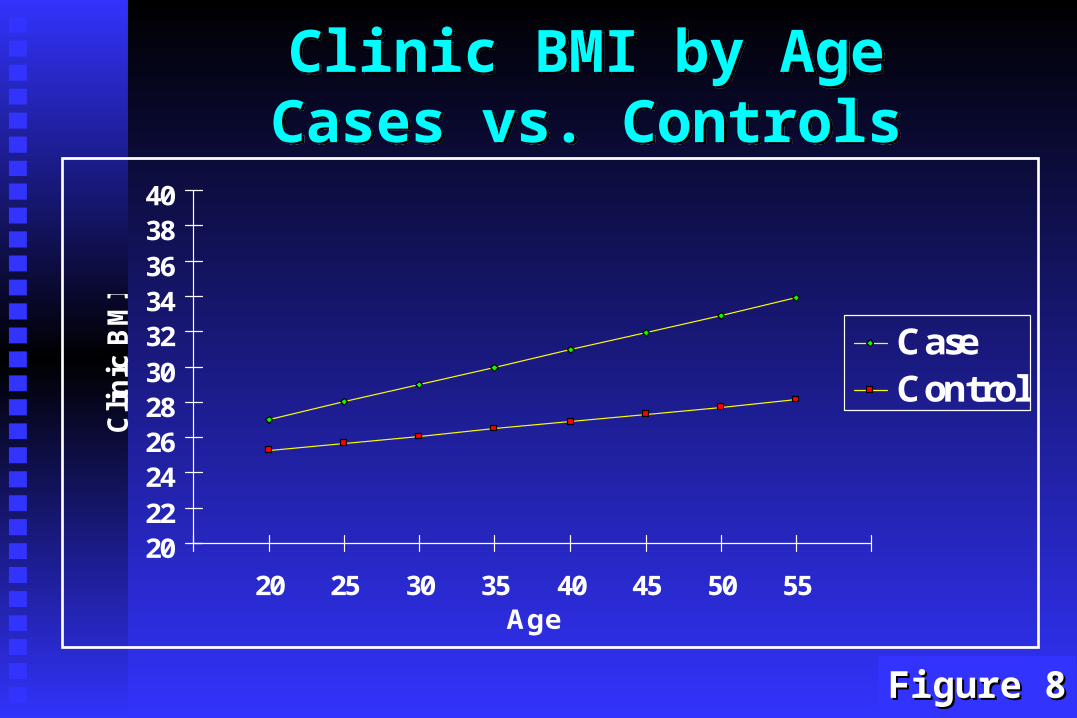
Clinic BMI by AgeCases vs. ControlsClinic BMI by AgeCases vs. Controls
2022242628303234363840
20 25 30 35 40 45 50 55Age
Cli
nic
BM
I
CaseControl
Figure 8Figure 8
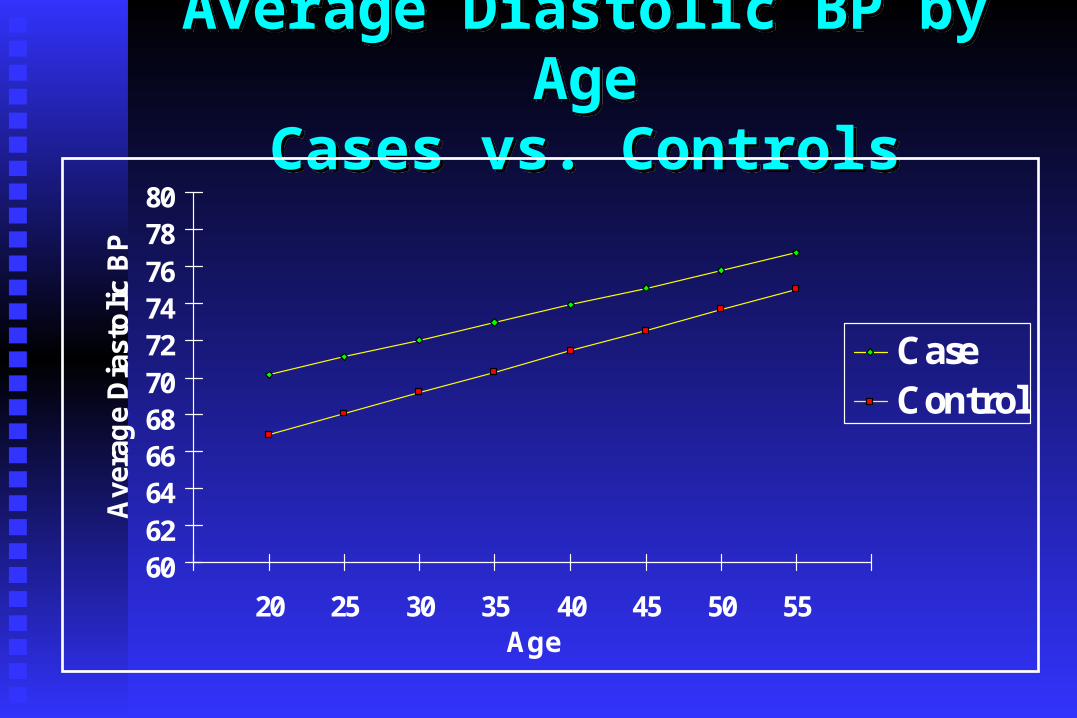
Average Diastolic BP by AgeCases vs. Controls
Average Diastolic BP by AgeCases vs. Controls
6062646668707274767880
20 25 30 35 40 45 50 55Age
Ave
rag
e D
iast
oli
c B
P
CaseControl

Average Systolic BP by AgeCases vs. Controls
Average Systolic BP by AgeCases vs. Controls
90
95
100
105
110
115
120
125
130
20 25 30 35 40 45 50 55Age
Ave
rag
e S
ysto
lic
BP
CaseControl

Clinic Estradiol 2 by AgeCases vs. Controls
Clinic Estradiol 2 by AgeCases vs. Controls
50
60
70
80
90
100
110
120
20 25 30 35 40 45 50 55Age
Est
rad
iol
2
CaseControl
Study Population:PCOS and the Risk of CHD,Part II (l996-99)
160 PCOS cases and 160 controls 30+ years of age 160 PCOS cases and 160 controls 30+ years of age participating in PHASE II (1996-1999) of the participating in PHASE II (1996-1999) of the Cardiovascular Health and Risk Measurement Cardiovascular Health and Risk Measurement (CHARM) Study(CHARM) Study
Ongoing protocol to evaluate the CHD risk factors Ongoing protocol to evaluate the CHD risk factors and subclinical atherosclerosis as measured by and subclinical atherosclerosis as measured by carotid ultrasound in women with PCOS.carotid ultrasound in women with PCOS.

Research Methodology
Clinic VisitClinic Visit (continued) (continued) Blood analyte assessmentBlood analyte assessment
Lipids ( total cholesterol, triglycerides, Lipids ( total cholesterol, triglycerides, LDLc, HDLc)LDLc, HDLc)
Fasting glucose and insulinFasting glucose and insulinFibrinolytic/coagulation parametersFibrinolytic/coagulation parameters
• tissue plasminogen activator (tPA)tissue plasminogen activator (tPA)• plasminogen activator inhibitor (PAI-1)plasminogen activator inhibitor (PAI-1)

Carotid Atherosclerotic Index (CAI)
Represents the overall mean of the mean Represents the overall mean of the mean measurements of carotid intima-media measurements of carotid intima-media thickness at 8 sitesthickness at 8 sites
Arterial sites of interest included : Arterial sites of interest included : left/ right proximal common carotidleft/ right proximal common carotidleft/ right distal common carotidleft/ right distal common carotidleft/ right carotid bulbleft/ right carotid bulbleft/ right distal internal carotidleft/ right distal internal carotid

Baseline Demographic and Reproductive Factors in PCOS
Table 1: Baseline Sociodemographic and Reproductive Factors in PCOS Cases and Controls of Similar Age (1992-1994)
Variables
Cases (N=125)
Mean (SD) or %
Controls (N=142)
Means (SD) or %
p value
Age (as of 1992-93)
37.5 (6.2)
39.0 (6.2)
.050
Years of Education 14.4 (2.0) 14.6 (2.0) .401
% Married 85.7% 68.5% .044
% Current Smoking 23.0% 17.5% .459
% OCP/HRT 15.9% 17.5% .512
% Surgical/other 8.8% 9.1% .918
% Natural Menopause 1.6% 2.1% .152
Number of Pregnancies 1.8 (1.9) 2.2 (1.7) .082
Number of Live Births 1.0 (1.1) 1.9 (1.5) <.001
Arteriosclerosis, Thrombosis,and Vascular Biology, 2000;20:2414-2421
Click for larger picture

Baseline Cardiovascular Risk Factors in PCOS
Table 2: Selected Baseline Cardiovascular Risk Factors in PCOS Cases and Controls of Similar Age (1992-1994)
Cases(N=125) Controls(N=142)
Variables
Mean (SE)
Adjusted
Mean (SE)
Mean (SD)
Adjusted
Mean (SE)
Unadj P
value
BMI kg/m2 30.1 (0.7) N/A 26.5 (0.5) N/A <.001
Waist:hip ratio .84 (0.01) .82 (0.01) .77 (0.01) .78 (0.01)* <.001
SBP mm Hg 113.9 (1.3) 112.2 (1.0) 110.4 (1.1) 112.0 (1.0) .038
DBP mm Hg 72.3 (1.0) 71.0 (0.7) 70.6 (0.7) 71.7 (0.7) .155
CHOL mg/dL 196.5 (2.7) 195.2 (3.0) 188.3 (2.9) 189.2 (2.7) .042
LDLc mg/dL 122.1 (2.6) 120.1 (2.7) 115.0 (2.6) 116.4 (2.5) .059
HDLt mg/dL 50.1 (1.3) 51.6 (1.2) 56.8 (1.2) 55.5 (1.1)* <.001
HDL2 mg/dL 8.2 (0.6) 8.9 (0.6) 11.9 (0.6) 11.4 (0.5)* <.001
Insulin U/mL 23.7 (2.1) 21.2 (1.4) 14.0 (0.9) 16.3 (1.3)* <.001
TRIG mg/dL 124.1 (7.7) 119.2 (5.7) 82.2 (3.7) 87.0 (5.4)* <.001
Total T nmol/dL 1.65 (0.10) 1.64 (0.08) 1.04 (0.04) 1.05 (0.07)* <.001
AD ng/dL 208.8 (12.4) 209.2 (9.9) 158.5 (6.6) 158.8 (8.9)* <.001
LH/FSH 1.52 (0.09) 1.53 (.09) 1.16 (0.09) 1.16 (0.09)* .005
*Adj. p value <.001
Arteriosclerosis, Thrombosis, and Vascular Biology, 2000;20:2414-2421
Click for larger picture
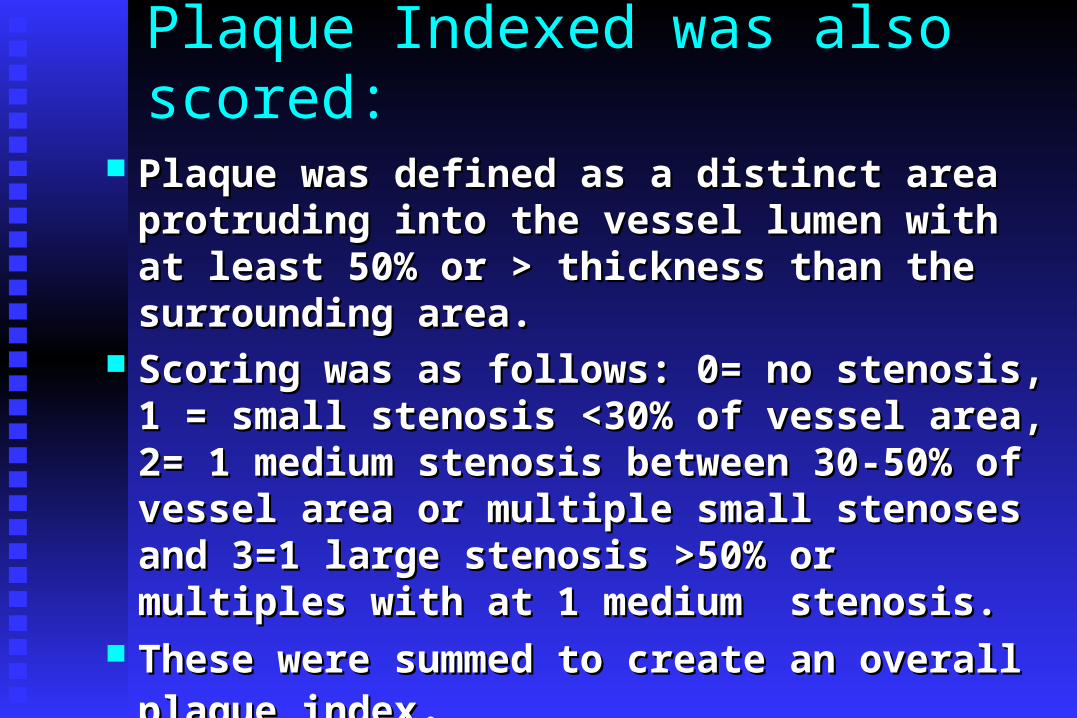
Plaque Indexed was also scored:
Plaque was defined as a distinct area protruding Plaque was defined as a distinct area protruding into the vessel lumen with at least 50% or > into the vessel lumen with at least 50% or > thickness than the surrounding area.thickness than the surrounding area.
Scoring was as follows: 0= no stenosis, 1 = small Scoring was as follows: 0= no stenosis, 1 = small stenosis <30% of vessel area, 2= 1 medium stenosis stenosis <30% of vessel area, 2= 1 medium stenosis between 30-50% of vessel area or multiple small between 30-50% of vessel area or multiple small stenoses and 3=1 large stenosis >50% or multiples stenoses and 3=1 large stenosis >50% or multiples with at 1 medium stenosis. with at 1 medium stenosis.
These were summed to create an overall plaque These were summed to create an overall plaque indexindex..
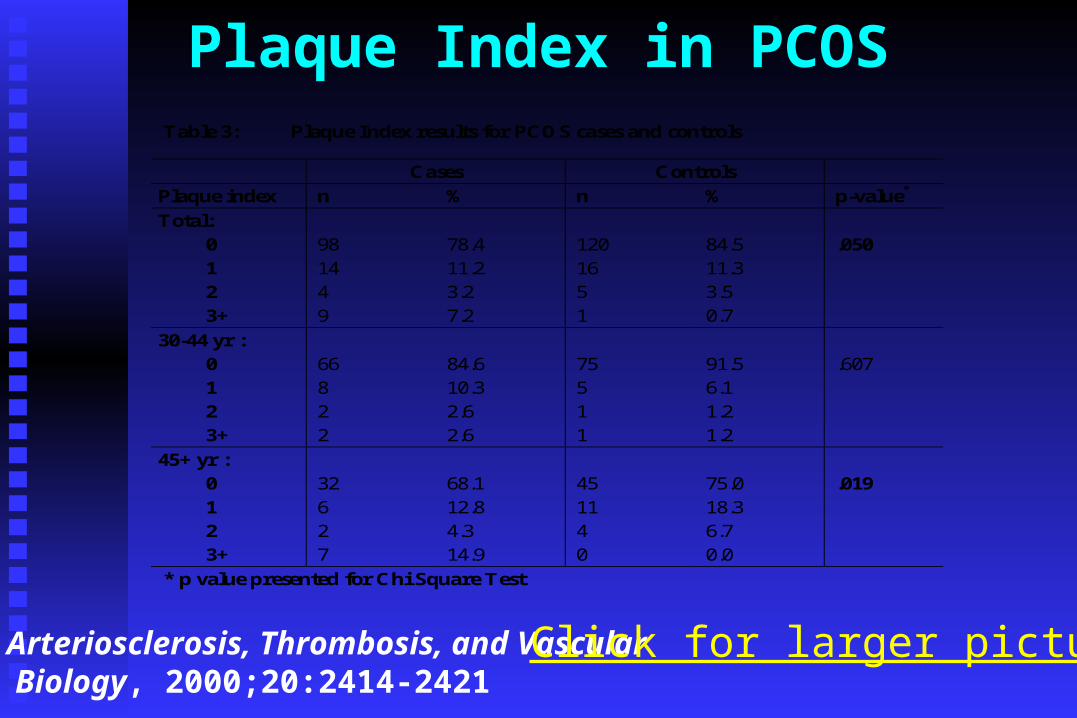
Plaque Index in PCOSTable 3: Plaque Index results for PCOS cases and controls
Cases Controls
Plaque index n % n % p-value*
Total:
0 98 78.4 120 84.5 .050
1 14 11.2 16 11.3
2 4 3.2 5 3.5
3+ 9 7.2 1 0.7
30-44 yr :
0 66 84.6 75 91.5 .607
1 8 10.3 5 6.1
2 2 2.6 1 1.2
3+ 2 2.6 1 1.2
45+ yr :
0 32 68.1 45 75.0 .019
1 6 12.8 11 18.3
2 2 4.3 4 6.7
3+ 7 14.9 0 0.0
* p value presented for Chi Square Test
Arteriosclerosis, Thrombosis, and Vascular Biology, 2000;20:2414-2421
Click for larger picture

Carotid IMT in PCOS by Age and BMI
0,6
0,65
0,7
0,75
0,8
LT 26 GE 26 LT 26 GE 26
CaseControl
ns ns .219 .040
< 45 years > 45 years
BMI:
Age:
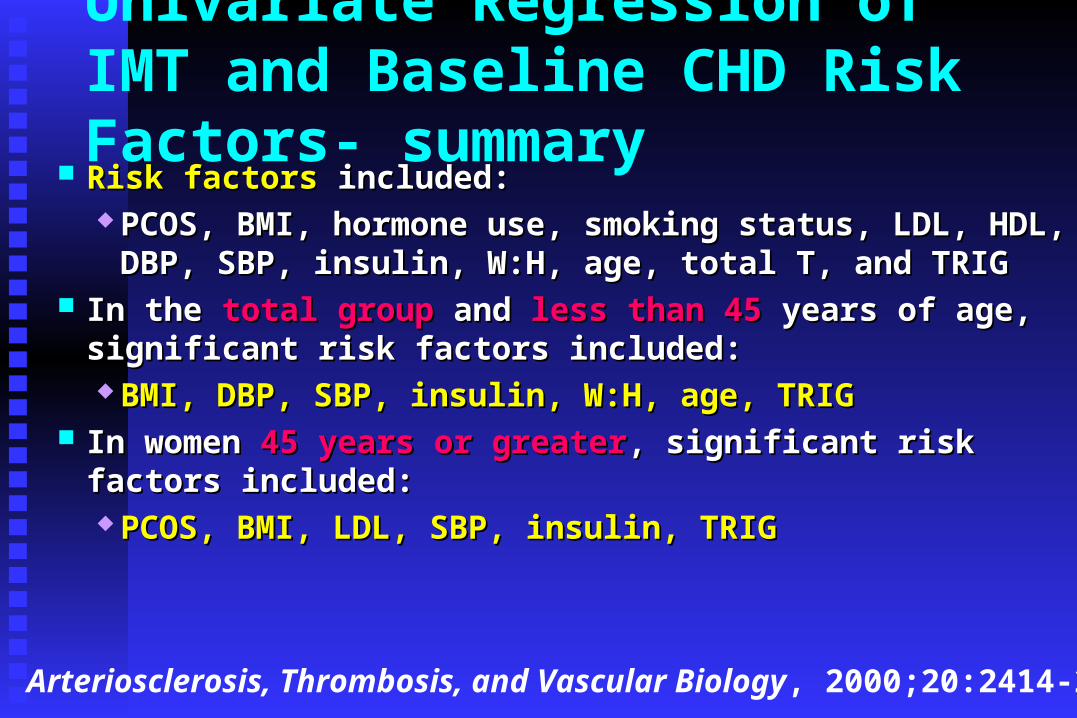
Univariate Regression of IMT and Baseline CHD Risk Factors- summary
Risk factors Risk factors included: included: PCOS, BMI, hormone use, smoking status, LDL, HDL, PCOS, BMI, hormone use, smoking status, LDL, HDL,
DBP, SBP, insulin, W:H, age, total T, and TRIGDBP, SBP, insulin, W:H, age, total T, and TRIG In the In the total grouptotal group and and less than 45less than 45 years of age, significant risk years of age, significant risk
factors included:factors included: BMI, DBP, SBP, insulin, W:H, age, TRIGBMI, DBP, SBP, insulin, W:H, age, TRIG
In women In women 45 years or greater45 years or greater, significant risk factors included:, significant risk factors included: PCOS, BMI, LDL, SBP, insulin, TRIGPCOS, BMI, LDL, SBP, insulin, TRIG
Arteriosclerosis, Thrombosis, and Vascular Biology, 2000;20:2414-2421
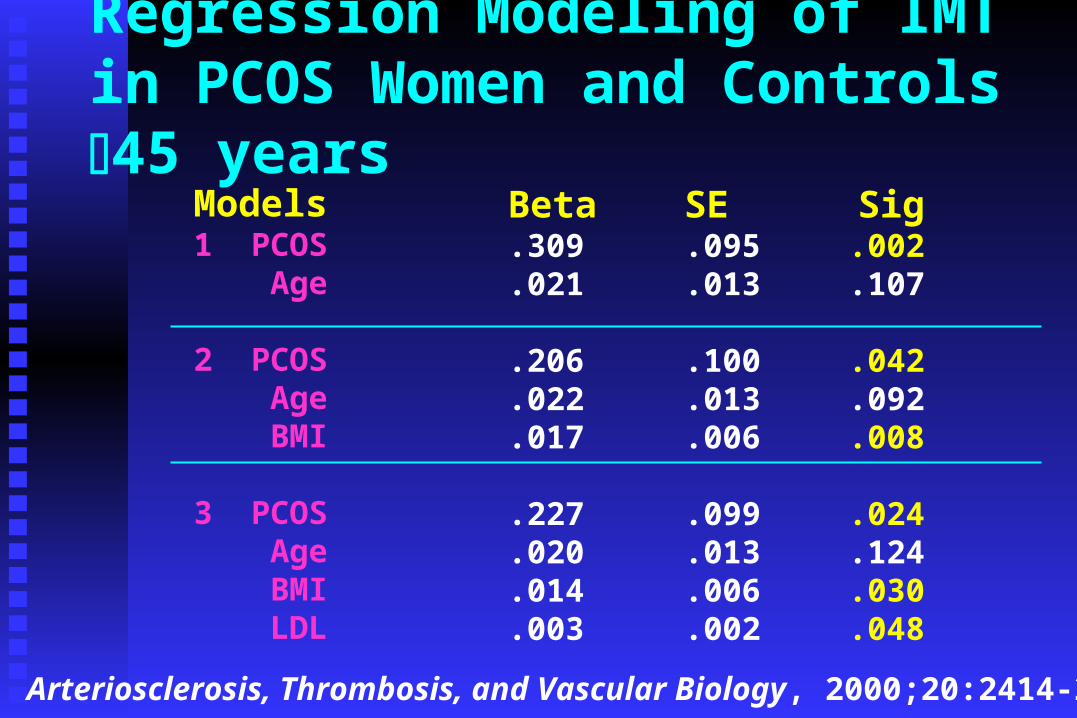
Regression Modeling of IMT in PCOS Women and Controls 45 years
Models1 PCOS Age
2 PCOS Age BMI 3 PCOS Age BMI LDL
Beta.309.021
.206
.022
.017
.227
.020
.014
.003
SE.095.013
.100
.013
.006
.099
.013
.006
.002
Sig .002
.107
.042
.092
.008
.024
.124
.030
.048
Arteriosclerosis, Thrombosis, and Vascular Biology, 2000;20:2414-2421
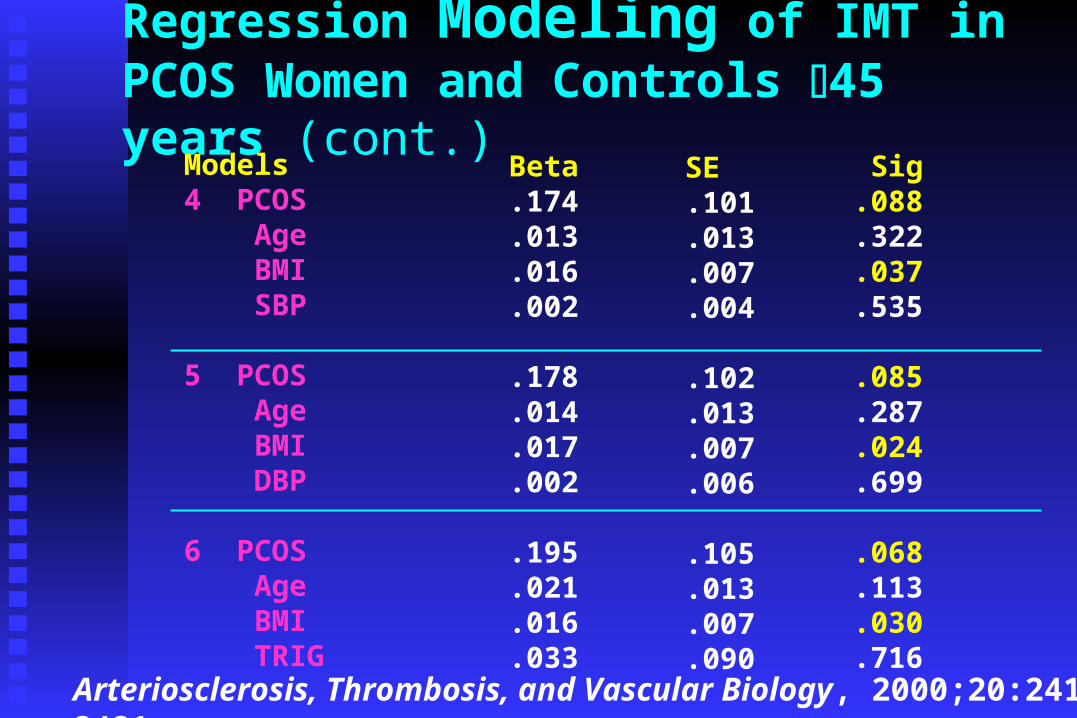
Regression Modeling of IMT in PCOS Women and Controls 45 years (cont.)
Models4 PCOS Age BMI SBP
5 PCOS Age BMI DBP
6 PCOS Age BMI TRIG
Beta.174.013.016.002
.178
.014
.017
.002
.195
.021
.016
.033
SE.101.013.007.004
.102
.013
.007
.006
.105
.013
.007
.090
Sig .088
.322
.037
.535
.085
.287
.024
.699
.068
.113
.030
.716Arteriosclerosis, Thrombosis, and Vascular Biology, 2000;20:2414-2421
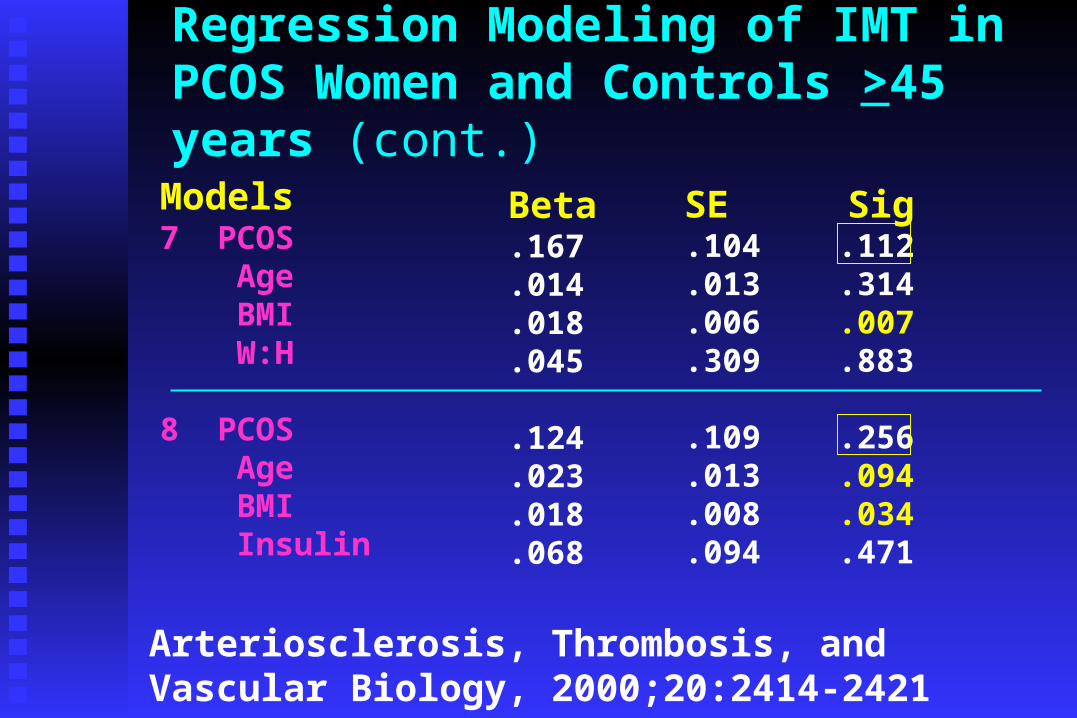
Regression Modeling of IMT in PCOS Women and Controls >45 years (cont.)
Models7 PCOS Age BMI W:H
8 PCOS Age BMI Insulin
Beta.167.014.018.045
.124
.023
.018
.068
SE.104.013.006.309
.109
.013
.008
.094
Sig.112.314.007.883
.256
.094
.034
.471
Arteriosclerosis, Thrombosis, and Vascular Biology, 2000;20:2414-2421

Multivariate Regression Models of IMT- Effect of PCOS
Models adjusted for Models adjusted for ageage and and BMIBMI Risk factorsRisk factors explored include: explored include:
PCOS, LDL, SBP, DBP, TRIG, W:H, insulinPCOS, LDL, SBP, DBP, TRIG, W:H, insulin In the In the total group total group PCOS was not a significant PCOS was not a significant
predictor of IMT. predictor of IMT. SBPSBP was only significant was only significant independent predictor.independent predictor.
In women In women less than 45less than 45 years of age PCOS was not a years of age PCOS was not a significant predictor of IMT. significant predictor of IMT. SBPSBP and and DBPDBP were were significant independent predictors.significant independent predictors.
Arteriosclerosis, Thrombosis, and Vascular Biology, 2000;20:2414-2421
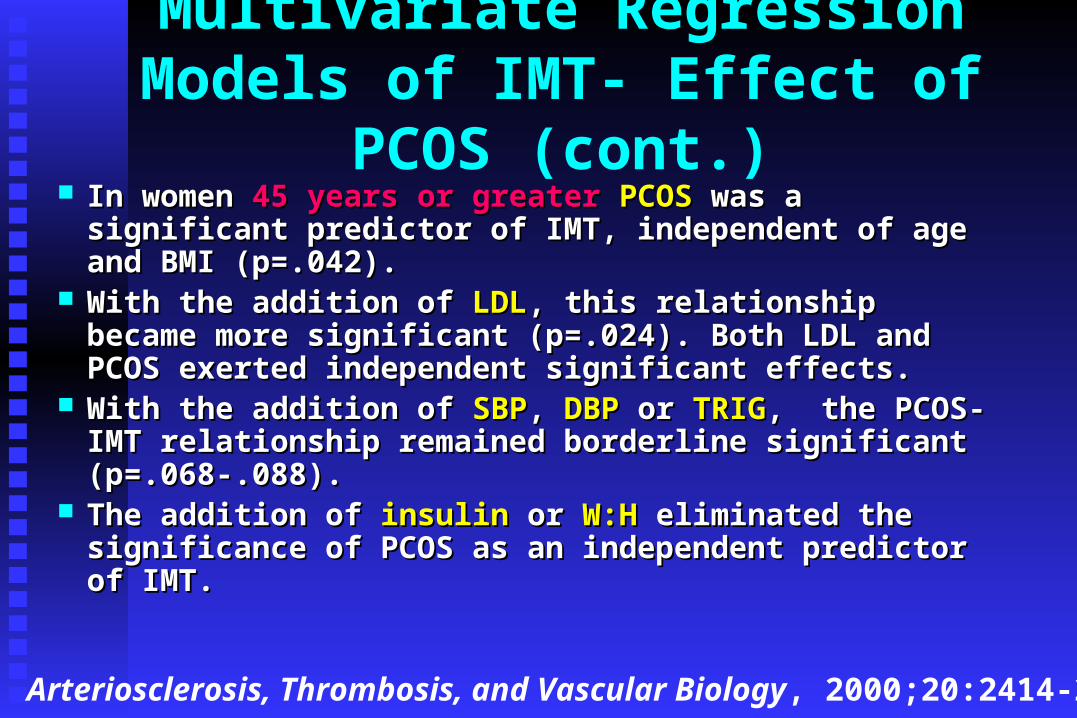
Multivariate Regression Models of IMT- Effect of PCOS (cont.)
In women In women 45 years or greater 45 years or greater PCOS PCOS was a significant was a significant predictor of IMT, independent of age and BMI (p=.042). predictor of IMT, independent of age and BMI (p=.042).
With the addition of With the addition of LDLLDL, this relationship became more , this relationship became more significant (p=.024). Both LDL and PCOS exerted significant (p=.024). Both LDL and PCOS exerted independent significant effects.independent significant effects.
With the addition of With the addition of SBPSBP, , DBPDBP or or TRIGTRIG, the PCOS-IMT , the PCOS-IMT relationship remained borderline significant (p=.068-.088).relationship remained borderline significant (p=.068-.088).
The addition of The addition of insulininsulin or or W:HW:H eliminated the significance eliminated the significance of PCOS as an independent predictor of IMT.of PCOS as an independent predictor of IMT.
Arteriosclerosis, Thrombosis, and Vascular Biology, 2000;20:2414-2421

Regression Summary:
Fasting insulin and W:H appear to attenuate the Fasting insulin and W:H appear to attenuate the relationship of PCOS and IMT, suggesting that at relationship of PCOS and IMT, suggesting that at least part of the PCOS-IMT association in middle least part of the PCOS-IMT association in middle aged PCOS women may be driven by central obesity aged PCOS women may be driven by central obesity and hyperinsulinemia.and hyperinsulinemia.
There may be an independent effect of PCOS on There may be an independent effect of PCOS on IMT mediated by low peak estradiol levels or IMT mediated by low peak estradiol levels or hormonal dysregulation.hormonal dysregulation.
An increase in IMT is apparent even in thinner An increase in IMT is apparent even in thinner PCOS cases.PCOS cases.
Arteriosclerosis, Thrombosis, and Vascular Biology, 2000;20:2414-2421
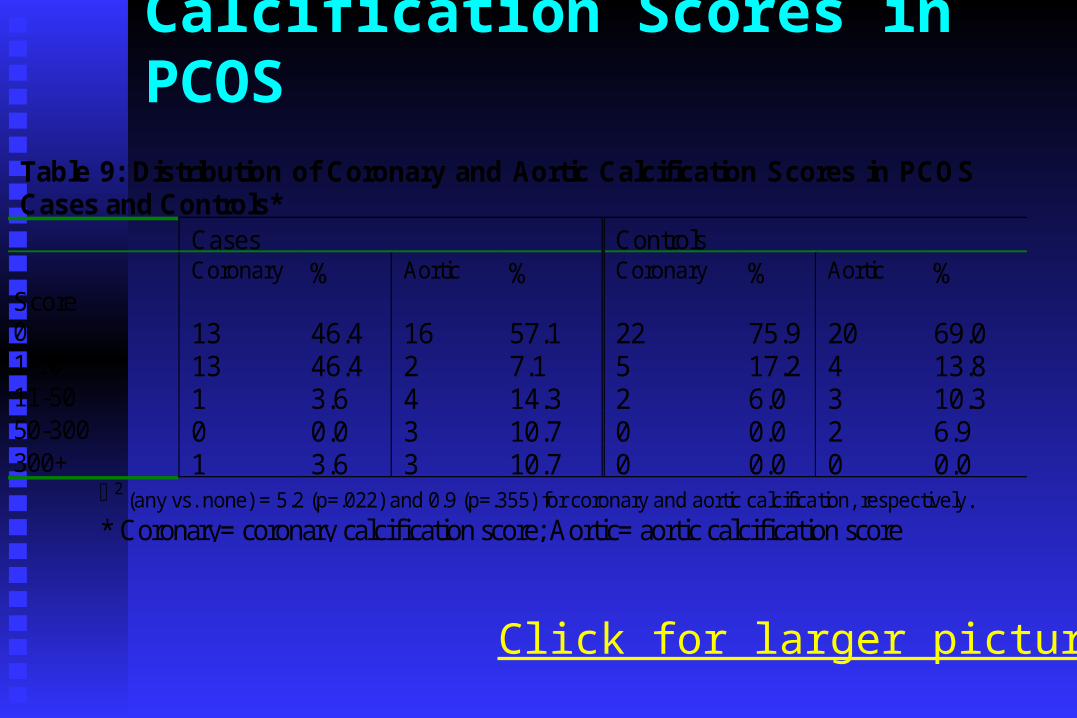
Calcification Scores in PCOS
Table 9: Distribution of Coronary and Aortic Calcification Scores in PCOS Cases and Controls*
Cases Controls Score
Coronary % Aortic % Coronary % Aortic %
0 13 46.4 16 57.1 22 75.9 20 69.0 1-10 13 46.4 2 7.1 5 17.2 4 13.8 11-50 1 3.6 4 14.3 2 6.0 3 10.3 50-300 0 0.0 3 10.7 0 0.0 2 6.9 300+ 1 3.6 3 10.7 0 0.0 0 0.0
2 (any vs. none) = 5.2 (p=.022) and 0.9 (p=.355) for coronary and aortic calcification, respectively.
* Coronary= coronary calcification score; Aortic= aortic calcification score
Click for larger picture
Conclusions:
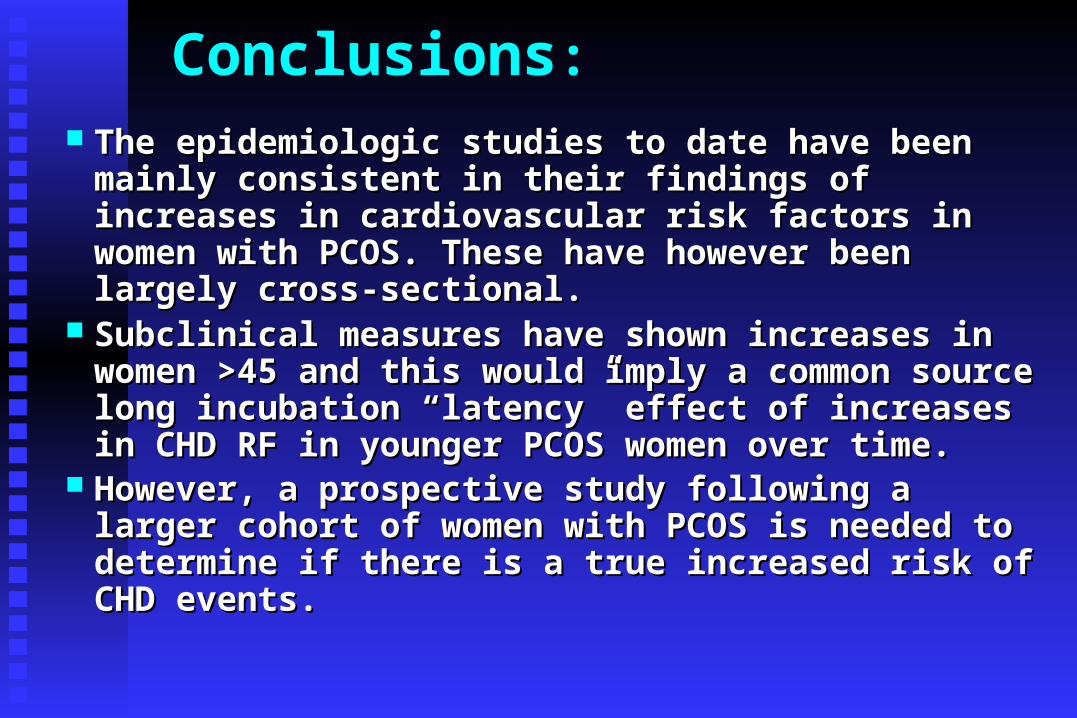
The epidemiologic studies to date have been mainly The epidemiologic studies to date have been mainly consistent in their findings of increases in consistent in their findings of increases in cardiovascular risk factors in women with PCOS. cardiovascular risk factors in women with PCOS. These have however been largely cross-sectional.These have however been largely cross-sectional.
Subclinical measures have shown increases in Subclinical measures have shown increases in women >45 and this would imply a common source women >45 and this would imply a common source long incubation “latency” effect of increases in long incubation “latency” effect of increases in CHD RF in younger PCOS women over time.CHD RF in younger PCOS women over time.
However, a prospective study following a larger However, a prospective study following a larger cohort of women with PCOS is needed to determine cohort of women with PCOS is needed to determine if there is a true increased risk of CHD events.if there is a true increased risk of CHD events.