cairns shipping development projecteisdocs.dsdip.qld.gov.au/cairns shipping development/revised...
TRANSCRIPT

CAIRNS SHIPPING DEVELOPMENT PROJECT
Revised Draft Environmental Impact Statement
APPENDIX V: East Trinity Soils Values Assessment Report (2016)

29 September 2016
BASELINE SOILS REPORT - EAST TRINITY
Cairns Shipping Development Project
RE
PO
RT
Report Number. 1546223-004-R-Rev3
Distribution:
1 PDF electronic copy
BASELINE SOILS REPORT, EAST TRINITY
29 September 2016 Report No. 1546223-004-R-Rev3 i
Executive Summary
The East Trinity site is underlain by young (Holocene age) alluvial deposits to depths of about 2m to 4m
below the ground surface at the eastern end of the site, progressively increasing in depth towards the west.
At the western margins of the site the thickness of Holocene deposits typically ranged between about 6.5m
and 12m, increasing to a depth of about 22m between Hills Creek and Magazine Creek.
The younger alluvial deposits are underlain by older (Pleistocene age), consolidated alluvial deposits and
then Permian age Granite bedrock at depths of at least 90 m near Trinity Inlet.
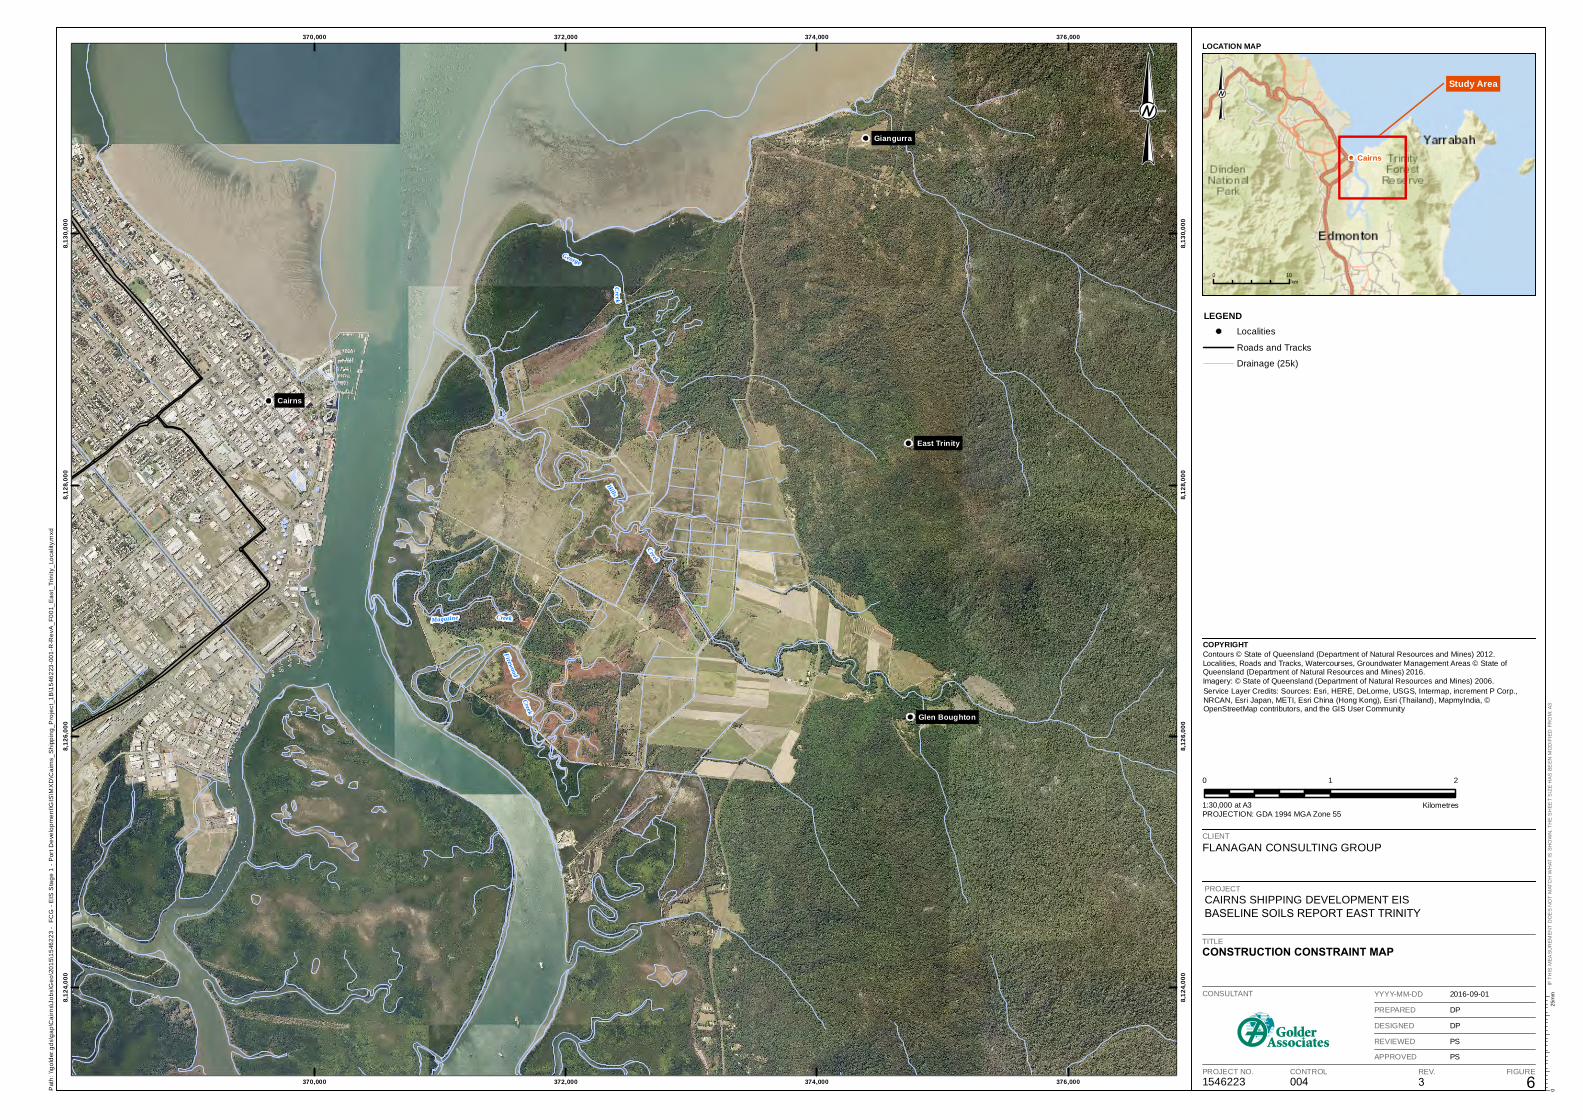
The Holocene age alluvium is typically soft and highly compressible. Design of ponds will need to consider
total and differential settlements induced by the embankments and by the dredged materials. Areas where
greatest potential settlement could be expected are marked on Figure 6.
The materials within the upper 1 m of the soil profile are expected to be generally clayey in nature, however
their permeability and suitability for construction of embankments is not known at this time. Use of synthetic
liners may need to be considered.
Acid sulfate soil conditions at the site have been extensively studied and partially remediated over the past
15 years. PASS and AASS materials underlie the entire site. It is recommended that areas underlain by
AASS plus areaS where past remediation works have been carried out should be avoided to prevent
disturbance and possible remobilisation of acid. A buffer distance of at least 10 m between such areas and
dredged spoil ponds is also recommended.
Figure 7 shows areas where siting of the ponds should not result in disturbance of PASS. These areas
typically occur above 1m AHD and can support excavations generally to depths of less than 1m below
ground level. There is greater than 120 ha of land above 1m AHD. Some areas with site levels between
0.5m and 1m AHD should also be suitable for siting of ponds (providing excavation depths are less than
0.5m below ground level). When these areas are included the area potentially available for dredged spoil
ponds is greater than 230 ha.
BASELINE SOILS REPORT, EAST TRINITY
29 September 2016 Report No. 1546223-004-R-Rev3 ii
Table of Contents
1.0 INTRODUCTION ........................................................................................................................................................ 1
2.0 DESKTOP ASSESSMENT – EAST TRINITY SITE ................................................................................................... 1
2.1 Site Background Information......................................................................................................................... 1
2.2 Topography................................................................................................................................................... 2
2.3 Geology ........................................................................................................................................................ 2
2.4 Soils .............................................................................................................................................................. 2
2.5 Acid Sulfate Soils .......................................................................................................................................... 3
2.6 Groundwater ................................................................................................................................................. 3
2.7 Geotechnical Conditions ............................................................................................................................... 4
3.0 DREDGED SPOIL MATERIAL .................................................................................................................................. 4
4.0 CONSTRAINTS AND OPPORTUNITIES .................................................................................................................. 4
4.1 Opportunities ................................................................................................................................................ 4
4.2 Constraints.................................................................................................................................................... 4
4.2.1 Pond and Pipeline Construction .............................................................................................................. 4
4.2.2 Insitu ASS Materials ................................................................................................................................ 5
4.2.3 Placement of Dredge Spoil Materials ...................................................................................................... 5
5.0 POTENTIAL IMPACTS .............................................................................................................................................. 5
5.1 ASS Materials ............................................................................................................................................... 5
5.1.1 Potential Level of Risk ............................................................................................................................. 5
5.1.2 Potential Impacts Associated with ASS ................................................................................................... 6
5.2 Dredged Spoil ............................................................................................................................................... 6
5.2.1 ASS ......................................................................................................................................................... 6
5.2.2 Treatment Options .................................................................................................................................. 6
5.3 Geotechnical ................................................................................................................................................. 7
6.0 REFERENCES ........................................................................................................................................................... 7
7.0 IMPORTANT INFORMATION .................................................................................................................................... 7
BASELINE SOILS REPORT, EAST TRINITY
29 September 2016 Report No. 1546223-004-R-Rev3 iii
FIGURES:
Figure 1- Site Location
Figure 2 - Surficial Geology
Figure 3 - Soil Stratigraphic Sections
Figure 4 - ASS Map 2009
Figure 5 - Soils Map 2015
Figure 6 – Construction Constraint Map
Figure 7 – ASS Constraint Map
APPENDICES:
APPENDIX A Important Information
Acronyms
AHD: Australian Height Datum
ASS: Acid Sulfate Soil
AASS: Actual Acid Sulfate Soil .
PASS: Potential Acid Sulfate Soil

BASELINE SOILS REPORT, EAST TRINITY
29 September 2016 Report No. 1546223-004-R-Rev3 1
1.0 INTRODUCTION
Flanagan Consulting Group (FCG) commissioned Golder Associates Pty Ltd (Golder) to provide advice and
assessment of soil issues as part of the Revised Draft Environmental Impact Statement for the Cairns
Shipping Development (CSD) project.
The revised CSD project involves the following:
Reduced channel widening and deepening plus dredging of the swing basin and berth pockets in the
inner port area (capital dredging). This will result in a total capital dredging volume of about 860 000m3.
This is an in-situ material volume calculated as occurring between current maintenance dredging
depths and the enlarged channel target depths including insurance depth and appropriate minimal over-
dredging allowances.
Land placement of capital dredge material at the following sites:
Northern Sands (an existing void in the Barron River delta created by sand extraction and now used
for burial of ‘inert’ construction and demolition fill and a limited quantity of PASS).
East Trinity (a new bunded site or sites within the general East Trinity area).
Other aspects of the CSD Project described in the Draft EIS remain unchanged.
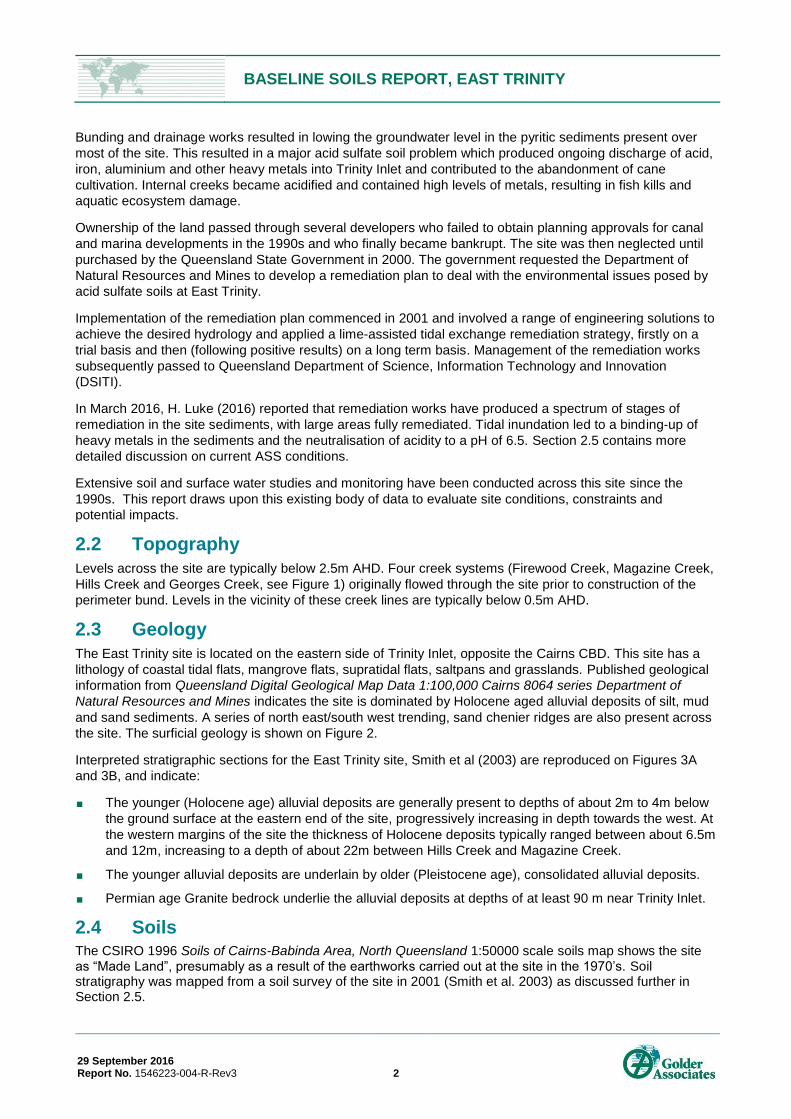
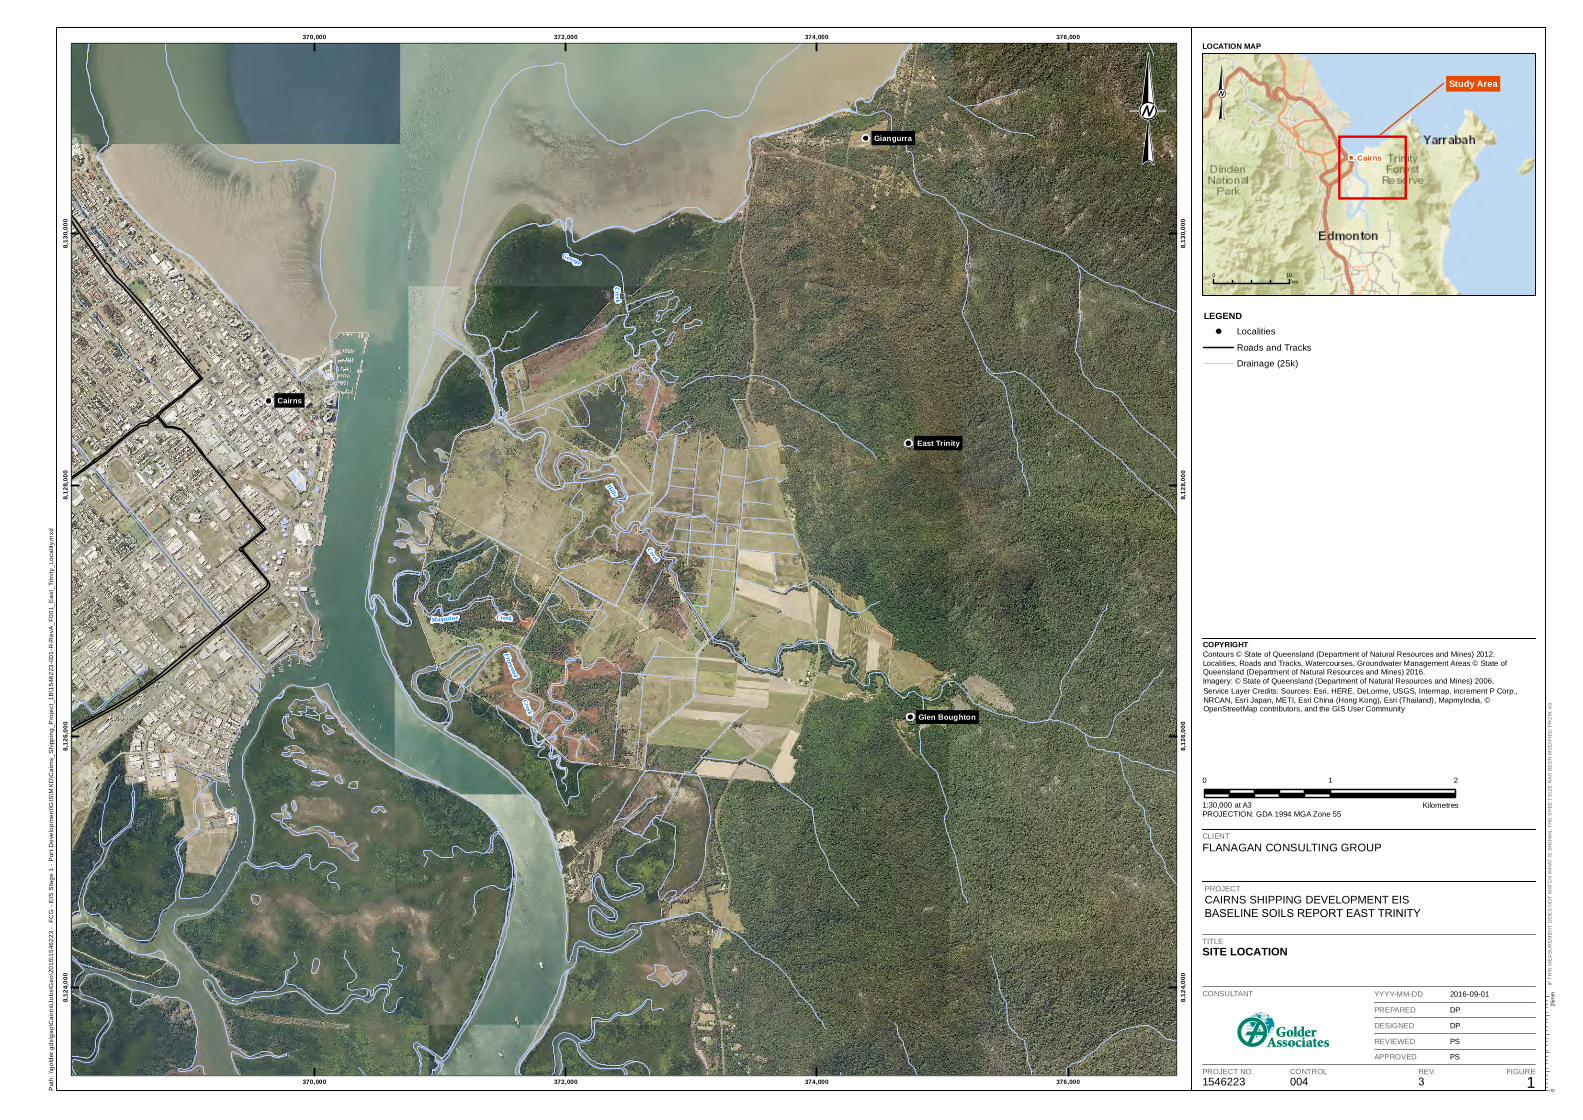
This report is based on a desktop review of available information and addresses the land placement of
capital dredged material at “East Trinity” – a new bunded site or sites within the East Trinity Reserve area,
see Figure 1. Conceptual land placement of dredged materials at East Trinity would have the following
requirements:
A pumping delivery line from Trinity Inlet to the dredged spoil ponds, including a pump out facility.
A placement area of 60 ha (i.e. approximately 1.9 M m3 of dredged spoil stored 3 m deep) plus an
additional area of about 8 hectares for perimeter bund walls. It is expected that the bund walls would be
formed using material sourced from the placement area footprint. This is expected to require excavation
to depths of less than 0.5m across this area.
A PASS treatment area ranging from about 6 ha to 12 ha (including allowance for bunding and
stockpiling).
Provision for tailwater treatment – subject to preliminary concept design.
The aims of this report are to describe the existing soil conditions associated with East Trinity and to identify:
Key soils related constraints (and opportunities) to design and construction of the facilities required for
placement of the dredged material.
Potential soils related environmental impacts and mitigation/management measures (to be subject to a
future detailed impact assessment).
2.0 DESKTOP ASSESSMENT – EAST TRINITY SITE
2.1 Site Background Information
The East Trinity Reserve covers an area of about 774 hectares and is located on what was formerly an
estuarine floodplain. In the early 1970s, CSR constructed a 7.2km bund wall along the southern, western
and northern site boundaries as the first step in draining the land to facilitate sugar cane cultivation. The
bund included one-way floodgates on Hills Creek and Firewood Creek and completely cut-off other creeks
which essentially eliminated tidal influence to the landward side of the bund wall.
Following bund construction, extensive vegetation clearing was conducted and in areas above about 0.5m
AHD a series of drains were installed. Mangrove communities were reported to have originally been found in
areas below 1m AHD with samphire communities generally located between 1m and 2m AHD.
BASELINE SOILS REPORT, EAST TRINITY
29 September 2016 Report No. 1546223-004-R-Rev3 2
Bunding and drainage works resulted in lowing the groundwater level in the pyritic sediments present over
most of the site. This resulted in a major acid sulfate soil problem which produced ongoing discharge of acid,
iron, aluminium and other heavy metals into Trinity Inlet and contributed to the abandonment of cane
cultivation. Internal creeks became acidified and contained high levels of metals, resulting in fish kills and
aquatic ecosystem damage.
Ownership of the land passed through several developers who failed to obtain planning approvals for canal
and marina developments in the 1990s and who finally became bankrupt. The site was then neglected until
purchased by the Queensland State Government in 2000. The government requested the Department of
Natural Resources and Mines to develop a remediation plan to deal with the environmental issues posed by
acid sulfate soils at East Trinity.
Implementation of the remediation plan commenced in 2001 and involved a range of engineering solutions to
achieve the desired hydrology and applied a lime-assisted tidal exchange remediation strategy, firstly on a
trial basis and then (following positive results) on a long term basis. Management of the remediation works
subsequently passed to Queensland Department of Science, Information Technology and Innovation
(DSITI).
In March 2016, H. Luke (2016) reported that remediation works have produced a spectrum of stages of
remediation in the site sediments, with large areas fully remediated. Tidal inundation led to a binding-up of
heavy metals in the sediments and the neutralisation of acidity to a pH of 6.5. Section 2.5 contains more
detailed discussion on current ASS conditions.
Extensive soil and surface water studies and monitoring have been conducted across this site since the
1990s. This report draws upon this existing body of data to evaluate site conditions, constraints and
potential impacts.
2.2 Topography
Levels across the site are typically below 2.5m AHD. Four creek systems (Firewood Creek, Magazine Creek,
Hills Creek and Georges Creek, see Figure 1) originally flowed through the site prior to construction of the
perimeter bund. Levels in the vicinity of these creek lines are typically below 0.5m AHD.
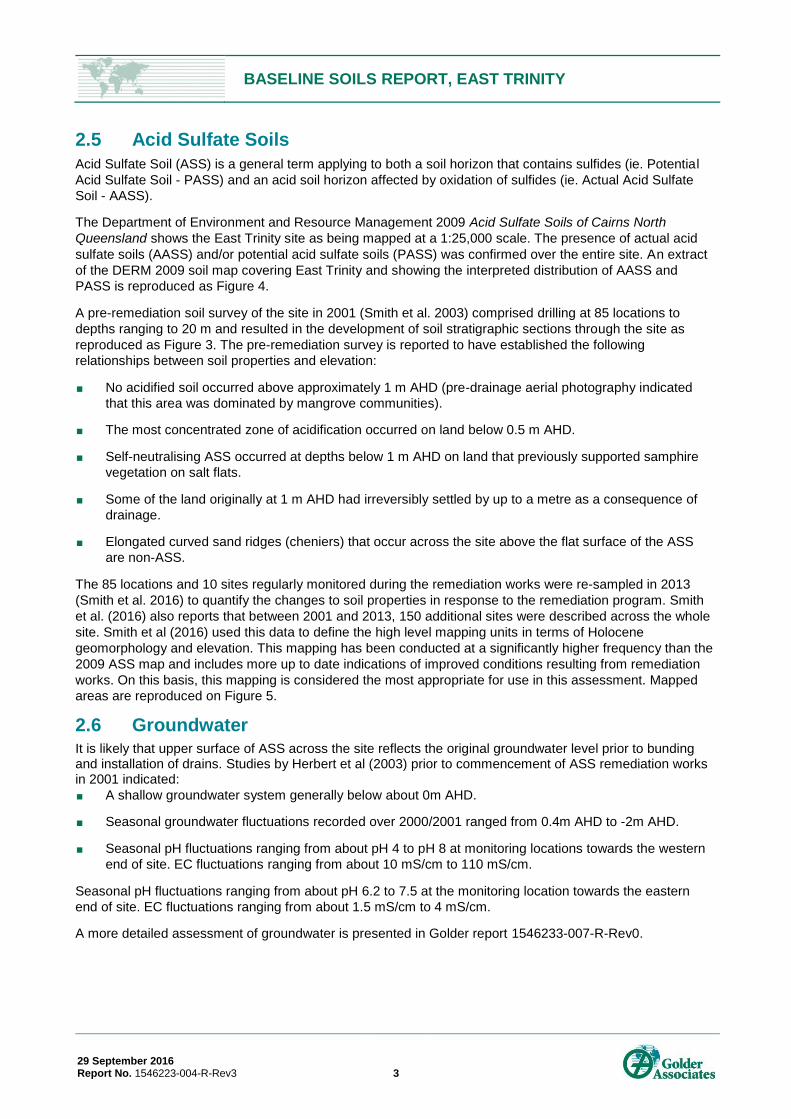
2.3 Geology
The East Trinity site is located on the eastern side of Trinity Inlet, opposite the Cairns CBD. This site has a
lithology of coastal tidal flats, mangrove flats, supratidal flats, saltpans and grasslands. Published geological
information from Queensland Digital Geological Map Data 1:100,000 Cairns 8064 series Department of
Natural Resources and Mines indicates the site is dominated by Holocene aged alluvial deposits of silt, mud
and sand sediments. A series of north east/south west trending, sand chenier ridges are also present across
the site. The surficial geology is shown on Figure 2.
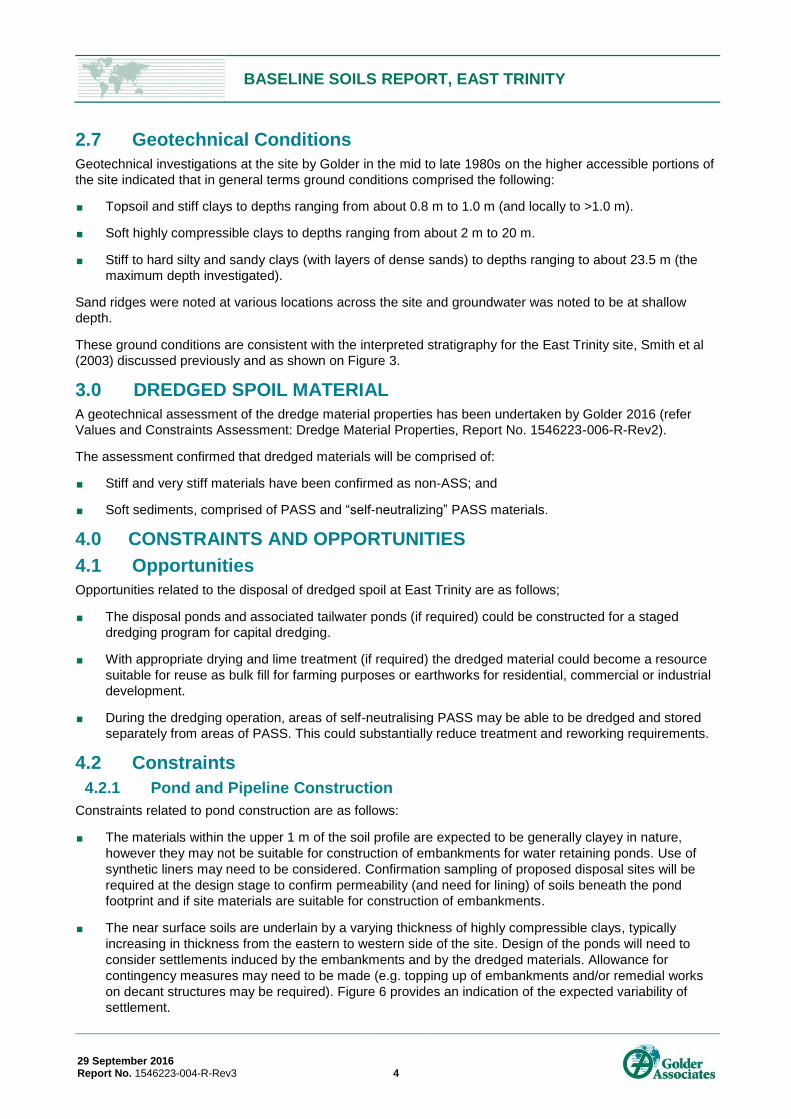
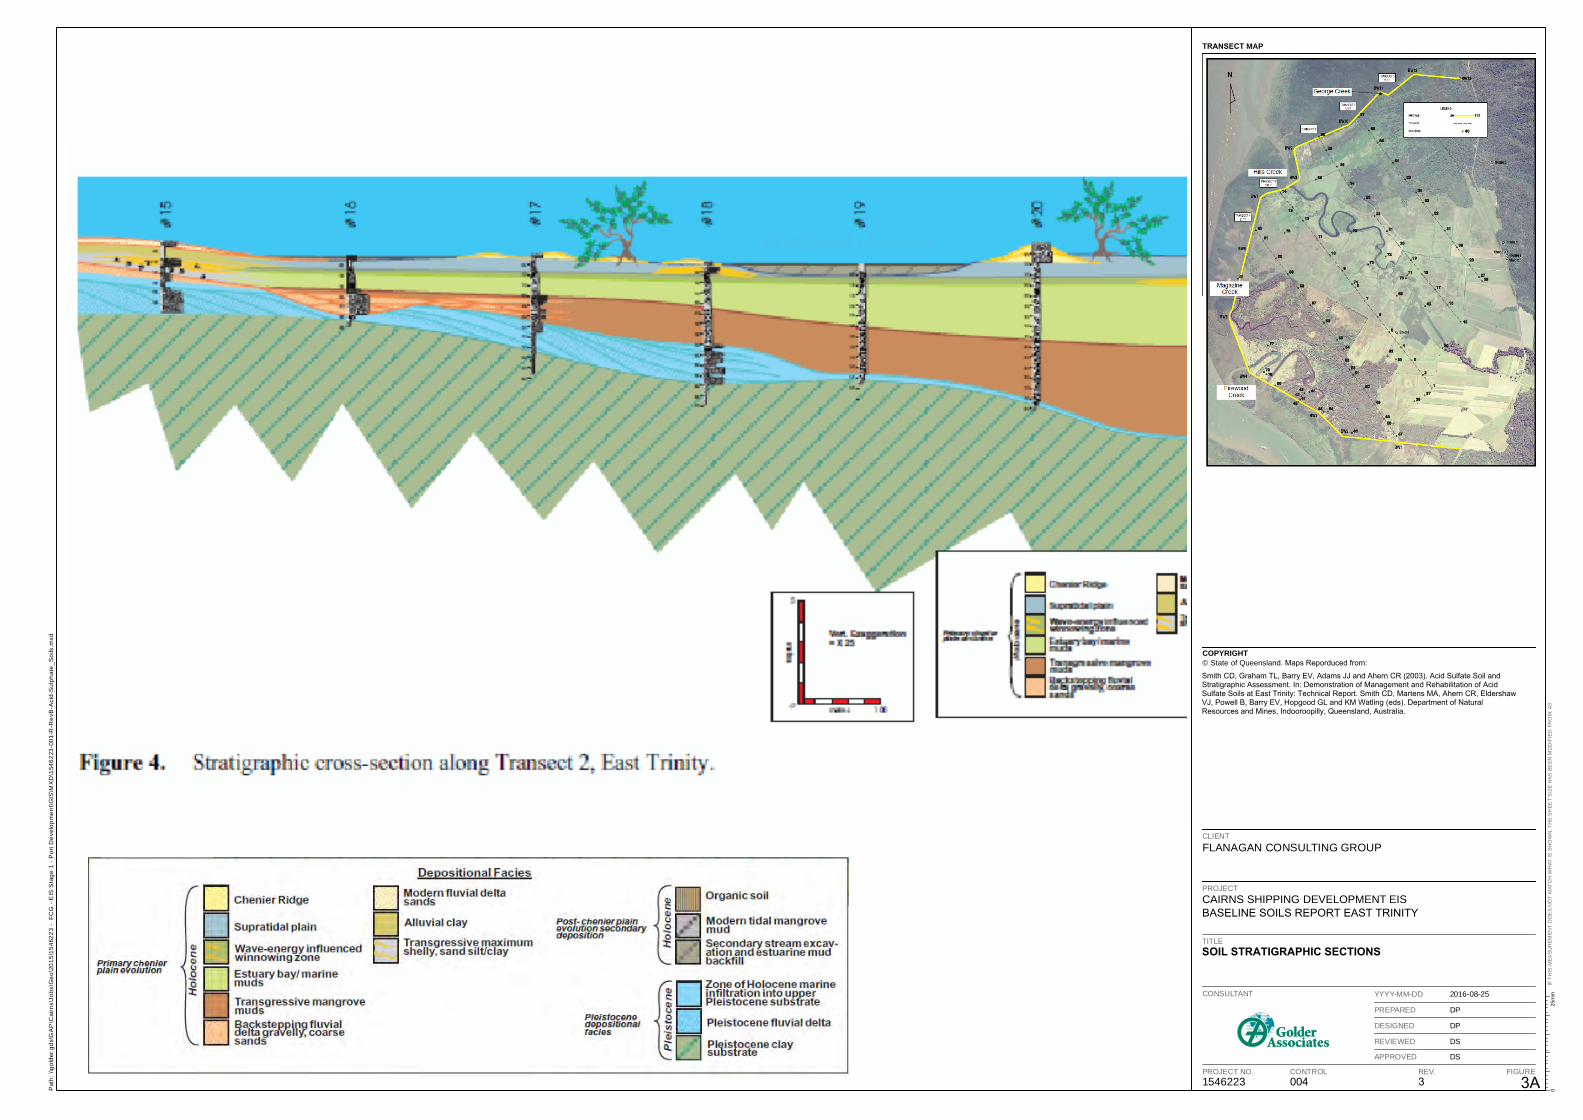
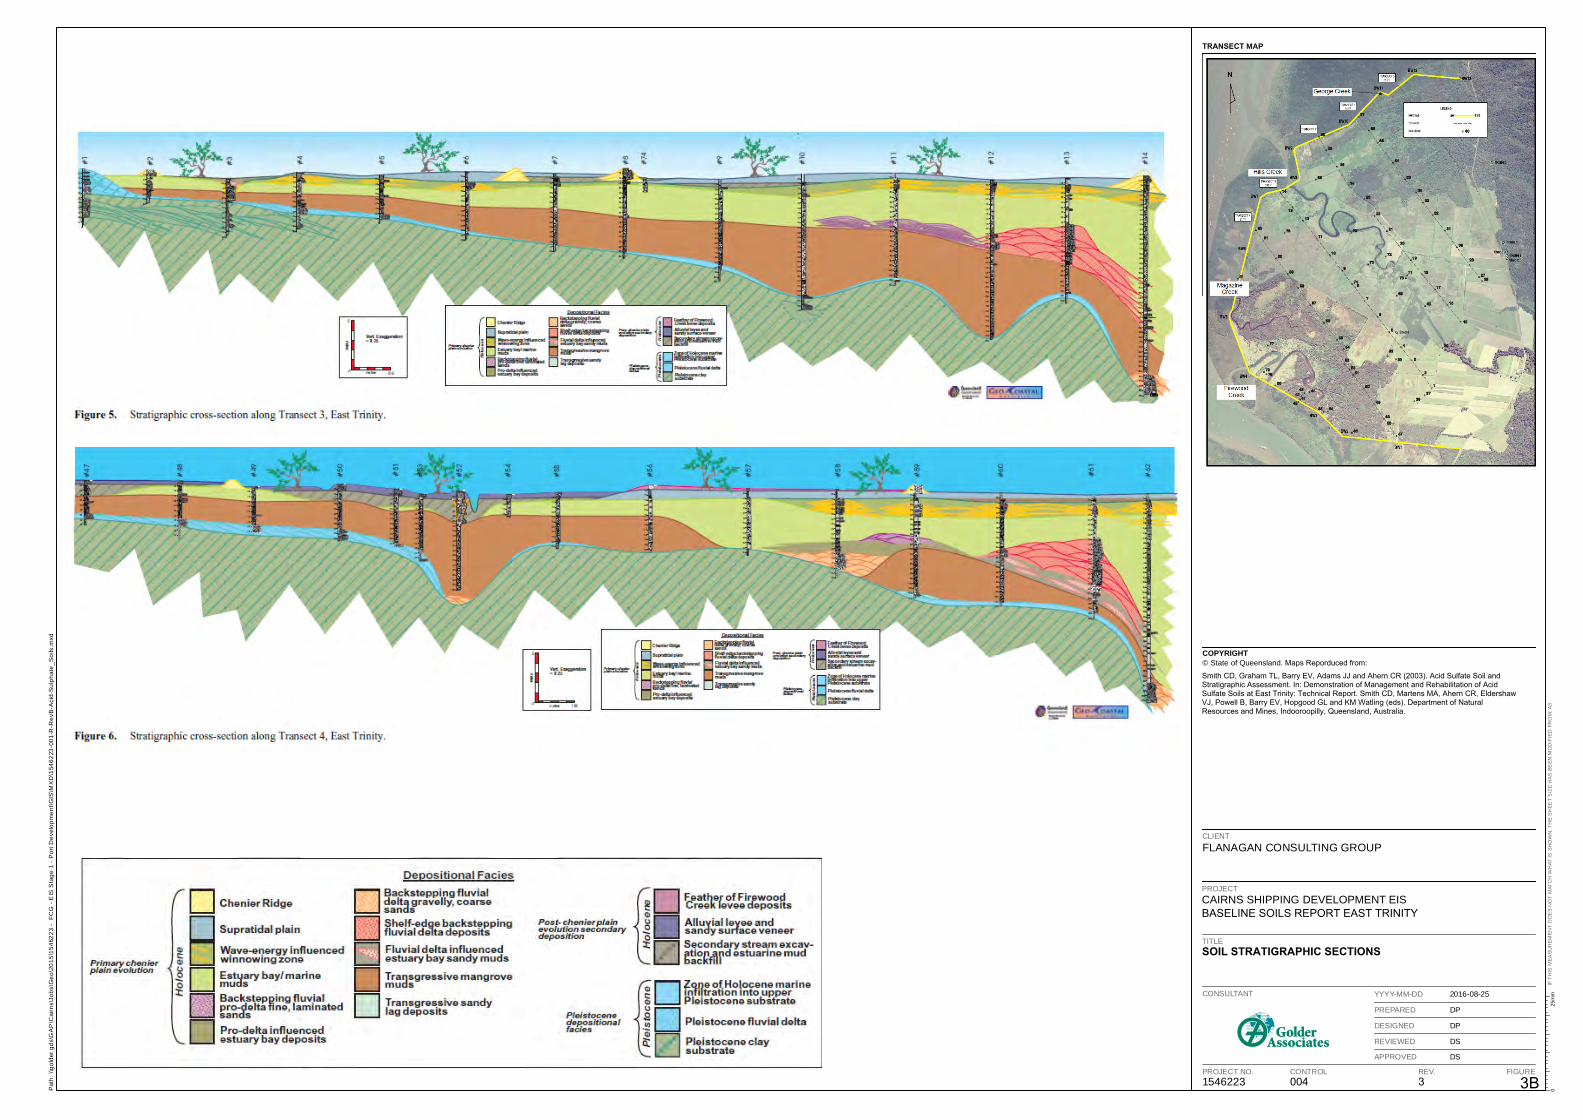
Interpreted stratigraphic sections for the East Trinity site, Smith et al (2003) are reproduced on Figures 3A
and 3B, and indicate:
The younger (Holocene age) alluvial deposits are generally present to depths of about 2m to 4m below
the ground surface at the eastern end of the site, progressively increasing in depth towards the west. At
the western margins of the site the thickness of Holocene deposits typically ranged between about 6.5m
and 12m, increasing to a depth of about 22m between Hills Creek and Magazine Creek.
The younger alluvial deposits are underlain by older (Pleistocene age), consolidated alluvial deposits.
Permian age Granite bedrock underlie the alluvial deposits at depths of at least 90 m near Trinity Inlet.
2.4 Soils The CSIRO 1996 Soils of Cairns-Babinda Area, North Queensland 1:50000 scale soils map shows the site as “Made Land”, presumably as a result of the earthworks carried out at the site in the 1970’s. Soil stratigraphy was mapped from a soil survey of the site in 2001 (Smith et al. 2003) as discussed further in Section 2.5.
BASELINE SOILS REPORT, EAST TRINITY
29 September 2016 Report No. 1546223-004-R-Rev3 3
2.5 Acid Sulfate Soils
Acid Sulfate Soil (ASS) is a general term applying to both a soil horizon that contains sulfides (ie. Potential
Acid Sulfate Soil - PASS) and an acid soil horizon affected by oxidation of sulfides (ie. Actual Acid Sulfate
Soil - AASS).
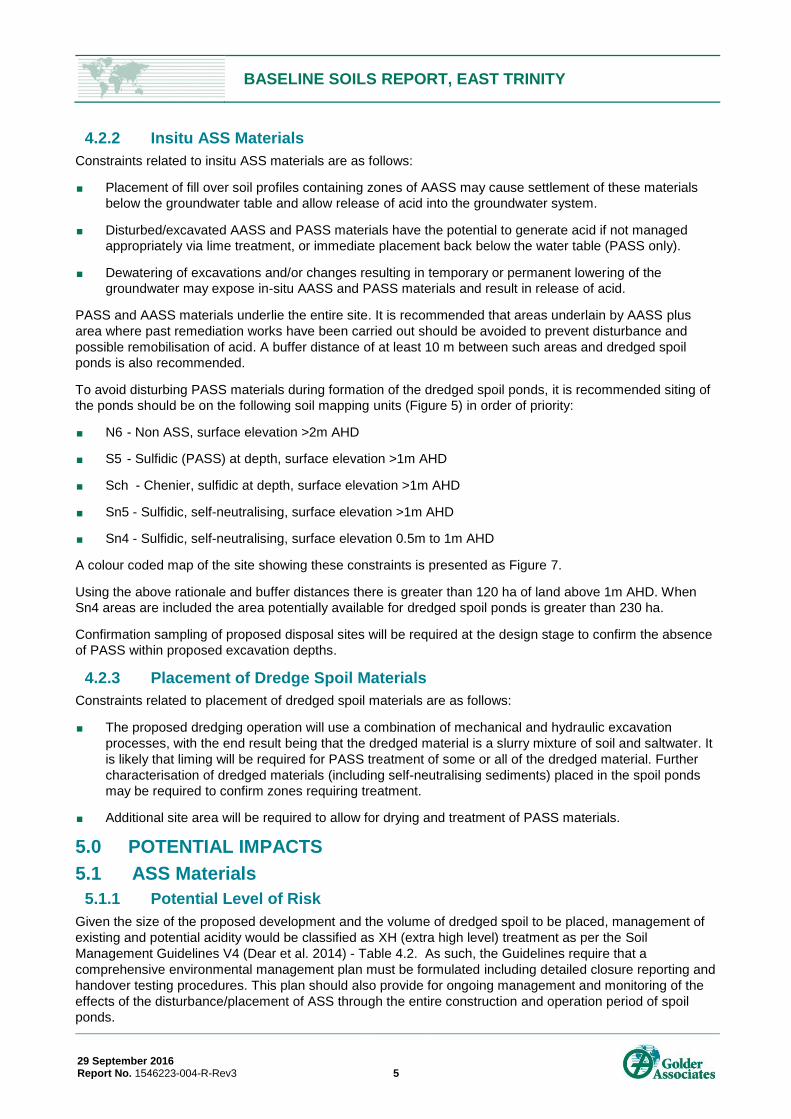
The Department of Environment and Resource Management 2009 Acid Sulfate Soils of Cairns North
Queensland shows the East Trinity site as being mapped at a 1:25,000 scale. The presence of actual acid
sulfate soils (AASS) and/or potential acid sulfate soils (PASS) was confirmed over the entire site. An extract
of the DERM 2009 soil map covering East Trinity and showing the interpreted distribution of AASS and
PASS is reproduced as Figure 4.
A pre-remediation soil survey of the site in 2001 (Smith et al. 2003) comprised drilling at 85 locations to
depths ranging to 20 m and resulted in the development of soil stratigraphic sections through the site as
reproduced as Figure 3. The pre-remediation survey is reported to have established the following
relationships between soil properties and elevation:
No acidified soil occurred above approximately 1 m AHD (pre-drainage aerial photography indicated
that this area was dominated by mangrove communities).
The most concentrated zone of acidification occurred on land below 0.5 m AHD.
Self-neutralising ASS occurred at depths below 1 m AHD on land that previously supported samphire
vegetation on salt flats.
Some of the land originally at 1 m AHD had irreversibly settled by up to a metre as a consequence of
drainage.
Elongated curved sand ridges (cheniers) that occur across the site above the flat surface of the ASS
are non-ASS.
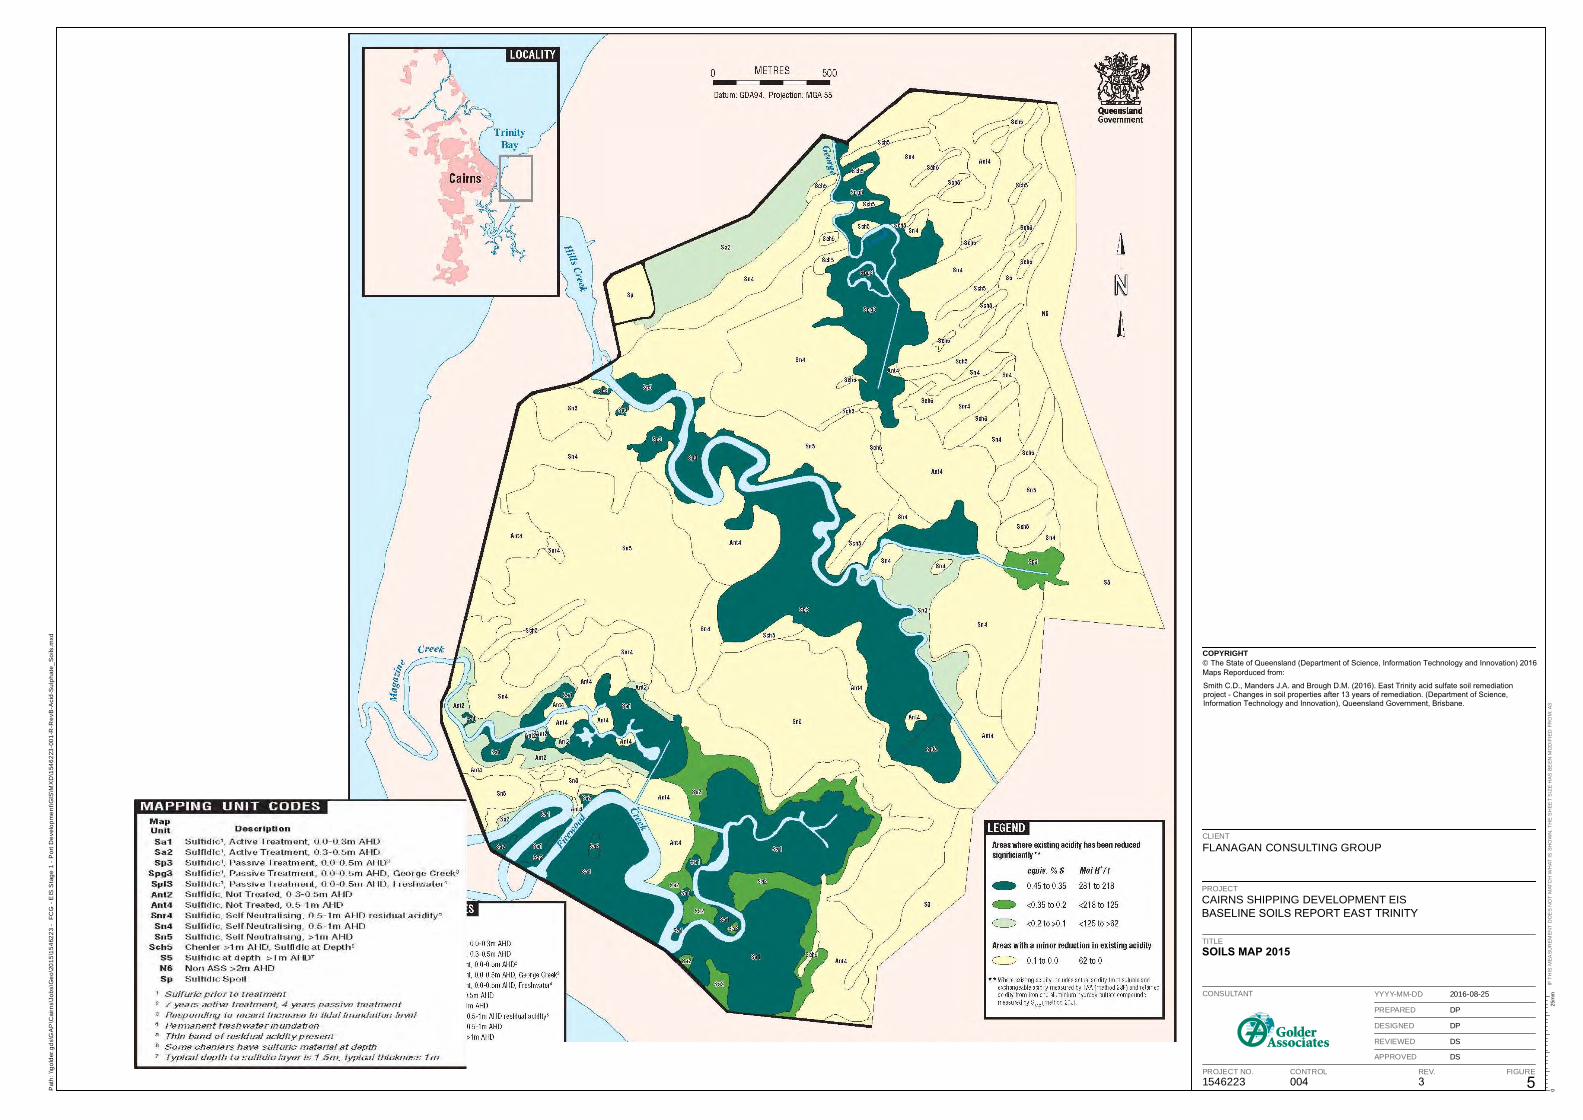
The 85 locations and 10 sites regularly monitored during the remediation works were re-sampled in 2013
(Smith et al. 2016) to quantify the changes to soil properties in response to the remediation program. Smith
et al. (2016) also reports that between 2001 and 2013, 150 additional sites were described across the whole
site. Smith et al (2016) used this data to define the high level mapping units in terms of Holocene
geomorphology and elevation. This mapping has been conducted at a significantly higher frequency than the
2009 ASS map and includes more up to date indications of improved conditions resulting from remediation
works. On this basis, this mapping is considered the most appropriate for use in this assessment. Mapped
areas are reproduced on Figure 5.
2.6 Groundwater It is likely that upper surface of ASS across the site reflects the original groundwater level prior to bunding and installation of drains. Studies by Herbert et al (2003) prior to commencement of ASS remediation works in 2001 indicated:
A shallow groundwater system generally below about 0m AHD.
Seasonal groundwater fluctuations recorded over 2000/2001 ranged from 0.4m AHD to -2m AHD.
Seasonal pH fluctuations ranging from about pH 4 to pH 8 at monitoring locations towards the western
end of site. EC fluctuations ranging from about 10 mS/cm to 110 mS/cm.
Seasonal pH fluctuations ranging from about pH 6.2 to 7.5 at the monitoring location towards the eastern
end of site. EC fluctuations ranging from about 1.5 mS/cm to 4 mS/cm.
A more detailed assessment of groundwater is presented in Golder report 1546233-007-R-Rev0.
BASELINE SOILS REPORT, EAST TRINITY
29 September 2016 Report No. 1546223-004-R-Rev3 4
2.7 Geotechnical Conditions
Geotechnical investigations at the site by Golder in the mid to late 1980s on the higher accessible portions of
the site indicated that in general terms ground conditions comprised the following:
Topsoil and stiff clays to depths ranging from about 0.8 m to 1.0 m (and locally to >1.0 m).
Soft highly compressible clays to depths ranging from about 2 m to 20 m.
Stiff to hard silty and sandy clays (with layers of dense sands) to depths ranging to about 23.5 m (the
maximum depth investigated).
Sand ridges were noted at various locations across the site and groundwater was noted to be at shallow
depth.
These ground conditions are consistent with the interpreted stratigraphy for the East Trinity site, Smith et al
(2003) discussed previously and as shown on Figure 3.
3.0 DREDGED SPOIL MATERIAL
A geotechnical assessment of the dredge material properties has been undertaken by Golder 2016 (refer
Values and Constraints Assessment: Dredge Material Properties, Report No. 1546223-006-R-Rev2).
The assessment confirmed that dredged materials will be comprised of:
Stiff and very stiff materials have been confirmed as non-ASS; and
Soft sediments, comprised of PASS and “self-neutralizing” PASS materials.
4.0 CONSTRAINTS AND OPPORTUNITIES
4.1 Opportunities
Opportunities related to the disposal of dredged spoil at East Trinity are as follows;
The disposal ponds and associated tailwater ponds (if required) could be constructed for a staged
dredging program for capital dredging.
With appropriate drying and lime treatment (if required) the dredged material could become a resource
suitable for reuse as bulk fill for farming purposes or earthworks for residential, commercial or industrial
development.
During the dredging operation, areas of self-neutralising PASS may be able to be dredged and stored
separately from areas of PASS. This could substantially reduce treatment and reworking requirements.
4.2 Constraints
4.2.1 Pond and Pipeline Construction
Constraints related to pond construction are as follows:
The materials within the upper 1 m of the soil profile are expected to be generally clayey in nature,
however they may not be suitable for construction of embankments for water retaining ponds. Use of
synthetic liners may need to be considered. Confirmation sampling of proposed disposal sites will be
required at the design stage to confirm permeability (and need for lining) of soils beneath the pond
footprint and if site materials are suitable for construction of embankments.
The near surface soils are underlain by a varying thickness of highly compressible clays, typically
increasing in thickness from the eastern to western side of the site. Design of the ponds will need to
consider settlements induced by the embankments and by the dredged materials. Allowance for
contingency measures may need to be made (e.g. topping up of embankments and/or remedial works
on decant structures may be required). Figure 6 provides an indication of the expected variability of
settlement.
BASELINE SOILS REPORT, EAST TRINITY
29 September 2016 Report No. 1546223-004-R-Rev3 5
4.2.2 Insitu ASS Materials
Constraints related to insitu ASS materials are as follows:
Placement of fill over soil profiles containing zones of AASS may cause settlement of these materials
below the groundwater table and allow release of acid into the groundwater system.
Disturbed/excavated AASS and PASS materials have the potential to generate acid if not managed
appropriately via lime treatment, or immediate placement back below the water table (PASS only).
Dewatering of excavations and/or changes resulting in temporary or permanent lowering of the
groundwater may expose in-situ AASS and PASS materials and result in release of acid.
PASS and AASS materials underlie the entire site. It is recommended that areas underlain by AASS plus
area where past remediation works have been carried out should be avoided to prevent disturbance and
possible remobilisation of acid. A buffer distance of at least 10 m between such areas and dredged spoil
ponds is also recommended.
To avoid disturbing PASS materials during formation of the dredged spoil ponds, it is recommended siting of
the ponds should be on the following soil mapping units (Figure 5) in order of priority:
N6 - Non ASS, surface elevation >2m AHD
S5 - Sulfidic (PASS) at depth, surface elevation >1m AHD
Sch - Chenier, sulfidic at depth, surface elevation >1m AHD
Sn5 - Sulfidic, self-neutralising, surface elevation >1m AHD
Sn4 - Sulfidic, self-neutralising, surface elevation 0.5m to 1m AHD
A colour coded map of the site showing these constraints is presented as Figure 7.
Using the above rationale and buffer distances there is greater than 120 ha of land above 1m AHD. When
Sn4 areas are included the area potentially available for dredged spoil ponds is greater than 230 ha.
Confirmation sampling of proposed disposal sites will be required at the design stage to confirm the absence
of PASS within proposed excavation depths.
4.2.3 Placement of Dredge Spoil Materials
Constraints related to placement of dredged spoil materials are as follows:
The proposed dredging operation will use a combination of mechanical and hydraulic excavation
processes, with the end result being that the dredged material is a slurry mixture of soil and saltwater. It
is likely that liming will be required for PASS treatment of some or all of the dredged material. Further
characterisation of dredged materials (including self-neutralising sediments) placed in the spoil ponds
may be required to confirm zones requiring treatment.
Additional site area will be required to allow for drying and treatment of PASS materials.
5.0 POTENTIAL IMPACTS
5.1 ASS Materials
5.1.1 Potential Level of Risk
Given the size of the proposed development and the volume of dredged spoil to be placed, management of
existing and potential acidity would be classified as XH (extra high level) treatment as per the Soil
Management Guidelines V4 (Dear et al. 2014) - Table 4.2. As such, the Guidelines require that a
comprehensive environmental management plan must be formulated including detailed closure reporting and
handover testing procedures. This plan should also provide for ongoing management and monitoring of the
effects of the disturbance/placement of ASS through the entire construction and operation period of spoil
ponds.

BASELINE SOILS REPORT, EAST TRINITY
29 September 2016 Report No. 1546223-004-R-Rev3 6
5.1.2 Potential Impacts Associated with ASS
When ASS is exposed to oxygen as a result of disturbance (via excavation or displacement) or drainage (via
dewatering or other means), pyrite can oxidise and forms sulfuric acid when combined with water. Sulfuric
acid can leach out of these affected soils and strip metals (including iron, aluminum and heavy metals) from
the surrounding soils. Acidic and metals impacted water can migrate into surface waters and groundwater.
These processes can lead to degradation of terrestrial vegetation through:
Stunting of root growth;
Increased toxicity from higher concentrations of aluminum, iron and manganese;
Reduced plant minerals and nutrients; and
Reduced resistance to pathogen attack.
Longer term impacts may include species die off and changes to vegetation cover (domination by more acid
tolerant species).
The discharge of acidic water to aquatic environments (especially estuarine) may cause the following
impacts:
Increased acidity and increased iron and aluminum concentrations may be toxic to some aquatic
organisms and may cause fish diseases (eg. red spot).
Iron and aluminum precipitates can affect water quality and coat stream banks, benthic (sediment-
dwelling) organisms and aquatic vegetation.
Aquatic vegetation communities may change to become dominated by acid tolerant species.
Deoxygenated water may also result from the secondary oxidation of the Fe2+ consuming oxygen and
lowering the level of dissolved oxygen in surface waters.
Acidified waters can also weaken concrete and steel infrastructure such as culverts, pipes and piles.
5.2 Dredged Spoil
5.2.1 ASS
If left untreated, zones of PASS within the placed dredge spoil will dry and oxidise. Acid generated from this
process may leach through unlined bunded areas and has the same potential impacts as discussed in
Section 5.1.2.
5.2.2 Treatment Options
Following disposal into ponds, the processes of settling and decanting, plus solar drying will reduce the
moisture content significantly to provide a soil material that can be excavated and reworked to enable lime
treatment. Options for lime treatment include the following;
Re-dredging and in-line lime dosing
Land farming
Pug mill treatment

BASELINE SOILS REPORT, EAST TRINITY
29 September 2016 Report No. 1546223-004-R-Rev3 7
5.3 Geotechnical
Potential geotechnical impacts resulting from construction and operation of the dredged material deposition
process include the following:
Settlement and/or failure of pipeline support foundations, possibly resulting in burst or leaking pipelines.
Seepage through pond walls as a result of dispersive soil properties, possibly resulting in a breach of
the pond wall.
Instability of the pond walls as a result of over-steep profiles and/or soft foundation conditions, possibly
resulting in overtopping of ponds.
Settlement of pond walls as a result of soft foundation conditions, possibly resulting in in overtopping of
ponds.
It is noted that all of the above impacts are likely to be able to be mitigated by appropriate geotechnical
investigation and design.
6.0 REFERENCES
Queensland Digital Geological Map Data 1:100,000 Cairns 8064 series Department of Natural Resources
and Mines
Commonwealth Scientific and Industrial Research Organisation (CSIRO) 2013 Soils of Babinda -Cairns
Area, North QLD 1996 (1:50,000 scale). Sourced from QGIS 9/2013 (DP_QLD_LAN_BBC_50K)
Smith CD, Graham TL, Barry EV, Adams JJ and Ahern CR (2003). Acid Sulfate Soil and Stratigraphic
Assessment. In: Demonstration of Management and Rehabilitation of Acid Sulfate Soils at East Trinity:
Technical Report. Smith CD, Martens MA, Ahern CR, Eldershaw VJ, Powell B, Barry EV, Hopgood GL and
KM Watling (eds). Department of Natural Resources and Mines, Indooroopilly, Queensland, Australia.
Herbert GC, Martens MA and Hopgood GL (2003). Groundwater Characterisation. In: Demonstration of
Management and Rehabilitation of Acid Sulfate Soils at East Trinity: Technical Report. Smith CD, Martens
MA, Ahern CR, Eldershaw VJ, Powell B, Barry EV, Hopgood GL and Watling KM (eds). Department of
Natural Resources and Mines, Indooroopilly, Queensland, Australia.
Manders J.A. O’Brien L.E. Morrison DW (2009). Acid Sulfate Soils of Cairns, North Queensland Department
of Environment and Resource Management, Indooroopilly, Queensland, Australia.
Dear, S-E., Ahern, C. R., O'Brien, L. E., Dobos, S. K., McElnea, A. E., Moore, N. G. & Watling, K. M. (2014).
Queensland Acid Sulfate Soil Technical Manual: Soil Management Guidelines. Brisbane: Department of
Science, Information Technology, Innovation and the Arts, Queensland Government
Smith C.D., Manders J.A. and Brough D.M. (2016). East Trinity acid sulfate soil remediation project –
Changes in soil properties after 13 years of remediation. (Department of Science, Information Technology
and Innovation), Queensland Government, Brisbane.
H. Luke (2016). East Trinity remediation and rehabilitation after Acid Sulfate Soil contamination, north
Queensland. Southern Cross University. Sourced from
https://site.emrprojectsummaries.org/2016/03/13/east-trinity-remediation-and-rehabilitation-after-acid-sulfate-
soil-contamination-north-queensland/
7.0 IMPORTANT INFORMATION
Your attention is drawn to the document - “Important Information relating to this report”, which is included as
an attachment to this report. The statements presented in this document are intended to advise you of what
your realistic expectations of this report should be. The document is not intended to reduce the level of
responsibility accepted by Golder Associates, but rather to ensure that all parties who may rely on this report
are aware of the responsibilities each assumes in so doing.

BASELINE SOILS REPORT, EAST TRINITY
29 September 2016 Report No. 1546223-004-R-Rev3 8
GOLDER ASSOCIATES PTY LTD
Paul Scells
Principal Geo-Environmental Engineer
PKS/MSC/ow
A.B.N. 64 006 107 857
Golder, Golder Associates and the GA globe design are trademarks of Golder Associates Corporation.
j:\geo\2015\1546223 - fcg - eis stage 1 - port development\corr out\stage 1 b soils\east trinity\1546223-004-r-rev3 east trinity baseline soils report.docx
LEGENDLocalitiesRoads and TracksDrainage (25k)
Path:
\\gold
er.gd
s\gap
\Cair
ns\Jo
bs\G
eo\20
15\15
4622
3 - F
CG - E
IS S
tage 1
- Po
rt De
velop
ment\
GIS\
MXD\
Cairn
s_Sh
ipping
_Proj
ect_1
B\15
4622
3-00
1-R-
RevA
_F00
1_Ea
st_Tri
nity_
Loca
lity.m
xd
Study Area
Cairns
LOCATION MAP
CLIENTFLANAGAN CONSULTING GROUP
PROJECTCAIRNS SHIPPING DEVELOPMENT EIS BASELINE SOILS REPORT EAST TRINITY
TITLESITE LOCATION
1546223 004 3 1
2016-09-01 DPDPPSPS
IF TH
IS M
EASU
REME
NT D
OES N
OT M
ATCH
WHA
T IS
SHOW
N, TH
E SHE
ET S
IZE H
AS BE
EN M
ODIFI
ED FR
OM: A
3
CONSULTANT
PROJECT NO. CONTROL REV. FIGURE
YYYY-MM-DDPREPAREDDESIGNEDREVIEWEDAPPROVED
25mm
0
Hills
Creek
George
Creek
FirewoodCreek
CreekMagazine
East Trinity
Giangurra
Cairns
Glen Boughton
370,000
370,000
372,000
372,000
374,000
374,000
376,000
376,000
8,124
,000
8,124
,000
8,126
,000
8,126
,000
8,128
,000
8,128
,000
8,130
,000
8,130
,000
0 1 2
Kilometres1:30,000 at A3PROJECTION: GDA 1994 MGA Zone 55
0 10km
Contours © State of Queensland (Department of Natural Resources and Mines) 2012.Localities, Roads and Tracks, Watercourses, Groundwater Management Areas © State ofQueensland (Department of Natural Resources and Mines) 2016.Imagery: © State of Queensland (Department of Natural Resources and Mines) 2006.
COPYRIGHT
Service Layer Credits: Sources: Esri, HERE, DeLorme, USGS, Intermap, increment P Corp.,NRCAN, Esri Japan, METI, Esri China (Hong Kong), Esri (Thailand), MapmyIndia, ©OpenStreetMap contributors, and the GIS User Community

LEGENDLocalitiesDrainage (25k)Roads and Tracks
Path:
\\gold
er.gd
s\GAP
\Cair
ns\Jo
bs\G
eo\20
15\15
4622
3 - F
CG - E
IS S
tage 1
- Po
rt Dev
elopm
ent\G
IS\M
XD\S
oils_
Geolo
gy_F
igures
\1546
223-0
01-R
-Rev
A_De
tailed
_Geo
logy.m
xd
Study Area
LOCATION MAP
CLIENTFLANAGAN CONSULTING GROUP
PROJECTCAIRNS SHIPPING DEVELOPMENT EIS BASELINE SOILS REPORT EAST TRINITY
TITLESURFICAL GEOLOGY
1546223 004 3 2
2016-08-25 DPDPDSDS
IF TH
IS M
EASU
REME
NT D
OES N
OT M
ATCH
WHA
T IS
SHOW
N, TH
E SHE
ET S
IZE H
AS BE
EN M
ODIFI
ED FR
OM: A
3
CONSULTANT
PROJECT NO. CONTROL REV. FIGURE
YYYY-MM-DDPREPAREDDESIGNEDREVIEWEDAPPROVED
25mm
0
Cairns
Qhcb
Qpfp
Qpfc
W
Qhct
Pgcya
Dh/hPgcmb
Qhmp
Qa
PRg\f
Pg
370,000
370,000
371,000
371,000
372,000
372,000
373,000
373,000
374,000
374,000
8,126
,000
8,126
,000
8,127
,000
8,127
,000
8,128
,000
8,128
,000
8,129
,000
8,129
,000
8,130
,000
8,130
,000
0 250 500 750 1,000
METRES1:20,000 at A3PROJECTION: GDA 1994 MGA Zone 55
0 10km
Detailed GeologyBessie Point Granite: Granite.
Hodgkinson Formation/h: Hornfelsed/metasomatised arenite and mudstone.
PRg\f-8064: Fine to medium pink biotite granite.
Pg-8064: Fine to medium biotite granite.
Qa-QLD: Clay, silt, sand, gravel; f lood-plain alluvium.Qhcb-QLD: Moderately well-sorted, fine to coarse-grained quartzose to shelleysand and some gravel: beach ridges and cheniers.Qhct-QLD: Coastal tidal flats, mangrove flats, supratidal flats, saltpans andgrasslands - silt, mud and sand, minor salt.Qhmp-8064: Prodelta mud, sandy mud, muddy sand.Qpfc-8064: Steep alluvial and colluvial fans, cones and aprons - coarseboulder deposits (on granites), silty and clayey gravel (on metasediments).Qpfp-8064: Gentle to very gentle coalescing alluvial fans - silty gravelsgrading to gravelly clay, clay and silt.Yarrabah Granite: Coarse biotite granite, porphyritic in part.
Water body (unspecified): Water body, unspecif ied.
Geology: © State of Queensland (Department of Employment, Economic Development andInnovation), 2011.All other data © State of Queensland (Department of Natural Resources and Mines) 2016.
COPYRIGHT
Service Layer Credits: Sources: Esri, HERE, DeLorme, USGS, Intermap, increment P Corp.,NRCAN, Esri Japan, METI, Esri China (Hong Kong), Esri (Thailand), MapmyIndia, ©OpenStreetMap contributors, and the GIS User Community
Path:
\\gold
er.gd
s\GAP
\Cair
ns\Jo
bs\G
eo\20
15\15
4622
3 - F
CG - E
IS S
tage 1
- Po
rt Dev
elopm
ent\G
IS\M
XD\15
4622
3-00
1-R-R
evB-
Acid-
Sulph
ate_S
oils.m
xd
TRANSECT MAP
CLIENTFLANAGAN CONSULTING GROUP
PROJECTCAIRNS SHIPPING DEVELOPMENT EIS BASELINE SOILS REPORT EAST TRINITY
TITLESOIL STRATIGRAPHIC SECTIONS
1546223 004 3 3A
2016-08-25 DPDPDSDS
IF TH
IS M
EASU
REME
NT D
OES N
OT M
ATCH
WHA
T IS
SHOW
N, TH
E SHE
ET S
IZE H
AS BE
EN M
ODIFI
ED FR
OM: A
3
CONSULTANT
PROJECT NO. CONTROL REV. FIGURE
YYYY-MM-DDPREPAREDDESIGNEDREVIEWEDAPPROVED
25mm
0
COPYRIGHT© State of Queensland. Maps Reporduced from: Smith CD, Graham TL, Barry EV, Adams JJ and Ahern CR (2003). Acid Sulfate Soil and Stratigraphic Assessment. In: Demonstration of Management and Rehabilitation of Acid Sulfate Soils at East Trinity: Technical Report. Smith CD, Martens MA, Ahern CR, Eldershaw VJ, Powell B, Barry EV, Hopgood GL and KM Watling (eds). Department of Natural Resources and Mines, Indooroopilly, Queensland, Australia.
Path:
\\gold
er.gd
s\GAP
\Cair
ns\Jo
bs\G
eo\20
15\15
4622
3 - F
CG - E
IS S
tage 1
- Po
rt Dev
elopm
ent\G
IS\M
XD\15
4622
3-00
1-R-R
evB-
Acid-
Sulph
ate_S
oils.m
xd
TRANSECT MAP
CLIENTFLANAGAN CONSULTING GROUP
PROJECTCAIRNS SHIPPING DEVELOPMENT EIS BASELINE SOILS REPORT EAST TRINITY
TITLESOIL STRATIGRAPHIC SECTIONS
1546223 004 3 3B
2016-08-25 DPDPDSDS
IF TH
IS M
EASU
REME
NT D
OES N
OT M
ATCH
WHA
T IS
SHOW
N, TH
E SHE
ET S
IZE H
AS BE
EN M
ODIFI
ED FR
OM: A
3
CONSULTANT
PROJECT NO. CONTROL REV. FIGURE
YYYY-MM-DDPREPAREDDESIGNEDREVIEWEDAPPROVED
25mm
0
COPYRIGHT© State of Queensland. Maps Reporduced from: Smith CD, Graham TL, Barry EV, Adams JJ and Ahern CR (2003). Acid Sulfate Soil and Stratigraphic Assessment. In: Demonstration of Management and Rehabilitation of Acid Sulfate Soils at East Trinity: Technical Report. Smith CD, Martens MA, Ahern CR, Eldershaw VJ, Powell B, Barry EV, Hopgood GL and KM Watling (eds). Department of Natural Resources and Mines, Indooroopilly, Queensland, Australia.

LEGEND
ASS overlie Potential ASSPotential ASS with Self-Neutralising Capacity
S0: Potential ASS in top 0.5m.S1: Potential ASS starting at 0.5 to 1m.S2: Potential ASS starting at 1 to 2m.S3: Potential ASS starting at 2 to 3m.S5: Potential ASS starting at 4 to 5m.SDL: Disturbed land with probability of ASS.LP: Land at or below 5m AHD with low probability of ASS.
Path:
\\gold
er.gd
s\GAP
\Cair
ns\Jo
bs\G
eo\20
15\15
4622
3 - F
CG - E
IS S
tage 1
- Po
rt Dev
elopm
ent\G
IS\M
XD\S
oils_
Geolo
gy_F
igures
\1546
223-0
01-R
-Rev
B-Ac
id-Su
lphate
_Soil
s.mxd
Study Area
LOCATION MAP
CLIENTFLANAGAN CONSULTING GROUP
PROJECTCAIRNS SHIPPING DEVELOPMENT EIS BASELINE SOILS REPORT EAST TRINITY
TITLEASS MAP 2009
1546223 004 3 4
2016-08-25 DPDPDSDS
IF TH
IS M
EASU
REME
NT D
OES N
OT M
ATCH
WHA
T IS
SHOW
N, TH
E SHE
ET S
IZE H
AS BE
EN M
ODIFI
ED FR
OM: A
3
CONSULTANT
PROJECT NO. CONTROL REV. FIGURE
YYYY-MM-DDPREPAREDDESIGNEDREVIEWEDAPPROVED
25mm
0
Cairns
S0N
SDL
SDL
A0S1
A0S0
S1
A0S1
S2N
S2NS0
S0
S2N
S1N
S0
A0S0
A1S1
S0
S0
S0N
S1N
S2N
S0
S2
S3
A0S0
S1N
S1N
S1N
S2N
S2
S1N
a0LP
A0S0
S0
S5
S0
S1
S0
A0S0A0S0
S1N
S0
S2N
S1N
S1N
S1N
LP
A0S0
370,000
370,000
371,000
371,000
372,000
372,000
373,000
373,000
374,000
374,000
8,126
,000
8,126
,000
8,127
,000
8,127
,000
8,128
,000
8,128
,000
8,129
,000
8,129
,000
8,130
,000
8,130
,000
0 250 500 750 1,000
METRES1:20,000 at A3PROJECTION: GDA 1994 MGA Zone 55
0 10km
Soils: © State of Queensland (Department of Science, Information Technology and Innovation)2016.All other data © State of Queensland (Department of Natural Resources and Mines) 2016.
COPYRIGHT
Service Layer Credits: Sources: Esri, HERE, DeLorme, USGS, Intermap, increment P Corp.,NRCAN, Esri Japan, METI, Esri China (Hong Kong), Esri (Thailand), MapmyIndia, ©OpenStreetMap contributors, and the GIS User Community
A0: Actual ASS starting in top 0.5m.
A1: Actual ASS starting at 0.5 to 1m.
N: Indicated Self-Neutralising
Path:
\\gold
er.gd
s\GAP
\Cair
ns\Jo
bs\G
eo\20
15\15
4622
3 - F
CG - E
IS S
tage 1
- Po
rt Dev
elopm
ent\G
IS\M
XD\15
4622
3-00
1-R-R
evB-
Acid-
Sulph
ate_S
oils.m
xd
CLIENTFLANAGAN CONSULTING GROUP
PROJECTCAIRNS SHIPPING DEVELOPMENT EIS BASELINE SOILS REPORT EAST TRINITY
TITLESOILS MAP 2015
1546223 004 3 5
2016-08-25 DPDPDSDS
IF TH
IS M
EASU
REME
NT D
OES N
OT M
ATCH
WHA
T IS
SHOW
N, TH
E SHE
ET S
IZE H
AS BE
EN M
ODIFI
ED FR
OM: A
3
CONSULTANT
PROJECT NO. CONTROL REV. FIGURE
YYYY-MM-DDPREPAREDDESIGNEDREVIEWEDAPPROVED
25mm
0
COPYRIGHT© The State of Queensland (Department of Science, Information Technology and Innovation) 2016 Maps Reporduced from: Smith C.D., Manders J.A. and Brough D.M. (2016). East Trinity acid sulfate soil remediation project - Changes in soil properties after 13 years of remediation. (Department of Science, Information Technology and Innovation), Queensland Government, Brisbane.
LEGENDLocalitiesRoads and TracksDrainage (25k)
Path:
\\gold
er.gd
s\gap
\Cair
ns\Jo
bs\G
eo\20
15\15
4622
3 - F
CG - E
IS S
tage 1
- Po
rt De
velop
ment\
GIS\
MXD\
Cairn
s_Sh
ipping
_Proj
ect_1
B\15
4622
3-00
1-R-
RevA
_F00
1_Ea
st_Tri
nity_
Loca
lity.m
xd
Study Area
Cairns
LOCATION MAP
CLIENTFLANAGAN CONSULTING GROUP
PROJECTCAIRNS SHIPPING DEVELOPMENT EIS BASELINE SOILS REPORT EAST TRINITY
TITLECONSTRUCTION CONSTRAINT MAP
1546223 004 3 6
2016-09-01 DPDPPSPS
IF TH
IS M
EASU
REME
NT D
OES N
OT M
ATCH
WHA
T IS
SHOW
N, TH
E SHE
ET S
IZE H
AS BE
EN M
ODIFI
ED FR
OM: A
3
CONSULTANT
PROJECT NO. CONTROL REV. FIGURE
YYYY-MM-DDPREPAREDDESIGNEDREVIEWEDAPPROVED
25mm
0
Hills
Creek
George
Creek
FirewoodCreek
CreekMagazine
East Trinity
Giangurra
Cairns
Glen Boughton
370,000
370,000
372,000
372,000
374,000
374,000
376,000
376,000
8,124
,000
8,124
,000
8,126
,000
8,126
,000
8,128
,000
8,128
,000
8,130
,000
8,130
,000
0 1 2
Kilometres1:30,000 at A3PROJECTION: GDA 1994 MGA Zone 55
0 10km
Contours © State of Queensland (Department of Natural Resources and Mines) 2012.Localities, Roads and Tracks, Watercourses, Groundwater Management Areas © State ofQueensland (Department of Natural Resources and Mines) 2016.Imagery: © State of Queensland (Department of Natural Resources and Mines) 2006.
COPYRIGHT
Service Layer Credits: Sources: Esri, HERE, DeLorme, USGS, Intermap, increment P Corp.,NRCAN, Esri Japan, METI, Esri China (Hong Kong), Esri (Thailand), MapmyIndia, ©OpenStreetMap contributors, and the GIS User Community

Path:
\\gold
er.gd
s\GAP
\Cair
ns\Jo
bs\G
eo\20
15\15
4622
3 - F
CG - E
IS S
tage 1
- Po
rt Dev
elopm
ent\G
IS\M
XD\15
4622
3-00
1-R-R
evB-
Acid-
Sulph
ate_S
oils.m
xd
CLIENTFLANAGAN CONSULTING GROUP
PROJECTCAIRNS SHIPPING DEVELOPMENT EIS BASELINE SOILS REPORT EAST TRINITY
TITLEASS CONSTRAINT MAP
1546223 004 3 7
2016-08-31 DPDPPKS
PKS
IF TH
IS M
EASU
REME
NT D
OES N
OT M
ATCH
WHA
T IS
SHOW
N, TH
E SHE
ET S
IZE H
AS BE
EN M
ODIFI
ED FR
OM: A
3
CONSULTANT
PROJECT NO. CONTROL REV. FIGURE
YYYY-MM-DDPREPAREDDESIGNEDREVIEWEDAPPROVED
25mm
0
COPYRIGHT© The State of Queensland (Department of Science, Information Technology and Innovation) 2016 Maps Reporduced from: Smith C.D., Manders J.A. and Brough D.M. (2016). East Trinity acid sulfate soil remediation project - Changes in soil properties after 13 years of remediation. (Department of Science, Information Technology and Innovation), Queensland Government, Brisbane.
BASELINE SOILS REPORT, EAST TRINITY
29 September 2016 Report No. 1546223-004-R-Rev3
APPENDIX A Important Information
IMPORTANT INFORMATION RELATING TO THIS REPORT
The document (“Report”) to which this page is attached and which this page forms a part of, has been issued by Golder Associates Pty Ltd (“Golder”) subject to the important limitations and other qualifications set out below. This Report constitutes or is part of services (“Services”) provided by Golder to its client (“Client”) under and subject to a contract between Golder and its Client (“Contract”). The contents of this page are not intended to and do not alter Golder’s obligations (including any limits on those obligations) to its Client under the Contract. This Report is provided for use solely by Golder’s Client and persons acting on the Client’s behalf, such as its professional advisers. Golder is responsible only to its Client for this Report. Golder has no responsibility to any other person who relies or makes decisions based upon this Report or who makes any other use of this Report. Golder accepts no responsibility for any loss or damage suffered by any person other than its Client as a result of any reliance upon any part of this Report, decisions made based upon this Report or any other use of it. This Report has been prepared in the context of the circumstances and purposes referred to in, or derived from, the Contract and Golder accepts no responsibility for use of the Report, in whole or in part, in any other context or circumstance or for any other purpose. The scope of Golder’s Services and the period of time they relate to are determined by the Contract and are subject to restrictions and limitations set out in the Contract. If a service or other work is not expressly referred to in this Report, do not assume that it has been provided or performed. If a matter is not addressed in this Report, do not assume that any determination has been made by Golder in regards to it. At any location relevant to the Services conditions may exist which were not detected by Golder, in particular due to the specific scope of the investigation Golder has been engaged to undertake. Conditions can only be verified at the exact location of any tests undertaken. Variations in conditions may occur between tested locations and there may be conditions which have not been revealed by the investigation and which have not therefore been taken into account in this Report. Golder accepts no responsibility for and makes no representation as to the accuracy or completeness of the information provided to it by or on behalf of the Client or sourced from any third party. Golder has assumed that such information is correct unless otherwise stated and no responsibility is accepted by Golder for incomplete or inaccurate data supplied by its Client or any other person for whom Golder is not responsible. Golder has not taken account of matters that may have existed when the Report was prepared but which were only later disclosed to Golder. Having regard to the matters referred to in the previous paragraphs on this page in particular, carrying out the Services has allowed Golder to form no more than an opinion as to the actual conditions at any relevant location. That opinion is necessarily constrained by the extent of the information collected by Golder or otherwise made available to Golder. Further, the passage of time may affect the accuracy, applicability or usefulness of the opinions, assessments or other information in this Report. This Report is based upon the information and other circumstances that existed and were known to Golder when the Services were performed and this Report was prepared. Golder has not considered the effect of any possible future developments including physical changes to any relevant location or changes to any laws or regulations relevant to such location. Where permitted by the Contract, Golder may have retained subconsultants affiliated with Golder to provide some or all of the Services. However, it is Golder which remains solely responsible for the Services and there is no legal recourse against any of Golder’s affiliated companies or the employees, officers or directors of any of them. By date, or revision, the Report supersedes any prior report or other document issued by Golder dealing with any matter that is addressed in the Report. Any uncertainty as to the extent to which this Report can be used or relied upon in any respect should be referred to Golder for clarification.
GAP Form No. LEG04 RL2 July 2015 1/1
Golder Associates Pty Ltd
216 Draper Street
Cairns, Queensland 4870
Australia
T: +61 7 4054 8200
Caption Text