cad for pest control presentation
TRANSCRIPT
INTRODUCING
CAD-DrawnDevice Maps and Site
Graphs
VIRTUAL ASSISTANCEFor
Commercial Pest Management Providers
Targeting customers with large facilities in regulated industries
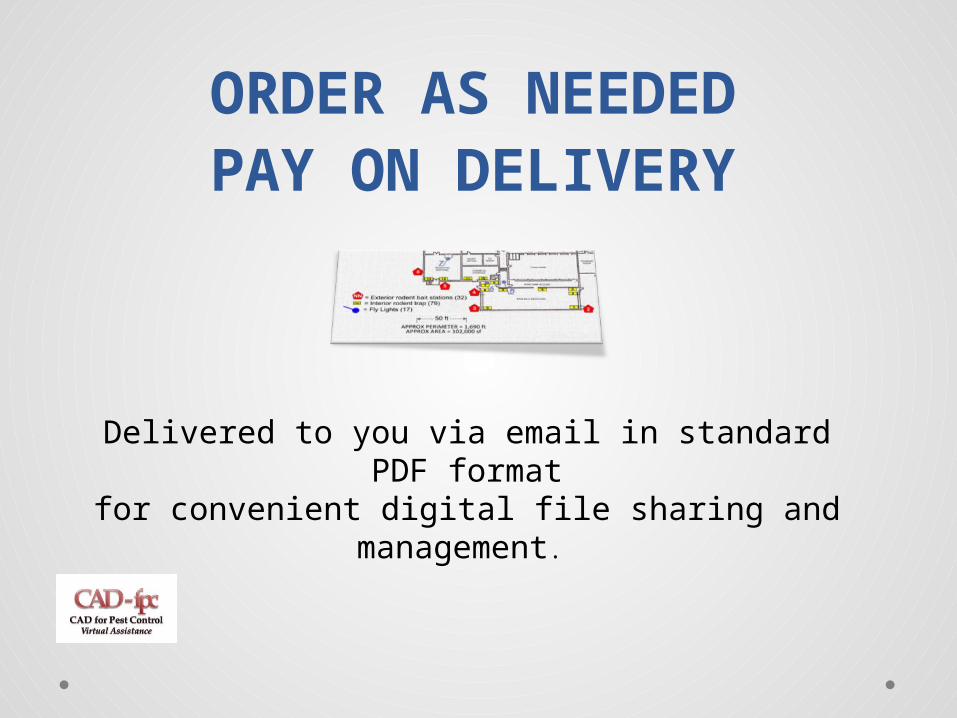
Delivered to you via email in standard PDF format
for convenient digital file sharing and management.
ORDER AS NEEDEDPAY ON DELIVERY
Pest Monitor Device & Service Location Maps
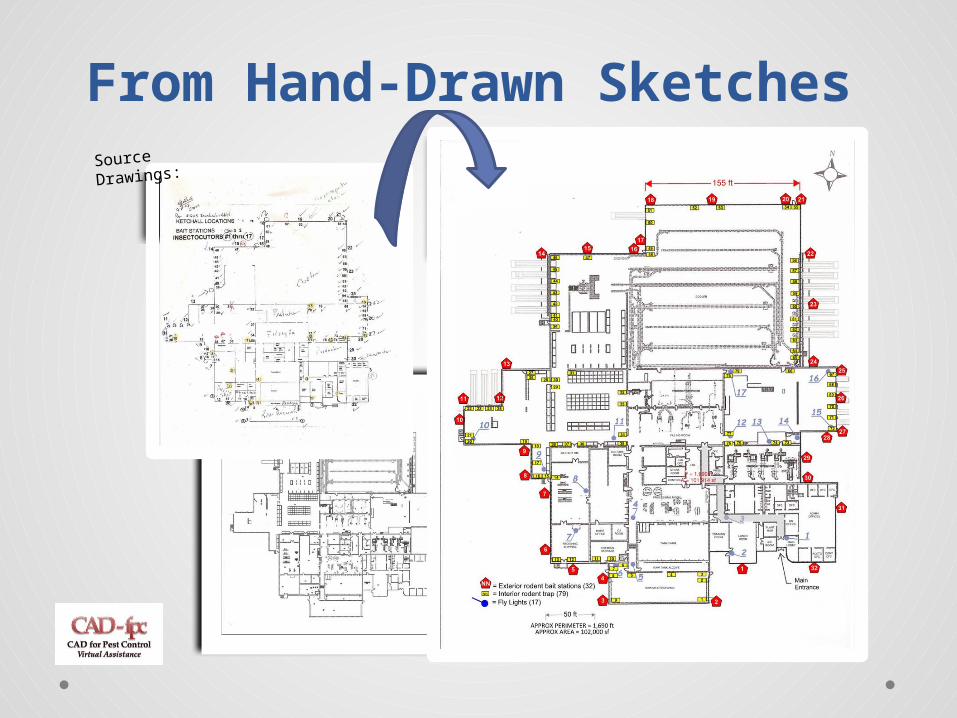
"Device Maps" are 2D, CAD drawn floor plans with all interior and exterior monitor devices accurately mapped with color-coded symbols and numbered for service and audit compliance.
Maps are created from graphic instructions that you provide with either hand-drawn sketches or hand-marked architectural drawings.
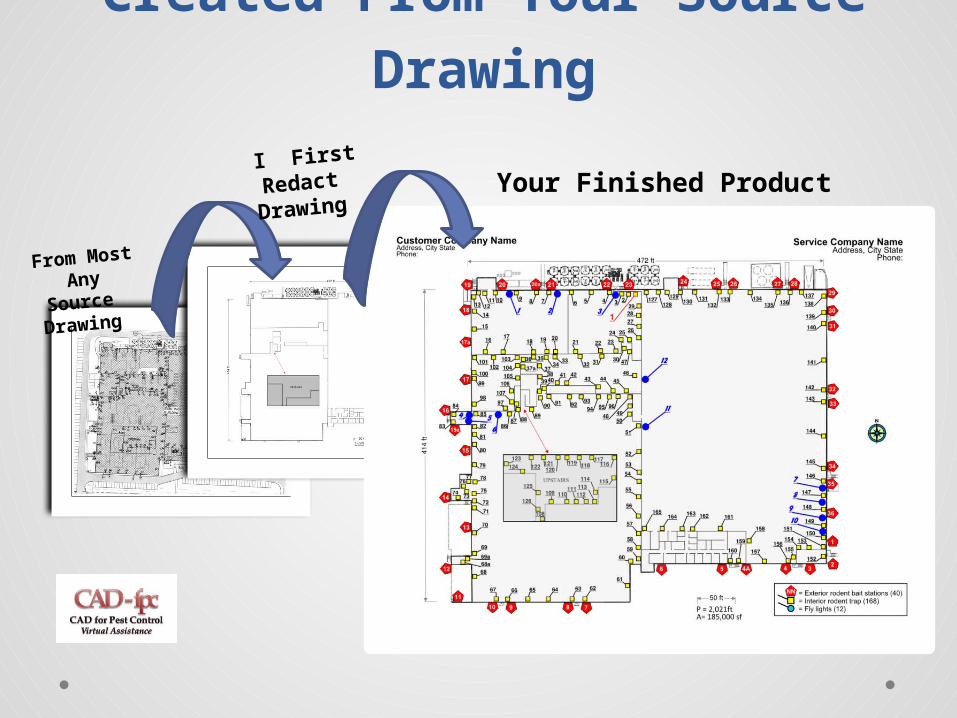
Created From Your Source Drawing
From
Most Any
Source
Drawing
I First
Redact
Drawing Your Finished Product

Source
Drawings
From Architectural Drawing
Source
Drawings:
From Hand-Drawn Sketches

Source Drawing :
Pre-measured Site Graph by
CAD-fpc
Device Location MapDrawn to Scale
Food-Grade Container Warehouse
From Pre-Measured Graphs
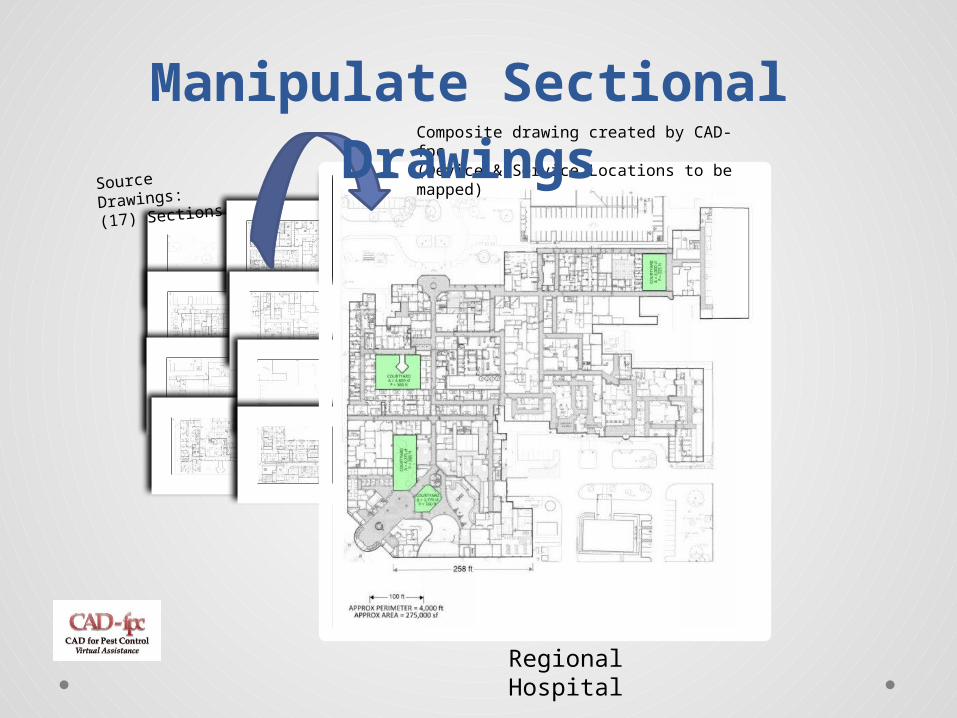
Source
Drawings:
(17) Sections
Composite drawing created by CAD-fpc(Device & Service Locations to be mapped)
Regional Hospital
Manipulate Sectional Drawings
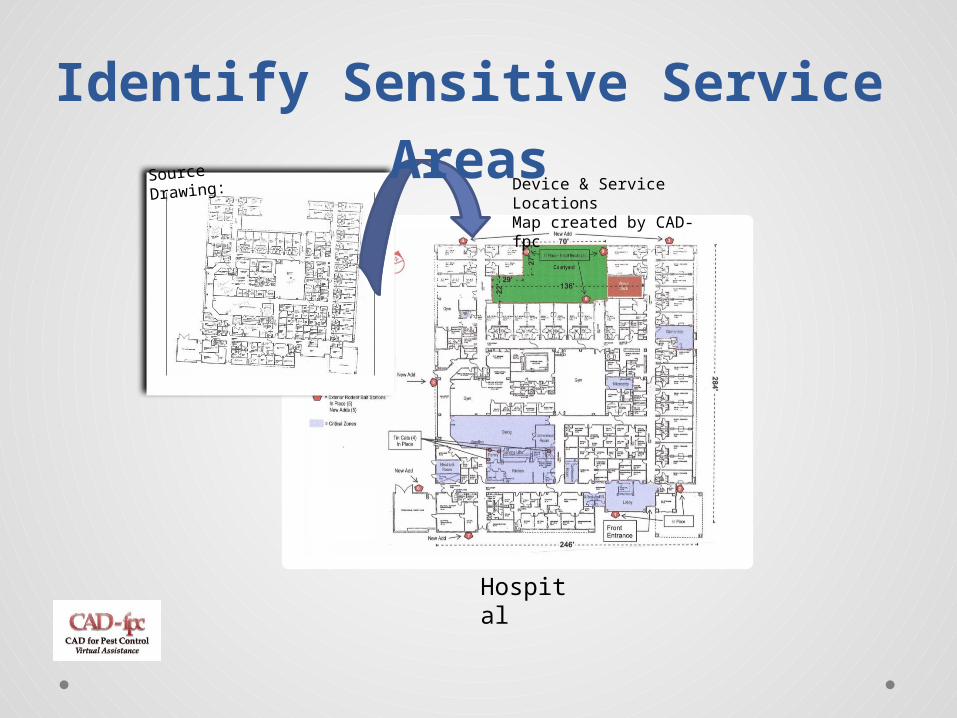
Source Drawing: Device & Service Locations Map created by CAD-fpc
Hospital
Identify Sensitive Service Areas
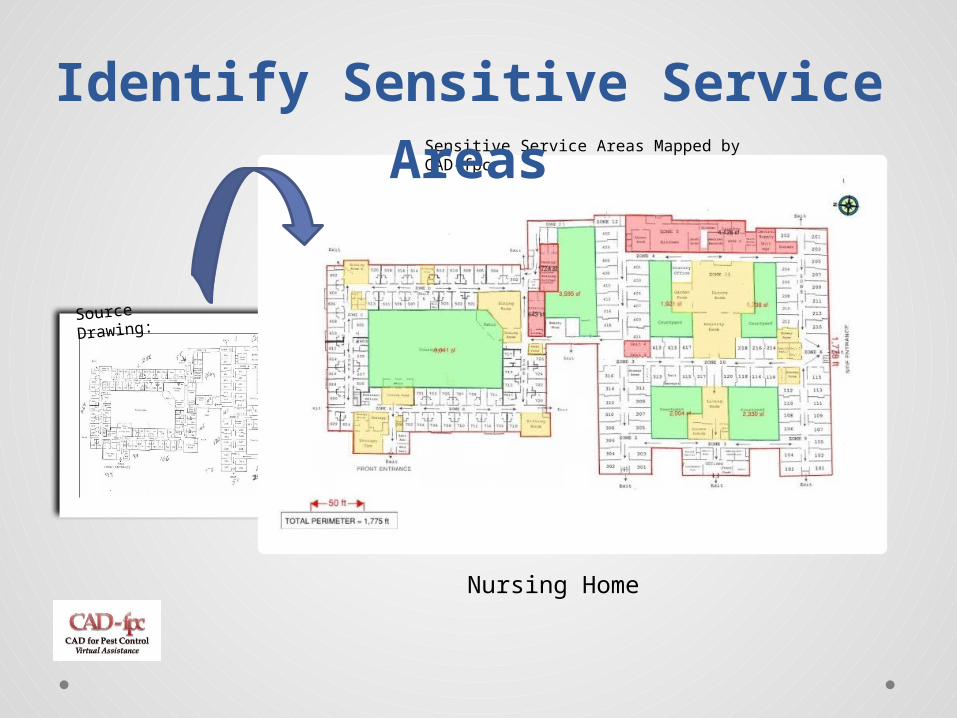
Source Drawing:
Sensitive Service Areas Mapped by CAD-fpc
Nursing Home
Identify Sensitive Service Areas

Pre-measured Site Inspection
Graphs
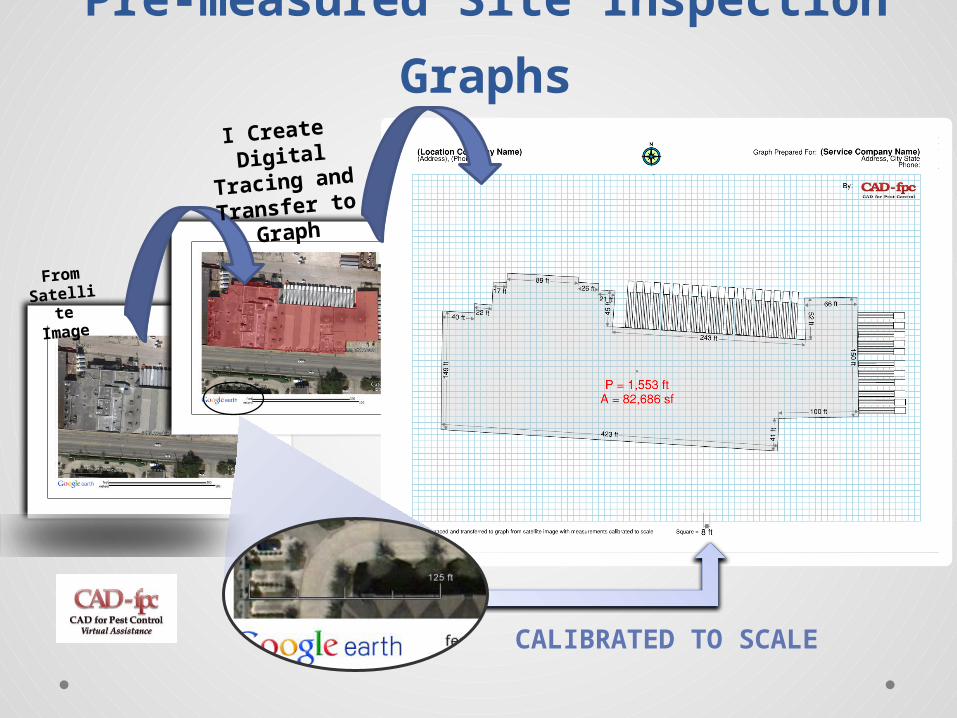
“Pre-measured Site Graphs” on the other hand, are 2D digital tracings from satellite imaging of a building or site outline only. CAD-drawn-to-scale for true perspective and then transferred to 1/4" grid templates, Graphs are intended for use as a working, on-site inspection tool with added benefits.

Pre-measured Site Inspection
Graphs
Graphs can be used: • As a valuable, time-saving tool on initial
inspection.• As an aide for drawing-in the interior floor plan
details when architectural drawings are not available.
• Accurately mapping outside bait stations.• As a sales tool to make a positive and lasting first
impression!
Pre-measured Site Inspection
Graphs
From
Satellite
Image
I Create
Digital
Tracing and
Transfer to
Graph
CALIBRATED TO SCALE
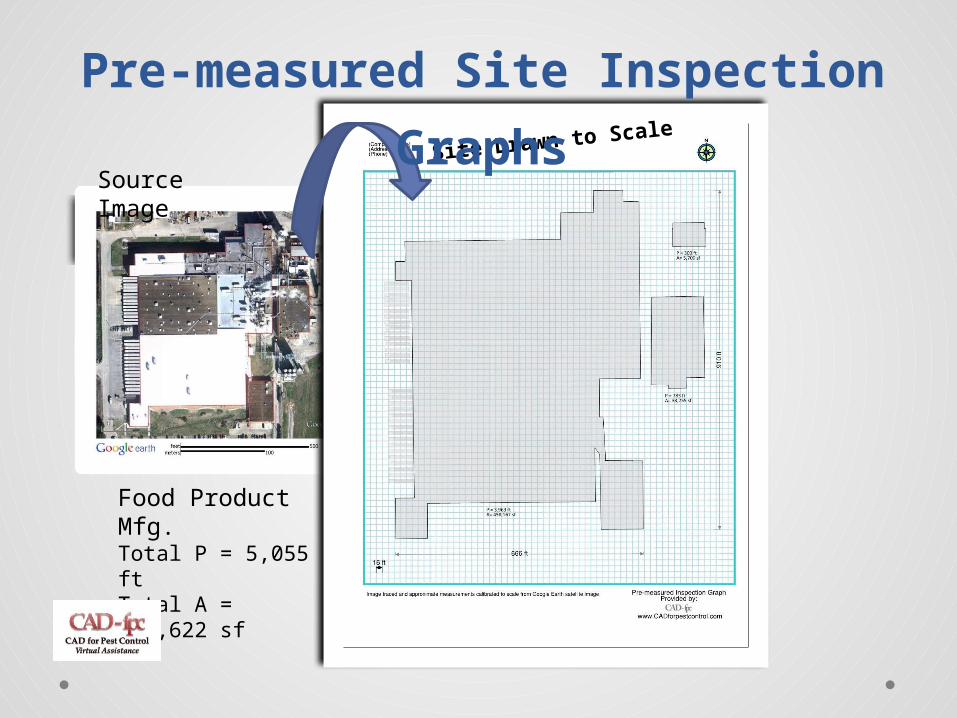
Food Product Mfg.Total P = 5,055 ftTotal A = 497,622 sf
Source Image
Site Drawn to Scale
Pre-measured Site Inspection
Graphs
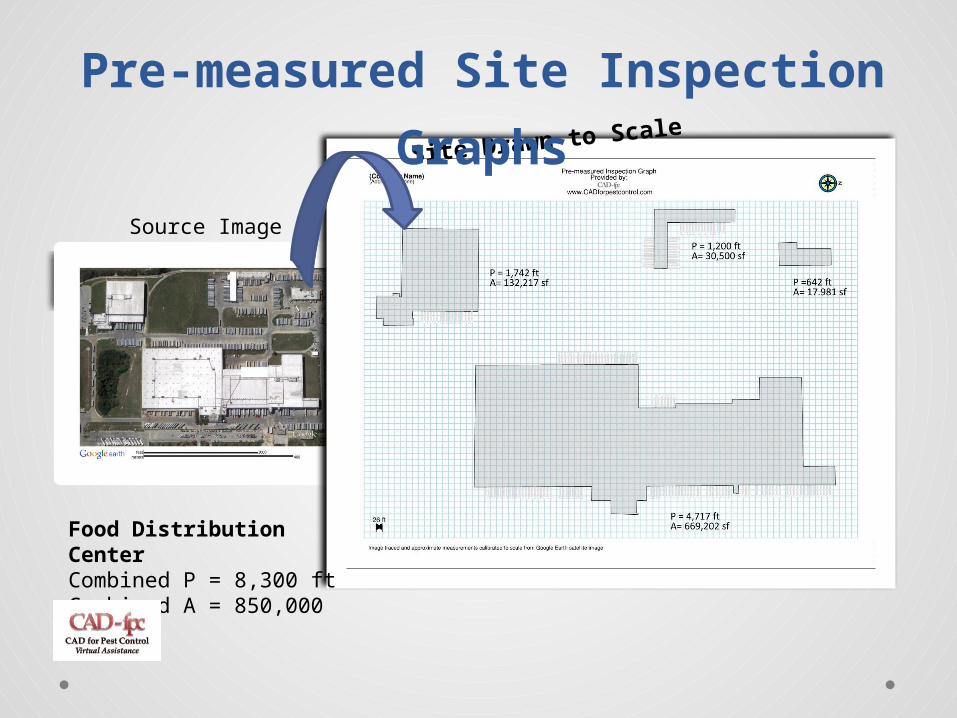
Source Image
Food Distribution CenterCombined P = 8,300 ftCombined A = 850,000 sf
Site Drawn to Scale
Pre-measured Site Inspection
Graphs
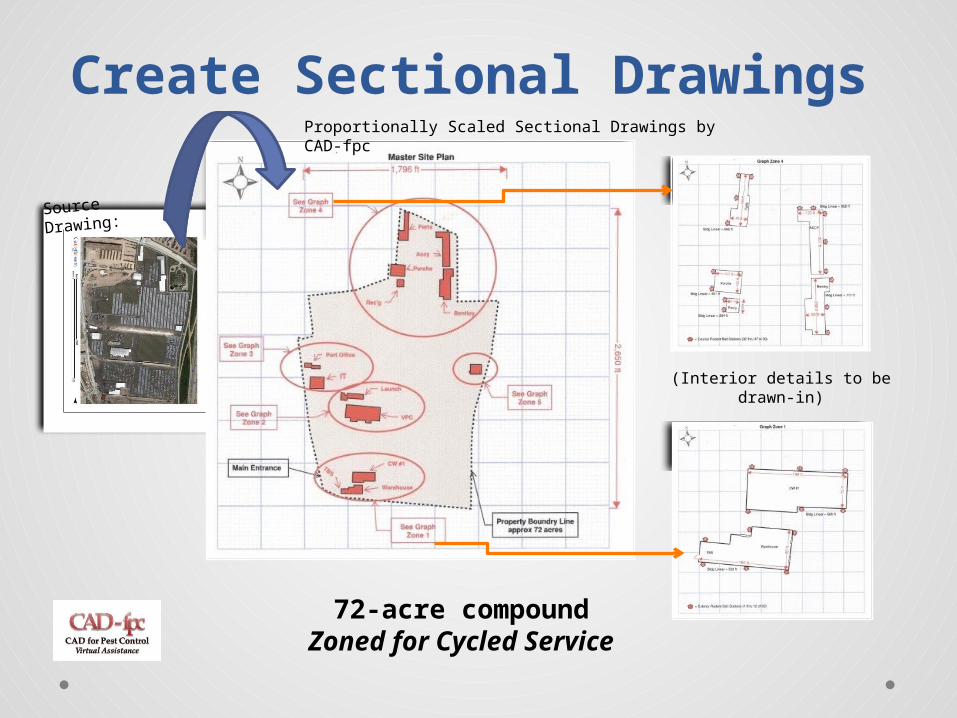
Source Drawing:
Proportionally Scaled Sectional Drawings by CAD-fpc
72-acre compoundZoned for Cycled
Service
(Interior details to be drawn-in)
Create Sectional Drawings

Jerry [email protected]
(832) 428-5790
www.cadforpestcontrol.com
Per-Project or Monthly Retainer Agreements